an investigation of the moderating influence of npd speed on the organisational integration-new...
TRANSCRIPT
Int. J. Entrepreneurship and Innovation Management, Vol. 17, Nos. 4/5/6, 2013 329
Copyright © 2013 Inderscience Enterprises Ltd.
An investigation of the moderating influence of NPD speed on the organisational integration-new product market success and NPD process proficiency-new product market success relationships
Murray R. Millson California State University Monterey Bay, School of Business, 100 Campus Center, Valley Hall (82A), Seaside, CA 93955, USA Fax: 831-582-4251 E-mail: [email protected]
Abstract: This paper examines the moderating influence of new product development (NPD) speed on the organisational integration-new product market success and the NPD process proficiency-new product market success relationships. The mail survey research approach was used to gather data from NPD managers in the electrical products, medical devices, and the heavy construction equipment industries. The data gathered from this process was used as the basis from which to extract information to address this study’s major research questions which include: 1) to what extent does NPD speed moderate the new product market success-organisational integration relationship?; 2) to what extent does NPD speed moderate the relationship between new product market success and the proficiency with which NPD process activities are performed?; 3) which moderation situation has the greatest impact on new product market success? It was confirmed that organisational integration and NPD process proficiency are significantly related to new product success. This study agreed with the research of Ittner and Larcker (1997) in that NPD speed and new product market success are not significantly related. NPD speed neither moderates the organisational integration-new product market success relationship nor the NPD process proficiency-new product success relationship. Managerial implications are provided and research directions are suggested.
Keywords: new product development proficiency; new product development speed; organisational integration; new product market success.
Reference to this paper should be made as follows: Millson, M.R. (2013) ‘An investigation of the moderating influence of NPD speed on the organisational integration-new product market success and NPD process proficiency-new product market success relationships’, Int. J. Entrepreneurship and Innovation Management, Vol. 17, Nos. 4/5/6, pp.329–351.
Biographical notes: Murray R. Millson is a Professor of Marketing at the California State University, Monterey Bay, USA. His research interests are focused on the various factors related to the development of new products, their commercialisation, and success.

330 M.R. Millson
1 Introduction
Speed associated with almost everything is of utmost importance. In 1992, Bentley (1992) notes that being first to market is exceedingly important in the majority of industries. By 2002, speed was thought to be the future new product development (NPD) paradigm (Akgün and Lynn, 2002). In 2009, Sun et al. (2009) continued to argue that the ability to speed new products to market was a key factor in a firm’s arsenal of competitive tools. In addition to NPD speed, firms need to continuously develop new products and technologies to compete in both domestic and foreign markets in order to grow and achieve financial objectives (Muldowney and Sievers, 2007; Ancona and Caldwell, 2007). Often unique, timely, and technologically sophisticated new products and processes are the keys to create market advantages (Pavlou and El Sawy, 2006; Langerak et al., 2004). Furthermore, NPD teams are integrated or co-located with other internal departments in order to attain improved new product process results (Sherman et al., 2005; Millson and Wilemon, 2002; Parry and Song, 1993; Griffin and Hauser, 1996; Gupta et al., 1986, 1985; Souder, 1988, 1980). The four factors highlighted in this research comprising NPD speed, NPD success, organisational integration, and NPD activity proficiency are the major factors studied in this paper.
In summary, the research objective of this study is to contribute to the knowledge of NPD speed, organisational integration, NPD process proficiency, and new product market success through the investigation of the following major research questions.
• To what extent does NPD speed moderate the new product market success-organisational integration relationship?
• To what extent does NPD speed moderate the relationship between new product market success and the proficiency with which NPD process activities are performed?
• Which moderation situation has the greatest impact on new product market success?
The following review of the literature notes that there is a general scarcity of research regarding the moderating relationship concerning NPD speed, organisational integration, NPD process proficiency, and new product market success. The present research helps fill this gap in the literature and describes the degree to which NPD speed moderates the influence of a firm’s degree of organisational integration on new product market success and the degree of a firm’s NPD process proficiency on new product market success.
2 Literature review and hypothesis development
This review of the literature is focused on four primary constructs which are new product market success, degree of organisational integration, degree of NPD process proficiency, and NPD speed.
An investigation of the moderating influence of NPD speed 331
2.1 New product market success
New product market success has been investigated from three major points of view that comprise new product failure, new product success, and a combination of factors that endeavour to discriminate between the success and failure of new products. Many new products launched during the 1970s and ‘80s were studied by researchers to attempt to discover why they failed (Hopkins and Bailey, 1971; Cooper, 1975; Hopkins, 1980) or succeeded (Myers and Marquis, 1969; Globe et al., 1973; Roberts and Burke, 1974). Later, researchers, through a third stream of research, sought to examine variables thought to discriminate between new product successes and failures (Dröge et al., 2008; Cooper et al., 2004; van der Panne et al., 2003; Kleinschmidt and Cooper, 1995; Parry and Song, 1994; Zirger and Maidique, 1990; Cooper, 1980; Rothwell et al., 1974). Current literature continues to centre on studying variables that can discriminate between new product successes and failures, and provide new product developers with helpful indicators that can be used to assess and monitor the success and failure associated with NPD projects.
The relationships between product success and a wide array of NPD factors have been studied. New product success, as it relates to market orientation, was recently studied by Narver et al. (2004). The primary purpose of this research was to understand how the components of market orientation are associated with new product success which was contrasted with prior studies that focused on market orientation as a single construct. Goldenberg et al. (2001) found, as Narver et al. (2004) did, that when organisations focus solely on consumers’ stated new product needs, such organisations can become exposed. Such exposure originates from a reliance on customers’ best guesses regarding new product preferences. Cooper and Kleinschmidt (1995) discovered seven major groups of attributes which portray several facets of new product projects. These researchers isolated 12 key constructs, that are proposed determinants of success, and include product advantage, synergy and market attractiveness, as well as a number of other attributes. In a recent meta analysis, Troy et al. (2008) confirmed that organisational integration is directly and significantly related to new product success. However, they also discovered that there are several additional variables that not only moderate the product success-organisational integration relationship but are controllable by management. In the group of 12 factors studied, all were found to be significant. However, NPD speed was not one of the variables investigated especially for the impact of its moderating characteristics.
Many of the foregoing researchers measured new product success using a single dimensional scale depicting the perceived success of their studies’ respondents’ new products relative to the perceived success of their respondents’ major competitors’ new products. Other researchers have used multi-dimensional scales, as well as single element scales, to assess product market success (Song and Xie, 2000; Vorhies and Morgan, 2005; Narver et al., 2004; Sivadas and Dwyer, 2000; Song and Parry, 1997; Cooper and Kleinschmidt, 1995, 1987).
The relationship between the degree of new product market success and the degree of organisational integration has been previously studied by Millson and Wilemon (2002). These researchers found that organisational integration has a significant and positive impact on new product market success over an entire NPD process. Studies related to new product market success, as it relates to the degree of organisational integration that occurs during an NPD project, have not sufficiently considered the speed associated with the development of those new products. To perform the current analysis, new product
332 M.R. Millson
market success needed to be specifically defined. There are several methods that have been used to measure new product market success. The new product market success measures employed in this research to study both significant new product successes and failures consist of four success metrics which include:
1 the degree to which a new product’s profits exceeded or fell short of what was expected
2 the degree to which sales exceeded or fell short of what was expected
3 the degree to which a new product created a product category new to the firm
4 the degree to which a new product created a market that was new to the firm.
2.2 Organisational integration
The influence of organisational integration has been significantly investigated along with the study of NPD as illustrated by the significant number of articles published in scholarly journals that focus on organisational integration as an independent or dependent variable (Souder, 1980, 1981, 1988; Griffin and Hauser, 1996; Gupta et al., 1985, 1986; Ruekert et al., 1987a, 1987b; Olsen et al., 1995; Sherman et al., 2005; Salomo et al., 2007). Organisational integration has also been conceptualised as integration between NPD teams and internal functional organisations, as noted above, as well as customers and suppliers (Koufteros et al., 2005; Petersen et al., 2003; Millson and Wilemon, 2002; Kessler et al., 2000). The current research extends knowledge concerning the relationship between organisational integration and new product market success beyond the bounds of the firm by additionally investigating relationships between NPD teams and external organisations, such as customers and suppliers. Organisational integration is viewed as comprising a variety of forms. This study investigates the notion of overall integration, which is defined as a measure of organisational integration between NPD teams and a combination of other constituencies including customers, suppliers, and internal functional support groups.
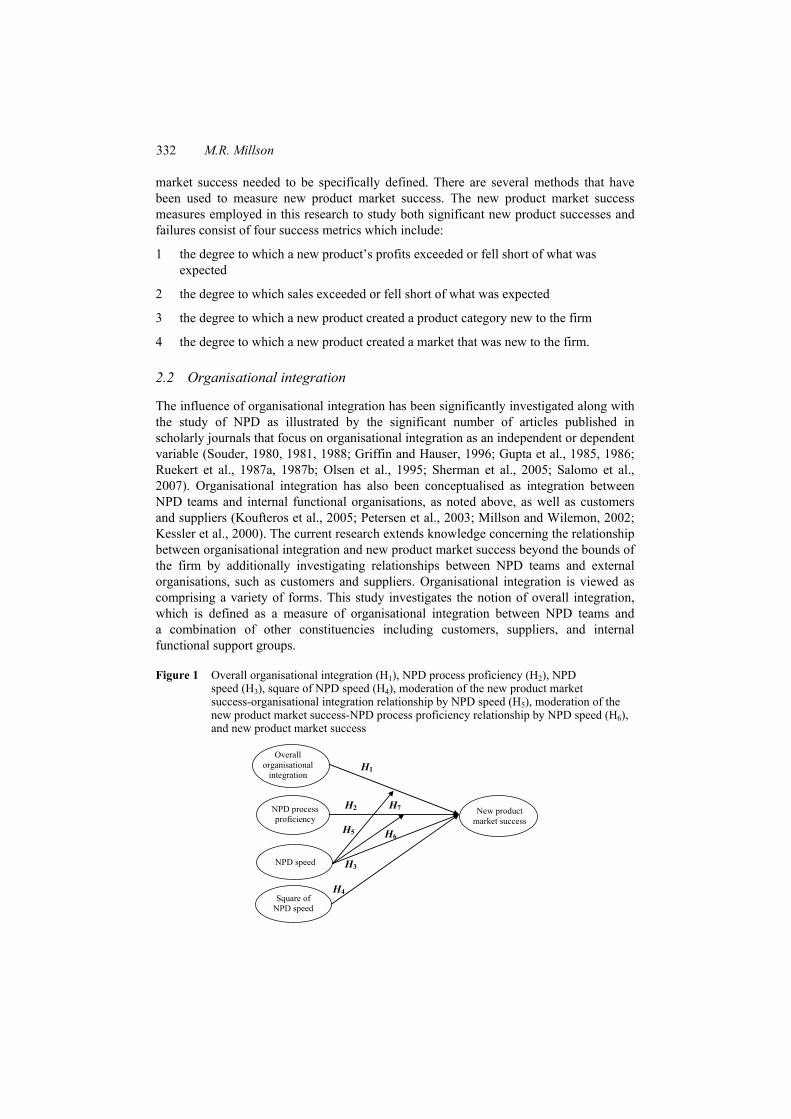
Figure 1 Overall organisational integration (H1), NPD process proficiency (H2), NPD speed (H3), square of NPD speed (H4), moderation of the new product market success-organisational integration relationship by NPD speed (H5), moderation of the new product market success-NPD process proficiency relationship by NPD speed (H6), and new product market success
H2
Overall organisational
integration
New product market success
H1
NPD process proficiency
H3NPD speed
Square of NPD speed
H4
H5 H6
H7

An investigation of the moderating influence of NPD speed 333
From the foregoing review of the literature, the following hypothesis is advanced and depicted in Figure 1.
H1 Overall organisational integration is positively related to new product market success.
2.3 NPD process activities and proficiency measurement
In 1982, an NPD strategy requirements development activity was added as the first step in the NPD process which increased the number of steps in the traditional NPD process from six to seven (Booz, Allen, and Hamilton, Inc., 1982). Idea generation, idea screening and evaluation, business analysis (financial), development (product), testing (product), and commercialisation comprised the six NPD activities previously viewed as the NPD process. Cooper and Kleinschmidt (1986) offered an updated view of the NPD process which contained a sequence of 13 activities. Those 13 activities did not include the NPD strategy requirements development step suggested by Booz, Allen, and Hamilton, Inc. (1982) nor an idea generation step but their perspective of the NPD process did include initial screening, preliminary market assessment, preliminary technical assessment, detailed market study/market research, business/financial analysis, product development, in-house product testing, customer product testing, test market/trial sell, trial production, pre-commercialisation business analysis, production start-up, and market launch. Rochford and Rudelius (1997) incorporated a 12 step NPD process in their research. This process also did not include an NPD strategy development step, as the first step of the NPD process, but did include idea generation, initial screening, preliminary market analysis, preliminary technical analysis, preliminary production analysis, preliminary financial analysis, market study, product development, in-house product testing, customer product testing, market testing, and pre-commercialisation. To this point in the evolution of the depiction of the NPD process, researchers typically studied what was done in the process (Cooper and Kleinschmidt, 1986, 1991) or the importance of the activities that were performed (Rochford and Rudelius, 1997).
The NPD process was defined by Calantone et al. (1997, p.180) as “...a set of activities ...beginning with idea generation and ending with a product launch”. These researchers collapsed a larger group of NPD activities into five groups of NPD tasks. This representation of the NPD process included pre-development marketing activities, pre-development technical activities, development-marketing activities, development-technical activities, and financial analysis. Unlike many of the researchers before them, Calantone et al. (1997) combined marketing and R&D or technical activities together to perform their research.
The NPD process was viewed as a series of six activities with the inception of the Stage-Gate System®. These six activities and their associated gates include idea generation, gate-1 (initial screen), preliminary assessment, gate-2 (second screen), detailed investigation [business case preparation], gate-3 (decision on business case), development, gate-4 (post development review), testing and validation, gate-5 (pre-commercialisation business analysis), full production and market launch, and post implementation review (Cooper, 1990, 1993). Later, Millson and Wilemon (2002) employed a set of 24 activities to represent the NPD process. These 24 activities include [pre-product development stage (ten items)] new product strategy development, identification of new product idea sources, methods for obtaining new product concepts
334 M.R. Millson
from idea sources, initial idea screening, preliminary market assessment/test idea, preliminary design assessment, preliminary manufacturability, assessment concept generation/determine ideal product, detailed market study (concept testing), business analysis, [development stage (eight items)] develop prototypes and pilot models, develop detailed pricing, promoting, and distributing strategies, in-house product testing, customer product testing, test market/trial sell, trial production, pre-launch business analysis, production start-up, [post development/commercialisation stage (six items)] market launch, new product market strategy implementation, customer satisfaction tracking, monitor product reinvention suggestions/changes, observe product usage/key to redesign, and track product maintenance/key to redesign. As noted in the previous list of activities, these researchers incorporated the NPD strategy requirements development activity, as suggested by Booz, Allen, and Hamilton, Inc. (1982), and also included a series of five activities, in addition to product launch, that were thought to occur after product launch and can influence the success of newly commercialised products. The five post-launch activities consist of new product market strategy implementation, customer satisfaction tracking, monitor product reinvention suggestions/changes, observe product usage/key to redesign, and track product maintenance/key to redesign. In an update of the Stage-Gate System®, Cooper (2008) modified the NPD process to include discovery, gate-1 (idea screen), scoping, gate-2 (second screen), build business case, gate-3 (go to development), development, gate-4 (go to testing), testing and validation, gate-5 (go to launch), launch, post launch review.
From this review of the literature, the following hypothesis is offered and portrayed in Figure 1.
H2 NPD process proficiency is positively related to new product market success.
2.4 NPD speed
Moving new products to market more rapidly by reducing NPD cycle times that will result in generating profits earlier has been a major goal for many firms (Langerak and Hultink, 2006; Ittner and Larcker, 1997). The acceleration of the NPD process has been significantly studied as have many other factors associated with the development of new products (Millson et al., 1992; Langerak et al., 2010; Langerak and Hultink, 2006, 2005; Calantone et al., 2003; Petersen et al., 2003; Zirger and Hartley 1996; Kessler and Bierly, 2002). In their study of new product success determinants, Kessler and Bierly (2002) found that NPD speed was the most critical factor. It is emphasised by these researchers that the ability to meet a project’s time schedules is crucial to NPD success. These researchers measured speed on a 13-point scale where respondents subjectively provided information indicating whether a project was either a certain percentage below or a certain percentage above a project’s time goal. These data were obtained from ten large, US firms and represented 86 new development projects.
More recently, Langerak and Hultink (2006) discovered that product development speed exhibited an inverted U-shaped association with new product profitability in a study of 233 industrial products developed in the Netherlands. These researchers employed a five-point, two element, subjective scale that asked respondents to compare the product being reported to a similar product that their firm developed in the past on scale one and a similar competitive product on scale two. Langerak and Hultink (2006) also pointed out that the new product type, such as product improvements or line

An investigation of the moderating influence of NPD speed 335
extensions, influences the location of the apex of the curve. It has been suggested by Kessler and Bierly (2002) that there is a limit to which NPD speed can increase the success of newly developed products. It is important to point out that Langerak and Hultink (2006) also suggest a strong direct, linear association between new product profitability and NPD speed, and that NPD speed is positively related to new product success is strongly suggested in both studies.
The majority of studies regarding NPD speed have focused on NPD projects in organisations such as product manufacturers and R&D laboratories. However, there has been little attention paid to whether NPD speed or time-to-market measures have a significant impact on new product market success in other types of industries. Calantone et al. (2003) studied four diverse industries and received 461 survey instruments from a sampling frame of 3,094 firms in which a single new project was described by each survey instrument. These researchers measured NPD speed using a subjective, nine element, seven-point Likert-type scale. Furthermore, Ittner and Larcker (1997) found that NPD speed/cycle time did not appear to have a direct impact on organisational performance as measured by pre-tax return on assets, pre-tax return on sales, sales growth, and perceived overall performance. These researchers studied 184 firms in two industries comprising the automotive and computer industries. Ittner and Larcker (1997) employed objective NPD cycle time measures which were modified in an effort to eliminate the idiosyncratic impact of individual projects which exhibit naturally occurring cycle time differences.
The association between NPD speed and organisational integration has been examined by only a few researchers. Petersen et al. (2003) studied the association between NPD speed and organisational integration with a focus on NPD material suppliers. It was found by these authors that project outcomes exemplified by the degree of overall satisfaction with the performance of each project and the achievement of established project goals was significantly associated with a supplier’s involvement or integration with an NPD project. In an analysis of 220 newly developed products, Datar et al. (1996) found that speed to market was enhanced when new product design input was provided by no more than 25 customers and new product developers were organised in a distributed manner. These researchers found that the positive slope of this relationship increased as an organisation’s structure became more distributed. Although studies have been performed that focus on the NPD speed-organisational integration relationship and incorporate suppliers and customers, there are few studies that focus on organisational integration within new product developing organisations and the speed with which they develop new products.
Based on this body of research, the following hypotheses are presented and depicted in Figure 1.
H3 NPD speed is positively associated with new product market success.
H4 The square of NPD speed forms an inverted U-shaped relationship with new product market success.
2.5 Moderating characteristics of NPD speed
Relevant descriptions of moderating variables are provided by Baron and Kenny (1986) and Hair et al. (2010). Moderating variables interrelate with other variables as antecedents. Baron and Kenny (1986, p.1174) note that “…moderator variables always

336 M.R. Millson
function as independent variables”. Baron and Kenny (1986) also make clear that predictor variables impact criterion/dependent variables, moderating variables impact criterion/dependent variables, and the interaction of predictor and moderator variables impact criterion/dependent variables simultaneously. Importantly, these researchers point out that a moderation hypothesis is supported when the interaction term is significantly related to the criterion/dependent variable. Furthermore, the main effects for the predictor and/or the moderator variables may also be significant however these paths are not directly relevant conceptually to testing a moderation hypothesis. However, these authors also draw attention to the desirability for moderator variables to be uncorrelated with both predictor, and criterion/dependent variables to provide a clearer interpretation of the impact of the interaction term.
The following hypotheses are proposed based on this review of the literature and depicted in Figure 1.
H5 NPD speed positively moderates the new product market success-overall organisational integration relationship.
H6 NPD speed negatively moderates the new product market success-NPD process proficiency relationship.
H7 The degree of moderation by NPD speed on the new product market success-NPD process proficiency relationship is greater than the degree of moderation by NPD speed on the new product market success-overall organisational integration relationship.
3 Research methods
3.1 Measurement of variables
3.1.1 New product market success
The market success of new products has been measured in several ways (Sivadas and Dwyer, 2000; Cooper and Kleinschmidt, 1987). New product market success is appraised in this study by four previously used measures of new product market success. New product market success is measured in this research to study both significant new product successes and failures using a scale comprised of the following four scale elements :
1 the degree to which a new product’s profits exceeded or fell short of what was expected
2 the degree to which sales exceeded or fell short of what was expected
3 the degree to which a new product created a product category new to the firm
4 the degree to which a new product created a market that was new to the firm.
The four components of the NPD success scale include these four seven-point scale elements.
The use of subjective success scales has often been demonstrated to be valid and useful (Song and Xie, 2000). These researchers offer a compelling case for the use of subjective scales. They point out that such instruments can effectively capture the
An investigation of the moderating influence of NPD speed 337
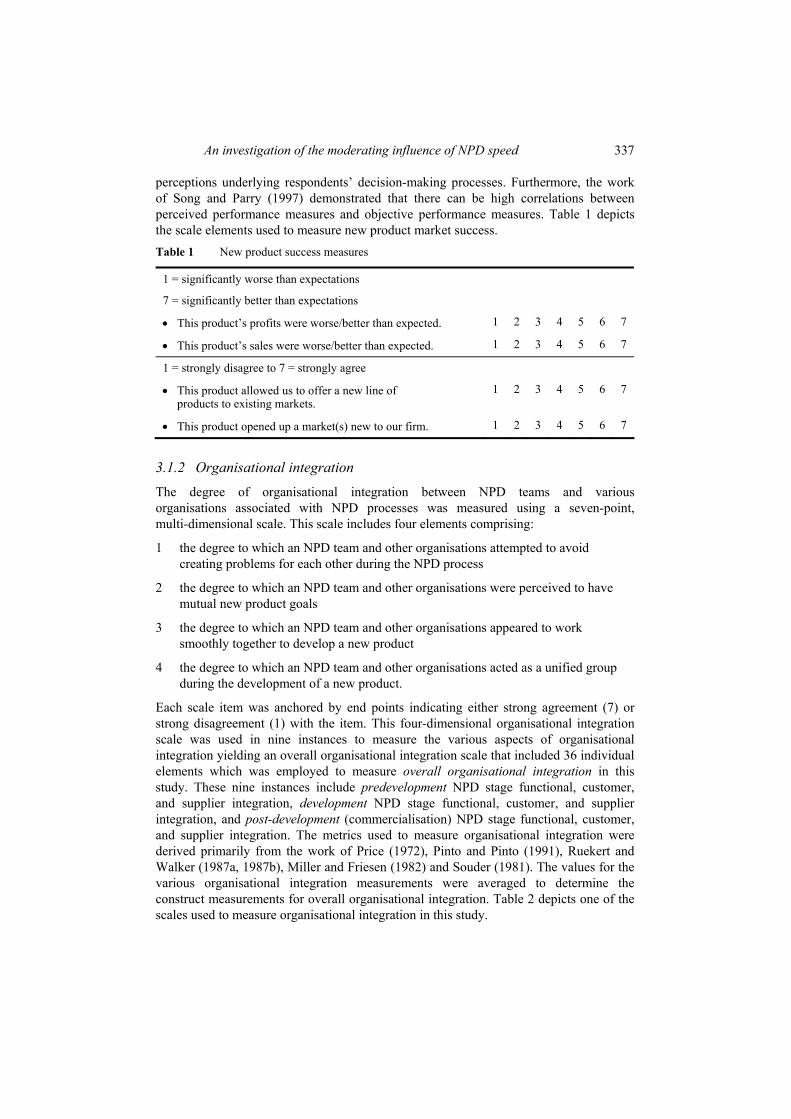
perceptions underlying respondents’ decision-making processes. Furthermore, the work of Song and Parry (1997) demonstrated that there can be high correlations between perceived performance measures and objective performance measures. Table 1 depicts the scale elements used to measure new product market success. Table 1 New product success measures
1 = significantly worse than expectations
7 = significantly better than expectations
• This product’s profits were worse/better than expected. 1 2 3 4 5 6 7
• This product’s sales were worse/better than expected. 1 2 3 4 5 6 7
1 = strongly disagree to 7 = strongly agree
• This product allowed us to offer a new line of products to existing markets.
1 2 3 4 5 6 7
• This product opened up a market(s) new to our firm. 1 2 3 4 5 6 7
3.1.2 Organisational integration
The degree of organisational integration between NPD teams and various organisations associated with NPD processes was measured using a seven-point, multi-dimensional scale. This scale includes four elements comprising:
1 the degree to which an NPD team and other organisations attempted to avoid creating problems for each other during the NPD process
2 the degree to which an NPD team and other organisations were perceived to have mutual new product goals
3 the degree to which an NPD team and other organisations appeared to work smoothly together to develop a new product
4 the degree to which an NPD team and other organisations acted as a unified group during the development of a new product.
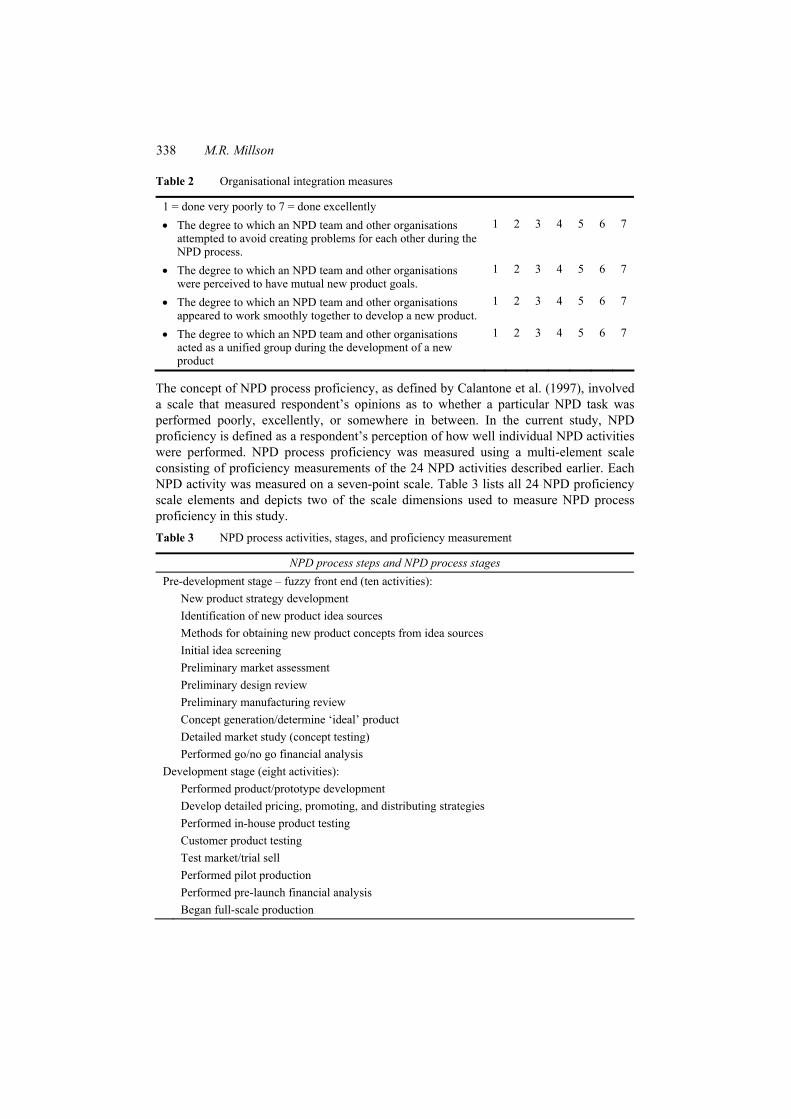
Each scale item was anchored by end points indicating either strong agreement (7) or strong disagreement (1) with the item. This four-dimensional organisational integration scale was used in nine instances to measure the various aspects of organisational integration yielding an overall organisational integration scale that included 36 individual elements which was employed to measure overall organisational integration in this study. These nine instances include predevelopment NPD stage functional, customer, and supplier integration, development NPD stage functional, customer, and supplier integration, and post-development (commercialisation) NPD stage functional, customer, and supplier integration. The metrics used to measure organisational integration were derived primarily from the work of Price (1972), Pinto and Pinto (1991), Ruekert and Walker (1987a, 1987b), Miller and Friesen (1982) and Souder (1981). The values for the various organisational integration measurements were averaged to determine the construct measurements for overall organisational integration. Table 2 depicts one of the scales used to measure organisational integration in this study.
338 M.R. Millson
Table 2 Organisational integration measures
1 = done very poorly to 7 = done excellently • The degree to which an NPD team and other organisations
attempted to avoid creating problems for each other during the NPD process.
1 2 3 4 5 6 7
• The degree to which an NPD team and other organisations were perceived to have mutual new product goals.
1 2 3 4 5 6 7
• The degree to which an NPD team and other organisations appeared to work smoothly together to develop a new product.
1 2 3 4 5 6 7
• The degree to which an NPD team and other organisations acted as a unified group during the development of a new product
1 2 3 4 5 6 7
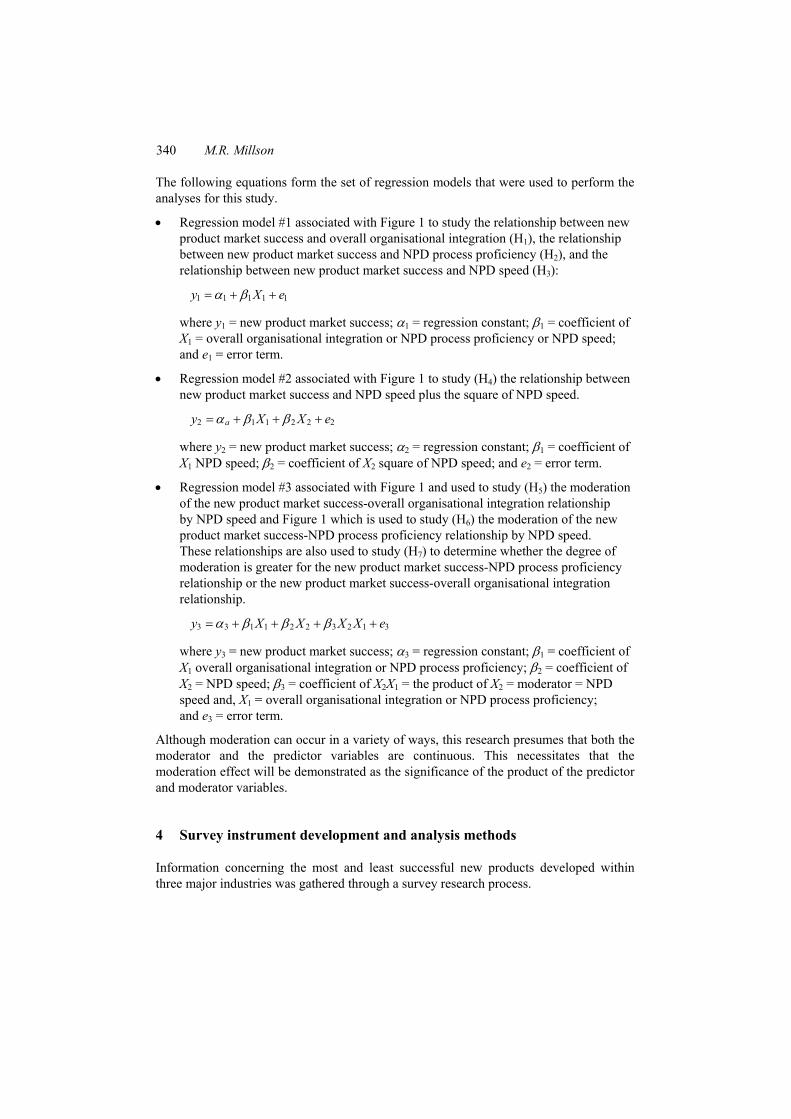
The concept of NPD process proficiency, as defined by Calantone et al. (1997), involved a scale that measured respondent’s opinions as to whether a particular NPD task was performed poorly, excellently, or somewhere in between. In the current study, NPD proficiency is defined as a respondent’s perception of how well individual NPD activities were performed. NPD process proficiency was measured using a multi-element scale consisting of proficiency measurements of the 24 NPD activities described earlier. Each NPD activity was measured on a seven-point scale. Table 3 lists all 24 NPD proficiency scale elements and depicts two of the scale dimensions used to measure NPD process proficiency in this study. Table 3 NPD process activities, stages, and proficiency measurement
NPD process steps and NPD process stages Pre-development stage – fuzzy front end (ten activities): New product strategy development Identification of new product idea sources Methods for obtaining new product concepts from idea sources Initial idea screening Preliminary market assessment Preliminary design review Preliminary manufacturing review Concept generation/determine ‘ideal’ product Detailed market study (concept testing) Performed go/no go financial analysis Development stage (eight activities): Performed product/prototype development Develop detailed pricing, promoting, and distributing strategies Performed in-house product testing Customer product testing Test market/trial sell Performed pilot production Performed pre-launch financial analysis Began full-scale production

An investigation of the moderating influence of NPD speed 339
Table 3 NPD process activities, stages, and proficiency measurement (continued)
NPD process steps and NPD process stages Post development stage (six activities): Market launch New product market strategy implementation Customer satisfaction tracking Monitor product reinvention suggestions/changes Observe product usage/key to redesign Track product maintenance/key to redesign
Examples of two NPD proficiency scales from the most successful product instrument Indicate how well each NPD task was performed during the development of your firm’s most successful new product by circling a number from 1 to 7 on the scale to the right of each statement. Place an ‘x’ on the line to the right of the scale if the task was not performed at all. 1 = done very poorly to 7 = done excellently Performed a preliminary market assessment. 1 2 3 4 5 6 7 ___ Performed product development of prototypes or pilot models. 1 2 3 4 5 6 7 ___
3.1.3 NPD speed as a moderator
The NPD speed of each NPD project reported in this research was measured by calculating the inverse of the length of time it took for each new product project to be performed as provided by each respondent to this study. To perform the investigation regarding the potential moderating influence of NPD speed on the organisational integration-new product market success relationship and on the NPD process proficiency-new product market success relationship, factors were incorporated into the research regression models which were formed by multiplying the NPD speed construct measurements by the organisational integration construct measurements and by multiplying the NPD speed construct measurements by the NPD process proficiency construct measurements. The interaction/moderator variables were created by multiplying the average measurements of the overall organisational integration measures by the associated NPD speed measurements and by multiplying the average measurements of the NPD process proficiency measures by the associated NPD speed measurements.
The research processes of Baron and Kenny (1986) were used to support this research. Baron and Kenny (1986, p.1174) note that:
“In general terms, a moderator is a qualitative (e.g., sex, race, class) or quantitative (e.g., level of reward) variable that affects the direction and/or strength of the relation between an independent or predictor variable and a dependent or criterion variable. Specifically within a correlational analysis framework, a moderator is a third variable that affects the zero-order correlation between two other variables…A moderator effect within a correlational framework may also be said to occur where the direction of the correlation changes...In the more familiar analysis of variance (ANOVA) terms, a basic moderator effect can be represented as an interaction between a focal independent variable and a factor that specifies the appropriate conditions for its operation…A moderator-interaction effect also would be said to occur if a relation is substantially reduced instead of being reversed…”
340 M.R. Millson
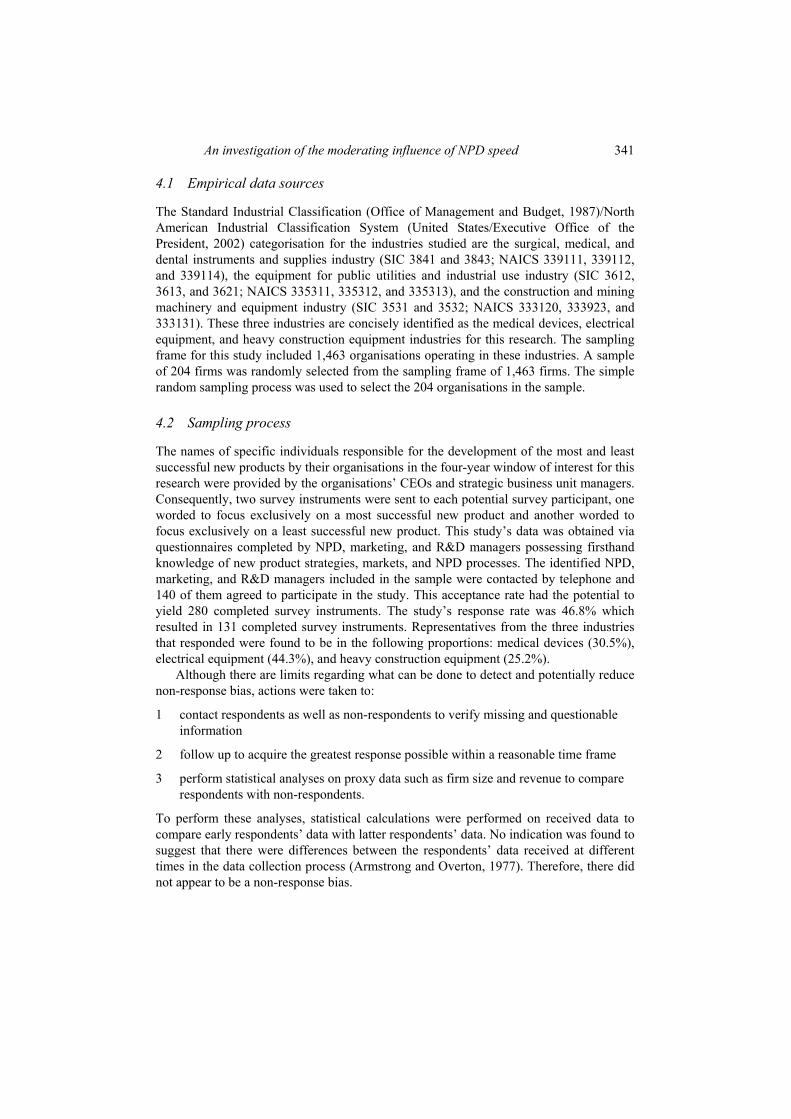
The following equations form the set of regression models that were used to perform the analyses for this study.
• Regression model #1 associated with Figure 1 to study the relationship between new product market success and overall organisational integration (H1), the relationship between new product market success and NPD process proficiency (H2), and the relationship between new product market success and NPD speed (H3):
1 1 1 1 1y X e= + +α β
where y1 = new product market success; α1 = regression constant; β1 = coefficient of X1 = overall organisational integration or NPD process proficiency or NPD speed; and e1 = error term.
• Regression model #2 associated with Figure 1 to study (H4) the relationship between new product market success and NPD speed plus the square of NPD speed.
2 1 1 2 2 2ay X X e= + + +α β β
where y2 = new product market success; α2 = regression constant; β1 = coefficient of X1 NPD speed; β2 = coefficient of X2 square of NPD speed; and e2 = error term.
• Regression model #3 associated with Figure 1 and used to study (H5) the moderation of the new product market success-overall organisational integration relationship by NPD speed and Figure 1 which is used to study (H6) the moderation of the new product market success-NPD process proficiency relationship by NPD speed. These relationships are also used to study (H7) to determine whether the degree of moderation is greater for the new product market success-NPD process proficiency relationship or the new product market success-overall organisational integration relationship.
3 3 1 1 2 2 3 2 1 3y X X X X e= + + + +α β β β
where y3 = new product market success; α3 = regression constant; β1 = coefficient of X1 overall organisational integration or NPD process proficiency; β2 = coefficient of X2 = NPD speed; β3 = coefficient of X2X1 = the product of X2 = moderator = NPD speed and, X1 = overall organisational integration or NPD process proficiency; and e3 = error term.
Although moderation can occur in a variety of ways, this research presumes that both the moderator and the predictor variables are continuous. This necessitates that the moderation effect will be demonstrated as the significance of the product of the predictor and moderator variables.
4 Survey instrument development and analysis methods
Information concerning the most and least successful new products developed within three major industries was gathered through a survey research process.
An investigation of the moderating influence of NPD speed 341
4.1 Empirical data sources
The Standard Industrial Classification (Office of Management and Budget, 1987)/North American Industrial Classification System (United States/Executive Office of the President, 2002) categorisation for the industries studied are the surgical, medical, and dental instruments and supplies industry (SIC 3841 and 3843; NAICS 339111, 339112, and 339114), the equipment for public utilities and industrial use industry (SIC 3612, 3613, and 3621; NAICS 335311, 335312, and 335313), and the construction and mining machinery and equipment industry (SIC 3531 and 3532; NAICS 333120, 333923, and 333131). These three industries are concisely identified as the medical devices, electrical equipment, and heavy construction equipment industries for this research. The sampling frame for this study included 1,463 organisations operating in these industries. A sample of 204 firms was randomly selected from the sampling frame of 1,463 firms. The simple random sampling process was used to select the 204 organisations in the sample.
4.2 Sampling process
The names of specific individuals responsible for the development of the most and least successful new products by their organisations in the four-year window of interest for this research were provided by the organisations’ CEOs and strategic business unit managers. Consequently, two survey instruments were sent to each potential survey participant, one worded to focus exclusively on a most successful new product and another worded to focus exclusively on a least successful new product. This study’s data was obtained via questionnaires completed by NPD, marketing, and R&D managers possessing firsthand knowledge of new product strategies, markets, and NPD processes. The identified NPD, marketing, and R&D managers included in the sample were contacted by telephone and 140 of them agreed to participate in the study. This acceptance rate had the potential to yield 280 completed survey instruments. The study’s response rate was 46.8% which resulted in 131 completed survey instruments. Representatives from the three industries that responded were found to be in the following proportions: medical devices (30.5%), electrical equipment (44.3%), and heavy construction equipment (25.2%).
Although there are limits regarding what can be done to detect and potentially reduce non-response bias, actions were taken to:
1 contact respondents as well as non-respondents to verify missing and questionable information
2 follow up to acquire the greatest response possible within a reasonable time frame
3 perform statistical analyses on proxy data such as firm size and revenue to compare respondents with non-respondents.
To perform these analyses, statistical calculations were performed on received data to compare early respondents’ data with latter respondents’ data. No indication was found to suggest that there were differences between the respondents’ data received at different times in the data collection process (Armstrong and Overton, 1977). Therefore, there did not appear to be a non-response bias.
342 M.R. Millson
5 Findings
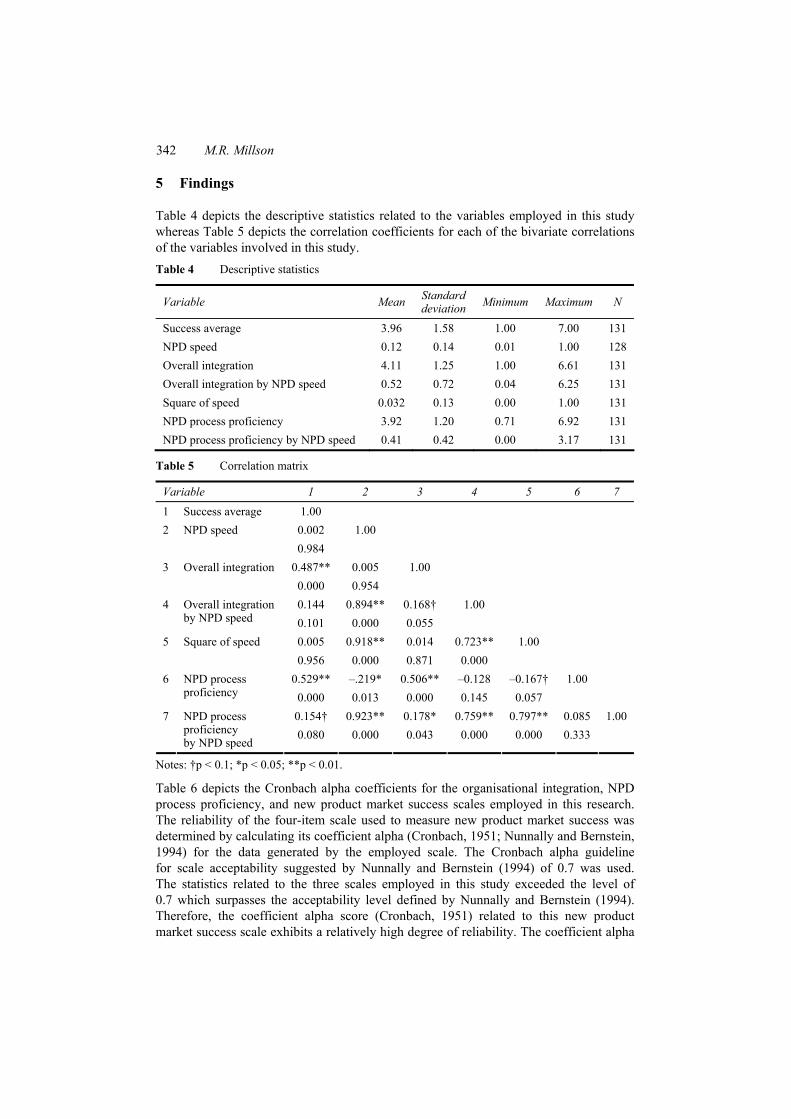
Table 4 depicts the descriptive statistics related to the variables employed in this study whereas Table 5 depicts the correlation coefficients for each of the bivariate correlations of the variables involved in this study. Table 4 Descriptive statistics
Variable Mean Standarddeviation Minimum Maximum N
Success average 3.96 1.58 1.00 7.00 131 NPD speed 0.12 0.14 0.01 1.00 128 Overall integration 4.11 1.25 1.00 6.61 131 Overall integration by NPD speed 0.52 0.72 0.04 6.25 131 Square of speed 0.032 0.13 0.00 1.00 131 NPD process proficiency 3.92 1.20 0.71 6.92 131 NPD process proficiency by NPD speed 0.41 0.42 0.00 3.17 131
Table 5 Correlation matrix
Variable 1 2 3 4 5 6 7
1 Success average 1.00 2 NPD speed 0.002 1.00 0.984 3 Overall integration 0.487** 0.005 1.00 0.000 0.954 4 0.144 0.894** 0.168† 1.00
Overall integration by NPD speed 0.101 0.000 0.055
5 Square of speed 0.005 0.918** 0.014 0.723** 1.00 0.956 0.000 0.871 0.000 6 0.529** –.219* 0.506** –0.128 –0.167† 1.00
NPD process proficiency 0.000 0.013 0.000 0.145 0.057
7 0.154† 0.923** 0.178* 0.759** 0.797** 0.085 1.00
NPD process proficiency by NPD speed
0.080 0.000 0.043 0.000 0.000 0.333
Notes: †p < 0.1; *p < 0.05; **p < 0.01.
Table 6 depicts the Cronbach alpha coefficients for the organisational integration, NPD process proficiency, and new product market success scales employed in this research. The reliability of the four-item scale used to measure new product market success was determined by calculating its coefficient alpha (Cronbach, 1951; Nunnally and Bernstein, 1994) for the data generated by the employed scale. The Cronbach alpha guideline for scale acceptability suggested by Nunnally and Bernstein (1994) of 0.7 was used. The statistics related to the three scales employed in this study exceeded the level of 0.7 which surpasses the acceptability level defined by Nunnally and Bernstein (1994). Therefore, the coefficient alpha score (Cronbach, 1951) related to this new product market success scale exhibits a relatively high degree of reliability. The coefficient alpha

An investigation of the moderating influence of NPD speed 343
score associated with new product market success was found to be 0.766. The reliability of the four-element scales used to measure organisational integration also exhibited a high degree of reliability. It was found to be 0.969. Moreover, the reliability of the 24-element scale used to measure NPD process proficiency was found to exhibit a high degree of reliability. It was found to be 0.909. Table 6 Cronbach alpha coefficients
Variable Cronbach alphas
Overall organisational integration 0.969 NPD process proficiency 0.909 New product market success 0.766
The study data confirmed that overall organisational integration (H1) and NPD process proficiency (H2) are significantly and positively related to new product market success. However, this study’s data did not support a linear relationship between NPD speed and new product market success [H3 (NPD speed is positively associated with new product market success)]. This finding is contrary to those of Kessler and Bierly (2002), Calantone et al. (2003) and Langerak and Hultink (2006) but in agreement with the findings of Ittner and Larcker (1997). This study’s findings associated with the following hypotheses are depicted in Table 7.
H1 Overall organisational integration is positively related to new product market success.
H2 NPD process proficiency is positively related to new product market success.
H3 NPD speed is positively associated with new product market success.
Table 7 Overall organisational integration-new product market success relationship (H1); NPD process proficiency-new product market success relationship (H2); and NPD speed-new product market success relationship (H3)
Independent variables F statistic p-value t statistic p-value Standardised beta
New product market success 40.091 0.000** Overall organisational integration 6.332 0.000** 0.487
New product market success 50.119 0.000** NPD process proficiency 7.080 0.000** 0.529
New product market success 0.00 0.984 NPD speed 0.021 0.984 0.002
Notes: †p < 0.1; *p < 0.05; **p < 0.01.
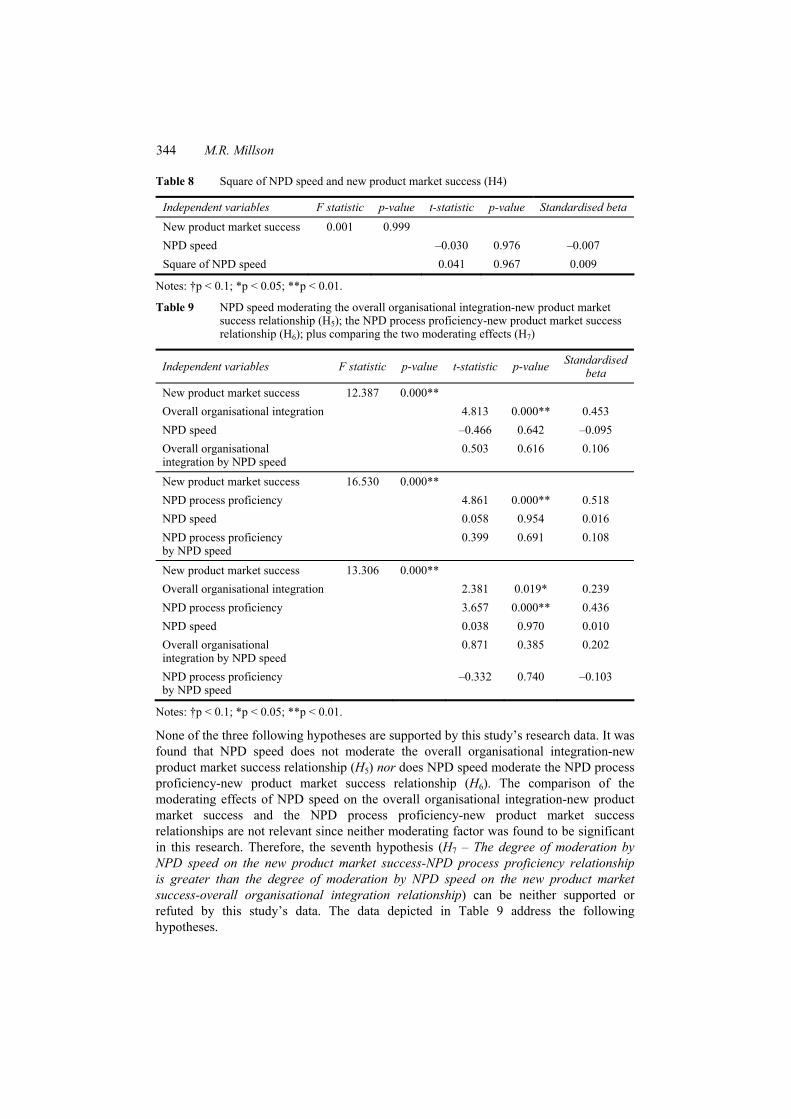
This research data does not support the hypothesis that there exists an inverted U-shaped relationship between the square of NPD speed and new product market success. Therefore, the following hypothesis was not supported by this study’s data. The data depicted in Table 8 relates to the following hypothesis.
H4 The square of NPD speed forms an inverted U relationship with new product market success.
344 M.R. Millson
Table 8 Square of NPD speed and new product market success (H4)
Independent variables F statistic p-value t-statistic p-value Standardised beta
New product market success 0.001 0.999 NPD speed –0.030 0.976 –0.007 Square of NPD speed 0.041 0.967 0.009
Notes: †p < 0.1; *p < 0.05; **p < 0.01.
Table 9 NPD speed moderating the overall organisational integration-new product market success relationship (H5); the NPD process proficiency-new product market success relationship (H6); plus comparing the two moderating effects (H7)
Independent variables F statistic p-value t-statistic p-value Standardised beta
New product market success 12.387 0.000** Overall organisational integration 4.813 0.000** 0.453 NPD speed –0.466 0.642 –0.095 Overall organisational integration by NPD speed
0.503 0.616 0.106
New product market success 16.530 0.000** NPD process proficiency 4.861 0.000** 0.518 NPD speed 0.058 0.954 0.016 NPD process proficiency by NPD speed
0.399 0.691 0.108
New product market success 13.306 0.000** Overall organisational integration 2.381 0.019* 0.239 NPD process proficiency 3.657 0.000** 0.436 NPD speed 0.038 0.970 0.010 Overall organisational integration by NPD speed
0.871 0.385 0.202
NPD process proficiency by NPD speed
–0.332 0.740 –0.103
Notes: †p < 0.1; *p < 0.05; **p < 0.01.
None of the three following hypotheses are supported by this study’s research data. It was found that NPD speed does not moderate the overall organisational integration-new product market success relationship (H5) nor does NPD speed moderate the NPD process proficiency-new product market success relationship (H6). The comparison of the moderating effects of NPD speed on the overall organisational integration-new product market success and the NPD process proficiency-new product market success relationships are not relevant since neither moderating factor was found to be significant in this research. Therefore, the seventh hypothesis (H7 – The degree of moderation by NPD speed on the new product market success-NPD process proficiency relationship is greater than the degree of moderation by NPD speed on the new product market success-overall organisational integration relationship) can be neither supported or refuted by this study’s data. The data depicted in Table 9 address the following hypotheses.

An investigation of the moderating influence of NPD speed 345
H5 NPD speed positively moderates the new product market success-overall organisational integration relationship.
H6 NPD speed negatively moderates the new product market success-NPD process proficiency relationship.
H7 The degree of moderation by NPD speed on the new product market success-NPD process proficiency relationship is greater than the degree of moderation by NPD speed on the new product market success-overall organisational integration relationship.
6 Implications for NPD
Salient previous studies have pointed to several factors that influence the market success of newly developed products (Dröge et al., 2008; Calantone et al., 2006; Song and Xie, 2000; Kleinschmidt and Cooper, 1991). Additional research suggests that organisational integration can have a major impact on new product market success (Sherman et al., 2005; Millson and Wilemon, 2002; Griffin and Hauser, 1996; Gupta et al., 1986, 1985; Souder, 1988, 1980). Moreover, other researchers (Langerak and Hultink, 2006, 2005; Calantone et al., 2003; Petersen et al., 2003; Kessler and Bierly, 2002; Ittner and Larcker, 1997; Zirger and Hartley, 1996) have studied the influence that NPD speed has on new product success. However, studies that investigate the moderating properties of NPD speed are exceptionally rare.
Therefore, the initial set of findings of this study confirmed that organisational integration impacts in a positive way the market success of new products as does NPD process proficiency. In this study, overall organisational integration was investigated which comprises the integration of NPD teams with customers, suppliers, and other organisational functional groups. The confirmation of these findings in conjunction with the meta-analytic findings of Troy et al. (2008) informs new product developers that not only does organisational integration positively influence new product market success but the relationship between organisational integration and new product market success is also primarily influenced by the integration of two organisations, which specifically include marketing and R&D, as opposed to the integration of more than two corporate organisations to achieve the most successful NPD results. These findings confirm and imply that new product developers in the studied industries should integrate marketing and R&D over the entirety of the NPD process. It has also been found in several studies that NPD process proficiency is significantly and positively related to new product market success. The confirmation of these two findings in the electrical equipment, medical devices, and heavy construction equipment industries suggest that managers who develop new products in these three industries can expect that new product market success will increase with enhancements in the proficiency with which NPD processes are performed and/or the degree to which functional internal organisational departments, customers, and suppliers are integrated with NPD teams during the development of new products.
The second major finding of this study is that both NPD speed and the square of NPD speed are not related to new product market success. However, it has been found that important variables such as product innovativeness are significantly related to new product success in the form of an inverted U (Langerak and Hultink, 2006). In the case of
346 M.R. Millson
product innovativeness, the Langerak and Hultink (2006) study proposes that a large degree of product innovativeness has a negative impact on new product success. Nevertheless, the current study’s data, unlike the research of Langerak and Hultink (2006), suggests that the association between NPD speed and new product market success in the three industries studied does not form an inverted U-shaped relationship. Therefore, the results from this research inform us that new product market success is not at all influenced by either NPD speed or the square of NPD speed. In this instance, this is not surprising since this study’s data is in agreement with that of Ittner and Larcker (1997) who also found no significant association between NPD speed and new product market success. Therefore, this study’s data suggest that new product developers can obtain greater new product success by increasing NPD speed without consideration of negative consequences on new product market success in the three industries studied. Additionally, these findings imply that in the industries studied new product developers should assume that NPD speed can be increased and new product market success will increase in response. However, new product developers should also consider the research of Langerak et al. (2010) informative which points out that the relationship between market-entry timing, which is a sales consideration, and development time which is a cost consideration, can impact new product profitability.
The third set of findings derived from this study implies that the moderating impact of NPD speed on the organisational integration-NPD success relationship and on the NPD process proficiency-new product market success relationship were found to be insignificant. These results imply that not only does NPD speed not relate to new product market success but NPD speed also does not moderate the relationship between overall organisational integration or NPD process proficiency and new product market success. These findings point out that the developers of new products do not need to be concerned about how increasing NPD speed might relate to new product market success when making decisions regarding NPD process proficiency improvement or the extent of organisational integration that will be instituted between marketing and R&D (Troy et al., 2008) during NPD processes in these industries.
7 Limitations, research directions, and summary
7.1 Study limitations
As with all research, there are limitations associated with this study. First, while it remains intuitively satisfying that NPD speed forms an inverted U-shaped relationship with new product market success, it might take innovative forms of measurement to study these relationships or, perhaps, these relationships are context or industry specific. It must be remembered that the measurement of NPD speed in this study was based on objective NPD speed metrics as were the measurements used by Ittner and Larcker (1997). These NPD speed measurements are different from the NPD speed measurements employed in studies that found significant relationships between NPD speed and new product success in which relative NPD speed measurement scales were employed. Second, it is also thought that this study’s findings might not be generalisable to industries beyond those studied or, additionally, to other organisations within these three industries. Furthermore, as Song and Xie (2000) note, there may be salient reasons why this study’s findings are not pertinent to organisations in countries other than the USA. Third, this study is based
An investigation of the moderating influence of NPD speed 347
on NPD processes related to single new product projects. It is plausible that the examined associations will vary when new product projects are appended to one another. Fourth, it may be important to consider a comparison of subjective and objective NPD speed measurements to properly establish NPD speed’s relationship with new product market success.
7.2 Future research directions
This study suggests several important directions that researchers might take to continue to explore the research questions and constructs studied in this research especially since many of the stated hypotheses specifically involving NPD speed were not supported by this study’s data. The following list of research questions can help form the direction for future product development and academic studies that pertain to NPD speed, organisational integration, NPD process proficiency, and new product market success. Investigating these questions can provide greater insight into the challenges surrounding the measurement of these major constructs as well as a greater understanding of the relationships among these constructs.
• Why does it appear that there are industries in which NPD speed does not relate to new product market success?
• Are there differences in the relationships between NPD speed and new product market success when NPD speed is measured subjectively and objectively?
• Are the relationships among NPD speed, organisational integration, NPD process proficiency, and new product market success different in various industries especially industries with small to medium-sized firms?
7.3 Summary
This study confirmed the positive, direct relationships between overall organisational integration and new product market success, and NPD process proficiency and new product market success. The data did not support the relationship between NPD speed and new product market success in these industries. Nor did this study’s data support the existence of an inverted U-shaped relationship between NPD speed and new product market success in the studied industries. Moreover, this research data did not provide evidence that NPD speed moderates the overall organisational integration-new product market success relationship nor the NPD process proficiency-new product market success relationship as these relationships pertain to the market success of recently launched new products in the heavy construction, electrical equipment, and medical devices industries.
The importance of this research is to shed light on a relationship that appears to be intuitive which is that too much NPD speed impacts the degree of new product market success in a manner that results in low NPD success with low and high degrees of NPD speed and results in high NPD success when NPD speed falls between such low and high measures. At a minimum, in these three industries using the approaches and measurements employed, such intuitions do not appear to apply. Therefore, this research suggests that NPD speed does not form an inverted U-shaped relationship with new product market success in these industries. This study’s data also suggests that NPD teams cannot encourage too much NPD process speed such that detrimental effects
348 M.R. Millson
accrue to a new product’s market success. Finally, this study’s data also inform new product developers that the speed with which NPD processes are performed does not impact the association between NPD process proficiency and new product market success nor the relationship between overall organisational integration and new product market success.
References Akgün, A. and Lynn, G. (2002) ‘New product development team improvisation and
speed-to-market: an extended model’, European Journal of Innovation Management, Vol. 5, No. 3, pp.117–129.
Ancona, D.G. and Caldwell, D. (2007) ‘Improving the performance of new product development teams’, Research Technology Management, Vol. 50, No. 5, pp.37–43.
Armstrong, J.S. and Overton, T.S. (1977) ‘Estimating nonresponse bias in mail surveys’, Journal of Marketing Research, Vol. 14, No. 3, pp.396–402.
Baron, R.M. and Kenny, D.A. (1986) ‘The moderator – mediator variable distinction in social psychological research: conceptual, strategic, and statistical considerations’, Journal of Personality and Social Psychology, Vol. 51, No. 6, pp.1173–1182.
Bentley, J. (1992) ‘New product introduction: speed, quality and cost’, Assembly Automation, Vol. 12, No. 2, pp.3–4.
Booz, Allen, and Hamilton, Inc. (1982) New Products Management for the 1980s, Booz, Allen, and Hamilton, Inc., New York.
Calantone, R., Garcia, R. and Dröge, C. (2003) ‘The effects of environmental turbulence on new product development strategy planning’, Journal of Product Innovation Management, Vol. 20, No. 2, pp.90–103.
Calantone, R., Schmidt, J.B. and Di Benedetto, C.A. (1997) ‘New product activities and performance: the moderating role of environmental hostility’, Journal of Product Innovation Management, Vol. 14, No. 3, pp.179–189.
Calantone, R.J., Kwong, C. and Cui, A.S. (2006) ‘Decomposing product innovativeness and its effects on new product success’, Journal of Product Innovation Management, Vol. 23, No. 5, pp.408–421.
Cooper, R.G. (1975) ‘Why new industrial products fail’, Industrial Marketing Management, Vol. 4, No. 2, pp.315–326.
Cooper, R.G. (1980) Project NewProd: What Makes a New Product a Winner?, Quebec Industrial Innovation Center, Montreal, Quebec, Canada.
Cooper, R.G. (1990) ‘Stage-gate systems: a new tool for managing new products’, Business Horizons, Vol. 33, No. 3, pp.44–54.
Cooper, R.G. (1993) ‘Stage gate systems for new product development’, Marketing Management, Vol. 1, No. 4, pp.20–29.
Cooper, R.G. (2008) ‘Perspective: the stage-gate® idea-to-launch-update, what’s new, and NexGen systems’, Journal of Product Innovation Management, Vol. 25, No. 3, pp.213–232.
Cooper, R.G. and Kleinschmidt, E.J. (1986) ‘An investigation into the new product process: steps, deficiencies, and impact’, Journal of Product Innovation Management, Vol. 3, No. 2, pp.71–85.
Cooper, R.G. and Kleinschmidt, E.J. (1987) ‘New products: what separates winners from losers’, Journal of Product Innovation Management, Vol. 4, No. 3, pp.169–184.
Cooper, R.G. and Kleinschmidt, E.J. (1991) ‘New product processes at leading industrial firms’, Industrial Marketing Management, Vol. 20, No. 2, pp.137–147.

An investigation of the moderating influence of NPD speed 349
Cooper, R.G. and Kleinschmidt, E.J. (1995) ‘New product performance keys to success, profitability, and cycle time reduction’, Journal of Marketing Management, Vol. 11, No. 4, pp.315–337.
Cooper, R.G., Edgett, S.J. and Kleinschmidt, E.J. (2004) ‘Benchmarking best NPD practices III’, Research Technology Management, Vol. 47, No. 6, pp.43–55.
Cronbach, L.J. (1951) ‘Coefficient alpha and the internal structure of tests’, Psychometrika, Vol. 16, No. 3, pp.297–334.
Datar, S., Jordan, C., Kekre, S., Rajiv, S. and Sinivasan, K. (1996) ‘New product development structure: the effect of customer overload on post concept time to market’, Journal of Product Innovation Management, Vol. 13, No. 4, pp.325–333.
Dröge, C., Calantone, R. and Harmancioglu, N. (2008) ‘New product success: is it really controllable by managers in high turbulent environments?’, Journal of Product Innovation Management, Vol. 25, No. 3, pp.272–286.
Globe, S., Levy, G.W. and Schwartz, C.M. (1973) ‘Key factors and events in the innovation process’, Research Management, Vol. 16, No. 4, pp.8–15.
Goldenberg, J., Lehmann, D.R. and Mazursky, D. (2001) ‘The idea itself and the circumstances of its emergence as predictors of new product success’, Management Science, Vol. 47, No. 1, pp.69–84.
Griffin, A. and Hauser, J.R. (1996) ‘Integrating R&D and marketing: a review and analysis of the literature’, Journal of Product Innovation Management, Vol. 13, No. 3, pp.191–215.
Gupta, A., Raj, S.P. and Wilemon, D. (1985) ‘R&D and marketing dialogue in high tech firms’, Industrial Marketing Management, Vol. 14, No. 4, pp.289–300.
Gupta, A., Raj, S.P. and Wilemon, D. (1986) ‘A model for studying the R&D-marketing interface in the product innovation process’, Journal of Marketing, Vol. 50, No. 2, pp.7–17.
Hair, J., Black, W., Babin, B. and Anderson, R. (2010) Multivariate Data Analysis, Prentice Hall, Upper Saddle River, New Jersey.
Hopkins, D. (1980) ‘New-Product Winners and Losers, The Conference Board, New York, NY. Hopkins, D.S. and Bailey, E.L. (1971) ‘New product pressures’, The Conference Board Record,
pp.16–24, New York, NY. Ittner, C.D. and Larcker, D.F. (1997) ‘Product development cycle time and organizational
performance’, Journal of Marketing Research, Vol. 34, No. 1, pp.13–23. Kessler, E.H. and Bierly III, P.E. (2002) ‘Is faster really better? An empirical test of the
implications of innovation speed’, IEEE Transactions on Engineering Management, Vol. 49, No. 1, pp.2–12.
Kessler, E.H., Bierley, P. and Gopalakrishnan, S. (2000) ‘Internal vs. external learning in new product development: effects on speed, cost and competitive advantage’, R&D Management, Vol. 30, No. 3, pp.213–223.
Kleinschmidt, E.J. and Cooper, R.G. (1991) ‘The impact of product innovativeness on performance’, Journal of Product Innovation Management, Vol. 8, No. 4, pp.240–251.
Kleinschmidt, E.J. and Cooper, R.G. (1995) ‘The relative importance of new product success determinants-perception vs. reality’, R&D Management, Vol. 25, No. 3, pp.281–298.
Koufteros, X., Vonderembse, M. and Jayaram, J. (2005) ‘Internal and external integration for product development: the contingency effects of uncertainty, equivocality, and platform strategy’, Decision Sciences, Vol. 36, No. 1, pp.97–133.
Langerak, F. and Hultink, E.J. (2005) ‘The impact of new product development acceleration approaches on speed and profitahility: lessons for pioneers and fast followers’, IEEE Transactions on Engineering Management, Vol. 52, No. 1, pp.30–42.
Langerak, F. and Hultink, E.J. (2006) ‘The impact of product innovativeness on the link between development speed and new product profitability’, Journal of Product Innovation Management, Vol. 23, No. 3, pp.203–214.
350 M.R. Millson
Langerak, F., Griffin, A. and Hultink, E.J. (2010) ‘Balancing development costs and sales to optimize the development time of product line additions’, Journal of Product Innovation Management, Vol. 27, No. 3, pp.336–348.
Langerak, F., Hultink, E.J. and Robben, S.J. (2004) ‘The impact of market orientation, product advantage, and launch proficiency on new product performance and organizational performance’, Journal of Product Innovation Management, Vol. 21, No. 2, pp.79–94.
Miller, D. and Friesen, P.H. (1982) ‘Innovation in conservative and entrepreneurial firms: two models of strategic momentum’, Strategic Management Journal, Vol. 3, No. 1, pp.1–25.
Millson, M.R. and Wilemon, D. (2002) ‘The impact of organizational integration and product development proficiency on market success’, Industrial Marketing Management, Vol. 31, No. 1, pp.1–23.
Millson, M.R., Raj, S.P. and Wilemon, D. (1992) ‘A survey of major approaches for accelerating new product development’, Journal of Product Innovation Management, Vol. 9, No. 1, pp.53–69.
Muldowney, P. and Sievers, D. (2007) ‘Finance’s key role in product development’, Financial Executive, Vol. 23, No. 8, pp.42–47.
Myers, S. and Marquis, D.G. (1969) Successful Industrial Innovations, National Science Foundation, Technical Report NSF 69-17, 1-117.
Narver, J.C., Slater, S.F. and MacLachlan, D.L. (2004) ‘Responsive and proactive market orientation and new product success’, Journal of Product Innovation Management, Vol. 21, No. 5, pp.419–428.
Nunnally, J.C. and Bernstein, I.H. (1994) Psychometric Theory, 3rd ed., New York, McGraw-Hill Book Company.
Office of Management and Budget (1987) Standard Industrial Classification Manual, Washington, DC.
Olsen, E.M., Walker, O.C. and Ruekert, R.W. (1995) ‘Organizing for effective new product development: the moderating role of product innovativeness’, Journal of Marketing, Vol. 59, No. 1, pp.46–62.
Parry, M.E. and Song, X.M. (1993) ‘Determinants of R&D-marketing integration in high-tech Japanese firms’, Journal of Product Innovation Management, Vol. 10, No. 1, pp.4–22.
Parry, M.E. and Song, X.M. (1994) ‘Identifying new product successes in China’, Journal of Product Innovation Management, Vol. 11, No. 1, pp.15–30.
Pavlou, P.A. and El Sawy, O. (2006) ‘From IT leveraging competence to competitive advantage in turbulent environments: the case of new product development’, Information Systems Research, Vol. 17, No. 3, pp.198–227.
Petersen, K., Handfield, R.B. and Ragatz, G.L. (2003) ‘A model of supplier integration into new product development’, Journal of Product Innovation Management, Vol. 20, No. 4, pp.284–299.
Pinto, M.B. and Pinto, J.K. (1991) ‘Determinants of cross-functional cooperation in the project implementation process’, Project Management Journal, Vol. 22, No. 2, pp.13–20.
Price, J.L. (1972) Handbook of Organizational Measurement, D.C. Heath and Company, Lexington, MA.
Roberts, R.W. and Burke, J.E. (1974) ‘Six new products – what made them successful’, Research Management, Vol. 16, No. 3, pp.21–24.
Rochford, L. and Rudlius, W. (1997) ‘New product development process’, Industrial Marketing Management, Vol. 26, No. 1, pp.67–84.
Rothwell, R., Freeman, C., Horlsey, A., Jervis, V.T.P., Robertson, A.B. and Townsend, J. (1974) ‘SAPPHO updated – project SAPPHO phase II’, Research Policy, Vol. 3, No. 3, pp.258–291.
Ruekert, R.W. and Walker, O.C. (1987a) ‘Marketing’s interaction with other functional units: a conceptual framework and empirical evidence’, Journal of Marketing, Vol. 51, No. 1, pp.1–19.

An investigation of the moderating influence of NPD speed 351
Ruekert, R.W. and Walker, O.C. (1987b) ‘Interactions between marketing and R&D departments in implementing different business strategies’, Strategic Management Journal, Vol. 8, No. 3, pp.233–248.
Salomo, S., Weise, J. and Gemünden, H. (2007) ‘NPD planning activities and innovation performance: the mediating role of process management and the moderating effect of product innovativeness’, Journal of Product Innovation Management, Vol. 24, No. 4, pp.285–302.
Sherman, J.D., Berkowitz, D. and Souder, W. (2005) ‘New product development performance and the interaction of cross-functional integration and knowledge management’, Journal of Product Innovation Management, Vol. 22, No. 5, pp.399–411.
Sivadas, E. and Dwyer, F.R. (2000) ‘An examination of organizational factors influencing new product success in internal and alliance-based processes’, Journal of Marketing, Vol. 64, No. 1, pp.31–49.
Song, X.M. and Parry, M.E. (1997) ‘The determinants of Japanese new product success’, Journal of Marketing Research, Vol. 34, No. 1, pp.64–76.
Song, X.M. and Xie, J. (2000) ‘Does innovativeness moderate the relationship between cross-functional integration and product performance?’, Journal of International Marketing, Vol. 8, No. 4, pp.61–89.
Souder, W.E. (1980) ‘Promoting an effective R&D-marketing interface’, Research Management, Vol. 23, No. 4, pp.10–15.
Souder, W.E. (1981) ‘Disharmony between R&D and marketing’, Industrial Marketing Management, Vol. 10, No. 1, pp.67–73.
Souder, W.E. (1988) ‘Managing relations between R&D and marketing in new product development projects’, Journal of Product Innovation Management, Vol. 5, No. 1, pp.6–19.
Sun, H., Zhao, Y. and Yau, H.K. (2009) ‘The relationship between quality management and the speed of new product development’, The TQM Journal, Vol. 21, No. 6, pp.576–588.
Troy, L.C., Hirunyawipada, T. and Paswan, A.K. (2008) ‘Cross-functional integration and new product success: an empirical investigation of the findings’, Journal of Marketing, Vol. 72, No. 6, pp.132–145.
United States/Executive Office of the President (2002) North American Industry Classification System, Office of Management and Budget, Washington, DC.
van der Panne, G., van Beers, C. and Kleinknecht, A. (2003) ‘Success and failure of innovation: a literature review’, International Journal of Innovation Management, Vol. 7, No. 3, pp.309–338.
Vorhies, D.W. and Morgan, N.A. (2005) ‘Benchmarking marketing capabilities for sustained competitive advantage’, Journal of Marketing, Vol. 69, No. 1, pp.80–94.
Zirger, B.J. and Hartley, J.L. (1996) ‘The effect of acceleration techniques on product development time’, IEEE Transactions on Engineering Management, Vol. 43, No. 2, pp.143–152.
Zirger, B.J. and Maidique, M. (1990) ‘A model of new product development: an empirical test’, Management Science, Vol. 36, No. 7, pp.867–883.