an investigation of the reliability and factor structure of four new
TRANSCRIPT

84
Volume 21 ✤ Number 1 ✤ Fall 2009 ✤ pp. 84–108
t
An Investigation of the Reliability and Factor Structure of Four New Scales for
Rating the Behavioral Characteristics of Superior Students
Joseph S. Renzulli Del Siegle
Sally M. Reis M. Katherine GavinUniversity of Connecticut
Rachael E. Sytsma ReedCalvin College
Teacher rating scales are among the most widely used instru-ments for screening students for identification and subsequent participation in programs for the gifted and talented. The Scales for Rating the Behavioral Characteristics of Superior Students (SRBCSS; Renzulli et al., 2002) have been used widely through-out the United States (Davis & Rimm, 2003) as part of a com-prehensive plan for identifying potentially gifted and talented students. Originally developed in 1971, the scales were subse-quently translated into several languages (Kalantan, 1991; Srour,

Copyright © 2009 Prufrock Press, P.o. Box 8813, Waco, TX 76714sum
mary
Renzulli, J. S., Siegle, D., Reis, S. M., Gavin, M. K., & Sytsma Reed, R. E. (2009).An investigation of the reliability and factor structure of four new Scales for Rating the Behavioral Characteristics of Superior Students. Journal of Advanced Academics, 21, 84–108.
Teacher rating scales have been used widely throughout the United States
as part of a comprehensive plan for identifying potentially gifted and
talented students. The Scales for Rating the Behavioral Characteristics of
Superior Students (SRBCSS) are among the most frequently used teacher
rating scales to assess the characteristics of and nominate high-ability
students for gifted and enrichment programs. These scales have also
been used to make decisions about identification and the range of ser-
vices provided to these students. Four new SRBCSS subscales in math-
ematics, reading, science, and technology are introduced in an effort to
guide teacher nomination of talent in each of these content areas. The
reading scale measures accelerated reading, enjoyment of reading,
advanced reading processing, and advanced language. The math-
ematics scale is designed to measure students’ interest and approaches
to solving mathematical problems and their ease in understanding math-
ematical concepts. The science scale is designed to measure students’
interest in and approaches to solving problems in science and their ease
in understanding scientific concepts. The technology scale examines
four specific student characteristics: expertise using technology, interest
and initiative in using technology, mentoring others in technology, and
creative integration of technology. These scales can be used to identify
high-ability students in specific content areas. These students may subse-
quently receive enriched and differentiated curriculum and instruction or
acceleration within self-contained classrooms, cluster groups, or hetero-
geneous classrooms. Such learning opportunities are necessary in order
for students to fully develop their talents in these specific content areas.

86 Journal of Advanced Academics
SCALES
1989; Subhi, 1997) and have been used widely in other coun-tries. The first three scales in the series—learning, motivation, and creativity—were developed to guide identification of high-potential students based on a related theory, the Three-Ring Conception of Giftedness (Renzulli, 1978), that suggested that a broader range of students might be capable of developing gifted behaviors. As expanded conceptions of giftedness began to gain more flexibility (i.e., consideration of a broader range of tal-ent areas in addition to cognitive ability), additional scales were added to examine high potential for talents and gifts in other areas, including leadership, art, music, drama, communication (precision), communication (expressiveness), and planning. A series of teacher training activities was also added to the manual that accompanies the scales in an effort to increase the reliability of teacher ratings.
Each scale was subjected to a standard instrument develop-ment research process to ensure technical characteristics such as validity, reliability, objectivity, and practicality. External reviews of the SRBCSS (Elliot, Argulewicz, & Turco 1986; Rust & Lose, 1980) suggest that the 10 factors used in the scales cor-relate favorably with other measures of the discrete constructs on which they load, providing support for the validity of this instrument. The SRBCSS are published in an electronic format as well as the traditional paper-and-pencil format. The electronic format enables the automatic calculation of class record sheets and a variety of local norms. The SRBCSS technical manual (Renzulli et al., 2002) includes a comprehensive list of studies about the original SRBCSS.
This article describes the development of four new SRBCSS scales—reading, mathematics, science, and technology. These new scales were developed to help both teachers and adminis-trators obtain teacher ratings in these four content areas for stu-dents in grades 3–8. The scales were developed to guide teacher identification of students with talents in specific areas in an attempt to increase the likelihood that they will be identified for advanced academic services such as cluster or other forms of grouping (Gentry, 1999; Rogers, 1991); differentiated instruc-

87Volume 21 ✤ Number 1 ✤ Fall 2009
Renzulli, Siegle, Reis, Gavin, & Sytsma Reed
tion (Reis et al., 1993; Renzulli, 1977; Renzulli & Reis, 1997a, 1997b; Tomlinson, 1995); or acceleration (Colangelo, Assouline, & Gross, 2004).
Background
Teacher Nomination for Gifted and Talented Programs
Many researchers suggest the use of multiple criteria as one way to help identify more students (Baldwin, 2005; Ford, 1998; Frasier & Passow, 1994; Maker, 1996; Plucker, Callahan, & Tomchin, 1996; Renzulli & Reis, 1997a, 1997b; VanTassel-Baska, Johnson, & Avery, 2002). The use of teacher nomination has been compared with other independent variables such as peer and parent ratings and evaluations of work samples (e.g., Harty, Adkins, & Sherwood, 1984; Singer, Houtz, & Rosenfield, 1992). Several researchers have investigated the effectiveness of teacher nominations of students for gifted programs during the last few decades (Borland, 1978; Gagné, 1994; Hoge & Cudmore, 1986; Hunsaker, Finley, & Frank, 1997; Johnsen, 2004; Pegnato & Birch, 1959; Renzulli & Delcourt, 1986; Rohrer, 1995; Siegle, Moore, Mann, & Wilson, in press; Siegle & Powell, 2004). Findings collectively suggest that when specific rating criteria exist, teachers were able to identify talented students in their classrooms. Other studies have examined the construct validity or criterion-related validity of teacher judgment instruments for high-ability students (Elliott et al., 1986; Fishkin & Johnson, 1998; Mathew, 1997; McCarney & Anderson, 1998: Oakland, Falkenberg, & Oakland, 1996; Ryser & McConnell, 2004; Schaefer & McDermott, 1999: Worrell & Schaefer, 2004). This research on construct validity has generally supported the instru-ment developers’ assertions that the instruments do examine the hypothetical construct(s) being measured. Although techniques for providing construct validity evidence can be quite sophisti-cated, Popham (1995) emphasized that there is no single “set-

88 Journal of Advanced Academics
SCALES
tles-the-issue-once-and-for-all” investigation (p. 53), suggesting that the study of construct validity is a continual process.
Teacher Identification Nomination Instruments and Scales
Researchers have developed many different observation and nomination scales for teachers, parents, and others. These rating scales can provide valuable information about specific strengths of students such as a student’s ability to generate innovative solutions to a problem or a student’s motivation (Elliott, Busse, & Gresham, 1993; Feldhusen & Heller, 1986). The SRBCSS was first published in 1976 with available reliability and valid-ity information on 10 scales to identify student strengths in the areas of learning, motivation, creativity, artistic, musical, dra-matics, communication-precision, communication-expressive, and planning. The scales were developed for teachers and other school personnel to rate students for specialized programs using a 6-point rating: never, very rarely, rarely, occasionally, frequently, and always. The most widely used scales in the SRBCSS are those dealing with learning, motivation, and creativity and these three scales were subsequently revised (Renzulli et al., 2002). An early summary review of SRBCSS from the Buros Mental Measurements Yearbook explained that:
The SRBCSS represents a significant advancement in the expansion of the methodology for identifying intel-lectually gifted, creative, or talented youth. . . . Its true potential, however, will only be demonstrated as addi-tional empirical data becomes available. One promising area of research is the usefulness of the SRBCSS in iden-tifying children from culturally different backgrounds. Another research possibility is its use as a dependent variable in evaluating programs designed for the gifted. (Argulewicz, 1985, p. 1312)
The scales’ strengths include their conceptual formation and their ease of administration. In addition, the scales

89Volume 21 ✤ Number 1 ✤ Fall 2009
Renzulli, Siegle, Reis, Gavin, & Sytsma Reed
are potentially very helpful in assisting teachers to con-sider the full array of characteristics associated with truly gifted children. The scales could also provide a useful framework for an inservice program on the nature and diversity of giftedness. (Rust, 1985, p. 313)
In recent years, several other scales have been developed to measure characteristics of gifted students. For example, the Gifted Education Scale, Second Edition (GES-2; McCarney & Anderson, 1998) can be used for the screening and identifica-tion of children and youth in kindergarten through grade 12. This scale includes 48 items across five areas: intellectual ability, creativity, specific academic aptitude, leadership, and performing and visual arts, with an optional scale on motivation. “The reli-ability data for the GES-2 are quite strong and the validity data, although limited, are supportive of the validity of scores from the instrument” (Smith, 2001, p. 509). The Pfeiffer-Jarosewich Gifted Rating Scale (GRS; Jarosewich, Pfeiffer, & Morris, 2002) is also used to identify students in preschool through secondary school and includes subscales focusing on intellectual, academic, creative, and artistic talent and motivation. “The authors adhered to rigorous procedures and standards in the instrument’s devel-opment. The GRS-P and GRS-S are well standardized” (Ward, 2005, p. 407). The Scales for Identifying Gifted Students (SIGS; Ryser & McConnell, 2004) include the following seven sub-scales: General Intellectual Ability, Language Arts, Mathematics, Science, Social Studies, Creativity, and Leadership. Both a school version and home version are available and those com-pleting the form are asked to provide examples for any subscale with six or more high responses (Matthews, 2007). As with most rating scales, Ward (2007) suggested that the SIGS should not be the sole identification instrument, but “be used as a screen-ing instrument as part of a comprehensive battery of assessment techniques” (p. 234).
The Gifted and Talented Evaluation Scales (GATES; Gilliam, Carpenter, & Christensen, 1996) were also designed to identify gifted students between the ages of 5–18. The GATES

90 Journal of Advanced Academics
SCALES
are based on the current federal and state definitions, includ-ing intellectual ability, academic skills, creativity, leadership, and artistic talent. Teachers, parents, and others who are knowledge-able about the child may complete the GATES for nomination for gifted and talented programs. Although the rationale and methodology of the scales is considerable, “the validity for all of its purposes and the value-added role of the GATES remain unclear” (Brody, 2007, p. 345).
The psychometric properties of teacher rating scales dif-fer because each of these scales has been compared with differ-ing assessments in validity studies. For example, the correlation between the SRBCSS and a traditional intelligence test such as the WISC or the Stanford-Binet may be low to moderate because SRBCSS was designed to identify characteristics that are not traditionally measured in intellectual assessments. Some instruments seem to load on only one factor. For example, reviews (Smith, 2001; Young, 2001) of the Gifted Evaluation Scale (GES) suggest that the five behaviors the test purports to measure load primarily on one “general academic” factor, with leadership and arts as subfactors (Young, 2001). Finally, only a few rating scales include individual content area scales to elicit teacher nomina-tion information on specific areas such as mathematics or read-ing, which is one goal of the new scales we are presenting.
Identification of Specific Content Area Strengths
Few gifted and talented students excel in all academic areas at all times (Reis & Housand, 2007; Renzulli & Reis, 1997a, 1997b; Sternberg & Davidson, 2005). Rather, some students display different talents at different times and in different areas. A student who is a talented reader may not exhibit the same level of excellence in mathematics, and it is increasingly important to identify the particular academic strength areas of students in order to provide challenging and differentiated curriculum. Increased attention has been given to differentiated instruction in the classroom. This strategy attempts to address the variations among learners in the classroom through multiple approaches
91Volume 21 ✤ Number 1 ✤ Fall 2009
Renzulli, Siegle, Reis, Gavin, & Sytsma Reed
that enrich, eliminate, accelerate, modify, and adapt instruc-tion and curriculum to match students’ individual needs (Reis, Burns, & Renzulli, 1992; Renzulli, 1977, 1988; Tomlinson, 1995, 2001). Tomlinson (1995) emphasized that when teachers differ-entiate the curriculum, they organize different learning oppor-tunities based on content-area aptitudes, interests, and skills. Differentiation of instruction and curriculum suggests that stu-dents can be provided with materials and work of varied levels of difficulty through scaffolding, enrichment, acceleration, diverse kinds of grouping, and different time schedules in areas of their aptitude and interest (Colangelo et al., 2004; Gentry, 1999; Reis et al., 1992; Renzulli, 1977; Renzulli & Reis, 1997a, 1997b; Tomlinson, 1995). These procedures have enabled some teach-ers to adjust curriculum to meet the needs of talented students in certain content areas in both heterogeneously and homoge-neously grouped classrooms. However, improved methods and simpler identification of students’ aptitudes may result in bet-ter instructional matching in specific content areas. Because of the increased interest in expanded identification procedures and the need to identify students’ strengths in specific content areas in classrooms, four new SRBCSS subscales were developed in the areas of reading, mathematics, science, and technology. The development of the new scales and the design of the validity and reliability studies were consistent with both the development of the previous SRBCSS and the recommendations for designing instruments by Gable and Wolf (1993).
Validation Procedures in This Study
Instrument
The goals of content validity are to clarify the domain of a concept and judge whether the measure adequately represents the domain (Bollen, 1989). To investigate content validity for each subject scale, a review of literature in the area of each new scale was performed by content-area specialists who conducted

92 Journal of Advanced Academics
SCALES
research related to the behavioral characteristics of students tal-ented in the particular areas of reading, mathematics, science, and technology. A list of characteristics most frequently cited in each area was created and distributed for review to content experts who were professionals in the field (e.g., scientists and computer technology specialists); university professors (e.g., mathematicians); teachers; and resource specialists in schools (e.g., mathematics resource teachers and reading resource teach-ers). The characteristics were also reviewed and rated by experts in the specific field of education. For example, in addition to experts in gifted and talented education, mathematics educators also reviewed the mathematics items. This broad range of pro-fessionals with a variety of perspectives provided useful insights in defining the key characteristics of students who demonstrate talent in the particular content area.
To facilitate this process, the Experts’ Rating Form for Teacher Judgment of Behavioral Characteristics of Superior Students was developed in each area to provide the primary support for the instrument’s content validity. This form was dis-tributed to the aforementioned experts who examined the rela-tionship between the operational and conceptual definition of the items. The experts indicated how strongly they felt that each item was descriptive of the behavioral characteristics by select-ing the category: 1 (highly appropriate/include); 2 (appropriate but needs editing or clarification, please include suggestions); or 3 (not important/exclude, please include comments). In addition they circled the appropriate grade-level grouping for each stem: E (elementary, K–6); M (middle, 5–8); or S (secondary, 9–12). They were also asked to choose the top 10–15 items they would use if they could use only a limited number to help identify talent in the particular content area. A minimum of 25 different experts in each domain reviewed the behavioral characteristics for that domain. Results were compiled and the stems that received mean strength ratings of 2 or above from 80% of the raters were used to create the field test instrument.
Following this content validation, an initial set of scales was developed in each content area. Teachers rated students on each
93Volume 21 ✤ Number 1 ✤ Fall 2009
Renzulli, Siegle, Reis, Gavin, & Sytsma Reed
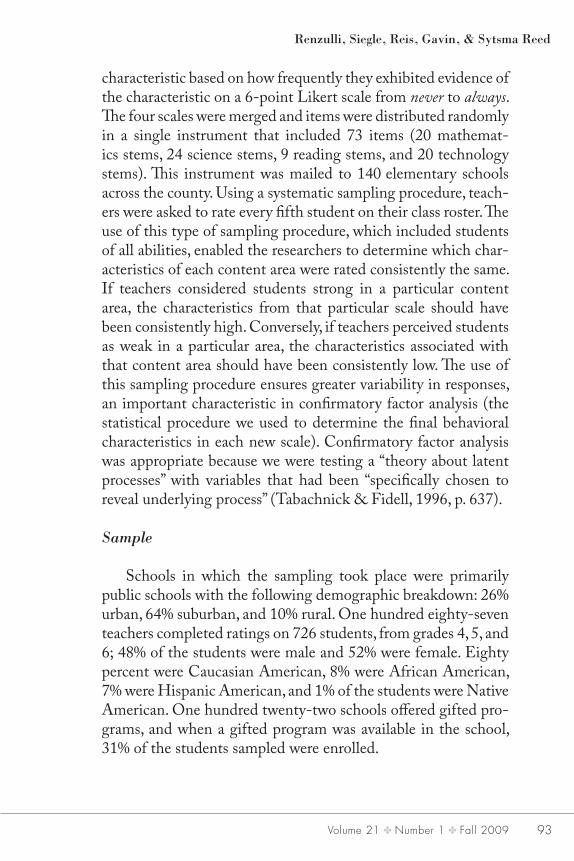
characteristic based on how frequently they exhibited evidence of the characteristic on a 6-point Likert scale from never to always. The four scales were merged and items were distributed randomly in a single instrument that included 73 items (20 mathemat-ics stems, 24 science stems, 9 reading stems, and 20 technology stems). This instrument was mailed to 140elementary schools across the county. Using a systematic sampling procedure, teach-ers were asked to rate every fifth student on their class roster. The use of this type of sampling procedure, which included students of all abilities, enabled the researchers to determine which char-acteristics of each content area were rated consistently the same. If teachers considered students strong in a particular content area, the characteristics from that particular scale should have been consistently high. Conversely, if teachers perceived students as weak in a particular area, the characteristics associated with that content area should have been consistently low. The use of this sampling procedure ensures greater variability in responses, an important characteristic in confirmatory factor analysis (the statistical procedure we used to determine the final behavioral characteristics in each new scale). Confirmatory factor analysis was appropriate because we were testing a “theory about latent processes” with variables that had been “specifically chosen to reveal underlying process” (Tabachnick & Fidell, 1996, p. 637).
Sample
Schools in which the sampling took place were primarily public schools with the following demographic breakdown: 26% urban, 64% suburban, and 10% rural. One hundred eighty-seven teachers completed ratings on 726 students, from grades 4, 5, and 6; 48% of the students were male and 52% were female. Eighty percent were Caucasian American, 8% were African American, 7% were Hispanic American, and 1% of the students were Native American. One hundred twenty-two schools offered gifted pro-grams, and when a gifted program was available in the school, 31% of the students sampled were enrolled.

94 Journal of Advanced Academics
SCALES
Analysis Procedures
A confirmatory factor analysis was conducted using Amos 4.0 to assess the latent structure (the four domains of reading, math-ematics, science, and technology) of a set of variables. The model fit was evaluated using the common fit indices of chi-square (x2), the ratio of chi-square to degrees of freedom (x2/df ), root mean square error of approximation (RMSEA), Comparative Fit Index (CFI), and Tucker Lewis Index (TLI). Initially, separate confirmatory factor analyses were conducted for each of the four domains and the number of items was reduced in each scale to create the best fit model. Once the four content area scales were established, a confirmatory factor analysis was conducted of a model that included all four scales.
Results
Reading
Finding research-based methods to identify the characteris-tics of talented readers is challenging, as mostly anecdotal publi-cations such as checklists are used to define this group. Talented readers are usually defined as having exceptional reading ability and the capacity to understand textual information well above what would be expected of other students in their age group (Reis et al., 2004). Work in the last 2 decades has focused on identi-fying some of the characteristics of this group, but this was the first data-based study to develop a scale for this purpose. Based on extant literature, 30 possible items were reduced to 9 items focusing on examining accelerated reading, enjoyment of read-ing, advanced reading processing, and advanced language (Reis et al., 2004). The reading scale model was able to be reduced to six items (see Table 1) for the best fitting model, X2(9) = 26.270, RMSEA = .052, CFI = .996, TLI = .993.

95Volume 21 ✤ Number 1 ✤ Fall 2009
Renzulli, Siegle, Reis, Gavin, & Sytsma Reed
Table 1Corrected Item-Total Correlations, Item Means and
Standard Deviations, and Cronbach Alpha Reliability Estimates for Each of the Four Rating Scales
Item
Corrected Item-Total Correlation M SD
Reading (Cronbach alpha = .964)R1. Eagerly engages in reading related activities .955 4.37 1.415R2. Applies previously learned literary concepts to new
reading experiences.958 4.35 1.285
R3. Focuses on reading for an extended period of time .955 4.40 1.442R4. Demonstrates tenacity when posed with challenging
reading.958 4.11 1.477
R5. Shows interest in reading other types of interest-based reading materials
.960 4.33 1.311
R6. Pursues advanced reading material independently .956 4.19 1.488Mathematics (Cronbach alpha = .977)
M1. Is eager to solve challenging mathematics problems (a problem is defined as a task for which the solution is not known in advance)
.873 4.10 1.344
M2. Organizes data and information to discover math-ematical patterns
.903 3.84 1.382
M3. Enjoys challenging mathematics puzzles, games, and logic problems
.899 4.07 1.451
M4. Understands new mathematics concepts and processes more easily than other students
.914 3.91 1.528
M5. Has creative (unusual and divergent) ways of solving mathematics problems
.890 3.85 1.364
M6. Displays a strong number sense (e.g., makes sense of large and small numbers, estimates easily and appropriately)
.903 4.06 1.488
M7. Frequently solves mathematics problems abstractly, without the need for manipulatives or concrete materials
.881 4.05 1.454
M8. Has an interest in analyzing the mathematical struc-ture of a problem
.880 3.52 1.426
M9. When solving a mathematics problem, can switch strategies easily, if appropriate or necessary
.898 3.94 1.420
M10. Regularly uses a variety of representations to explain mathematics concepts (written explanations, pictorial, graphic, equations, etc.)
.860 3.68 1.397
Science (Cronbach alpha = .947)S1. Demonstrates curiosity about scientific processes .852 4.16 1.252S2. Demonstrates creative thinking about scientific
debates or issues.846 3.72 1.334

96 Journal of Advanced Academics
SCALES
Mathematics
The mathematics scale was designed to measure students’ interest and approaches to solving mathematical problems and their ease in understanding mathematical concepts. Through observation of students in the process of problem solving and analysis of their written work, teachers rate students’ creativity, flexibility, and critical thinking in mathematics (Gavin, 2005). For example, students who develop an unusual and divergent way of solving a problem and are “thinking outside the box” show signs of creativity in mathematics. When students recog-nize that their approach to solving a problem is not working and are able to switch to a new strategy with ease, they are displaying flexibility in mathematical thinking. Using a variety of represen-tations to solve problems also contributes to the identification of creativity and flexibility in mathematical thinking. Finally, teachers can find evidence of critical thinking in mathematics when students: (a) are able to organize data and information easily to find patterns and make generalizations; (b) are able to
Item
Corrected Item-Total Correlation M SD
S3. Demonstrates enthusiasm in discussion of scientific topics
.877 4.04 1.312
S4. Is curious about why things are as they are .807 4.21 1.276S5. Reads about science-related topics in his/her free time .769 3.37 1.432S6. Expresses interest in science project or research .837 3.84 1.429S7. Clearly articulates data interpretation .771 3.68 1.386
Technology (Cronbach alpha = .959)T1. Demonstrates a wide range of technology skills .892 3.61 1.319T2. Learns new software without formal training .872 3.47 1.398T3. Spends free time developing technology skills .850 3.30 1.320T4. Assists others with technology related problems .881 3.49 1.342T5. Incorporates technology in developing creative
products/assignments/presentations.774 3.24 1.497
T6. Eagerly pursues opportunities to use technology .865 3.72 1.378T7. Demonstrates more advanced technology skills than
other students his or her age.866 3.36 1.424
Table 1, continued

97Volume 21 ✤ Number 1 ✤ Fall 2009
Renzulli, Siegle, Reis, Gavin, & Sytsma Reed
solve problems abstractly without the use of manipulatives; and (c) have a strong number sense (i.e., facility with very large and very small numbers and strong estimation skills). An 11-item mathematics scale proved to be the best fitting model, X2(44) = 260.545, RMSEA = .084, CFI = .978, TLI = .972.
Science
The science scale was designed to measure students’ inter-est in and approaches to solving problems in science and their ease in understanding scientific concepts. Through observation of students in the process of problem solving and analysis of their work, teachers rate students’ creativity, flexibility, and criti-cal thinking in science. For example, students who are able to reframe a scientific problem in a variety of ways by asking ques-tions with different foci or innovatively drawing upon content or process knowledge to engage in scientific discussions dem-onstrate flexibility and creativity in science. Critical think-ing and creativity allow the science student to extract relevant information from content knowledge, allowing the student to generate multiple possible approaches to examining a variable, such as a physical or chemical feature or a biochemical process, within a research paradigm. Students with such critical thinking and creativity in science demonstrate interest in and enthusi-asm for research. Scientists synthesize curiosity, creativity, and critical thinking in the generation of new knowledge; students who exhibit scientific curiosity (e.g., choosing to read about sci-ence, dedicating time to thinking about why and how things work) represent a potential pool of those who have the capabil-ity and desire to leverage critical thinking and creativity upon the raw material of science knowledge (Isaak & Hubert, 1999; Lederman, 1992). Please refer to Table 1 to see items directly related to these characteristics. The final science model consisted of seven items, X2(14) = 67.195, RMSEA = .074, CFI = .987, TLI = .981.

98 Journal of Advanced Academics
SCALES
Technology
“Technologically gifted students can usually be identified by the technology products they produce, the way they assist others with technology, and the technology-related questions they ask” (Siegle, 2004, p. 30). The SRBCSS technology scale is the first data-based scale measuring four specific student characteristics: expertise using technology, interest and initiative in using tech-nology, mentoring others in technology, and creative integration of technology. Technology giftedness is an emerging construct. This scale represents an early attempt at operationally defining technologically gifted students and asking teachers to identify them. Because this is a relatively new construct, we expect that it will need further refining. Technological giftedness appears to manifest itself in three distinct ways: those who excel at writ-ing computer code (programmers); those who excel at using software (interfacers); and those who excel at working with the actual technology equipment (fixers; R. Friedman-Nimz, per-sonal communication, April 23, 2006). This scale measures only one type of technology giftedness, the interfacers. Statistical analyses of the items we propose in the technology scale support the viability of the unidimensional technology gifted construct. A trimmed model with seven technology items (see Table 1) exhibited the best fit, X2(14) = 45.940, RMSEA = .060, CFI = .993, TLI = .990.
Combined Analysis
After the individual items on each of the scales were reduced for an acceptable model, we combined the selected items for each scale into one measurement model. We specified a priori that each question was an indicator for only one of the four domains. An examination of the modification indices revealed that the removal of one mathematics item would produce a better fitting model. The reason for eliminating this item was that the modifi-cation index suggested that the item behaved as an indicator for more than one factor. This item was removed for the final model,

99Volume 21 ✤ Number 1 ✤ Fall 2009
Renzulli, Siegle, Reis, Gavin, & Sytsma Reed
and the fit indices indicated that the model exhibited adequate fit for the hypothesized factor structure in the validation sample, X2(371) = 1541.22, RMSEA = .070, CFI = .945, TLI = .949. The X2 was significant (p < .001); however, the X2 significance test is highly sensitive to sample size.
Separate Cronbach alpha internal consistency reliability estimates were calculated for each of the four scales in the final model. Measures involving attitude ought to have internal con-sistency estimates greater than .70 (Gable & Wolf, 1993). All of our reliability estimates easily exceeded this recommenda-tion with our lowest reliability estimate being alpha = .947. The reliability estimates and corrected item-total correlations, item means, and item standard deviations for each of the four rating scales are summarized in Table 2.
To further investigate the validity of the new rating scales, we explored the relationship between students’ grades in each of the domains and the ratings they received from their teachers using the new scale for that domain. Grades were recorded on a 12-point scales with A = 12 points and F = 1 point (e.g., a grade of a B- equaled 8 points). The relationship between the students’ earned grades and their teachers’ subject rating with the new SRBCSS was significant for each of the four scales. The stron-gest relationship was for mathematics, r = .731, and the weak-est relationship was for technology, r = .453. Unlike the reading, mathematics, and science areas, approximately one third of our sample did not report technology grades, and what constituted a technology grade was not well defined. One would expect the moderate to strong relationships between grades and teacher ratings that we found. We would not expect perfect relation-ships because the rating scales are designed to measure students’ giftedness in the specific domains, which, while related to stu-dent academic achievement, still differ because of factors such as student motivation and homework completion.
The correlations among the factors ranged from .874 to .684 (see Table 2). Correlations above .85 are indicative of possible discriminant validity problems. The relationship between the science factor and the mathematics factor did exceed the .85

100 Journal of Advanced Academics
SCALES
standard. Because these two constructs are related, this relation-ship was not unexpected, although the strength of the relation-ship was higher than expected. Future refinement of the scales may help to further discriminate between these two constructs. The strong correlations between earned grades and the teacher ratings for each domain, as well as the relationships among the factors, are summarized in Table 2.
In addition, to improve the reliability of teacher ratings and to enable teachers to gain a better understanding of the specific behaviors and key concepts for each domain, a training exer-cise was developed for each scale. This activity was designed to promote discussions among teachers about student behaviors. In the first part of the activity teachers are asked to match key concepts with specific scale items. After comparing responses, discussion about the variability in the answers occurs; subse-quently, teachers are asked to record behaviors of students that they believe are good exemplars of individual scale items. They can discuss their responses and come to a consensus on one or two behaviors that best represent the scale item and can subse-quently use these benchmarks to guide them in rating students on these characteristics.
Table 2Correlation Between Students Grades and Teacher Ratings in Bold and Correlations Among the Four Rating Scale Factors
Reading Mathematics Science TechnologyReading .681*** .816*** .804*** .684***Mathematics .731*** .874*** .778***Science .573*** .844***Technology .453***
Note. ***p < .001.

101Volume 21 ✤ Number 1 ✤ Fall 2009
Renzulli, Siegle, Reis, Gavin, & Sytsma Reed
Discussion
Creating research-based scales to identify the characteristics of gifted and high-ability students in specific content areas has been the subject of limited previous research, and most checklists used for these purposes, if they are available, are anecdotal. Finding research-based methods to identify specific characteristics of tal-ented students in reading, science, mathematics, and technology can lead to many exciting outcomes. The validity studies reported in this article indicated an adequate fit for the hypothesized fac-tor structure in the validation sample. To further investigate the validity of the new rating scales, we also examined the relation-ship between students’ grades in each of the domains and the rat-ings they received from their teachers using the new scale for that domain. The new scales have strong reliability estimates, as the lowest reliability estimate was over .94.
Current research suggests that although there are many ways to challenge students who are talented in reading, little is being done (Reis et al., 2004). In recent research, characteristics of tal-ented readers have been defined as: reading early and above level, enjoying the reading process, exhibiting advanced processing in reading, and having advanced language skills (Reis et al., 2004). Using the new SRBCSS reading scale might enable teachers to identify a broader pool of academically advanced students for differentiated instruction using acceleration and enrichment with methods such as differentiated instruction, compacting, grouping, or other forms of acceleration. The same strategies could be used in mathematics, science, and technology to enable students to benefit from differentiated and advanced opportuni-ties in each of these areas.
The mathematics scale helps identify students who are cre-ative and critical problem solvers, which represent characteris-tics of successful mathematicians. Using the mathematics scale would enable students with aptitude, interest, and motivation to be identified and then be given opportunities to challenge and extend their higher level reasoning abilities. Instruction can take the form of differentiated lessons in heterogeneous classrooms,

102 Journal of Advanced Academics
SCALES
homogeneous advanced mathematics classes, or after-school programs for mathematically talented students. The key is pro-viding challenging materials that encourage students to develop the characteristics akin to mathematics. In this regard, new materials such as Project M3: Mentoring Mathematical Minds curriculum units are being developed for talented students and field tested with promising research results in mathematics achievement (Gavin, Casa, & Adelson, 2006).
The science scale was designed to measure students’ interest and approaches to solving problems in science and their ease in understanding scientific concepts. Advanced science work could provide opportunities for creativity, flexibility, and critical think-ing in science, and this scale may be used to help identify stu-dents who might receive advanced and differentiated services in science. Developing science and engineering talent is currently a national priority.
The technology scale could be used to identify students who might benefit from the time, resources, and opportunities to create advanced technology products. They might also be encouraged to creatively integrate technology in advanced ways to gather and analyze data about questions in areas of interest (Siegle, 2007). As stated earlier, the technology scale represents a preliminary attempt to define and measure the proposed con-struct of technological giftedness. Future research on this pro-posed construct is needed.
This study has summarized work on the development of a set of teacher rating scales focusing on specific content area apti-tudes. We hope that the use of these scales will stimulate both expanded identification initiatives for high-ability students in these content areas, as well as more attention to their curricular and instructional needs.
References
Argulewicz, E. N. (1985). Review of Scales for Rating the Behavioral Characteristics of Superior Students. In J. V. Mitchell Jr. (Ed.),

103Volume 21 ✤ Number 1 ✤ Fall 2009
Renzulli, Siegle, Reis, Gavin, & Sytsma Reed
The ninth mental measurements yearbook (Vol. 2, pp. 1311–1312). Lincoln, NE: Buros Institute of Mental Measurement of the University of Nebraska—Lincoln.
Baldwin, A. Y. (2005). Identification concerns and promises for gifted students of diverse populations. Theory Into Practice, 44, 105–114.
Bollen, K. A. (1989). Structural equation modeling with latent variables. New York, NY: John Wiley.
Borland, J. H. (1978). Teacher identification of the gifted: A new look. Journal for the Education of the Gifted, 2, 22–32.
Brody, L. E. (2007). Review of the Gifted and Talented Evaluation Scales. In K. F. Geisinger, R. A. Spies, J. F. Carlson, & B. S. Plake (Eds.), The seventeenth mental measurements yearbook (pp. 343–345). Lincoln, NE: Buros Institute of Mental Measurement of the University of Nebraska—Lincoln.
Colangelo, N., Assouline, S. G., & Gross, M. U. M. (Eds.). (2004). A nation deceived: How schools hold back America’s brightest students (Vol. 2). Iowa City: The University of Iowa, The Connie Belin & Jacqueline N. Blank International Center for Gifted Education and Talent Development.
Davis, G. A., & Rimm, S. B. (2003). Education of the gifted and talented (5th ed.). Needham Heights, MA: Allyn & Bacon.
Elliott, S. N., Argulewicz, E. N., & Turco, T. L. (1986). Predictive validity of the Scales for Rating the Behavioral Characteristics of Superior Students for gifted children in three sociocultural groups. Journal of Experimental Education, 55, 27–32.
Elliott, S. N., Busse, R. T., & Gresham, F. M. (1993). Behavior rating scales: Issues of use and development. School Psychology Review, 22, 313–321.
Feldhusen, J. F., & Heller, K. A. (Ed.). (1986). Introduction. In K. S. Heller & J. F. Feldhusen (Eds.), Identifying and nurturing the gifted: An international perspective (pp. 19–31). Toronto, Canada: Hans Huber.
Fishkin, A. S., & Johnson, A. S. (1998). Who is creative? Identifying children’s creative abilities. Roeper Review, 21, 40–46.
Ford, D. Y. (1998). The underrepresentation of minority students in gifted education: Problems and promises in recruitment and retention. Journal of Special Education, 32, 4–14.
Frasier, M. M., & Passow, A. H. (1994). Toward a new paradigm for identifying talent potential (RM94112). Storrs: University of Connecticut, The National Research Center on the Gifted and Talented.

104 Journal of Advanced Academics
SCALES
Gable, R. K., & Wolf, M. B. (1993). Instrument development in the affec-tive domain: Measuring attitudes and values in corporate and school settings (2nd ed.). Boston, MA: Kluwer Nijhoff Publishing.
Gagné, F. (1994). Are teachers really poor talent detectors? Comments on Pegnato and Birch’s (1959) study of the effectiveness and effi-ciency of various identification techniques. Gifted Child Quarterly, 38, 124–126.
Gavin, M. K. (2005). Are we missing anyone? Identifying mathemati-cally promising students. Gifted Education Communicator, 36(3–4), 24–29.
Gavin, M. K., Casa, T. M., & Adelson, J. L. (2006). Mentoring math-ematical minds: An innovative program to develop math talent. Understanding our Gifted, 19(1), 3–6.
Gentry, M. L. (1999). Promoting student achievement and exemplary classroom practices through cluster grouping: A research-based alter-native to heterogeneous elementary classrooms (RM99138). Storrs: University of Connecticut, The National Research Center on the Gifted and Talented.
Gilliam, J. E., Carpenter, B. O., & Christensen, J. R. (1996). Gifted and Talented Evaluation Scales. Austin, TX: PRO-ED.
Harty, H., Adkins, D., & Sherwood, R. (1984). Predictability of gift-edness identification indices for two recognized approaches to ele-mentary school gifted education. Journal of Educational Research, 77, 337–342.
Hoge, R. D., & Cudmore, L. (1986). The use of teacher-judgment measures in the identification of gifted pupils. Teaching and Teacher Education, 2, 181–196.
Hunsaker, S. L., Finley, V. S., & Frank, E. L. (1997). An analysis of teacher nominations and student performance in gifted programs. Gifted Child Quarterly, 41, 19–24.
Isaak, D. J., & Hubert, W. A. (1999). Catalyzing the transition from student to scientists—A model for graduate research training. BioScience, 49, 321–326.
Jarosewich, T., Pfeiffer, S. I., & Morris, J. (2002). Identifying gifted students using teacher rating scales: A review of existing instru-ments. Journal of Psychoeducational Assessment, 20, 322–336.
Johnsen, S. K. (Ed.). (2004). Identifying gifted students: A practical guide. Waco, TX: Prufrock Press.
Kalantan, A. R. (1991). The effects of inservice training on Bahraini teachers: Perceptions of giftedness (Unpublished doctoral disserta-tion). University of Connecticut, Storrs.

105Volume 21 ✤ Number 1 ✤ Fall 2009
Renzulli, Siegle, Reis, Gavin, & Sytsma Reed
Lederman, N. G. (1992). Students’ and teachers’ conceptions of the nature of science: A review of the research. Journal of Research in Science Teaching, 29, 331–359.
Maker, C. J. (1996). Identification of gifted minority students: A national problem, needed changes and a promising solution. Gifted Child Quarterly, 40, 41–50.
Mathew, S. T. (1997). A review of the Gifted Evaluation Scale. Journal of School Psychology, 35, 101–104.
Matthews, M. S. (2007). Review of the Scales for Identifying Gifted Students. In K. F. Geisinger, R. A. Spies, J. F. Carlson, & B. S. Plake (Eds.), The seventeenth mental measurements yearbook (pp. 729–731). Lincoln, NE: Buros Institute of Mental Measurement of the University of Nebraska—Lincoln.
McCarney, S. B., & Anderson, P. D. (1998). The Gifted Evaluation Scale (2nd ed.): Technical manual. Columbia, MO: Hawthorne Educational Services.
Oakland, T., Falkenberg, B. A., & Oakland, C. (1996). Assessment of leadership in children, youth and adults. Gifted Child Quarterly, 40, 138–146.
Pegnato, C. W., & Birch, J. W. (1959). Locating gifted children in junior high schools: A comparison of methods. Exceptional Children, 25, 300–304.
Plucker, J. A., Callahan, C. M., & Tomchin, E. M. (1996). Wherefore art thou, multiple intelligences? Alternative assessments for iden-tifying talent in ethnically diverse and low income students. Gifted Child Quarterly, 40, 81–92.
Popham, W. J. (1995). Classroom assessment: What teachers need to know. Boston, MA: Allyn & Bacon.
Reis, S., & Housand, A. (2007). Characteristics of gifted and talented learners: Similarities and differences across domains. In F. A. Karnes & K. R. Stephens (Eds.), Achieving excellence (pp. 62–81). New York, NY: Merrill/Prentice Hall.
Reis, S. M., Burns, D. E., & Renzulli, J. S. (1992). Curriculum compact-ing: The complete guide to modifying the regular curriculum for high ability students. Mansfield Center, CT: Creative Learning Press.
Reis, S. M., Gubbins, E. J., Briggs, C. J., Schreiber, F. J., Richards, S., Jacobs, J. K., . . . Renzulli, J. S. (2004). Reading instruction for talented readers: Case studies documenting few opportunities for continuous progress. Gifted Child Quarterly, 48, 315–338.
Reis, S. M., Westberg, K. L., Kulikowich, J., Caillard, F., Hébert, T., Plucker, J., . . . Smist, J. M. (1993). Why not let high ability students

106 Journal of Advanced Academics
SCALES
start school in January? The curriculum compacting study (RM93106). Storrs: University of Connecticut, The National Research Center on the Gifted and Talented.
Renzulli, J. S. (1977). The Enrichment Triad Model: A guide for develop-ing defensible programs for the gifted and talented. Mansfield Center, CT: Creative Learning Press.
Renzulli, J. S. (1978).What makes giftedness? Reexamining a defini-tion. Phi Delta Kappan, 60, 180–184, 261
Renzulli, J. S. (1988). The multiple menu model for developing dif-ferentiated curriculum for the gifted and talented. Gifted Child Quarterly, 32, 298–309.
Renzulli, J. S., & Delcourt, M. A. B. (1986). The legacy and logic of research on the identification of gifted persons. Gifted Child Quarterly, 30, 20–23.
Renzulli, J. S., & Reis, S. M. (1997a). The Schoolwide Enrichment Model: A how-to guide for educational excellence. Mansfield Center, CT: Creative Learning Press.
Renzulli, J. S., & Reis, S. M. (1997b). The Schoolwide Enrichment Model: A comprehensive plan for educational excellence (2nd ed.). Mansfield Center, CT: Creative Learning Press.
Renzulli, J. S., Smith, L. H., White, A. J., Callahan, C. M., Hartman, R. K., & Westberg, K. L. (2002). Scales for Rating the Behavior Characteristics of Superior Students: Revised edition. Mansfield Center, CT: Creative Learning Press.
Rogers, K. B. (1991). The relationship of grouping practices to the edu-cation of the gifted and talented learner (RBDMS9102). Storrs: University of Connecticut, The National Research Center on the Gifted and Talented.
Rohrer, J. C. (1995). Primary teacher conceptions of giftedness: Image, evidence, and nonevidence. Journal for the Education of the Gifted, 18, 269–283.
Rust, J. O. (1985). Review of Scales for Rating the Behavioral Characteristics of Superior Students. In J. V. Mitchell Jr. (Ed.), The ninth mental measurements yearbook (Vol. 2, pp. 312–313). Lincoln, NE: Buros Institute of Mental Measurement of the University of Nebraska—Lincoln.
Rust, J. O., & Lose, B. D. (1980). Screening for giftedness with the Slosson and the Scales for Rating Behavioral Characteristics of Superior Students. Psychology in the Schools, 17, 446–451.
Ryser, G. R., & McConnell, K. (2004). Scales for Identifying Gifted Students: Ages 5 through 18. Waco, TX: Prufrock Press.
107Volume 21 ✤ Number 1 ✤ Fall 2009
Renzulli, Siegle, Reis, Gavin, & Sytsma Reed
Schaefer, B. A., & McDermott, P. A. (1999). Learning behavior and intelligence as explanation for children’s scholastic achievement. Journal of School Psychology, 37, 299–313.
Siegle, D. (2004). Identifying students with gifts and talents in tech-nology. Gifted Child Today, 27(4), 30–33, 64.
Siegle, D. (2007). Identifying and developing technological gifted-ness: Exploring another way to be gifted in the 21st century. Gifted Education Communicator, 38(1), 18–21.
Siegle, D., & Powell, T. (2004). Exploring teacher biases when nomi-nating students for gifted programs. Gifted Child Quarterly, 48, 21–29.
Siegle, D., Moore, M. M., Mann, R. L., & Wilson, H. E. (in press). Factors that influence in-service and preservice teachers’ nomina-tions of students for gifted and talented programs. Journal for the Education of the Gifted.
Singer, E. M., Houtz, J. C., & Rosenfield, S. (1992). Teacher-identified characteristics of successful gifted students: A Delphi study. Educational Research Quarterly, 15(3), 5–14.
Smith, D. K. (2001). Review of the Gifted Evaluation Scale. In B. S. Plake & J. C. Impara (Eds.), The fourteenth mental measurements yearbook (pp. 508–509). Lincoln, NE: Buros Institute of Mental Measurement of the University of Nebraska—Lincoln.
Srour, N. H. (1989). An analysis of teacher judgment in the identification of gifted Jordanian students (Unpublished doctoral dissertation). University of Connecticut, Storrs.
Sternberg, R. J., & Davidson, J. (Eds.). (2005). Conceptions of giftedness (2nd ed.). Boston, MA: Cambridge University Press.
Subhi, T. (1997). Who is gifted? A computerized identification proce-dure. High Ability Students, 8, 189–211.
Tabachnick, B. G., & Fidell, L. S. (1996). Using multivariate statistics (3rd ed.). New York, NY: HarperCollins.
Tomlinson, C. A. (1995). How to differentiate instruction in mixed-ability classrooms. Alexandria, VA: Association for Supervision and Curriculum Development.
Tomlinson, C. A. (2001). How to differentiate instruction in mixed-ability classrooms (2nd ed.). Alexandria, VA: Association for Supervision and Curriculum Development.
VanTassel-Baska, J., Johnson, D., & Avery, L. D. (2002). Using perfor-mance tasks in the identification of economically disadvantaged and minority gifted learners: Findings from Project STAR. Gifted Child Quarterly, 46, 110–123.

Copyright of Journal of Advanced Academics is the property of Prufrock Press and its content may not be
copied or emailed to multiple sites or posted to a listserv without the copyright holder's express written
permission. However, users may print, download, or email articles for individual use.