an ontology of 3d visualization techniques for enriched 3d ... · an ontology of 3d visualization...
TRANSCRIPT

Usage, Usability, and Utility of 3D City Models, 02005 (2012)DOI: 10.1051/3u3d/201202005C© Owned by the authors, published by EDP Sciences, 2012
An ontology of 3D visualization techniques forenriched 3D city models
C. Métral, N. Ghoula and G. Falquet
Centre universitaire d’informatique, University of Geneva, 7 route de drize,1227 Carouge, Switzerland
Abstract. Models, which represent in 3 dimensions the geometric elements of a city, are called 3D citymodels. Those models are used for an intended wide range of applications beyond mere visualization. Suchuses are made possible by enriching the geometrical aspects with urban or environmental data that cannot beperceptible to a user without a visual abstraction. Using such models implies interacting with them in orderto perform specific tasks related to the visualized data. Those data are potentially heterogeneous in termsof types, scales, issues, etc. When creating an enriched 3D city model, the designer faces the problem ofchoosing the most relevant visualization techniques for those heterogeneous data that have to be displayedwithin the same scene. In this paper we address the problem related to the visualization of enriched 3D citymodels by proposing a formal representation of existing visualization techniques in the form of an ontologyof 3D visualization techniques. We also show how this ontology can be used for computational reasoningand help for the selection of visualization techniques by checking if a technique is compatible with a datasetto display or to a technique already selected and used in the same scene.
1. INTRODUCTION
Since the 1960s, the imagination in the human computer interaction field has been focused on the ideaof representing the real world in a virtual way. The concept of 3D interfaces has thus been exploredand enriched continuously by new approaches of visualization. In particular for representing geometricelements of a city, we use 3D city models. For different usages, these models are enriched by informationcovering multiple issues.
Each type of enrichment data can be interpreted and transformed into a visual rendering leading tothe design of different visualization techniques. The number of visualization techniques of enrichmentinformation and virtual reality technologies is increasing. Nowadays, rendering a large amount ofinformation within a 3D city model is becoming a less tedious task than it used to be. Regarding thenumber of available approaches, a designer of 3D city model should consider existing techniques inorder to reuse them and reduce costs instead of starting from scratch. In order to collect the necessaryknowledge about available visualization techniques for 3D display in a given case, a designer is obligedto go through a large amount of scientific or industrial documentation. This documentation can havedifferent types going from detailed specifications to only general information. This variety in thedescription of visualization techniques cannot fulfill the information need of a 3D designer.
Some researchers have realized the fact that “no author or group of authors has written acomprehensive and authoritative text on the subject, despite a continuing and rich set of researchfindings, prototype systems, and products” [1] (Jim Foley in the foreword of the book “3D UserInterfaces”). For this purpose, [1] had the initiative of writing about the concept of 3D user interfacesin order to give a large literature reviews and a set of examples and guidelines to understand this
This is an Open Access article distributed under the terms of the Creative Commons Attribution License 2.0, which permitsunrestricted use, distribution, and reproduction in any medium, provided the original work is properly cited.
Article published by EDP Sciences and available at http://3u3d.edpsciences.org or http://dx.doi.org/10.1051/3u3d/201202005
Usage, Usability, and Utility of 3D City Models
research field. Learning about this field is not the only way for an advanced 3D designer to deal withthe problems of offering effective and useful 3D displays. This domain is quite rich and large, so it istime consuming to be aware of all the novelties that may be useful in a particular case to display anamount of heterogeneous information (data sets) that have to be visualized together. This is why wepropose an ontology driven knowledge base that allows a designer to get all the information he needsabout the visualization techniques that are relevant for his/her context. Building this ontology of 3Dvisualization techniques relies on defining a formal representation of the different concepts related to3D visualization techniques and their evaluation. In this paper we address the problem related to thevisualization of enriched 3D city models by:
– proposing a formal representation of existing visualization techniques, in the form of a knowledgebase of 3D visualization techniques that can be used for computational reasoning;
– representing and collecting usability evaluation results for each of the 3D visualization techniquewhen available;
– defining rules about visualization techniques used in the same scene or about the compatibility ofa technique with a data set to display;
– express user needs in terms of ontological tasks such as subsumption computation or logical queryevaluation.
2. STATE OF THE ART
2.1 Enriched 3D city models
Models that represent in 3 dimensions the geometric elements of a city are called 3D city models.A large number of 3D city models have been recently created or are in the process of creation, for anintended wide range of applications beyond mere visualization. CityGML [2] is the first standard relatedto 3D city models. CityGML attempts to provide a description of 3D elements like relief, buildings,traffic infrastructure, water bodies, vegetation or city furnitures with their geometry, topology (spatialproperties), semantic properties and relevant attributes. The attributes cover classification, function andactual usage of an object. Those objects have been identified to be either required or important inmany different application areas. CityGML is also extendable to adapt to the requirements of specificapplications. Such extensions have been defined for different issues such as noise, with noise immissionsadded to buildings, roads or railways [2]. We thus obtain 3D city models where the geometrical aspectshave been extended with urban or environmental data that can be called enrichment data.
If visualization is one of the main uses of enriched 3D city models it is not the only one. The EUCOST Action TU0801 considers 3D city models – semantically enriched with the knowledge underlyingin data and models related to urban issues – as potential planning and decision-making tools whoseassessment has still to be processed [3]. The use of enriched 3D city models for helping decision makingin the urban domain is related to tasks performed by the user of such models and for which he/she hasto navigate in or over the 3D model. Typical tasks include evaluation of urban projects in terms ofquality of life (including visual aspects), evaluation of the impact of projects on the urban landscapeand on other factors. Such tasks imply the visualization of data that can originate from different fieldslike transport, construction, air quality, noise, etc.; be of different kinds such as quantitative measuresof noise or qualitative soundscapes; take different forms, from structured data provided by geographicalinformation systems to unstructured documents; have different scales (city as a whole, buildings, etc.);be not directly georeferenced (legal text for example) although they have a spatiotemporal coverage.Although those data have to be represented with all their characteristics (type, georeferencing, urbanor environmental field to which they are issued, etc.) their visualization can use techniques used in 3Dvirtual environments.
02005-p.2

European COST Action TU0801
2.2 Representation of 3D visualization techniques
Gathering or accessing multiple information and enrichment data about 3D city models is an importanttask. Many approaches and systems are available for seeking and organizing enrichment information [4].Researches have been driven in order to make a best use of this enrichment knowledge by means ofproposing new 3D visualization techniques [1]. Visualization techniques for 3D virtual environmentsare extensively used in simulation environments, video games, tutoring systems, etc. In the contextof an enriched 3D city model, visualization techniques define a visual rendering of enrichment dataallowing the user to explore and manipulate a large set of information.
Nevertheless only a few authors have attempted to classify these techniques to compare and evaluatethem. Many documentations are focused on the description of new interaction techniques or softwareand hardware settings used in specific applications, most of them presenting also user studies forexperimental evaluation. However, few works have been driven and can be found in literature tryingto formalize the description of 3D User Interfaces [5]. For modeling and organizing knowledge abouta specific domain, there are different existing approaches. Ontologies are lately one of the most usedtools to establish a knowledge management solution [6]. These are engineering artifacts [7] that needto be constructed, refined, updated and integrated based on knowledge from domain experts. Formalontologies are based on logical formalisms, they offer a possibility for human users and software agentsto share and use knowledge.
Different classifications, terminologies, taxonomies or ontologies have been defined in the field ofvisualization, with different aims. [8] presented the design of a visualization ontology, which aimsat providing more semantics for the discovery of visualization services. This ontology treats theproblem of designing visualization techniques from an application level and processing but it does notdetail the specifications of these techniques. The Top Level Visualization Ontology (TLVO) definedby [9] aims at providing a common vocabulary to describe visualization data, processes and products.Based on an analysis of visualization taxonomies and on recent work in visualization ontologies, [10]propose some modifications to the TLVO in order to better represent the visualization process and datamodels. For the purpose of describing visualization techniques and their evaluations, this ontology isnot the best choice because it does not represent all the required concepts; for instance, there is norepresentation of 3D visualization, neither the evaluation of these techniques nor the representation ofthe usage context. [11] aims to developing a unifying ontology, which is applicable in visualizationsystems. By systematically reviewing existing models and classifications, they found in particular thatmost visualization knowledge is stored informally in terminologies and taxonomies – thus being notdirectly usable for computational reasoning – while the few existing visualization ontologies do notsufficiently represent existing domain knowledge and, furthermore, are not accessible to public. Morerecently, [12] have created a visualization ontology to support a recommendation system for the selectionof visualization components.
In our case, we aim at organizing and formally representing knowledge about visualizationtechniques for enriched 3D city models. Existing ontologies cannot be entirely reused as they focuson the visualization process and not on the required entities for an effective representation and reuseof visualization techniques. By means of the proposed ontology of visualization techniques we intendto: (i) propose a formal representation for describing existing visualization techniques, (ii) define rulesfor combining and reusing these techniques, and (iii) show how selection tasks, such as checking if atechnique is compatible with a dataset to display, can be expressed in terms of ontological tasks such assubsumption or logical query evaluation.
2.3 Evaluation of 3D visualization techniques
When designing an enriched 3D city model, the designer faces the problem of choosing the mostrelevant visualization techniques for viewing the geometric and the enrichment data. This means that
02005-p.3
Usage, Usability, and Utility of 3D City Models
the selected techniques must at least be able to display the desired information (effectivity); efficientlysupport the user task(s); not negatively interfere with each other (e.g. by hiding information). Giventhe vast amount of visualization techniques that have been developed over the last decades, and thevariety of visual contexts, user tasks, and data types, the selection of relevant visualization techniques isfar from trivial. When the evaluation results are publicly available they can be used to help selecting atechnique.
An example of such a case is [13], who proposes two new visualization techniques for enhancingthe visibility of road labels in 3D navigation maps, the expected enhancement being defined relativelyto the baseline approach (which is used in almost all existing navigation systems such as Google Earth)and confirmed by a user study. In fact we usually don’t have such evaluation results. On the contrarymany visualization techniques are used in 3D geographic information systems (3D GIS) by many usersand for many tasks without any evaluation. While not formally assessed the utility of such visualizationtechniques still exists. Visualization techniques used in 3D video games can also be considered as someof them are close to 3D enriched city models. It is the case with Simcity, for example, which is a city-building and urban planning simulation computer game [14]. But, in the case of video games if intensiveevaluations of the 3D visualization techniques used have been performed, their results are usually keptsecret. [15] has investigated the domain of abstract information integration into interactive 3DVEs.He highlighted that there are many different approaches in order to help the user perform specifictasks.
In order to be able to decide about the usability of a visualization technique, designers use evaluationmethods. Most of the evaluation methods have been originally conceived for 2D usability evaluationand then they were adapted and extended to support 3D user interfaces evaluation [16]. The number ofevaluation methods of 3D user interfaces usability is continuously growing. There are different kinds ofevaluation methods such as heuristic evaluation [17] or formative evaluation [18] etc. Formalizing therepresentation of 3D visualization techniques for enrichment data is not enough for using the resultingknowledge base. To define and decide about the usability of such techniques in real cases we shouldcollect and organize all the information related to their evaluation. This brings us to also define a formalrepresentation of the concept of usability evaluation for 3D user interface in the case of enriched 3Dcity models. First, we have to be able to classify evaluation methods and identify their metrics. Second,we have to take into account the context and tasks of the evaluation. Which leads to the fact that thegenerality of the evaluation results depends on the generality of the context. This is why we also needto consider formalizing the context representation [19] and task descriptions [20].
3. METHODOLOGY
We address the problem related to the visualization of enriched 3D city models by proposing aframework in order to help a designer of an enriched 3D city model to choose the best visualizationtechniques for the data to visualize, the context in which this visualization will take place, and the taskthat will be performed by the user. The proposed framework comprises an ontology of 3D visualizationtechniques, a knowledge base containing the description of specific techniques, and selection tools thatrely on this knowledge base. An ontology-based approach enables not only a formal representation ofexisting but scattered knowledge about visualization techniques but also computational reasoning basedon different criteria. These criteria can be related to the usability evaluation of a technique, as evaluationresults will be stored in the knowledge base.
The research methodology we used to create the ontology and the knowledge base consists in thefollowing main phases:
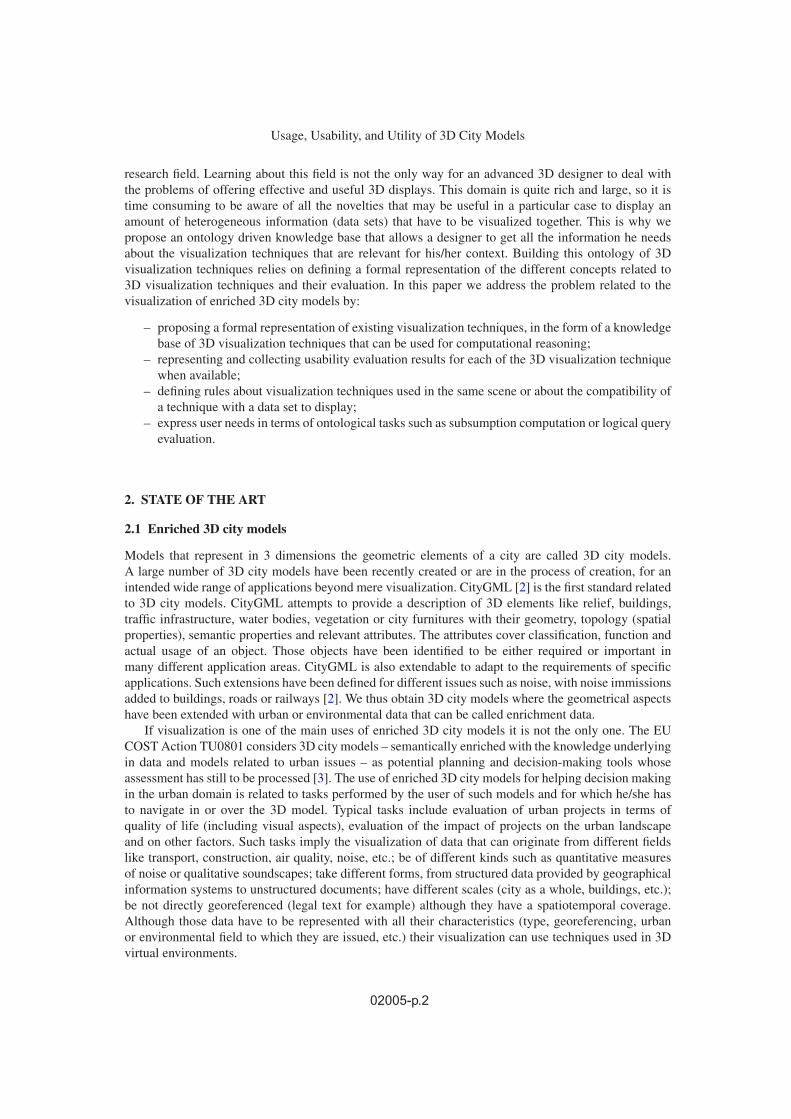
1. Conceptualization. We obtained a conceptualization of 3D visualization techniques by collecting,adapting, and extending models, existing ontologies and taxonomies about 3D visualizationtechniques described in the literature.
02005-p.4
European COST Action TU0801
Conceptualization of 3D visualization techniques
Ontology of 3D visualization techniques
Knowledge on 3D visualization techniques
Description and evaluation of visualization techniques used in 3D GIS or other
Rules and axioms
Knowledge Base of 3D visualization techniques
Other ontologies
Figure 1. Methodology of the creation of an ontology of 3D visualization techniques and of the knowledge baseassociated.
Evaluation Visualization_Technique
Context
Result Task Data_
Description Visual_
Rendering
Output_ Location
Method
Figure 2. Specification of the interacting modules of the ontology for representing visualization techniques.
2. Formalization. We formalized the obtained conceptualization in the OWL2 ontology language.More precise knowledge (for instance, generic data/technique compatibility) was introduced asontology axioms.
3. Extension towards evaluation. The ontology has been complemented with a formalization ofevaluation techniques directly drawn from human-computer interaction reference literature.
4. Populating the knowledge base. To obtain a knowledge base of visualization techniques weanalyzed formal and informal descriptions and evaluations of 3D visualization techniques used(or proposed) in 3D GIS, 3D video games, and other applications.
4. ONTOLOGY OF 3D VISUALIZATION TECHNIQUES
4.1 Modules of the ontology
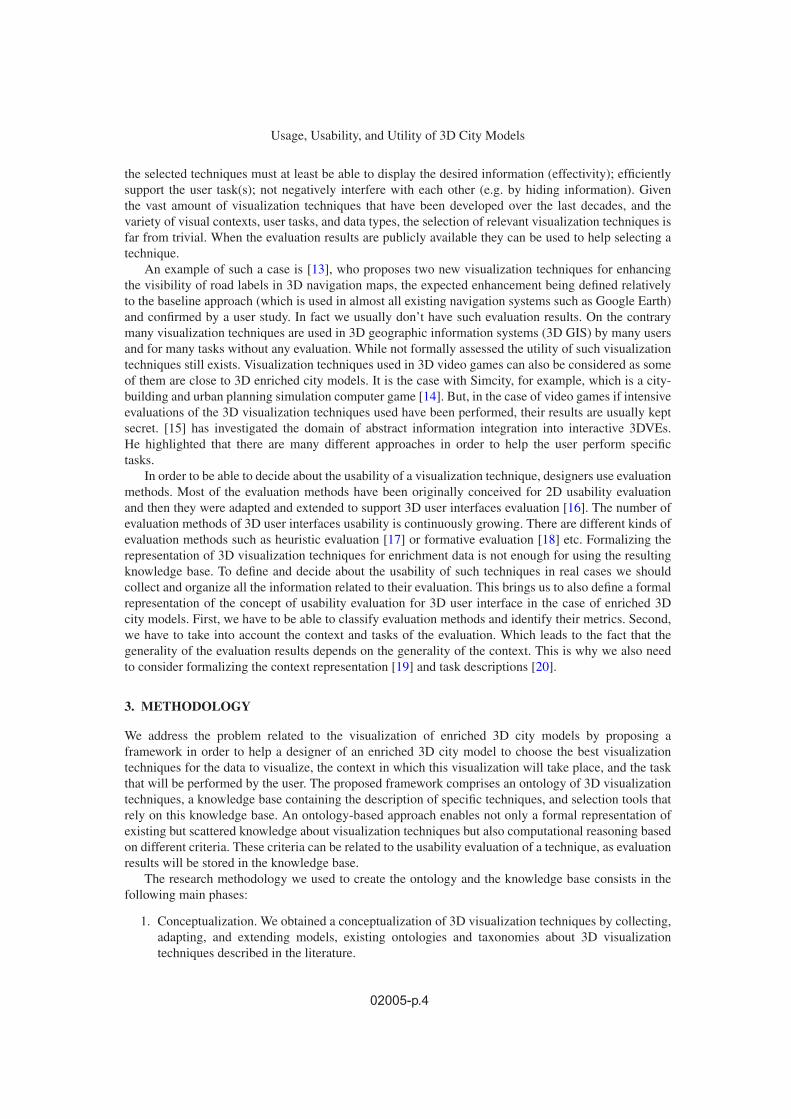
The design of the ontology is based on our study of the issue of visualization of enrichment information.In the section 2.3 we have identified that the use of visualization techniques representations depends alsoon their evaluation based on a context and tasks. Thus, as expressed in Figure 2, two modules composethis ontology.
The first module is related to the representation of 3D visualization techniques. The secondmodule focuses on describing the evaluation of those techniques with regards to a specific or genericcontext related to a 3D model and a set of different tasks that a user can perform.
4.2 Visualization techniques module
This section describes the main concepts used to represent visualization techniques in the ontology.They are named Visualization_Technique and Data_description as each visualization technique appliesto data that are specific to it and that need to be described.
02005-p.5
Usage, Usability, and Utility of 3D City Models
Data_Description
DataType
Data_Format
Environmental_Issue
datatype
describ
es
Localization
loca liza tion
form
a t
related_to
Urban_Object
Data_Description
DataType
Data_Format
Environmental_Issue
datatype
describ
es
Localization
loca liza tion
form
a t
related_to
Urban_Object
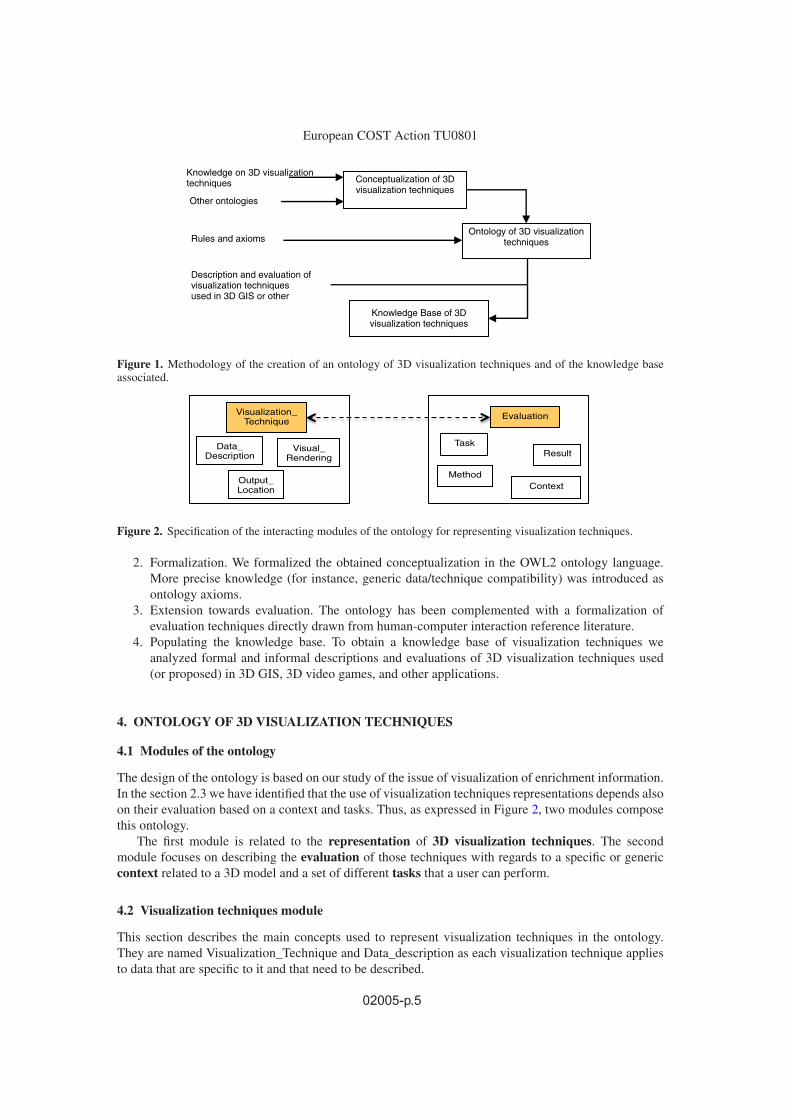
Figure 3. Specification of the Data_Description concept (in graph form on the left, in OWL [22] on the right).
Data_Description conceptThe description of a data includes the following elements:
– a data type, which can be, for example, a text, a string, an audio or video element, a scalar,a vector or a combination of those elements [21];
– a data format: describes the extension of the files containing the data, such as jpg, pdf, or xml,. . . ;
– the environmental issue to which it is related the enrichment information: air quality, noise, . . . ;– the urban object(s) to which it is related, if any, . . . ;– a (geo)localization in the 3D model, which can be in the form of coordinates, of a geoname,
object related or another type of coverage;
The description of a data is represented in the ontology as a concept related by properties to theprevious elements defined themselves as concepts.
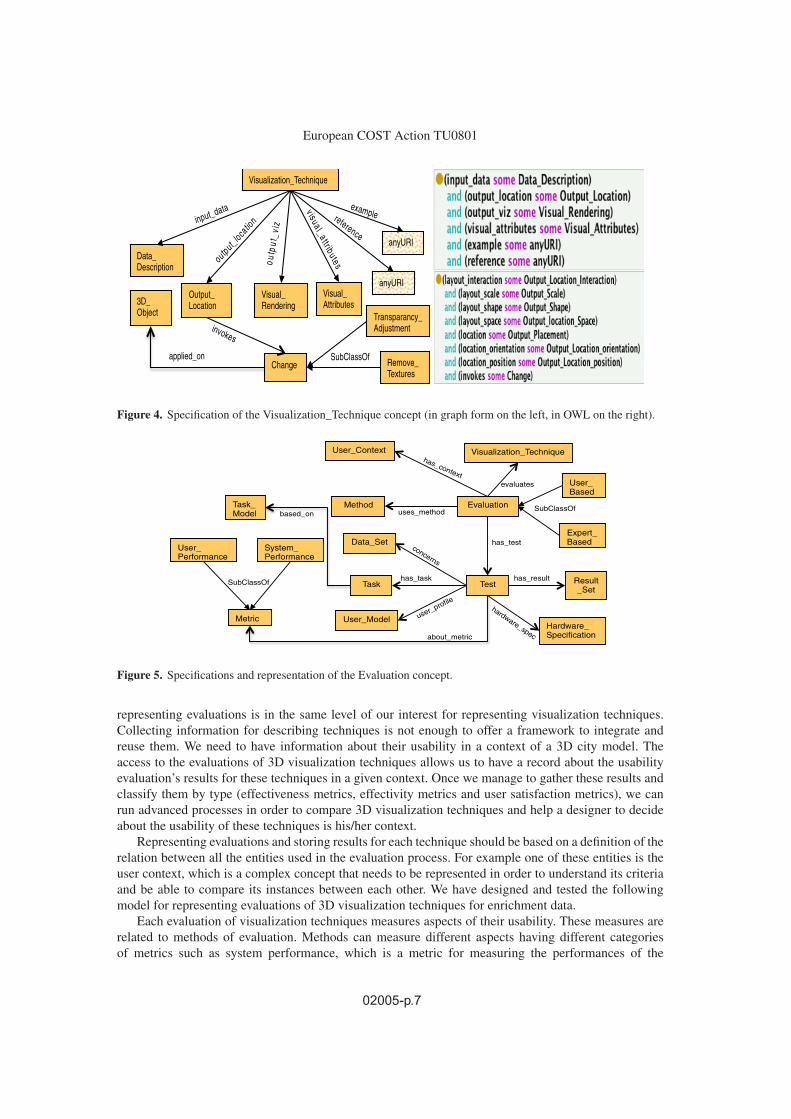
A specific data object is represented as an instance of the Data_Description concept.Visualization_Technique conceptA visualization technique is characterized by the following elements: a data description, an output
location, a visual rendering, some visual attributes, a reference and example-s:
– Data Description. It represents the input to the technique and will be transformed into an outputview based on different criteria of the metaphor of rendering and the output location manipulationand definition. Each data description can be used as input for many visualization techniques;
– Output Location. The output location describes the rendering criteria. It is specified in terms of:location (position and orientation), interaction and scale. It also represents the placement of thevisual rendering regarding the object and the virtual environment: whether it is attached to theobject, or displayed on the floor or on top of the user, etc.;
– Visual Rendering. The visual rendering represents an object abstraction before rendering it on thescreen. It’s about information that is viewable on the screen using a visualization technique [23];
– Visual attributes: they describe the visual aspects related to the technique: whether the datasupport is transparent or not, whether the size is fixed or dynamic, etc. [23];
– Reference: it is a link to a document describing the technique;– Example: it is a link to a 3D prototype or an image capture of the technique’s implementation.
4.3 Evaluation module
The purpose of enriched 3D city models evaluation is the identification of the usability of 3D techniquesthat are used to visualize enrichment data. Based on our study of the evaluation concept in section2.3, we have managed to identify the majority of the related issues and concepts. Our interest for
02005-p.6
European COST Action TU0801
Visualization_Technique
Data_ Description
Visual_ Rendering
Output_ Location
input_data
output_locatio
n
Visual_ Attributes
visual_attributes outp
ut_v
iz reference
anyURI
anyURI
example
Change
3D_ Object
applied_on
invokes
Remove_ Textures
SubClassOf
Transparancy_ Adjustment
Figure 4. Specification of the Visualization_Technique concept (in graph form on the left, in OWL on the right).
Evaluation
Visualization_Technique
Method
Result_Set
Test Task
User_Model
Data_Set
evaluates
uses_method
has_test
has_result
concerns
has_task
user_profile
Task_ Model based_on
User_ Based
Expert_ Based
SubClassOf
Metric
about_metric
System_ Performance
SubClassOf
User_ Performance
has_context
User_Context
Hardware_ Specification
hardware_spec
Figure 5. Specifications and representation of the Evaluation concept.
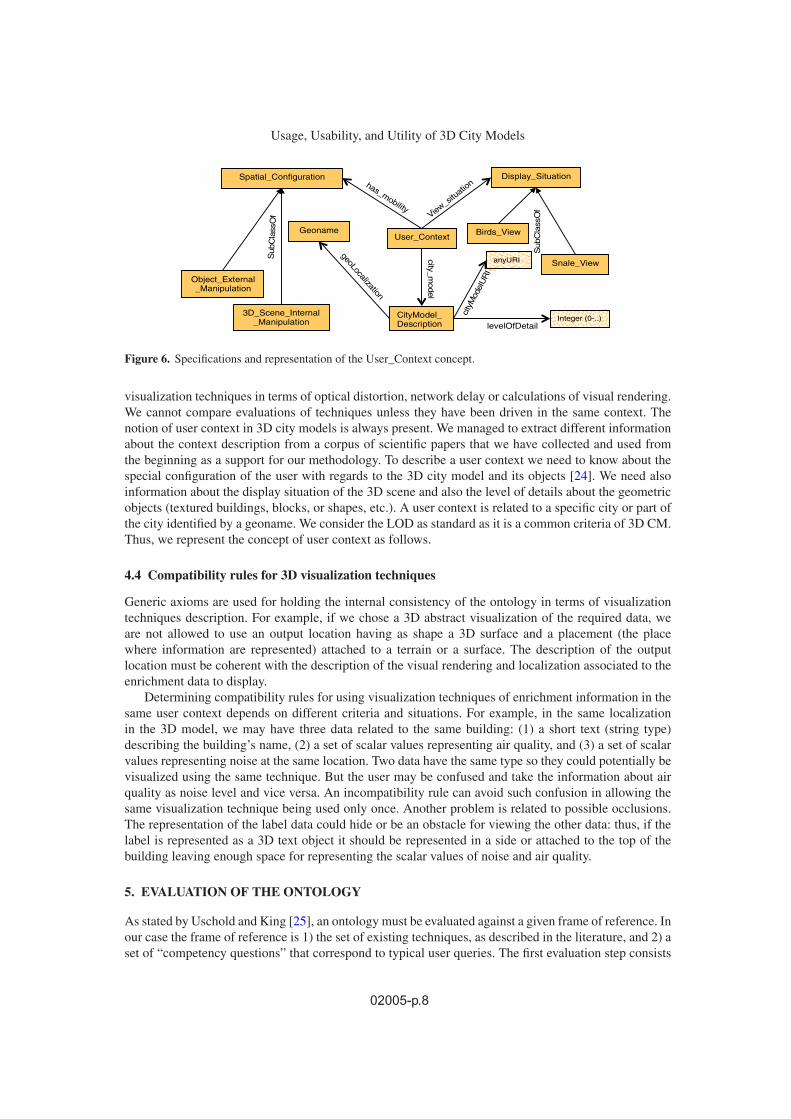
representing evaluations is in the same level of our interest for representing visualization techniques.Collecting information for describing techniques is not enough to offer a framework to integrate andreuse them. We need to have information about their usability in a context of a 3D city model. Theaccess to the evaluations of 3D visualization techniques allows us to have a record about the usabilityevaluation’s results for these techniques in a given context. Once we manage to gather these results andclassify them by type (effectiveness metrics, effectivity metrics and user satisfaction metrics), we canrun advanced processes in order to compare 3D visualization techniques and help a designer to decideabout the usability of these techniques is his/her context.
Representing evaluations and storing results for each technique should be based on a definition of therelation between all the entities used in the evaluation process. For example one of these entities is theuser context, which is a complex concept that needs to be represented in order to understand its criteriaand be able to compare its instances between each other. We have designed and tested the followingmodel for representing evaluations of 3D visualization techniques for enrichment data.
Each evaluation of visualization techniques measures aspects of their usability. These measures arerelated to methods of evaluation. Methods can measure different aspects having different categoriesof metrics such as system performance, which is a metric for measuring the performances of the
02005-p.7
Usage, Usability, and Utility of 3D City Models
User_Context
Spatial_Configuration
CityModel_ Description
Display_Situation
Snale_View
Birds_View
Object_External_Manipulation
3D_Scene_Internal_Manipulation
has_mobility View_sit
uation
Sub
Cla
ssO
f
city_model
Sub
Cla
ssO
f
Geoname
geoLocalization
Integer (0-..)
anyURI
city
Mod
elU
RI
levelOfDetail
Figure 6. Specifications and representation of the User_Context concept.
visualization techniques in terms of optical distortion, network delay or calculations of visual rendering.We cannot compare evaluations of techniques unless they have been driven in the same context. Thenotion of user context in 3D city models is always present. We managed to extract different informationabout the context description from a corpus of scientific papers that we have collected and used fromthe beginning as a support for our methodology. To describe a user context we need to know about thespecial configuration of the user with regards to the 3D city model and its objects [24]. We need alsoinformation about the display situation of the 3D scene and also the level of details about the geometricobjects (textured buildings, blocks, or shapes, etc.). A user context is related to a specific city or part ofthe city identified by a geoname. We consider the LOD as standard as it is a common criteria of 3D CM.Thus, we represent the concept of user context as follows.
4.4 Compatibility rules for 3D visualization techniques
Generic axioms are used for holding the internal consistency of the ontology in terms of visualizationtechniques description. For example, if we chose a 3D abstract visualization of the required data, weare not allowed to use an output location having as shape a 3D surface and a placement (the placewhere information are represented) attached to a terrain or a surface. The description of the outputlocation must be coherent with the description of the visual rendering and localization associated to theenrichment data to display.
Determining compatibility rules for using visualization techniques of enrichment information in thesame user context depends on different criteria and situations. For example, in the same localizationin the 3D model, we may have three data related to the same building: (1) a short text (string type)describing the building’s name, (2) a set of scalar values representing air quality, and (3) a set of scalarvalues representing noise at the same location. Two data have the same type so they could potentially bevisualized using the same technique. But the user may be confused and take the information about airquality as noise level and vice versa. An incompatibility rule can avoid such confusion in allowing thesame visualization technique being used only once. Another problem is related to possible occlusions.The representation of the label data could hide or be an obstacle for viewing the other data: thus, if thelabel is represented as a 3D text object it should be represented in a side or attached to the top of thebuilding leaving enough space for representing the scalar values of noise and air quality.
5. EVALUATION OF THE ONTOLOGY
As stated by Uschold and King [25], an ontology must be evaluated against a given frame of reference. Inour case the frame of reference is 1) the set of existing techniques, as described in the literature, and 2) aset of “competency questions” that correspond to typical user queries. The first evaluation step consists
02005-p.8
European COST Action TU0801
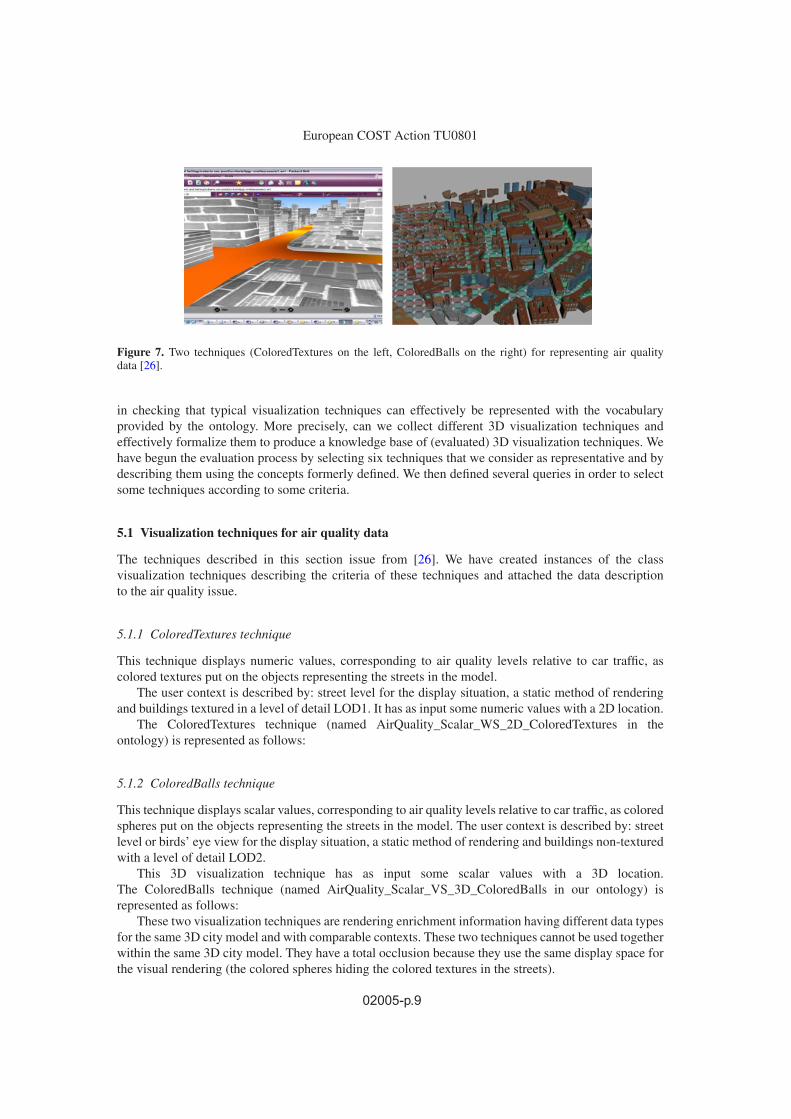
Figure 7. Two techniques (ColoredTextures on the left, ColoredBalls on the right) for representing air qualitydata [26].
in checking that typical visualization techniques can effectively be represented with the vocabularyprovided by the ontology. More precisely, can we collect different 3D visualization techniques andeffectively formalize them to produce a knowledge base of (evaluated) 3D visualization techniques. Wehave begun the evaluation process by selecting six techniques that we consider as representative and bydescribing them using the concepts formerly defined. We then defined several queries in order to selectsome techniques according to some criteria.
5.1 Visualization techniques for air quality data
The techniques described in this section issue from [26]. We have created instances of the classvisualization techniques describing the criteria of these techniques and attached the data descriptionto the air quality issue.
5.1.1 ColoredTextures technique
This technique displays numeric values, corresponding to air quality levels relative to car traffic, ascolored textures put on the objects representing the streets in the model.
The user context is described by: street level for the display situation, a static method of renderingand buildings textured in a level of detail LOD1. It has as input some numeric values with a 2D location.
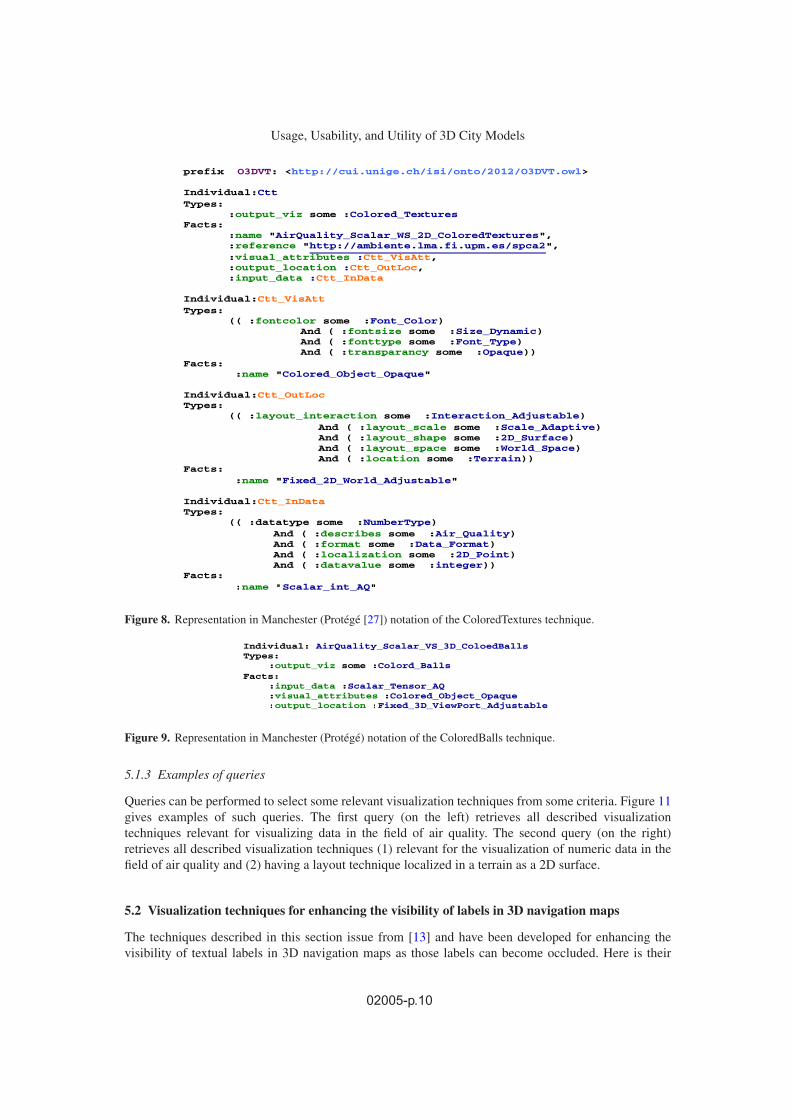
The ColoredTextures technique (named AirQuality_Scalar_WS_2D_ColoredTextures in theontology) is represented as follows:
5.1.2 ColoredBalls technique
This technique displays scalar values, corresponding to air quality levels relative to car traffic, as coloredspheres put on the objects representing the streets in the model. The user context is described by: streetlevel or birds’ eye view for the display situation, a static method of rendering and buildings non-texturedwith a level of detail LOD2.
This 3D visualization technique has as input some scalar values with a 3D location.The ColoredBalls technique (named AirQuality_Scalar_VS_3D_ColoredBalls in our ontology) isrepresented as follows:
These two visualization techniques are rendering enrichment information having different data typesfor the same 3D city model and with comparable contexts. These two techniques cannot be used togetherwithin the same 3D city model. They have a total occlusion because they use the same display space forthe visual rendering (the colored spheres hiding the colored textures in the streets).
02005-p.9
Usage, Usability, and Utility of 3D City Models
prefix O3DVT: <http://cui.unige.ch/isi/onto/2012/O3DVT.owl> Individual:Ctt Types:
:output_viz some :Colored_Textures Facts: :name "AirQuality_Scalar_WS_2D_ColoredTextures", :reference "http://ambiente.lma.fi.upm.es/spca2", :visual_attributes :Ctt_VisAtt, :output_location :Ctt_OutLoc, :input_data :Ctt_InData Individual:Ctt_VisAtt Types:
(( :fontcolor some :Font_Color) And ( :fontsize some :Size_Dynamic) And ( :fonttype some :Font_Type) And ( :transparancy some :Opaque)) Facts:
:name "Colored_Object_Opaque" Individual:Ctt_OutLoc Types:
(( :layout_interaction some :Interaction_Adjustable) And ( :layout_scale some :Scale_Adaptive) And ( :layout_shape some :2D_Surface) And ( :layout_space some :World_Space) And ( :location some :Terrain)) Facts:
:name "Fixed_2D_World_Adjustable" Individual:Ctt_InData Types:
(( :datatype some :NumberType) And ( :describes some :Air_Quality) And ( :format some :Data_Format) And ( :localization some :2D_Point) And ( :datavalue some :integer)) Facts:
:name "Scalar_int_AQ"
Figure 8. Representation in Manchester (Protégé [27]) notation of the ColoredTextures technique.
Individual: AirQuality_Scalar_VS_3D_ColoedBallsTypes:
:output_viz some :Colord_Balls Facts:
:input_data :Scalar_Tensor_AQ :visual_attributes :Colored_Object_Opaque :output_location :Fixed_3D_ViewPort_Adjustable
Figure 9. Representation in Manchester (Protégé) notation of the ColoredBalls technique.
5.1.3 Examples of queries
Queries can be performed to select some relevant visualization techniques from some criteria. Figure 11gives examples of such queries. The first query (on the left) retrieves all described visualizationtechniques relevant for visualizing data in the field of air quality. The second query (on the right)retrieves all described visualization techniques (1) relevant for the visualization of numeric data in thefield of air quality and (2) having a layout technique localized in a terrain as a 2D surface.
5.2 Visualization techniques for enhancing the visibility of labels in 3D navigation maps
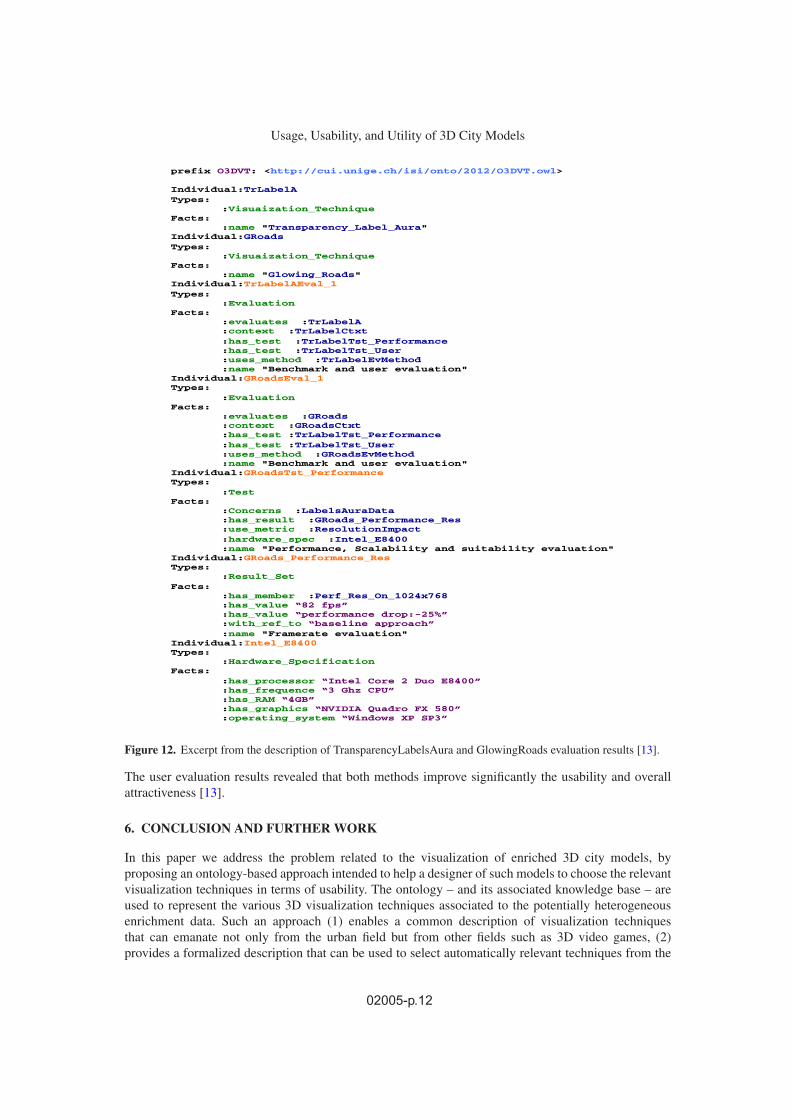
The techniques described in this section issue from [13] and have been developed for enhancing thevisibility of textual labels in 3D navigation maps as those labels can become occluded. Here is their
02005-p.10

European COST Action TU0801
Figure 10. Querying the knowledge base to get all the techniques responding to some criteria (in OWL).
Figure 11. Two techniques (TransparencyLabelsAura on the left, GlowingRoads on the right).
description:
– TransparencyLabelAura technique: it lets the label shine through occluding objects;– GlowingRoads technique: it lets the roads glow through the 3D environment.
For both techniques an evaluation has been performed; the user task is to follow an itinerary.These two techniques use the same data, which is an individual of the “Data_Description” concept
with a data type as a short text.For TransparencyLabelAura technique, the labels create a transparent region in the occluding
objects. This is represented as a change invoked by the output location used for this technique.For GlowingRoads technique the roads are glowing through the 3D world with a level of detailLOD = 1. The output location description of both techniques invokes changes in the geometry of themodel.
There are two tests related to the evaluation of these techniques.
1. The first test is a benchmark evaluation aiming to evaluate the performance scalability andsuitability for real-world scenarios. The benchmark results have concluded both techniquessuitable for real-world scenarios.
2. The second test is user-based evaluation aiming to evaluate the usability, attractiveness and noveltyof the approaches. This test is based on a user study method, which can be described as follows:
User study = test of the prototype + AttrakDiff questionnaire.
02005-p.11
Usage, Usability, and Utility of 3D City Models
prefix O3DVT: <http://cui.unige.ch/isi/onto/2012/O3DVT.owl> Individual:TrLabelA Types:
:Visuaization_Technique Facts: :name "Transparency_Label_Aura" Individual:GRoads Types:
:Visuaization_Technique Facts: :name "Glowing_Roads" Individual:TrLabelAEval_1 Types:
:Evaluation Facts:
:evaluates :TrLabelA :context :TrLabelCtxt :has_test :TrLabelTst_Performance :has_test :TrLabelTst_User :uses_method :TrLabelEvMethod :name "Benchmark and user evaluation"
Individual:GRoadsEval_1 Types:
:Evaluation Facts:
:evaluates :GRoads :context :GRoadsCtxt :has_test :TrLabelTst_Performance :has_test :TrLabelTst_User :uses_method :GRoadsEvMethod :name "Benchmark and user evaluation"
Individual:GRoadsTst_Performance Types:
:Test Facts:
:Concerns :LabelsAuraData :has_result :GRoads_Performance_Res :use_metric :ResolutionImpact :hardware_spec :Intel_E8400 :name "Performance, Scalability and suitability evaluation"
Individual:GRoads_Performance_Res Types:
:Result_Set Facts:
:has_member :Perf_Res_On_1024x768 :has_value “82 fps” :has_value “performance drop:-25%” :with_ref_to “baseline approach” :name "Framerate evaluation"
Individual:Intel_E8400 Types:
:Hardware_Specification Facts:
:has_processor “Intel Core 2 Duo E8400” :has_frequence “3 Ghz CPU” :has_RAM “4GB” :has_graphics “NVIDIA Quadro FX 580” :operating_system “Windows XP SP3”
Figure 12. Excerpt from the description of TransparencyLabelsAura and GlowingRoads evaluation results [13].
The user evaluation results revealed that both methods improve significantly the usability and overallattractiveness [13].
6. CONCLUSION AND FURTHER WORK
In this paper we address the problem related to the visualization of enriched 3D city models, byproposing an ontology-based approach intended to help a designer of such models to choose the relevantvisualization techniques in terms of usability. The ontology – and its associated knowledge base – areused to represent the various 3D visualization techniques associated to the potentially heterogeneousenrichment data. Such an approach (1) enables a common description of visualization techniquesthat can emanate not only from the urban field but from other fields such as 3D video games, (2)provides a formalized description that can be used to select automatically relevant techniques from the
02005-p.12
European COST Action TU0801
description of the data to display and from a set of specific criteria, taking in account the compatibility orincompatibility between techniques. We consider as hypothesis that the representation of the geometricobjects in the 3D CM are already done. There is also a link between the 3D CM data format and theenrichment information format. The proposed techniques for a specific 3D CM should not be incoherentwith its level of detail; otherwise we can state or activate the option that the visualization technique’simplementation can induce changes in the 3D CM.
As it is difficult to know in advance the usability of a technique in a particular context, evaluationsabout the use of the visualization techniques are also represented in the ontology. It is not a simple taskfor a 3D UI designer to choose the right evaluation method for testing the usability of his visualizationtechnique. At this stage of our research we are not intending to propose evaluation methods for eachtechnique. However this is possible using our methodology. We need only to add domain-based rulesabout evaluations on top of the descriptions of evaluation approaches that are available in the knowledgebase.
We began the evaluation of the ontology by formally representing several representative 3Dvisualization techniques. We plan to continue populating the knowledge base with more techniques.Although useful, evaluations about techniques may be inexistent, even for visualization techniquesfrequently used in 3D GIS. Thus we plan to perform by ourselves some evaluations that will be enteredinto the knowledge base. We also plan to define a user-friendly interface allowing the designer of a 3Dvisualization technique to describe his/her techniques using forms and to query the knowledge base bymeans of keywords and checklists.
The work described in this paper is part of the research “Designing and evaluating 3D knowledge visualizationtechniques for urban planning” funded by the Swiss “Secrétariat d’état à la recherche” (SER No C10.0150)in relation with the COST Action TU0801 “Semantic enrichment of 3D city models for sustainable urbandevelopment”.
References
[1] D. A. Bowman, E. Kruijff, J. J. LaViola, and I. Poupyrev. 2004. 3D User Interfaces: Theory andPractice. Addison Wesley Longman Publishing Co., Inc., Redwood City, CA, USA
[2] OGC 08-007r1 (2008) OpenGIS City Geography Markup Language (CityGML) EncodingStandard. Gröger G., Kolbe T.H., Czerwinski A., Nagel C. (eds), Open Geospatial ConsortiumInc, www.opengeospatial.org/standards/citygml, accessed February (2012)
[3] TU0801 (2008) Semantic Enrichment of 3D City Models for Sustainable Urban Development.Memorandum of Understanding, http://www.semcity.net/cms/index.php?page=reports, accessedFebruary (2012)
[4] Falquet, Gilles and Métral, Claudine and Teller, Jacques and Tweed, Aidan Christopher,eds. 2011. Ontologies in urban development projects. Advanced information and knowledgeprocessing, vol. 1. London: Springer
[5] H. Neale and S. Nichols: Designing and developing Virtual Environments: methods andapplications. Visualization and Virtual Environments Community Club (VVECC) Workshop,Designing of Virtual Environments (2001)
[6] R. Dieng, O. Corby, A. Giboin, M. Ribière: Methods and tools for corporate knowledgemanagement, International Journal of Human-Computer Studies, Vol. 51, Issue 3, September1999, Pages 567–598, ISSN 1071-5819, 10.1006/ijhc.1999.0281
[7] N. Guarino, M. Carrara and P. Giaretta: Formalizing Ontological Commitment In Proceedings ofNational Conference on Artificial Intelligence (AAAI-94), Morgan Kaufmann, Seattle, pp. 560–567 (1994)
02005-p.13
Usage, Usability, and Utility of 3D City Models
[8] A. S. Gao, J. Nick and F. R. Omer: Bringing semantics to visualization services. In: Advances inEngineering Software, Elsevier, Vol. 39, Issue 6, June (2008), pp. 514–520
[9] K.W. Brodlie, D.A. Duce, D.J. Duke, Visualization ontologies. Report of a workshop held atthe National e-Science Centre, 7-8 April 2004, www.nesc.ac.uk/esi/download.cfm?index=1685,accessed Mars (2012)
[10] A. Morell Pérez, C. Pérez Risquet, J. Marx Gómez : An Enhanced Visualization Ontology for aBetter Representation of the Visualization Process. In: ICT Innovation 2010, Communications inComputer and Information Science, M. Gusev and P. Mitrevski (Eds.), Springer-Verlag, BerlinHeidelberg, 2011, Vol. 83, Part 2, pp. 342–347
[11] M. Voigt, J. Polowinski: Towards a Unifying Visualization Ontology. Technical report, Institutfür Software and Multimediatechnik, Technische Universität Dresden, Germany, March (2011),ISSN: 1430-211X
[12] M. Voigt, S. Pietschmann, L. Grammel, K. Meissner: Context-aware recommendation ofvisualization components. In: eKNOW 2012, the Fourth International Conference on Information,Process and Knowledge Management, pp. 101–109 (2012)
[13] M. Vaaraniemi, M. Freidank, R. Westermann: Enhancing the visibility of labels in 3D navigationmaps. In: 7th 3D GeoInfo conference, 16–17 May 2012, Québec, Canada
[14] SimCity (1989) Official SimCity website: http://www.ea.com/simcity, accessed February(2012)
[15] Bazargan Harandi, K. (2011). Abstract Information Visualization in Interactive 3D VirtualEnvironments: Conceptualization and Usability Evaluation. Thèse de doctorat, Université deGenève, 2011, no. SES 747, Edition SES – Université de Genève, ISBN 978-2-88903-005-7
[16] M. M. Sebrechts, J. V. Cugini, S. J. Laskowski, J. Vasilakis, and M. S. Miller: Visualization ofsearch results: a comparative evaluation of text, 2D, and 3D interfaces. In Proceedings of the22nd annual international ACM SIGIR conference on Research and development in informationretrieval (SIGIR ’99). ACM, New York, NY, USA (1999)
[17] J. Nielsen and R. Molich. 1990. Heuristic evaluation of user interfaces. In Proceedings ofthe SIGCHI conference on Human factors in computing systems: Empowering people (CHI’90), Jane Carrasco Chew and John Whiteside (Eds.). ACM, New York, NY, USA, 249–256,DOI=10.1145/97243.97281
[18] D. Hix, H. R. Hartson. Developing User Interfaces: Ensuring Usability Through Product &Process, ISBN: 978-0-471-57813-0
[19] G. D. Abowd, A. K. Dey, P. J. Brown, N. Davies, M. Smith, and P. Steggles. 1999. Towards aBetter Understanding of Context and Context-Awareness. In Proceedings of the 1st internationalsymposium on Handheld and Ubiquitous Computing (HUC ’99), Hans-Werner Gellersen (Ed.).Springer-Verlag, London, UK, 304–307
[20] Q. Limbourg and J. Vanderdonckt: Comparing Task Models for User Interface Design In TheHandbook of Task Analysis for Human-Computer Interaction Mahwah: Lawrence ErlbaumAssociates (2004)
[21] B. Shneiderman: The eyes have it: A task by data type taxonomy for information visualization.In: VL ’96 : Proceedings of the 1996 IEEE Symposium on Visual Languages, Boulder, CO, USA,03–06 September (1996)
[22] OWL Working Group (2009) OWL 2 Web Ontology Language: Document Overview. Publisher:W3C Recommendation, http://www.w3.org/TR/owl2-overview/ accessed February (2012)
[23] Ed H. Chi: A Taxonomy of Visualization Techniques Using the Data State Reference Model. In:Proceedings of the IEEE Symposium on Information Vizualization 2000 (INFOVIS ’00). IEEEComputer Society, Washington, DC, USA, pp. 69–75 (2000)
[24] F. Tyndiuk: Référentiels Spatiaux des Tâches d’Interaction et Caractéristiques de l’Utilisateurinfluençant la Performance en Réalité Virtuelle. Thèse de doctorat no 1269, Université Bordeaux2, (2005)
02005-p.14

European COST Action TU0801
[25] M. Uschold and M. King. Towards a Methodology for Building Ontologies. In Workshop on BasicOntological Issues in Knowledge Sharing, held in conjunction with IJCAI-95, Canada, (1995)
[26] R. San José, J. L. Pérez, R. M. González-Barras : 3D Visualization of Air Quality Data. In:Reliability and Statistics in Transportation and Communication Conference (RelStat‘11), Riga,Latvia, 19–22 October (2011)
[27] Protégé (2005) The Protégé ontology editor and knowledge acquisitionsystem, Stanford Center for Biomedical Informatics Research, http://protege.stanford.edu/, accessed February (2012)
02005-p.15