an open-source sensor platform for analysis of group dynamics · an open-source sensor platform for...
TRANSCRIPT

An open-source sensor platform for analysis of groupdynamics
Master’s Thesis in Mechatronics
submittedby
Michael Hopfengartner
born February 11, 1995 in Pegnitz
Written at
Machine Learning and Data Analytics Lab (CS 14)Department of Computer Science
Friedrich-Alexander-Universitat Erlangen-Nurnberg (FAU)
Advisors: Oren Lederman (MIT), Robert Richer, Prof. Dr. Alex “Sandy” Pentland (MIT), Prof.Dr. Bjoern Eskofier
Started: May 30, 2018
Finished: November 30, 2018

ii

iii
Ich versichere, dass ich die Arbeit ohne fremde Hilfe und ohne Benutzung anderer als derangegebenen Quellen angefertigt habe und dass die Arbeit in gleicher oder ahnlicher Form nochkeiner anderen Prufungsbehorde vorgelegen hat und von dieser als Teil einer Prufungsleistungangenommen wurde. Alle Ausfuhrungen, die wortlich oder sinngemaß ubernommen wurden, sindals solche gekennzeichnet.
Die Richtlinien des Lehrstuhls fur Bachelor- und Masterarbeiten habe ich gelesen und an-erkannt, insbesondere die Regelung des Nutzungsrechts.
Erlangen, den 27. November 2018

iv

v
Ubersicht
Die Zusammenarbeit mehrerer Personen in Gruppen gewinnt in der heutigen Zeit immermehr an Bedeutung. Gruppenarbeit wird haufig bei Entscheidungsfindungsprozessen und fur dieLosung von komplexen Problemen eingesetzt. Die Forschung in diesem Bereich beschaftigt sichmit der Quantifizierung und Analyse des Verhaltens innerhalb und zwischen Gruppen. Durch denEinsatz von tragbaren elektronischen Geraten, wie beispielsweise sogenannten Badges, kann dieseQuantifizierung automatisiert und mit einer hohen Genauigkeit durchgefuhrt werden. Ziel dieserArbeit sind das Design und die Implementierung einer neuen Firmware fur die Badges des RhythmProjektes - ein Open-Source Projekt der Human Dynamics Group des MIT Media Labs. DieFirmware ist durch eine modulare und erweiterbare Architektur gekennzeichnet und kombiniertunterschiedliche Techniken. Dazu zahlen ein Filesystem, welches auf der Basis einer virtuellenSpeicherabstraktion sequentiell generierte Daten effizient speichert, eine Serialisierungsbibliothek,die einen plattformunabhangigen Austausch von strukturierten Daten ermoglicht, als auch einespezielle Technik zur Zeitsynchronisation, die Abweichungen der Oszillatorfrequenz kompen-siert. Außerdem wurde fur die Verifikation einzelner funktionaler Softwarekomponenten derApplikation eine automatisierte Testumgebung entworfen. Als Ergebnis detaillierter Analysen undspezieller Maßnahmen konnte der Energieverbrauch im Vergleich zur vorherigen Implementierungsignifikant reduziert werden. Aufgrund des hierarchischen und modularen Aufbaus sowie deshohen Grades an Abstraktion konnen die entwickelten Techniken auch in anderen Projekten undPlattformen integriert werden.

vi
Abstract
The collaboration of several people in groups is becoming more and more important nowa-days. Teamwork is often used for decision-making processes and for solving complex problems.Research in this area focuses on the quantification and analysis of behavior within and betweengroups. By using wearable electronic devices, such as badges, this quantification can be performedautomatically and with high accuracy. The goal of this work is the design and implementationof a new firmware for the badges of the Rhythm project - an open-source project of the HumanDynamics Group of the MIT Media Lab. The firmware is characterized by a modular and extensi-ble architecture and combines different techniques. These include a filesystem, which efficientlystores sequentially generated data based on a virtual memory abstraction, a serialization library,which enables a platform-independent exchange of structured data, and a time synchronizationtechnique, which compensates frequency deviations of the oscillator. In addition, an automatedtest environment was designed for the verification of individual functional software componentsof the application. As a result of detailed analysis and special measures, the power consumptioncould be significantly reduced compared to the previous implementation. Due to the hierarchicaland modular structure and the high degree of abstraction, the developed techniques can also beintegrated into other projects and platforms.

Contents
1 Introduction 1
2 Methods 52.1 System overview . . . . . . . . . . . . . . . . . . . . . . . . . . . . . . . . . . 5
2.1.1 Bluetooth Low Energy . . . . . . . . . . . . . . . . . . . . . . . . . . . 6
2.1.2 Badges . . . . . . . . . . . . . . . . . . . . . . . . . . . . . . . . . . . 7
2.1.3 Location beacons . . . . . . . . . . . . . . . . . . . . . . . . . . . . . . 9
2.1.4 Hubs . . . . . . . . . . . . . . . . . . . . . . . . . . . . . . . . . . . . 10
2.1.5 Server . . . . . . . . . . . . . . . . . . . . . . . . . . . . . . . . . . . . 11
2.2 Firmware architecture . . . . . . . . . . . . . . . . . . . . . . . . . . . . . . . . 11
2.2.1 Requirements . . . . . . . . . . . . . . . . . . . . . . . . . . . . . . . . 11
2.2.2 Modules overview . . . . . . . . . . . . . . . . . . . . . . . . . . . . . 14
2.3 Testing framework . . . . . . . . . . . . . . . . . . . . . . . . . . . . . . . . . 19
2.4 Data recording . . . . . . . . . . . . . . . . . . . . . . . . . . . . . . . . . . . 25
2.4.1 Proximity data . . . . . . . . . . . . . . . . . . . . . . . . . . . . . . . 27
2.4.2 Audio data . . . . . . . . . . . . . . . . . . . . . . . . . . . . . . . . . 28
2.4.3 Acceleration data . . . . . . . . . . . . . . . . . . . . . . . . . . . . . . 29
2.4.4 Battery data . . . . . . . . . . . . . . . . . . . . . . . . . . . . . . . . . 31
2.5 Data serialization . . . . . . . . . . . . . . . . . . . . . . . . . . . . . . . . . . 32
2.6 Data storage . . . . . . . . . . . . . . . . . . . . . . . . . . . . . . . . . . . . . 36
2.6.1 Virtual memory . . . . . . . . . . . . . . . . . . . . . . . . . . . . . . . 36
2.6.2 Filesystem . . . . . . . . . . . . . . . . . . . . . . . . . . . . . . . . . 37
2.6.3 Filesystem integration . . . . . . . . . . . . . . . . . . . . . . . . . . . 40
2.7 Data streaming . . . . . . . . . . . . . . . . . . . . . . . . . . . . . . . . . . . 41
2.8 Data exchange . . . . . . . . . . . . . . . . . . . . . . . . . . . . . . . . . . . . 42
2.8.1 Advertising . . . . . . . . . . . . . . . . . . . . . . . . . . . . . . . . . 42
vii

viii CONTENTS
2.8.2 Connection-based communication . . . . . . . . . . . . . . . . . . . . . 432.8.3 Communication protocol . . . . . . . . . . . . . . . . . . . . . . . . . . 442.8.4 Clock synchronization . . . . . . . . . . . . . . . . . . . . . . . . . . . 46
3 Results 493.1 Serialization performance . . . . . . . . . . . . . . . . . . . . . . . . . . . . . . 493.2 Transmission speed . . . . . . . . . . . . . . . . . . . . . . . . . . . . . . . . . 513.3 Clock synchronization . . . . . . . . . . . . . . . . . . . . . . . . . . . . . . . 533.4 Audio data . . . . . . . . . . . . . . . . . . . . . . . . . . . . . . . . . . . . . . 563.5 Power consumption . . . . . . . . . . . . . . . . . . . . . . . . . . . . . . . . . 58
4 Discussion 614.1 Serialization performance . . . . . . . . . . . . . . . . . . . . . . . . . . . . . . 614.2 Transmission speed . . . . . . . . . . . . . . . . . . . . . . . . . . . . . . . . . 634.3 Clock synchronization . . . . . . . . . . . . . . . . . . . . . . . . . . . . . . . 644.4 Audio data . . . . . . . . . . . . . . . . . . . . . . . . . . . . . . . . . . . . . . 664.5 Power consumption . . . . . . . . . . . . . . . . . . . . . . . . . . . . . . . . . 674.6 Filesystem . . . . . . . . . . . . . . . . . . . . . . . . . . . . . . . . . . . . . . 68
5 Conclusion 69
A Glossar 73
B Patents 77B.1 US7216088 (B1) . . . . . . . . . . . . . . . . . . . . . . . . . . . . . . . . . . 78B.2 WO2010099488 (A1) . . . . . . . . . . . . . . . . . . . . . . . . . . . . . . . . 79B.3 US10049336 (B2) . . . . . . . . . . . . . . . . . . . . . . . . . . . . . . . . . . 80
List of Figures 81
List of Tables 83
Bibliography 85

Chapter 1
Introduction
The cooperation of several people within a group is becoming more and more important nowadays.A strong trend can be observed from individual-based work to teamwork. This is especiallyrelevant for problem solving or decision-making tasks [Wuc07]. Also in companies, teamwork isoften necessary to efficiently handle issues [Dre96]. According to a survey, executives spend onaverage up to 40-50% of their working time in meetings [Doy93]. Teams are frequently deployedto work on problems or to make decisions which, due to their complexity, exceed the abilitiesor knowledge of a single person or to quickly find a solution to a certain problem. In addition,the interactions within the group provide individuals with new perspectives and lead them tonew solution strategies [Lev15]. Futhermore, it is assumed that the results of teamwork are morecreative and of a higher quality than results of individual-based work. One reason for this is thecontinuous mutual quality control that takes place during the collaboration [Nah94]. Although thepotential of teamwork is immense, it is often not completely exhausted. Reasons for this are forexample conflicts within the group [Jeh01], individuals who do not contribute to the group dueto their insufficient self-confidence [Tan95] or generally the consideration of too few differentpoints of view [Why91]. This leads to the question which methods can be applied to increase theproductivity and performance of groups. In order to answer this question, the behavior within andbetween the groups has to be understood and analyzed. In social and organizational science, thesocial interaction and behavior of individuals within the group as well as the behavior betweendifferent groups are examined [Car02] [Gre03]. Research in this area is broadly diversified: fromdeveloping methods to improve team performance [Sam18] [Cal16] [DiM04] [Les09], to theoptimization of workspaces to enhance communication between employees [Bro14] [Str12], tothe prediction of the behavior of individuals and groups [Pen10]. In order to investigate groupbehavior, techniques that accurately quantify group dynamics must be applied.
1

2 CHAPTER 1. INTRODUCTION
Group dynamics describe the behavioral and social processes within a group and betweengroups, such as face-to-face communication of members [For18]. Pentland found that there existsa relationship between group dynamics and group performance, especially the communicationpatterns are a strong indicator for the success of a team [Don10] [Pen12]. In addition, it was shownthat the group performance can be influenced by giving feedback to the group [Nad79]. There areseveral approaches to quantify group dynamics and to influence group performance through real-time feedback. In [Les09] a virtual group meeting system is presented. It is based on the analysisof web-chat messages between the participants and gives real-time feedback on the engagementand word choice of the users to influence their behavior. Calacci et al. [Cal16] developed an onlinecommunication platform called Breakout that analyzes visual and audial data in real-time, such asturn-taking and speech overlap. The Meeting Mediator visualization from Kim et al. [Kim08] isused to provide real-time feedback to the users. This tool displays the participants as nodes and aball in the center that moves towards the conversation dominating user. Another automated onlinecollaboration system with integrated feedback assistent developed by Samrose et al. is calledCollaboration Coach [Sam18]. In addition to acoustic parameters, for instance turn-taking andspeech overlap, visual parameters, such as emotional valence and shared smiles of the participants,are analyzed. DiMicco et al. showed that the behavior of people in a discussion can be influencedby displaying the participation in the discussion based on recorded audio data. Especially thedominating members reduced their participation because of the displayed feedback [DiM04]. In apatent from Chappel et al. (Appendix B.1) a statistical approach to analyze the interdependenciesof team members is described. These quantified interdependence relationships can be used bythe team manager to optimize the collaboration between team members. Brown et al. [Bro14]deployed active radio-frequency identification (RFID) devices from Cattuto et al. [Cat10] tomeasure the proximity between employees during the work. These data are used to optimize thearchitecture of workplaces to enhance the communication between employees. To measure theteam performance in call centers and to correlate it with the face-to-face interactions betweenemployees, Watanabe et al. [Wat14] used electronic wearable devices from Wakisaka et al.[Wak09]. These devices record the proximity to other employees with infrared (IR) transceiversand the movement of the employees with an accelerometer. The same devices were used tomeasure the influence of interventions to enhance social networks of older people living in thesame community [Mas17]. Herman et al. own a patent (Appendix B.2) for a system that uses anelectronic portable system to track the proximity between patients, visitors, nurses and doctorsin hospitals. The history of proximity data can be used to analyze and minimize the spread ofdiseases. Another system that tracks human interactions, patented by Olguin et al. (Appendix

3
B.3), includes a wearable electronic badge that is equipped with different environmental sensorsto measure social interactions.
The Human Dynamics group of the MIT Media Lab has developed different frameworks forthe analysis and feedback of social interactions and behavior as well as a number of differentelectronic wearable devices, called badges [Cho02] [Olg06] [Olg10] [Led16a] [Led18]. Throughthe deployment of wearable devices, data for the analysis of social interactions can be automaticallyrecorded from many probands simultaneously and with high accuracy. A further advantage ofthis method compared to conventional methods for measuring social behavior, such as surveys,is that the behavior of the probands is hardly influenced by the badges [Olg09]. Normally theconscious perception of the badges disappears within an hour [Pen12]. The electronic wearablebadges are optimized to collect social interaction data, such as the absolute location, physicalproximity to other people and vocal activity. In a second step, the recorded data are analyzedto obtain communication patterns of the participants during meetings, workshops, discussionsor events. It should be noted that comparable electronic devices on the market are not suitablefor this application: The open-source platform RuuviTag [Ruu18] does not have an integratedmicrophone for recording voice activity, which is necessary for the analysis of communicationpatterns. Another device from Nordic Semiconductor is called Thingy:52 [Nor17]. It includesseveral sensors, such as an accelerometer, a gyroscope, a humidity- and temperature-sensor aswell as a microphone. The disadvantage of this device is the small non-volatile memory (NVM)in which the recorded data must be stored for later transmission.
The latest badge project of the Human Dynamics group is called Rhythm [Led18]. It is anopen-source project that includes the source code of all system components and tools, as well asthe schematic and layout of the electronic badges. To facilitate the setup of the system and thedevelopment environment, Docker containers are used [Led16c]. Docker containers are isolated,lightweight operating system virtualizations that contain all dependencies of an application,allowing easy porting of applications between different platforms [Mer14]. One important pointis that the badges have to meet requirements such as low energy consumption and efficient datastorage in order to maximize the runtime of the system. Furthermore, especially by using manybadges in a small area, fast data transfer to the central data receivers is necessary, as otherwisebadges that cannot transmit their data in time will have to overwrite them.
The purpose of this work is the reimplementation and extension of the existing sensor platformfirmware. Furthermore, a testing framework is implemented to facilate the embedded softwaredevelopment and to achieve software with higher quality. The focus is on the modularity, testabilityand maintainability of the new firmware in contrast to the previous one, which has mutual

4 CHAPTER 1. INTRODUCTION
dependencies and no clearly defined interfaces between different functional units. Therefore,a hierarchical modular approch for the architecture of the firmware, which is characterized bya high degree of abstraction, is applied. Due to this high degree of generic abstraction, thedeveloped techniques might be applied in other projects and on different hardware platforms aswell. The developed techniques include a filesystem that enables simple and efficient storageof data in NVMs and a serialization library that converts structured data into an efficient bytesequence representation. This serialization library is used, for example, to provide a flexiblecommunication protocol. Additionally, several methods to minimize the power-consumptionwere applied. Furthermore, a technique for accurate time synchronization was developed andmovement detection based on an accelerometer was incorporated. The goal of this work is notonly to optimize the previous firmware, but also to provide a structured basis for future softwaredevelopments. Since this project is an open-source project available on GitHub [Led16c], it canalso serve as a reference project for modular embedded software development that allows simpletesting and verification of the functionality of individual units.
The work is organized as follows: In chapter 2 the different system components, the testingframework, the architecture of the firmware as well as the developed methods for data recording,data serialization, data storing, data streaming and data exchange are explained. Chapter 3covers the evaluation and results of the applied methods. In chapter 4 the results and methodsare discussed and compared to the previous firmware. Finally, the most important results aresummarized in Chapter 5 and an outlook for the future development of the system is given.

Chapter 2
Methods
The purpose of the thesis is the optimization and extension of the existing sensor platform withrespect to modularity and maintainability. This chapter provides a detailed description of the data-recording system and introduces different methods and tools used to achieve the objective. First,the setup of the system is presented, afterwards the architecture of the new firmware is introduced,followed by the explanation of the testing framework. Finally, the developed techniques for datarecording, serialization, storage and exchange are described in more detail.
2.1 System overview
The open-source Rhythm project [Led18] encompasses electronic wearable badges and onlinetools to analyze social interaction between groups and group members.
1
2
3
5
7
8
6
4
Figure 2.1: Rhythm badge. The customhardware platform that collects data fromdifferent environmental sensors.
No. Description1 2x Status LEDs
2 Power switch
3 BMD-200-B BLE-module (Rigado)
4 3V coin cell battery
5 Analog microphone (Knowles)
6 Analog filter + amplification circuit
7 M95M02 external EEPROM
8 LIS2DH12 3-axis accelerometer
Table 2.1: Badge components. The tablelists the most important components of thebadge.
5

6 CHAPTER 2. METHODS
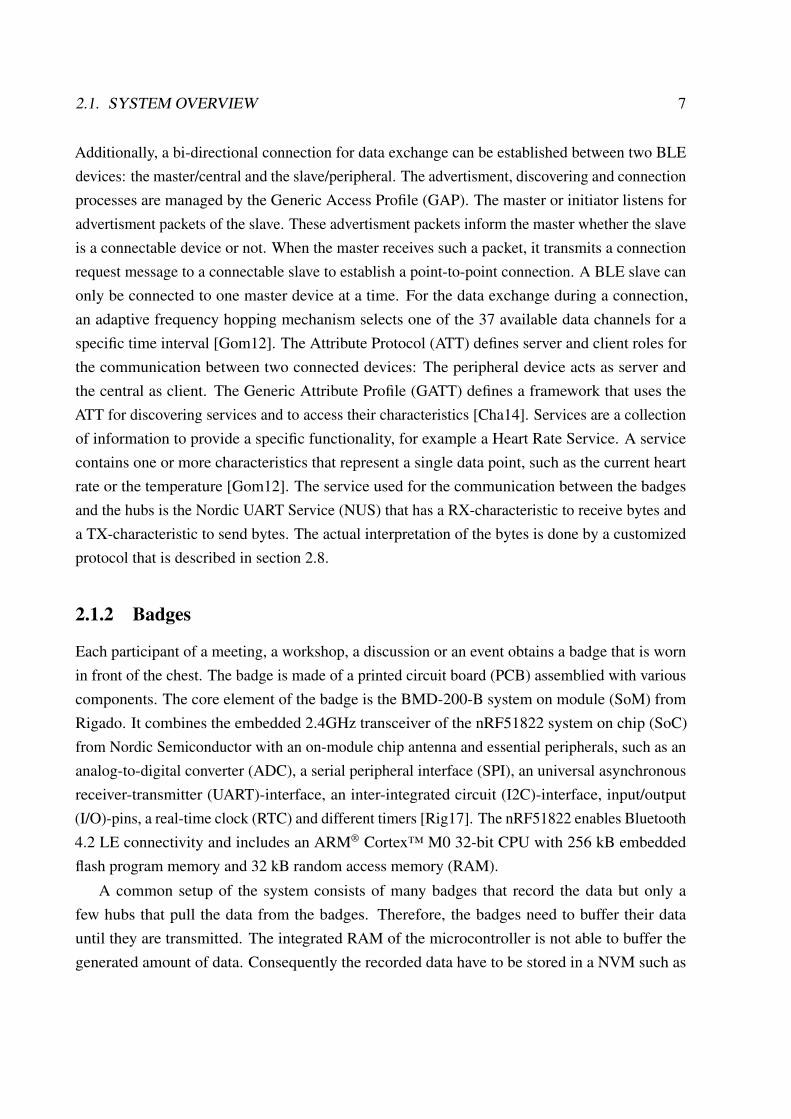
The badge shown in Figure 2.1 fits in a standard plastic name tag holder and is worn in frontof the participant’s chest. It is used to record different types of data in order to analyze the socialinteraction of the participant. In addition to vocal activity, proximity to other badges, movementand location can be measured. The most important components of the badge are listed in Table 2.1.The Rhythm framework (Figure 2.2) combines badges with other devices and tools to examinedifferent types of social interactions and meetings. 3
Fig. 1: The Rhythm framework. Measuring co-located informal interactions uses electronic badges as data collectors, locationbeacons for localization, and hubs for transferring the data from the badges to the server. Measuring Co-located formal meetingsrequires electronic badges and a mobile hub. Measuring distributed meeting makes used of on-line clients. Measuring mixed-meetings uses both the badges sub-system and on-line clients.
(a) (b)
Fig. 2: Components of the badge sub-system. A Rhythm Badgein a plastic holder, worn around the neck (Figure 2a) andan example of the real-time visualization in the mobile hubFigure 2b.
audio cannot be re-generated from the stored samples. Thisdata is used for measuring communication patterns.
A multi-step voice activity detection (VAD) algorithm isthen applied to the raw data. To reduce noise, we compute thepower of each badge’s audio signal over a sliding windowusing Equation 1, where Pn is the power of signal x atsample n, and where w is the window size. We set w equalto one minute in our experiments. We use an experimentally
set threshold on this signal to determine if a participant isspeaking. If more than one active speaker is detected for agiven sample n in a group, we consider only the speaker withthe highest signal power as speaking. This approach assumesthat groups have a single speaker at any given time, but italso makes our speech detection more robust to false positivesfrom background noise or the attenuated speech of nearbyparticipants.
Pn =1
w
n∑
i=n−w+1
x2i (1)
To determine proximity to other badges and beacons, badgesscan for nearby Bluetooth devices every sixty seconds, andrecord the RSSI values of each device. We found that a signalstrength of -59dB produced the best results to identify pairsof badges that are up to four feet apart.
The Rhythm badges can run for five to six days on a singlecharge, and can collect several hours of vocal activity andproximity data before needing to wirelessly sync to a hub.Hubs receive transmitted data from badges, transfer it to aback-end server offsite, and monitor badges’ status.
B. Measuring Co-Located Formal Meetings
Scheduled meetings are another common kind of face-to-face interaction in co-located spaces. The data from these meet-ings is similar to the data presented in the previous section,but it usually describes longer and more formal interactions.
Here, we use the same badges and a mobile app as a hub.In the mobile app, the members can see which badges arein range, add relevant badges to the meeting, and collect data
This article has been accepted for publication in IEEE MultiMedia but has not yet been fully edited.
Some content may change prior to final publication.
Digital Object Identifier 10.1109/MMUL.2018.112135958 1070-986X/$26.00 2018 IEEE
Figure 2.2: Rhythm framework [Led18]. The Rhythm framework consists of different compo-nents: The badges worn by the participants record the required data for the subsequent analysis.Location beacons are used to provide location information. The recorded data of the badges areretrieved by hubs and/or mobile hubs and sent to a backend server. Finally, the server aggregatesand analyzes the data. Additionally, a visual frontend for real-time feedback can be used.
2.1.1 Bluetooth Low Energy
The communication between badges and hubs is realized with Bluetooth Low Energy (BLE).BLE is a short-range, low-power wireless communication technology developed by the Blue-tooth Special Interest Group and specified in the Bluetooth 4.0 standard [Raz15]. The 2.4 GHzIndustrial Scientific Medical (ISM) band is divided into 40 channels with a channel spacing of2 MHz. A BLE device uses three of these channels for periodical broadcast of advertismentpackets. A BLE device that only receives data through the three advertisment channels is calledscanner. In Bluetooth 4.2 the number of bytes for an advertisment packet is limited to 31 [Raz15].
2.1. SYSTEM OVERVIEW 7
Additionally, a bi-directional connection for data exchange can be established between two BLEdevices: the master/central and the slave/peripheral. The advertisment, discovering and connectionprocesses are managed by the Generic Access Profile (GAP). The master or initiator listens foradvertisment packets of the slave. These advertisment packets inform the master whether the slaveis a connectable device or not. When the master receives such a packet, it transmits a connectionrequest message to a connectable slave to establish a point-to-point connection. A BLE slave canonly be connected to one master device at a time. For the data exchange during a connection,an adaptive frequency hopping mechanism selects one of the 37 available data channels for aspecific time interval [Gom12]. The Attribute Protocol (ATT) defines server and client roles forthe communication between two connected devices: The peripheral device acts as server andthe central as client. The Generic Attribute Profile (GATT) defines a framework that uses theATT for discovering services and to access their characteristics [Cha14]. Services are a collectionof information to provide a specific functionality, for example a Heart Rate Service. A servicecontains one or more characteristics that represent a single data point, such as the current heartrate or the temperature [Gom12]. The service used for the communication between the badgesand the hubs is the Nordic UART Service (NUS) that has a RX-characteristic to receive bytes anda TX-characteristic to send bytes. The actual interpretation of the bytes is done by a customizedprotocol that is described in section 2.8.
2.1.2 Badges
Each participant of a meeting, a workshop, a discussion or an event obtains a badge that is wornin front of the chest. The badge is made of a printed circuit board (PCB) assemblied with variouscomponents. The core element of the badge is the BMD-200-B system on module (SoM) fromRigado. It combines the embedded 2.4GHz transceiver of the nRF51822 system on chip (SoC)from Nordic Semiconductor with an on-module chip antenna and essential peripherals, such as ananalog-to-digital converter (ADC), a serial peripheral interface (SPI), an universal asynchronousreceiver-transmitter (UART)-interface, an inter-integrated circuit (I2C)-interface, input/output(I/O)-pins, a real-time clock (RTC) and different timers [Rig17]. The nRF51822 enables Bluetooth4.2 LE connectivity and includes an ARM® Cortex™ M0 32-bit CPU with 256 kB embeddedflash program memory and 32 kB random access memory (RAM).
A common setup of the system consists of many badges that record the data but only afew hubs that pull the data from the badges. Therefore, the badges need to buffer their datauntil they are transmitted. The integrated RAM of the microcontroller is not able to buffer thegenerated amount of data. Consequently the recorded data have to be stored in a NVM such as

8 CHAPTER 2. METHODS
the embedded flash-memory. To minimze the loss of data when the badge records data for along time without contact to a hub, the NVM is increased by using an external electrical erasableprogrammable read-only memory (EEPROM). The M95M02-DR from STMicroelectronics isan surface-mounted device (SMD) with 256 kB of EEPROM and is controlled by an SPI busmaster [STM18]. Flash-memory and EEPROM differ in the way data are erased and stored, intheir speed as well as in the maximum number of store/erase cycles. In flash-memory a wholepage has to be erased before words can be stored to this page. The built-in flash-memory of thenRF51822 provides 256 pages with a page size of 1024 bytes. Due to the word size of 32 bits,the minimum number of bytes that can be stored is four. The time required to erase a page is22.3 ms and 46.3 µs to store a word. The number of store/erase cycles is limited to 20,000 cycles[Nor16a]. On the other hand, the incorporated EEPROM allows to erase and store single bytes.When a store operation is started, the affected bytes are erased automatically. The EEPROM chipprovides 1024 pages with a page size of 256 bytes and requires 10 ms for storing one byte or awhole page. In contrast to flash-memory, the number of 4 million store/erase cycles is significantlyhigher for EEPROM [STM18]. Due to the limited resources, the different types of data have tobe stored efficiently in the NVMs. Therefore, a flexible filesystem that is decribed in section 2.6was developed. This filesystem requires an uniform storage interface that allows to store and readsingle bytes. In order to meet this requirement an abstraction layer was implemented that enablesthe application to address the EEPROM as well as the flash-memory on byte level.
During the activation of the badge a two bytes identification number (ID) and a one byte groupnumber is assigned to distinguish between different badges and their membership to differentgroups/projects. In addition to the ID and the group number, the supply voltage, the medium accesscontrol (MAC) address and status flags are advertised by each badge. The proximity to otherbadges can be determined through scanning for surrounding Bluetooth devices. When a Bluetoothdevice is discoverd, the received signal strength indicator (RSSI) value is reported. The RSSIvalue is proportional to the received signal strength [Fav07]. Based on this value, the distance tothe discovered device can be approximated with a radio propagation model [Xu10][Jia14][Jia09].After the received advertising packet is decoded, the group membership is checked to ignoreunrelated badges. To save storage space, the ID of the discovered device is stored instead of the6-byte MAC address.
To record vocal activity, the analog microelectromechanical system (MEMS) microphoneSPU0414HR5H-SB from Knowles is incorporated. It is a high-performance, low-power acousticsensor with an analog output pin [Kno12]. The output signal of the microphone is amplified andlow-pass filtered by an external operational amplifier. The resulting signal is routed to an ADC

2.1. SYSTEM OVERVIEW 9
pin of the BMD-200-B. An external voltage regulator (LP2985) supplies the microphone andamplification circuit with 1.8 Volts.
Moreover, the ultra-low-power, three-axis accelerometer LIS2DH12 from STMicroelectronicsis integrated to detect and record movement. The accelerometer is configured via the SPI busand supports various operating modes, datarates and the capability to generate interrupts whenpreconfigured events, such as free-fall or motion, are detected. Additionally, the accelerometerhas a built-in 32-level first-in first-out (FIFO) buffer for the acceleration data. This feature can beused to reduce the reading frequency of the SPI bus master because up to 32 data points can beretrieved with only one SPI transfer [STM17].
The power supply of the badge is provided by a coin cell and can be turned on/off by anexternal power switch. For status indication and signaling a green and a red light-emittingdiode (LED) are integrated.
2.1.3 Location beacons
An important parameter for the analysis of social interaction data is the absolute location of thepeople wearing a badge. To measure the absolute location in a room or a building, differentapproaches can be applied on basis of the RSSI value received from location beacons. Locationbeacons are stationary mounted devices with known position and periodically transmit a uniquelyassignable data packet. The badges described in section 2.1.2 or iBeacons can be configured toact as location beacons by assigning an ID greater or equal to 16,000.
Several localization methods can be used. The naive method is to assign a person to the closestlocation beacon [Led18]. Another potential localization technique used by Yang et al. [Yan12] isRSSI fingerprinting. This approach requires a map of the building and is divided into two steps.In the first step, RSSI values are recorded at different positions of the map and stored togetherwith the position. In a second step, where the actual position should be determined, the currentlyrecorded RSSI values are matched with the RSSI values of the first step to obtain the most likelyposition. A further feasible method for localization based on RSSI values is trilateration [Shc14].On the basis of a radio propagation model, the distance to the location beacons can be estimated.When the distance to at least three of them is known, the absolute position in a two-dimensionalmap can be computed with trilateration.
Due to the limited NVM, the different devices discovered in a Bluetooth scan have to befiltered according to their relevance. Location beacons and badges with a high RSSI value aremore important than badges with a low RSSI value. This prioritization is accomplished by asorting mechanism that is described in section 2.4.

10 CHAPTER 2. METHODS
2.1.4 Hubs
Hubs are used to control, activate and retrieve the recorded data from the badges. There aretwo different types of hubs used in the project. A Python based implementation and a mobilehub application. In addition to the actual badge control and data request, the mobile hub can beconfigured as a real-time feedback visualization tool that is shown in Figure 2.3. The so calledRound Table-visualization displays the participants of a meeting around a round table and a greenfilled circle which is connected to the individual participants by a line. The circle and the linesrepresent the partiticipation of each user [Led18]. The implementation of the mobile applicationcan also be found on GitHub.
Figure 2.3: Mobile hub. [Led18]. The mobile application that can act as hub and as real-timevisualization tool.
The Python based implementation of the hub software is deployed on a Raspberry Pi witha BLE interface. The code is wrapped in a Docker container to simplify the installation andsetup. There are two operating modes of the Python based hub: Standalone and server mode. Instandalone mode only one hub is active. It retrieves a list of available badges from a local file.After the activation of the available badges, the received data are also stored in local files. Inserver mode, one or more hubs communicate with a server that manages a list of available badges.In this setup, the received data from the badges are forwarded to the server where the data areprocessed in a second step. In a setup with multiple hubs, it is essential to synchronize the localclock of the hubs by using the Network Time Protocol (NTP) [Led16b].

2.2. FIRMWARE ARCHITECTURE 11
2.1.5 Server
After the recorded data of the platform are stored on the server, a server-side application processesthe data in real-time. This analytics engine analyzes the different data and generates statisticsabout the communication behavior and pattern of the participants. The real-time computed datacan be retrieved via application programming interfaces (APIs). In addition, the server providesmonitoring information about the functionality of system components such as badges, locationbeacons and hubs.
2.2 Firmware architecture
The main topic of this work is the reimplementation of the badges’ firmware. The firmwareshould be optimized for modularity, extensibility and maintainability. As programming languageC is used. C is a high-level programming language that is often applied for the programming ofembedded systems with limited resources. It allows the developer to interact with the hardware inan easy way and the code generated by the C compilers is in general very efficient [Bar06]. Thissection describes the requirements of the firmware as well as its architecture and the interaction ofthe different modules.
2.2.1 Requirements
The badge offers the possibility to record the following data: the audio signal from the microphone,the RSSI values of surrounding Bluetooth devices, the battery voltage, the raw acceleration dataand interrupt events generated by the accelerometer when a predefined acceleration threshold isexceeded. Due to the diversity of these data sources an appropriate and efficient way to store thedatasets in the NVMs is needed. Therefore, a filesystem with separated partitions for each datasource was implemented. To simplify the implementation of the filesystem, a single interfaceto interact with the storage is required. The flash-memory only supports the storing of words (4bytes), not single bytes, and the associated flash pages have to be erased before the words can bestored to the flash cells. In contrast to this, the EEPROM offers the possibility to store data at bytelevel and prevents the application from erasing the EEPROM cells before storing to them. As aresult, a uniform, easy to use storage interface was developed that combines the flash-memoryand the EEPROM to one virtual memory with byte level access.
Data handling consists of two steps: sampling, which is the recording of data, and processing,which includes, for example, sorting and the storage of the recorded data. The processing step

12 CHAPTER 2. METHODS
requires closed data units. Therefore, the sampled data is splitted into data chunks with a certainsize. Each data chunk consists of a header and the actual data points. The header containsinformation about the chunk, such as a timestamp and how many data points are included in thischunk. An efficient mechanism to decouple the data sampling from the data processing is neededbecause the data processing, such as storing, could be a time-consuming procedure and shouldnot influence or delay the data sampling. Therefore, a so called chunk-FIFO was developed toallow an efficient data sampling and to decouple data sampling from data processing.
Before any type of structured data, for instance a chunk of audio data, can be stored tothe NVMs via the filesystem, the structured data must be serialized or encoded. The result ofserialization is a sequence of bytes representing the structured data. In C a sequence of bytes canbe expressed through a byte-array. This serialization process is crucial for the efficiency of datastorage. The less bytes are required to represent the structured data, the more data can be storedin the NVMs. To reconstruct structured data from a serialized byte sequence, deserialization ordecoding has to be applied. The process of de-/serialization has to be generic to facilitate thedeclaration and use of new structured data types. Otherwise the developer has to implement ade-/serialization procedure for every type of data.
Another application of the serialization and deserialization procedure is the data exchangebetween the badges and the hubs. As described in the previous section, the Nordic UART Serviceis used for the data exchange between the devices. This BLE service allows the transmissionof raw bytes that have to be interpreted by another instance such as a data exchange protocol.Ultimately, a protocol is nothing else than a description of how to interpret bytes. The datarepresentation for storing and transmission does not have to be equal. One reason for this is thatdifferent protocol versions can have different data representations. Therefore, the representationof data that are stored on the badge is independent from the data representation of the protocol toprevent compatibility problems.
There are many different techniques to represent data structures or objects and to serializethem for transfer or storage. The Extensible Markup Language (XML) defines a language for datarepresentation and serialization in a human- and machine-readable format. The representationthat is produced during the serialization has usually a larger size compared to other serializationtechniques such as the JavaScript Object Notation (JSON) due to redundant tags in XML. JSONrepresents data in the human- and machine-readable object notation of JavaScript. It is a popularalternative to XML because of its better readability and smaller serialized representation. Anotherserialization technique developed by Google is Protocol Buffers. On the basis of a predefinedschema, classes and functions to serialize and deserialize structured data are generated by the

2.2. FIRMWARE ARCHITECTURE 13
Protocol Buffers compiler. It is characterized by a small binary representation of the data and afast serialization. The mentioned techniques support various programming languages, such asC++, Java and Python [Mae12]. As part of this work, a serialization library called Tinybuf wasimplemented. It is orientated at Google’s Protocol Buffers library. Tinybuf was developed toovercome some drawbacks of Protocol Buffers: High RAM allocation for the serialized message,large overhead produced by additional field identifiers and incompatibility with the previousprotocol implementation. Tinybuf uses a parser to analyze a schema file with the definition ofdata structures and generates source code for the programming languages C and Python. It isoptimized for efficient data serialization to enable an effective data storage and transmission. TheTinybuf library is described in section 2.5.
Testing plays an important rule during the development of software. Implementation errorscan lead to unpredictable behaviors and complete system failures which are unacceptable inapplications that are deployed for instance in airplanes or cars [Des06]. Although the firmwarefor the badges is not as critical as applications for airplanes, it is necessary to verify the correctbehaviour of the implemented software. There are two main concepts to verify the correctness ofsoftware components: Static analysis and dynamic testing. Static analysis can be performed byhumans or by automated static analysis tools. Humans can apply techniques such as desk checkingand code walkthrough to detect implementation bugs [Des06]. In general, static analysis tools areapplied directly to the source code to be checked, not to the compiled or executable binary. Thesetools are established in the development of applications with high security requirements [Che04]or in safety-critical systems for instance in the automotive and aerospace industry [Bla03]. Onthe other hand, dynamic testing methods actually run the code against predefined test cases toverify its functionality: The code has to produce the results that are expected by the test cases.For instance, unit, regression and integration tests are types of dynamic testing. Unit tests consistof a set of independend test cases that verify the functionality of small functional units, such asfunctions or modules [Ham04]. Regression tests ensure that an already existing functionality isnot influenced when the code is changed due to bug fixes or code extension. Integration tests focuson the interaction between multiple components of the system to verify that these componentswork together as specified [Des06].
In this work, a dynamic testing framework based on Google Test [Goo08a] was developed toverify the functionality of the implemented modules. The testing framework combines Google Testwith a code coverage analysis tool and the capability to simulate interrupts to test the asynchronousparts of the code. The framework is described in section 2.3.

14 CHAPTER 2. METHODS
2.2.2 Modules overview
This section explains the general module interaction and the main implementation concepts that areused. The functionality of the application can be divided into the following individual functionalunits: Recording, storage, streaming and exchange of data. Each of these units consists of one oremore interacting modules. Beside these main functional units, additional modules are required forthe correct operation of the application and to facilitate the development. An instance that providesreliable time basis is such an additional module. Accurate timestamps are needed to assign thecorrect time to a data chunk. This is neccessary to combine and correlate the data recorded fromdifferent badges in a second step. Furthermore, a timeout mechanism was implemented that calls atimeout handler function if a predefined time interval elapses. The mechanism can be deferred bycalling a reset function for the timeout. One application of the timeout mechanism is, for example,the automatic stop of data recording after a predefined interval if no connection between thebadge and a hub has been established within this interval. Another crucial aspect for the correctbehavior of the badge is to ensure the proper operation of the hardware (HW). Therefore, a selftestmodule provides the capability to test selected peripheral components, such as the EEPROM, theflash-memory, the microphone, the battery measurement and the accelerometer. The incorporatedLEDs signal the testing process and indicate an error if necessary. For development and testpurposes, the UART-interface can be enabled manually by using the corresponding compiletarget in the Makefile. Via the UART-interface the badge can communicate with a serial monitorsuch as Cutecom for debug or logging purposes. Additionally, commands can be sent via theUART-interface to the badge to perform specific actions, for example restarting the badge.
The programming paradigm used for the application is an event-driven approach. Event-drivensoftware architectures are based on the processing of events. When an event, such as a timerevent or an I/O pin interrupt, occurs, a registered callback function is invoked to handle theevent [Dab02]. The callback function is executed in a predefined priority context and suspendslower priority contexts such as the main context that has the lowest context priority. In general,the execution time of callback functions has to be very short to minimize the delay of lowerpriority contexts or to prevent the loss of new callbacks with the same or lower priority. Thenumber of available priority levels for the application depends on the HW. Nordic Semiconductorprovides a software development kit (SDK) that abstracts the HW-interfaces in drivers, includesuseful libraries and simplifies the usage of the Bluetooth connectivity via a so called SoftDevice.SoftDevices are precompiled and linked binary software components with an embedded BLEprotocol stack. The SoftDevice type S130 is used for the badges. This SoftDevice type enablesa BLE application to act as central, peripheral, broadcaster or observer device. The latest SDK

2.2. FIRMWARE ARCHITECTURE 15
version that supports the incorporated nRF51822 chip is v12.3.0 [Nor18a]. The SDK containstwo modules that are crucial for the previous described event-driven programming paradigm:The app-timer and the app-scheduler module. The app-timer module uses the RTC to generateinterrupts or events at configurable time intervals. These events are handled by a previouslyregistered callback function. The callback functions are executed in a low priority context toenable the handling of higher priority events in the meantime. As already mentioned, it is crucialthat the time for the execution of callback handlers/functions is short. There are cases, for examplewhen an event triggers a storage operation, where the time required for the callback function wouldbe too long. The app-scheduler module elimates this problem by transferring the execution fromthe callback context to the main context. The concept of the scheduler is based on an event queue.Events are inserted into the scheduler FIFO queue. The main context processes the events fromthe queue by deleting them and calling the corresponding handler functions. Another applicationof the scheduler is the postponement of functions that cannot be executed because the requiredresources are currently not available. Due to this event-driven approach, the main function that isinvoked at application-start only consists of initialization functions and the loop that is shown inFigure 2.4.
while(1) { app_sched_execute(); // Executes the events in the scheduler queue sd_app_evt_wait(); // Sleeps until an event/interrupt occurs }
Figure 2.4: Main loop. The main loop with scheduler execution and sleep function.
The app sched execute() function reads out available events from the scheduler queue andcalls the corresponding handler functions. The sd app evt wait() function is an SoftDevice APIfunction that enters sleep mode until an interrupt occurs. This is important to reduce powerconsumption of the chip. When the central processing unit (CPU) of the nRF51822 chip isrunning, a typical value for the current consumption is about 4.2 mA whereas the sleep modeconsumes only about 3.8µA [Nor16a].
Figure 2.5 gives an overview about the interaction between the functional units: data recording,data streaming, data storage and data exchange. Furthermore, the different modules of eachfunctional unit are displayed. In the following a brief explanation of their functionality ispresented.
The data recording unit includes the sampling, app-timer, app-scheduler, chunk-FIFO andprocessing module. Additionally, it uses the HW abstraction modules for the data sources battery,microphone, accelerometer and scanner. The sampling module controls the data recording process.

16 CHAPTER 2. METHODS
storer
filesystem
Data storage
tinybuf
storage_1 storage_2
storage
flash eeprom
request_handler
tinybuf app_scheduler
sender advertiser
Data exchange
Data recording
sampling
battery microphone accel scanner
chunk_fifo
app_scheduler
processing
circular_fifo
Data streaming
app_timer
Figure 2.5: Modules overview. The main functional units data recording, data streaming, datastorage and data exchange consist of one or more modules to provide the functionality. The arrowsillustrate the dataflow and/or the controlflow between the components. In this overview only themodules are depicted that are necessary to understand the general behavior of the firmware.

2.2. FIRMWARE ARCHITECTURE 17
It collects data from the available data sources at predefined time intervals through the app-timermodule or at occurness of specific events such as a motion-interrupt from the accelerometer. Asalready mentioned, the sampled data is splitted into data chunks for each data source. For anefficient and more importantly synchronized exchange of the data chunks between the samplingand the processing module, the chunk-FIFO module is applied. The processing module readsthe available data chunks from the chunk-FIFO and processes the chunks, for instance sortingthe data or storing to the NVMs. In general, this processing step is time consuming and shouldnot be handled in a high priority context. Therefore, the execution is transferred to the maincontext by the app-scheduler module. The HW abstraction modules represent the functionality ofthe corresponding HW components. The battery module provides a function to read the supplyvoltage of the battery while the microphone module reads the audio signal from the analogmicrophone. Both modules use the ADC to generate the data. To synchronize the access onthe ADC an abstraction layer based on the SDK ADC-driver was implemented. All requiredSDK drivers have to be enabled in the sdk-config header file of the project. The incorporatedaccelerometer is controlled by the accelerometer (accel) module. This module enables the accessto the recent acceleration data and calls a configurable callback function when the accelerometergenerates an interrupt event. To interact with the accelerometer chip, the SPI-driver of the SDKis used. Since the SPI-driver is also required by the eeprom module, an additional abstractionlayer was implemented to synchronize multiple SPI-driver access. Furthermore, the abstractionlayer includes an automatic control of the slave select (SS)-pin to choose the correct HW devicefor SPI communication. The last data type that can be recorded is the proximity to other badges.The proximity to surrounding Bluetooth devices can be reconstructed using the RSSI values froma Bluetooth scan. The BLE scan functionality is provided by the SoftDevice. To facilitate theinteraction with the SoftDevice, a BLE module was implemented that abstracts only the neededBLE functionality, such as scanning, advertising and bi-directional communication. The scannermodule, that is associated to the data recording unit, is based on this BLE abstraction and providesthe functionality to scan for surrounding Bluetooth devices, such as location beacons or otherbadges. A detailed description of the sampling and processing strategy of each data source ispresented in section 2.4.
After the data from the different data sources have been recorded, they can be directlytransmitted to a central BLE device and/or stored to the NVMs for later transmission. The firstcase, in which the data arrive continuously, is called data streaming [Bab02]. This data streamingprocess is handled by the data streaming unit in cooperation with the data exchange unit. Thecircular-FIFO module is the only module in the data streaming unit. In contrast to the FIFO

18 CHAPTER 2. METHODS
implementation of the SDK, the circular-FIFO allows synchronized overwriting of unread data ifthe FIFO is full. This has the advantage that the data in the FIFO is always up to date. Each datasource has its own circular-FIFO, which contains single data points (e.g. the current microphonevalues) and no complete data chunks. The circular-FIFO as well as the streaming messages arepresented in section 2.7.
In the second case, the recorded data are stored in the NVMs to be transmitted at a latertimepoint. The data storage unit is responsible for the storing process of the generated data chunks.The storer module controls the storage to and the reading from the NVMs. Therefore, the tinybufmodule is used to efficiently serialize the data chunks to a byte sequence that can be stored to theNVMs via the filesystem module. The filesystem consists of multiple seperated partitions for eachclass of data, such as the microphone data or the accelerometer data etc. The filesystem module isbased on the storage module, which combines multiple memories to one virtual memory. Betweenthe actual HW abstraction modules for the memories and the storage module, another abstractionlayer is integrated to enable an uniform interface for the different memory types. The flash moduleis the HW abstraction of the integrated flash-memory and enables certain flash operations, suchas erasing pages and storing or reading words. The interaction with the flash-memory is doneby the fstorage module of the SDK and the SoftDevice. To minimize the SoftDevice conflictsbetween BLE activity and flash operation, the fstorage module splits the requested flash operationinto smaller units that are successively processed. The EEPROM is controlled by the eeprommodule and enables the application to store and read single bytes or byte sequences. As alreadymentioned, the communication between the nRF51822 and the EEPROM chip is based on the SPI.To synchronize the SPI access between the eeprom and the accelerometer module, the abstractionlayer on top of the SPI-driver is applied. To retrieve the data chunks again from the NVMs, theserialized data chunks are read from the corresponding filesystem partition and deserialized viathe tinybuf module. In section 2.6 the functionality of the filesystem as well as the uniform storageabstraction is explained.
Ultimately, data has to be exchanged with a central BLE device such as a hub. The dataexchange unit is responsible for this task (see Figure 2.5). Advertising related functionality, forinstance the advertising packet management, is implemented in the advertiser module. The sendermodule enables the bi-directional communication during an established BLE connection betweena central BLE device and the badge through the Nordic UART Service. The advertiser moduleas well as the sender module is based on the BLE module that abstracts the interaction withthe SoftDevice. The entire data exchange process is controlled by the request handler module.This includes the processing of received messages, the reading of stored data chunks and the

2.3. TESTING FRAMEWORK 19
transmission of stream or data chunk messages. The general procedure is the following: Thesender module receives a message or notification from the remote BLE device and generates acallback for the request handler module. The request handler module processes this messageby deserializing it with the tinybuf module to an interpretable request structure. This requestis analyzed in a second step and if necessary a response for the remote device is generated andtransmitted. In general, the process of analyzing the request and generating the response is timeconsuming and is therefore transferred to the main execution context through the app-schedulermodule. Additionally, the app-scheduler module is used to suspend an operation that is currentlyunavailable and to retry it at a later timepoint. After the reponse is generated, the tinybuf moduleis used to serialize the response to a byte sequence that can be transmitted through the sendermodule. Section 2.8 presents the data exchange unit and the corresponding modules.
2.3 Testing framework
As part of this work, a testing framework was developed to apply dynamic testing methods tothe implemented software. A testing framework is a software tool that provides an environmentto easily create and execute tests and reports the results of these tests. Usually, unit tests arecreated simultaneously with the development of the application software. Unit tests are basedon the application modules to be tested, but exist only in the test framework and not in theapplication itself. A unit test checks a specific behavior of the application software. If thetest is succesful, this specific behavior of the application is verfied. In general, the most basicfunctionality of the application should be tested first, followed by more complex tests that maycombine different functional units of the application. One advantage of a well-maintained testingframework is the ability to immediately verify code changes, which enables faster applicationdevelopment [Ham04]. Altough the implementation of unit tests is an additional expenditureduring the implementation, a case study in [Osh15] showed that the overall time to provide a bugfree application can be reduced when unit testing is applied during the development process.
The basis for the testing framework is Google Test. Google Test is a cross platform testingframework written in C++. It is compiled and linked together with the application modules to betested. The framework enables an easy declaration of tests and provides a lot of useful features. InGoogle Test, one single test is called test and the set of various tests associated to one componentis called test case. The basic concept is the following: The user creates a C++ file to setup a testcase for a specific component of the application. Within this file one or more single tests aredefined to verify the component’s functionality. To verify the functionality of a component or a

20 CHAPTER 2. METHODS
function, assertions are made about its behavior, which have to be fulfilled. Google Test displaysa failure message when the assertion fails. This failure message contains the line number wherethe test failed, additional information about the cause of failure and optionally a custom failuremessage. Assertions are divided into two groups: Fatal and nonfatal assertions. When a fatalassertion fails, the current test is aborted, whereas a nonfatal assertion would not abort the currenttest. An overview of common used assertions is presented in Table 2.2.
Fatal assertion Nonfatal assertion Verifies
ASSERT TRUE(condition) EXPECT TRUE(condition) condition is true
ASSERT FALSE(condition) EXPECT FALSE(condition) condition is false
ASSERT EQ(val1, val2) EXPECT EQ(val1, val2) val1 == val2
ASSERT NE(val1, val2) EXPECT NE(val1, val2) val1 != val2
ASSERT LT(val1, val2) EXPECT LT(val1, val2) val1 < val2
ASSERT LE(val1, val2) EXPECT LE(val1, val2) val1 <= val2
ASSERT GT(val1, val2) EXPECT GT(val1, val2) val1 > val2
ASSERT GE(val1, val2) EXPECT GE(val1, val2) val1 >= val2
Table 2.2: Assertions. Each fatal or nonfatal assertion performs a specific type of verification.
Each test uses one or more of these assertions to verify the functionality of a certain component.Figure 2.6 (a) shows a simple function to be tested and an associated test. The task of the functionis to check whether an input number is even or odd by using the modulo operator. If the numberis even, the function should return true, otherwise false. The corresponding test is defined by theTEST(TestCaseName, TestName) macro and uses one of the mentioned assertions to verify aspecific behavior of the function. In this case, the test verifies that the function returns false if theinput number is 1. To run the test case, the created C++ test case file, the corresponding modulesto test and the Google Test framework modules have to be compiled and linked together. Theframework invokes the created tests sequentially. The resulting test report is displayed in Figure2.6 (b). The report shows the success of the test and thus also that the function fulfils the behaviorasserted in the test. In contrast, Figure 2.7 (a) shows the same function, but in this case it isimplemented incorrectly: The condition in the if -statement is exactly the opposite of the previousimplementation. If the same test is executed for the incorrect implementation of the function, thetest fails. The report produced by the Google Test framework shows this failure (Figure 2.7 (b)).It provides the line number where the test failed and information about the cause of the failure.

2.3. TESTING FRAMEWORK 21
// The (correct) function to test bool is_number_even(uint32_t n) { if(n % 2 == 0) return true; return false; } // A single test TEST(IsNumberEvenTest, OddNumber) { EXPECT_FALSE(is_number_even(1)); }
(a) (b)
Figure 2.6: Successful unit test. The correct implemented function that checks whether a numberis even or not and a single test is shown in (a). The test report generated by the Google Testframework after running the test is depicted in (b).
// The (incorrect) function to test bool is_number_even(uint32_t n) { if(n % 2 != 0) return true; return false; } // A single test TEST(IsNumberEvenTest, OddNumber) { EXPECT_FALSE(is_number_even(1)); }
(a) (b)
Figure 2.7: Failed unit test. An incorrect implementation of the function that checks whethera number is even or not is shown in (a). After execution of the test, the Google Test frameworkreports the failure of the test (b).
With this information, the implementation bug can be fixed quickly. Several tests within a testcase should be independent of each other, otherwise it might be difficult to find the cause of afailed test. Especially, test of modules or functions with an internal state are affected by thisproblem. To ensure the same configuration or state for several different tests, the frameworkprovides so called test fixtures: TEST F(TestCaseName, TestName). Before each test fixtureis invoked by the framework, a SetUp-function is called to reset the internal state or to create aconsistent configuration [Goo08a].

22 CHAPTER 2. METHODS
Another related dynamic testing method is code coverage testing. This type of testing ischaracterized by specifically designed tests that cover a high percentage of the code. Codecoverage can be refined into different types: statement or line coverage, path coverage, conditionor branch coverage and function coverage. For line coverage, the tests are designed to executeeach line of the code to be tested. One assumption is that the more lines covered, the better thefunctionality is tested. Path coverage considers the code as individual logical paths that can beexecuted and not as single lines. This type of coverage is a stronger criterion than line coverage.Branch coverage is related to path coverage but provides a stronger criterion than path coverage.This is due to the fact that a different combination of conditions can lead to the same path beingexecuted. The function coverage represents the number of program functions that are coveredby the tests. Furthermore, the number of function calls is monitored, enabling the developer tooptimize functions that are called frequently [Des06].
The technique applied for code coverage analysis is called instrumentation. In this technique,additional code or instructions are incorporated into the original source code. These instructionsgenerate information about the instrumented code during runtime. The result of the analysis is thecoverage in percent. For example, the line coverage is computed in the following way:
Line coverage =Number of lines executed
Total number of lines∗ 100% (2.1)
When the tests execute the instrumented code and it turns out that the code coverage isinsufficient, either the existing tests have to be adjusted or new tests have to be added to increasethe coverage. This process is repeated until the code coverage is sufficient. A set of effective testsis the result of this repeated process.
In this work the coverage analysing tool gcov is used. This utility is included in the GNUCompiler Collection (GCC). To incorporate the instrumentation into the code, special compileroptions have to be added: -fprofile-arcs -ftest-coverage. During the compilation process for eachsource file, a .gcno file is generated that contains information that are necessary for gcov such as aflow graph of the program. While executing the compiled object files, a .gcda file is created foreach of the source files. These .gcda files contain profiling information about the executed objectfiles. Both, the .gcno and .gcda files are used by gcov to perform the actual coverage analysis[GCC05]. Since the generated results are difficult to read, lcov in combination with genhtml isapplied to provide a more convenient visualization for the developer. Lcov collects the coverageinformation generated by gcov and writes them into a file. Based on this file, genhtml creates aHypertext Markup Language (HTML) file that presents the coverage information, such as line,function and branch coverage. [Obe08]. The HTML file can be interpreted by any standard

2.3. TESTING FRAMEWORK 23
Browser such as Google Chrome or Firefox. An example for the code coverage analysis andHTML visualization is shown in Figure 2.8. The function to be tested is the same as for theprevious examples. This time the function has another implementation error: Instead of returningtrue when the condition in the if -statement is fulfilled, the function returns erroneously false. Thefunctionality of the function is verified with the same test as for the previous implementations:The test asserts that the function returns false when it is called with the input number 1. Theimplementation error has no effect on this assertion, because it is not reached during the test.Consequently, the test reports the correct functionality of the function, although there is obviouslyan error. To solve this problem, and ultimately detect the implementation error, one or moretests with different input parameters have to be added. The code coverage analysis tool helps thedeveloper to easily find such untested code lines or branches. Figure 2.8 (a) shows the coverageanalysis generated with gcov, lcov and genhtml for the mentioned test. The red highlightedline containing the implementation error is never called during the test. The reason for this ispointed out by the branch data column: The condition of the if -statement is never true. In additionto the detailed source code analysis, a statistic of the entire source file is generated. This isshown in Figure 2.8 (b) and includes statistic values for the line, function and branch coverage.Therefore, the combination of the Google Test framework and gcov/lcov provides an useful toolfor software development. The test framework verifies the functionality of the implementationand the coverage tool analyzes how much of the source code is actually executed by the tests.This enables developers to create better tests and eventually more stable applications.
LCOV - code coverage reportCurrent view: top level - app/firmware/nRF_badge/data_collector/unit_test/mock/incl - example.c (source / functions) Hit Total Coverage
Test: coverage.info Lines: 3 4 75.0 %Date: 2018-10-23 Functions: 1 1 100.0 %
Branches: 1 2 50.0 %
Branch data Line data Source code 1 : : #include "example.h" 2 : : 3 : : // The (incorrect) function to test 4 : 1 : bool is_number_even(uint32_t n) { 5 [ - + ]: 1 : if(n % 2 == 0) 6 : 0 : return false; 7 : 1 : return false; 8 : : }
Generated by: LCOV version 1.9(a)
LCOV - code coverage reportCurrent view: top level - app/firmware/nRF_badge/data_collector/unit_test/mock/incl - example.c (source / functions) Hit Total Coverage
Test: coverage.info Lines: 3 4 75.0 %Date: 2018-10-23 Functions: 1 1 100.0 %
Branches: 1 2 50.0 %
Branch data Line data Source code 1 : : #include "example.h" 2 : : 3 : : // The (incorrect) function to test 4 : 1 : bool is_number_even(uint32_t n) { 5 [ - + ]: 1 : if(n % 2 == 0) 6 : 0 : return false; 7 : 1 : return false; 8 : : }
Generated by: LCOV version 1.9
(b)
Figure 2.8: Example coverage analysis. The detailed source code coverage analysis is depictedin (a). It includes the source code itself, the number how often each line is executed (line data) andinformation about the branch coverage (branch data). In (b) the statistic about the entire sourcefile coverage is displayed.
Modules or functions that are based on HW or HW-drivers cannot be verified with the testingframework because the required functionality is only available on the HW. Examples for suchHW components are the EEPROM, the flash-memory, the accelerometer, the microphone, thebattery and the BLE interface. To verify the correct functionality of these HW modules, their tests

24 CHAPTER 2. METHODS
are integrated into the application running on the HW. The HW modules have to be abstracted inso called mock objects, to test other units of the application that interact with these modules. Sincethe programming language is C, mock objects are modules with the same interface/header-file asthe HW modules. Internally, the mock objects no longer access the HW, but try to simulate it.The first aspect of mock object simulation includes the generation of data. The second aspect isthe simulation of asynchronous events such as interrupts. For instance, the mock object for theaccelerometer module has to provide both aspects: When the read function of the mock objectis called, acceleration data have to be returned. In addition, the mock object has to generatemotion interrupts under certain conditions. The left part of Figure 2.9 shows the sampling modulethat uses the HW dependend accelerometer module. To test the implementation of the samplingmodule, the mock object of the accelerometer module has to be created, which is shown in theright part of the picture. The functionality of the mock object itself is again verified with the testframework. The easiest way to generate data, e.g. accelerometer data, is to return predefineddefault values. In some applications this would already be sufficient, but there are applicationsthat perform complex operations on the returned data, such as sorting or classification. For theseapplications, specifically generated data must be returned to test the complex functionality. Toprovide this possibility, an abstraction layer for data generation was implemented in this work:If the application calls a read function of the mock object, the function call is forwarded to thedata-generator module. In addition to default values, function pointers can be set in this module.These function pointers enable test-dependent functions to be called to generate the data.
sampling
accel
spi gpio
hardware
sampling
accel-mock
data_generator callback_generator
test
cases
Figure 2.9: Accelerometer mock object. The left part shows the sampling and accelerometermodule when the application is directly running on the HW. For the offline testing with the testframework, a HW-independent mock object for the accelerometer has to be implemented.

2.4. DATA RECORDING 25
To simulate asynchronous events, for example a motion interrupt of the accelerometer, thecallback-generator module can be used. This module allows to easily register and create asyn-chronous events at specific configurable time points. The event generating process is startedby calling a trigger-function. The module manages an array of time points that are processedsequentially. These time points are defined during the initialization by the developer. At eachtime point, a previous registered callback function is called to simulate an asynchronous event.Internally, threads are used to generate this asynchronous behavior. To protect critical sectionsof the code from asynchronous execution, special synchronization mechanisms must be applied.In the case of the accelerometer mock object, the callback generator module is used as follows:The test defines the time points at which the motion interrupts should be generated. During theinitialization process of the accelerometer mock object, the trigger-function that starts the processis called. At the defined time points an event is generated and the interrupt handler function of theaccelerometer mock object is invoked. The interrupt handler is invoked as on the HW.
The developed test framework enables the capability for simple creation and execution of tests.In addition, the integrated code coverage analysis tool gives the developer an indication of thequality of the tests.
2.4 Data recording
This section describes the data recording unit and the recording strategy of the different datasources in more detail. At the start of the application, the sampling module initializes the requiredtimers, chunk-FIFOs and HW abstraction modules. The sampling module provides an interface tostart and stop data recording for a single data source. The parameters required for each data source,such as the sampling period for the microphone, are passed via the start function. Dependingon the data source, no timer, one timer or two timers are required for reading the data points.These timers are also launched in the start function. Furthermore, the start function sets up thedata chunks, where the recorded data points are buffered. In addition to the actual data points,the chunks also contain metadata in which information such as a timestamp and, if applicable,the number of data points are stored. Chunks are internally represented as C structures. Figure2.10 shows an example of the chunk structure for the microphone data. After a chunk has beenfilled with data points, it has to be processed, for example, stored. The fast data generation ofthe sampling module must not be delayed by these time-consuming operations. Therefore, anefficient mechanism to exchange finalized chunks is required. Care has to be taken that no copyoperations are used, because these operations are rather time-consuming. These requirements are

26 CHAPTER 2. METHODS
implemented in a specifically designed chunk-FIFO. The functionality of the mechanism is asfollows: During the initialization of the sampling module, a chunk-FIFO for each data-sourceis created, in which the chunks are inserted sequentially. It allocates memory in RAM for agiven number of chunks. The chunk-FIFO provides interfaces to open or close a chunk forwriting or reading. When opening a chunk for writing, a pointer to the next free position in thechunk-FIFO is returned. This pointer has to be casted in order to access the chunk-structure, forexample a microphone-chunk. This procedure prevents the already mentioned time-consumingcopy operations. If too less memory is allocated during the initialization or the reading of thefinalized chunks from the chunk-FIFO is performed too late, no writable chunks are availablein the chunk-FIFO. In this case the pointer to the last finalized chunk is returned. This preventsoverwriting of unread chunks. However, the last written chunk is overwritten by the new chunk.The reason for this kind of implementation is the following: If no chunk is currently availablefor writing, data recording should actually be stopped so that no new data points are generated.As soon as space is available in the chunk-FIFO, data recording should be restarted again. Morecomplex mechanisms would have to be provided to automatically restart data recording. In orderto keep the implementation simple, the described method of overwriting the last finalized chunk isused. In both cases data loss occurs. Therefore, the number of available chunks in the chunk-FIFOmust be selected appropriately during initialization.
typedef struct { Timestamp timestamp; uint16_t sample_period_ms; uint8_t microphone_data_count; MicrophoneData microphone_data[114]; } MicrophoneChunk;
Figure 2.10: Microphone chunk. The figure shows the C structure for the microphone chunk.It consists of a timestamp, the sample period in milliseconds, the number of microphone datapoints in the microphone data point array and the microphone data point array itself. TheMicrophoneData-type consist of one byte representing the audio data.
After a chunk has been closed by the sampling module, a processing function is inserted intothe scheduler. Each data-source has its own processing function, which is implemented in theprocessing module. The scheduler executes this function as soon as possible. The processingfunction reads finalized chunks from the chunk-FIFO for the given data-source and processesthem sequentially. Depending on the data source, the processing differs. In the case of microphonechunks, the chunk structure is just serialized and stored by the storer module. In contrast to this,the data points of proximity chunks are sorted before they are serialized and stored.

2.4. DATA RECORDING 27
2.4.1 Proximity data
The proximity to other people is an important variable to infer communication patterns andface-to-face interactions. The proximity data can be used to determine which persons have mostlikely interacted with each other. The badges retrieve the data by scanning for BLE advertisingpackets of surrounding devices. Each badge advertises its packet every 200 ms. The advertisingpacket is broadcasted on all three advertising channels. The parameters for the scanning ofadvertising-packets can be configured remotely. The selectable parameters for the scan procedureare the interval, the window, the duration and the period. The scan interval describes the timeinterval between two active receiving windows. The active receiving time is represented by thescan window parameter. In each window only one of the three advertising channels is covered.Therefore, the next window receives on the subsequent advertising channel of the previous windowand starts again with the first one when the previous window has covered the last advertisingchannel [Kin18]. This procedure is repeated until the scan duration is exceeded. Finally, thescan period describes the time interval at which a new scan procedure should be started. Typicalparameters are: an interval of 300 ms, a window of 100 ms, a duration of 3 seconds and a periodof 15 seconds.
The proximity and approximate distance is finally calculated based on the RSSI values of thereceived advertising packets. The advertising packets of each badge contains an ID and a groupnumber. Both values are set by the hub during the activation of the badge. In addition to badges,location beacons can also be recorded in a scan. Location beacons are stationary BLE devicesmounted on a known position that periodically transmit their advertising packet. Both, iBeaconsand badges can be deployed as location beacons. Each location beacon is also assigned an IDand a group number. The recording strategy of proximity data is as follows: A timer is startedthat periodically invokes a callback function at the specified scan period. In this callback a newscan-chunk of the scan-chunk-FIFO is opened and the actual BLE scan is started via the scannermodule. Every time an advertising packet is received by the scanner module, a function is calledthat inserts the received ID and RSSI value into the chunk. If the group number of the receivedadvertising packet does not match with its own group number, the badge ignores this device andno insertion into the chunk takes place. Since the available RAM is limited, multiple RSSI valuesof the same device have to be aggregated during the scan. Currently two aggregation methods aresupported: The average and the maximum of the RSSI values. The scan-chunk has the capacity tostore up to 255 devices during the sampling procedure. Beside the ID and the aggregated RSSIvalue, the number of received packets for the corresponding device is stored in the scan-chunk.After the scan duration has been expired, a function is called that closes the current scan-chunk

28 CHAPTER 2. METHODS
of the chunk-FIFO and schedules the processing via the app-scheduler module. The processingfunction, implemented in the processing module, reads out the available scan-chunk(s) from thechunk-FIFO. In worst case, a scan-chunk consists of 255 discovered devices. To store a chunklike this into the NVMs, 1027 bytes are required: 6 bytes for the timestamp, 1 byte for the numberof discovered devices, and for each of the 255 devices 2 bytes for the ID, 1 byte for the RSSI valueand 1 byte for the number of received packets. Since the NVMs are also limited, 1027 bytes forone scan-chunk is not acceptable. In general, not all of the discovered devices are important forthe data analysis. Especially badges with a low RSSI value are less important. A low RSSI valueusually indicates a greater distance and implies that there is probably no face-to-face interactionbetween the corresponding participants. In contrast, location beacons are often characterizedby a lower RSSI value, because in a normal setup there are only few location beacons that aredistributed over the entire operational area. To calculate the absolute position of a person, thedistance to at least three, better four location beacons is necessary. In order to prioritize a certainnumber of location beacons and to filter out badges with a low RSSI value, a special sortingmechanism is applied: First of all, the location beacons, characterized by an ID greater or equal16,000, are sorted to the beginning of the scan-chunk. After that, the location beacons are sortedby their aggregated RSSI values to obtain the nearest location beacons at the beginning of thechunk. Finally, all remaining devices are sorted by their aggregated RSSI values. The resultof this multistage sorting mechansim is a chunk that prioritizes location beacons and is sortedaccording to the proximity to other badges. Before serializing and storing to the NVMs using thestorer module, the sorted scan-chunk is reduced by only taking the first 29 devices. The numberof 29 devices has been adopted from the previous firmware implementation, but can be changedat any time if required.
2.4.2 Audio data
In addition to the proximity between persons, acoustic information is essential to analyze thecommunication patterns, such as turn-taking and speech overlap. To record audio data, the analogmicrophone of the badge is used. The microphone transforms the audio signal into an analogelectrical signal on its output pin. This signal is amplified and low-pass filtered by the operationalamplifier circuit of the badge. The cutoff-frequency of the low-pass filter is approximately 340Hz. According to the Nyquist-Shannon sampling theorem, the sampling frequency must be higherthan twice the highest frequency occurring in the signal. Otherwise, aliasing effects may appear[Mar12]. Therefore a sampling frequency of 700 Hz is used. The pre-processed signal is digitizedby the ADC. The reference voltage for the ADC is the supply voltage of the microphone and

2.4. DATA RECORDING 29
amplifier circuit, which is regulated to 1.8 Volts by a regulator. The resolution of the digitalrepresentation is 8 bit. The zero point at the output of the operational amplifier circuit is 0.9 Volts.This voltage corresponds to a digital representation value of 128. The actual digital audio signal isthe absolute difference between the current ADC value and this zero point.
For the analysis of communication patterns, the recording of the actual content of the con-versation is not required. Only certain language characteristics are relevant, such as how often,how long and at what volume the participants speak. Therefore, to decrease the amount of datathat has to be stored and finally transmitted, the raw microphone amplitude is averaged over 50ms [Led18]. This averaging period can be setted remotely. To control the data-recording of themicrophone, the sampling module provides a start- and a stop-function. In the start-function amicrophone-chunk of the microphone-chunk-FIFO is opened and two timers are started. The firsttimer invokes a callback function every 1.42 ms (= 700 Hz). This callback function reads the rawamplitude via the microphone module. The microphone module uses the underlying ADC-driverto generate this amplitude. The second timer calls a function at the specified averaging period, forexample every 50 ms. In this function, the previous read amplitudes are averaged and insertedinto the microphone-chunk. As soon as the microphone-chunk is filled, the chunk is closedand a new one is opened for further data recording. Additionally, the corresponding processingfunction is inserted into the scheduler. This function reads out the available chunks from themicrophone-chunk-FIFO, serializes and finally stores them to the NVMs via the storer module.
2.4.3 Acceleration data
Another useful information about the behavior of participants are their patterns of physicalmovement. This can be used, for example, to determinie their physical activity intensity orthe number of steps. A three-axis accelerometer is used to record movement information. Theincorporated accelerometer (LIS2DH12) of the badge offers a wide range of functionalities.The accelerometer supports four operating modes: Power-down, low-power, normal and high-resolution mode. In power-down mode, most of the internal units of the accelerometer areswitched off to reduce power consumption. In this mode, no acceleration data are available andthe power consumption of the accelerometer is reduced to approximately 0.5 µA [STM17]. Thelow-power mode provides a resolution of 8 bits for the acceleration. The resolution refers to theconfigured full scale value. A full scale value of ±2 gravitational force (g), ±4 g, ±8 g or ±16g can be selected. In normal mode the resolution is 10 bits and in high-resolution mode 12 bits.The power consumption in these three modes depends on the datarate at which the acceleration ismeasured. Table 2.3 gives an overview of the power consumption.

30 CHAPTER 2. METHODS
Datarate (Hz) Low-power mode (µA) Normal mode (µA) High-resolution mode (µA)1 2 2 2
10 3 4 4
25 4 6 6
50 6 11 11
100 10 20 20
200 18 38 38
400 36 73 73
Table 2.3: Accelerometer power consumption. Excerpt of the accelerometer power consump-tions in different operation modes and datarates [STM17].
The accelerometer has an integrated 32-level FIFO for the raw acceleration values. This FIFOis used to minimize the number of SPI-transfers, since up to 32 data points can be read at once bythe SPI-master. Furthermore, the accelerometer features an optional high-pass filter to eliminatethe acceleration due to gravity. Beside the acceleration values of the three orthogonal axes, theaccelerometer provides the capability to enable interrupts that are generated if preconfiguredacceleration events are detected. These events are for example motion events, free-fall eventsor click-events. The events are signaled through an output pin of the accelerometer, which isconnected to an interrupt pin of the microcontroller. The functionality of the accelerometer isabstracted in the accel module of the firmware. This module configures the accelerometer bywriting to its internal registers via the SPI-driver. It provides interfaces to setup the accelerometer,to read the current acceleration along the three axes in milli gravitational force (mg) and to activatethe event detection.
The sampling module of the firmware provides two data-sources based on the accelerometer:Raw acceleration data and motion events. The start-function for recording raw acceleration dataexpects certain parameters for the datarate, the operating mode, the full scale and the period toread out the 32-level FIFO. After configuration of the accelerometer via the accel module, thefunction opens a chunk of the accelerometer-chunk-FIFO and starts a timer that periodically readsthe latest data from the 32-level FIFO. It is important that the specified timer frequency is atleast as high as the selected datarate of the accelerometer. Since the SPI-driver is also used bythe eeprom module, it can occur that the SPI-driver is not available to read the acceleration datafrom the FIFO at the moment at which the timer callback function is executed. Therefore, it isadvisable to select the timer frequency significantly higher than the datarate of the accelerometer.For the data analysis, the amount of movement, but not the exact acceleration of all three axes,is of particular importance. To eliminate the acceleration offset due to gravity, the integrated

2.4. DATA RECORDING 31
high-pass is applied. To retrieve a measure for the amount of movement, the absolute accelerationvalues of the three axes are summed up to one representative value [Bou97]. This value is insertedinto the accelerometer-chunk. If the chunk is filled, the corresponding processing function iscalled via the scheduler. This function is responsible for serializing and storing the chunk.
The motion event data-source is based on the interrupts generated by the accelerometer.To enable the motion event detection, three parameters have to be selected when calling thecorresponding start-function of the sampling module. The first parameter is the accelerationthreshold that has to be exceeded by at least one axis. The second parameter represents theminimal duration for which the acceleration must exceed the specified threshold to generate aninterrupt. The last parameter describes the minimal duration between two consecutive events.If the next event occurs within this duration, it will be ignored. Every time such an event isdetected, an interrupt is generated and a callback function in the sampling module is invoked.In this callback function, the event is inserted into the accelerometer-interrupt-chunk, which isclosed afterwards. Finally, the corresponding processing function is scheduled to serialize andstore the chunk.
2.4.4 Battery data
To monitor the functionality of the badges during their utilization, it is necessary to know thecurrent supply voltage of the coin cell battery. The supply voltage can be used to determine theremaining capacity of the battery. Based on this information either the battery or the badge itselfcan be exchanged in time to avoid data loss. In addition, the supply voltage is important forsubsequent data analysis, as it can be used to explain irregular behavior of the badges or corrupteddata, especially when the voltage is low.
The current voltage can be retrieved through the battery module. Internally, the battery moduleperiodically triggers the ADC-driver to measure the current voltage and averages consecutivevalues afterwards. To determine the supply voltage, the internal band gap reference voltage of thenRF51822 with 1.2 Volts serves as reference voltage for the ADC [Nor16a]. Since the externalsupply voltage exceeds 1.2 Volts in general, it is reduced to one third of the original value by aninternal voltage divider. This value is then converted by the ADC with a resolution of 10 bits.Finally, the current external supply voltage (Vsupply) can be calculated based on the convertedvalue (V alueADC) with the following formula:
Vsupply =V alueADC
210∗ 3 ∗ 1.2V (2.2)

32 CHAPTER 2. METHODS
Averaging is applied to eliminate voltage drops during high current consumption activitiessuch as flash-memory interactions or BLE activity. The averaging is implemented as exponen-tially weighted moving average (EWMA). This type of averaging is characterized by a simplecomputation and by declining weights for older values [Hol04]. The recursive computation ofthe current averaged value St at time point t based on the previous averaged value St−1 and thecurrent measured value Yt is as follows:
St =
Y1, t = 1
α ∗ Yt + (1− α) ∗ St−1, t > 1(2.3)
The α coefficient in this equation ranges from 0 to 1 and affects the influence of older values.The higher this coefficient, the faster the influence of older values decreases. The periodical voltagemeasurement is implemented with a timer. Each time the timer callback updates the averagedvoltage, the supply voltage of the advertising packet is also updated. This is accomplished using afunction of the advertising module. The battery voltage can also be stored in the NVMs for laterdata analysis. This functionality is again provided by the sampling module. As soon as this data-source is activated, the sampling module sets up another timer that periodically reads the currentaveraged supply voltage from the battery module. This value is inserted into a battery-chunk ofthe battery-chunk-FIFO and the corresponding processing function of the processing module isscheduled. The processing of this data-source is similar to the other data-sources: The chunk isread out from the chunk-FIFO, then serialized and finally stored to the NVMs.
2.5 Data serialization
The efficient serialization and deserialization of structured data, such as chunks, is essential fordata storage and transfer. Especially for data transfer, the de-/serialization mechanism has to beplatform independent, since the data is exchanged between different architectures and program-ming languages. This section describes first Google’s Protocol Buffer library and afterwards theserialization and deserialization technique that was developed in this work.
Various types of de-/serialization techniques exist, such as XML, JSON or Protocol Buffers.XML and JSON are not suitable for an efficient serialization due to their high overhead. Incontrast, Google’s Protocol Buffers library is characterized by a small overhead due to its efficientbinary data representation [Goo08b]. Protocol Buffers officially supports the programminglanguages C++, Java, Python and Go, but not C. For C another Protocol Buffers implementationcalled nanopb exists, which is especially suitable for embedded systems with restricted resources

2.5. DATA SERIALIZATION 33
[Aim12]. Based on a schema-file, the Protocol Buffers compiler generates special source codeto serialize strucutured data into a binary representation and to deserialize it back to structured,interpretable data. In the schema-file, structured data are defined through messages. Each messagehas a name and contains one or more fields that characterizes the message. In Figure 2.11 a simpleexample message for representing a timestamp is shown.
message Timestamp { required uint32 seconds = 1; required uint32 ms = 2; }
Figure 2.11: Protocol Buffers example. The Protocol Buffers message of a timestamp consistsof one field representing the seconds and one for the milliseconds. The numbers to the right of theequals sign are the corresponding field identifiers.
After the fields of the message have been setted via the automatically generated source code,the message can be serialized for transfer. Protocol Buffers support various data types, such asinteger, float, double, string, boolean, byte-arrays and even other messages. Each field is specifiedwith a field rule: required, optional or repeated. Required fields are essential for the messageand have to be set/defined before serialization. On the other hand, optional fields need only tobe specified if necessary. If an optional field is not set, it will be ignored during the serialization.Repeated fields can contain multiple elements of the specified data type, which corresponds toan array-representation. There are three main reasons why Protocol Buffers has not been usedin this work and instead a custom de-/serialization technique was developed. The first reason is,that Procotol Buffers serialization applies variable-length integer (varint) encoding. The encodedor serialized length of an integer encoded with this mechanism can be higher than the actualbyte representation of the integer. Secondly, each field gets an additional indentifier during theencoding process. Especially for repeated fields with another message as data type, the overheadis extremly high due to the additional identifiers. Thirdly, Protocol Buffers are not compatiblewith the previous implementation of the transmission protocol. Support of the previous protocolis particularly necessary to perform integration tests for the new firmware.
To overcome these difficulties a custom de-/serialization techique called Tinybuf has beendeveloped. The workflow of Tinybuf is comparable to the workflow of Protocol Buffers. In thebeginning, a schema-file has to be created that contains the message declarations. Afterwards theschema-file is converted to source code. Currently C and Python are supported as programminglanguages. Finally, the generated source code can be used to access the messages and to efficientlyde-/serialize them. An overview of the workflow is shown in Figure 2.12.

34 CHAPTER 2. METHODS
Data
exchange
Python
C
schema-
file
tinybuf-
generator
h-/c-file
py-file
tinybuf
module
C-
application
Python-
application
Development Runtime
Figure 2.12: Tinybuf workflow. The workflow is divided into two parts. The left part takesplace during the development process of the system: The schema-file is defined and converted tosource code by the tinybuf-generator. The right part of the figure is executed while the system isrunning: The generated source code is used to de-/serialize the defined messages, which can beexchanged platform independently between applications with different programming languages.
The tinybuf-generator parses the schema-file in analogy to the Protocol Buffers compiler.This generator is implemented in Python and automatically generates source code for the chosenprogramming language. In case of Python, the tinybuf-generator creates one .py-file whichrepresents the messages as Python classes. At runtime, the application creates objects of theseclasses and sets the desired message fields. Afterwards, the encode function is called to serializethe message object into a byte sequence. To convert such a byte sequence back to a message object,the decode function of the class has to be called. If C is selected as programming language, a Cheader-file and a C source-file is automatically generated. The defined messages are representedas C structures. In contrast to the generated python file, the encode and decode functions are notincluded in the generated C-source file. These functions are provided by an additional module: thetinybuf module. The encode and decode functions are generic and can be used for any structurecreated by the tinybuf-generator. This approach is more complex than the Python based method,because additional information about the structure is required for encoding or decoding. Especiallywhen many different messages are defined, this decoupling leads to smaller code size comparedto methods where each message has its own encoding and decoding function. A small code size isessential for embedded systems as the available resources are limited.
Tinybuf supports the field data types shown in Table 2.4. The message data type has to bereplaced with the actual message name. In contrast to Protocol Buffers, the integers are notencoded with varint, but with their binary representation. The field rules provided by Tinybufare the following: required, optional, repeated, fixed-repeated and oneof. Required, optional

2.5. DATA SERIALIZATION 35
Data type Commentuint8 1 byte unsigned integerint8 1 byte signed integeruint16 2 byte unsigned integerint16 2 byte signed integeruint32 4 byte unsigned integerint32 4 byte signed integeruint64 8 byte unsigned integerint64 8 byte signed integerfloat 4 byte floating-point numberdouble 8 byte floating-point numbermessage another previously defined message
Table 2.4: Tinybuf data types. The supported data types are integers, floating-point numbersand other messages.
and repeated fields have the same characteristics as in Protocol Buffers. Fixed-repeated fieldsare similar to repeated fields, but have a predefined fixed number of elements. The advantageof fixed-repeated fields is that no additional length information needs to be encoded. The mostcomplex field rule is the oneof rule. In many applications it is often necessary to exchange notonly one message, but different messages. The recipient of the serialized message must knowwhich message has been received in order to deserialize it correctly. Either the recipient knowsin advance which message will be received, or additional information must be included in theserialized message. Oneof fields consists of multiple fields, with only one field set at a time. Whenthe oneof field is serialized, additional information describing which of the fields has been setis automatically included. This is exactly the mechanism that solves the message interpretationproblem described above: Each of the different messages is represented as a field in a oneof field.Another advantage of the oneof field is that in C all the included fields share the same memoryusing a C union.
The presented de-/serialization technique is used by the data storage unit and the data exchangeunit of the firmware. The data chunks mentioned in the previous section are represented by Tinybufmessages. Consequential, these chunks can be serialized directly with the tinybuf module, enablingan efficient storage. Furthermore, the tinybuf module is applied during the data exchange process.The communication protocol is defined by a Tinybuf schema-file which contains all messagesrequired for the communication between the badges and remote BLE devices, such as hubs.By using this automated, generic de-/serialization technique, the developer no longer needs toimplement individual de-/serialization functions for each message. This reduces developmenttime and enables the quick integration of new functionalities.

36 CHAPTER 2. METHODS
2.6 Data storage
The storage of data in the NVMs is essential for the functionality of the system. On the onehand, persistent metadata, such as the ID and group number of the badge, must survive powerlosses. On the other hand, badges must store the recorded data chunks locally in order to transmitthem when the remote BLE device requests it. To manage the storage of different types of dataconsistenly and without influencing each other, an efficient filesystem with a simple interface hasbeen developed. To facilitate the implementation of the filesystem, a uniform storage abstractionof the NVMs is provided. This storage abstraction combines multiple NVMs to one large virtualmemory. This section describes the data storage unit of the firmware in more detail. This includesthe virtual memory, the filesystem and finally the highest layer that combines the filesystem andthe tinybuf module to enable simple storing and reading of structured data.
2.6.1 Virtual memory
The purpose of a uniform storage interface is to simplify the interaction with multiple and differentmemory types such as the external EEPROM and the internal flash-memory. Flash-memory isorganized in pages with a certain size. Each page has to be erased manually before storing dataon it [Tal02]. The internal flash-memory of the nRF51822 has a page size of 1024 bytes. Thesmallest storable units are words with a size of 4 bytes or 32 bits [Nor16a] The external EEPROM(M95M02-DR) allows single bytes to be stored and there is no need to erase them before storingnew data [STM18]. To combine these two memories into one virtual memory, a similar interfaceto each of them is required.
Since the interaction with the flash-memory is rather difficult, an abstraction layer (storage 1)has been implemented to simplify the access to the flash-memory. This abstraction enables theapplication to store single bytes to the flash-memory without manually erasing pages in advanceand to read single bytes from it. This is achieved by a mechansim that automatically erases pagesbefore storing the data. This mechanism tracks the address ranges in which data can be storedwithout erasing the corresponding pages. If a store operation is within this address range, no eraseoperation needs to be performed. The mechanism is optimized for storing data to consecutiveaddresses. To store and read single bytes instead of words, a special behavior of flash-memories isused: The erase operation sets all bits of a page to 1. During store operations, bits within one flashword can only be setted from 1 to 0. This can be used to create a word where all bits are 1 exceptthe bits belonging to the byte to be stored. If the created word is stored to the flash-memory, onlythe bits with a value of 0 are updated. The byte can be extracted from the flash word again during

2.6. DATA STORAGE 37
the read operation. To provide the same interface for the EEPROM, a similar abstraction layer(storage 2) is added. In this case, no automatic erase mechanism is included, because it is alreadyhandled by the EEPROM.
Finally, both abstraction layers are combined to one virtual memory by the storage module.The storage 1 and storage 2 modules have their own address spaces, starting with address 0. Thestorage module concatenates both address spaces and generates a new consecutive address space.Internally, the addresses of the new address space are mapped to the corresponding addresses ofstorage 1 and storage 2. The resulting module interaction is shown in Figure 2.13.
storage_1 storage_2
storage
flash eeprom
Figure 2.13: Virtual storage. The figure shows the modules involved to provide a simpleaccessible virtual memory.
2.6.2 Filesystem
In order to simplify the implementation of the filesystem, this virtual storage interface is usedas basis. The filesystem has to meet the following requirements: Each class of data to be storedmust have its own physical partition in the memory to prevent mutual influences. The filesystemhas to be optimized for sequential storage and read operations since most of the data to be storedare created and retrieved sequentially. Another advantage of sequential storage operations are aneven access of the memory cells, maximizing their lifetime. The additional overhead produced bythe filesystem must be minimal to maximize the available memory for application data. Anotherimportant feature is the ability to detect corrupted data in memory. Furthermore, the filesystemmust support the variable length of the elements within a partition to optimize the utilization of theavailable memory and to support compression of data before storage. In addition, the filesystemmust be able to handle power losses during storage operations.
In general two different concepts exist for filesystems [Gal05] [Dab98]. The first approachis characterized by a physical seperation of the data elements to be stored and the managementinformation. This additional metadata information is needed to manage the stored elements.

38 CHAPTER 2. METHODS
The management information is stored in a prior defined memory range. Each data element isreferenced by an information entry in this management sector. This entry includes, for example, aunique number that identifies the element or record, the address at which the current element isstored in memory, the length of the element, and a checksum to detect corrupted elements. Theresulting memory layout is shown in Figure 2.14. This approach is characterized by a relativelysimple implementation. However, the approach also suffers from a number of disadvantages. Thesize of the management area must be defined in advance. This defines the maximum numberof elements that can be stored, even if there is enough space for more data elements. Anotherdrawback of this approach becomes evident when it is implemented with flash-memory as storage.If the entries of the management section are within a flash page and an erase operation is performedon this page, all entries are lost. This data loss can only be prevented if all entries are backed up.However, this backup mechanism heavily demands the memory cells.
RecordID Address Length CRC
0x0001 0x1000 0x0008 0xC39A
Addresses
0x0000
....
.... 0x1000 0 1 2
3 4 5 6 7
Management
information
Element data
Figure 2.14: Filesystem with management sector. The management information for each dataelement is seperated in a management sector. The management entry references the data elementand contains additional information, such as a unique element number, the length of the elementand a checksum.
The second filesystem concept is characterized by the combination of element data andmanagement information. An existing filesystem implementation from Nordic Semiconductorworks according to this concept and adds an element header with management information to eachdata element [Nor18a]. The filesystem of Nordic Semiconductor is not suitable for deployment inthis project due to the following reasons. Firstly, this implementation only supports the internalflash-memory and has no interface to integrate other memories such as the external EEPROM.On the other hand, the additional overhead of 12 bytes is too large and only storing and reading ofwords is allowed.
The combination of element data and management information is also applied in the filesystemthat was developed as part of this work. During the initialization, the application defines the sizesof the partitions for each class of data and registers the partitions in the filesystem. Two types

2.6. DATA STORAGE 39
of partitions are available: static partitions and dynamic partitions. In static partitions, all storedelements must have the same size which is defined during initialization. In contrast, dynamicpartitions allow the storage of elements with an arbitrary length. Each element within a partitionis stored along with a header that contains additional management information. In the case of astatic partition, the header contains a record or element number and optionally a cyclic redundancycheck (CRC) calculated from the element data. In dynamic partitions, the header consists ofan element number, length information and optionally a CRC. The resulting header size can beretrieved from Table 2.5.
Static partition Dynamic partitionCRC disabled 2 4CRC enabled 4 6
Table 2.5: Element header size. The table shows the size of the element header in bytes,depending on whether the partition is static or dynamic and whether CRC is enabled or not.
The data structure used in dynamic partitions to manage variable length elements is anexclusive or (XOR) linked list. XOR linked lists are special cases of doubly linked lists withreduced space requirements [Ber05]. In doubly linked lists, each element header refers to thenext and to the previous element. Since the elements are stored consecutively in memory, thesereferences can be expressed by the size of the previous element and the size of the current element.To reduce the header size, the previous element size and the current element size are combined viathe XOR operator which results in an XOR linked list. The first element header of each partitionis a special header. It contains additional metadata (14 Bytes) about the partition, such as thepartition ID, the partition size, the address of the last element in the partition and the size of thefirst element. With the size of the first element, all other elements can be retrieved from the XORlinked list by iterating over the element headers. When the partition is full, the storage starts againat the first address of the partition. Overwriting the header of the first element is particularlyproblematic in case of a power loss, as all necessary management information is stored in thisheader and may be lost. In order to prevent this, a special backup mechanism is applied that storesthe header of the first element in a reserved memory section before it is overwritten. In Figure2.15 an extract of the filesystem with a doubly linked list is shown.
To retrieve the elements again from the partitions, an iterator for each partition is provided. Bydefault, the iterator refers to the latest stored element. The iterator can be moved to the previouselement as well as to the next element. This allows the application to flexibly read the sequentiallystored elements. In addition, the filesystem offers an interface to clear a partition and to clear

40 CHAPTER 2. METHODS
Header
Addresses
0x1000 0 1 2
Mutual
reference
Element data
Header 3 4 5
6 7 8
6 bytes
0x1009
Element data
Figure 2.15: Filesystem with doubly linked list. Each element in the filesystem has a headerthat refers to the next and to the previous element. The elements are stored consecutively in thememory.
the entire memory. Clearing a partition is performed by deleting the first element header thatcontains the management information of the partition. The process of clearing the entire memoryis relatively time-consuming compared to deleting the first element header of the partitions, sinceall bytes in the memory must be reseted to their default values.
2.6.3 Filesystem integration
The storer module of the firmware is another abstraction above the filesystem. This modulemanages the storing and reading of the previous described data chunks in the filesystem. For eachof the data sources of section 2.4 an own partition with a configurable size is registered in thefilesystem. Furthermore, the ID and group number assigned to the badge during the activationare also stored in an own filesystem partition. The module has an interface to store a data chunkof a certain data source, for example a microphone chunk, in the corresponding partition. Thisinterface is used by the processing module of the data recording unit to store the recorded datachunks. The tinybuf module efficiently serializes the data chunks before they are stored. Finally,the stored data chunks are retrieved by the data exchange unit for the transmission to a remoteBLE device. The current setup of the system requires that data chunks must be retrievable froma certain timestamp in the past until now. This functionality is also implemented by the storermodule. First, the iterator of the partition is used to search for the oldest data chunk whosetimestamp is greater than or equal to the requested timestamp. Afterwards, starting from this datachunk, the next one can be retrieved with a function.
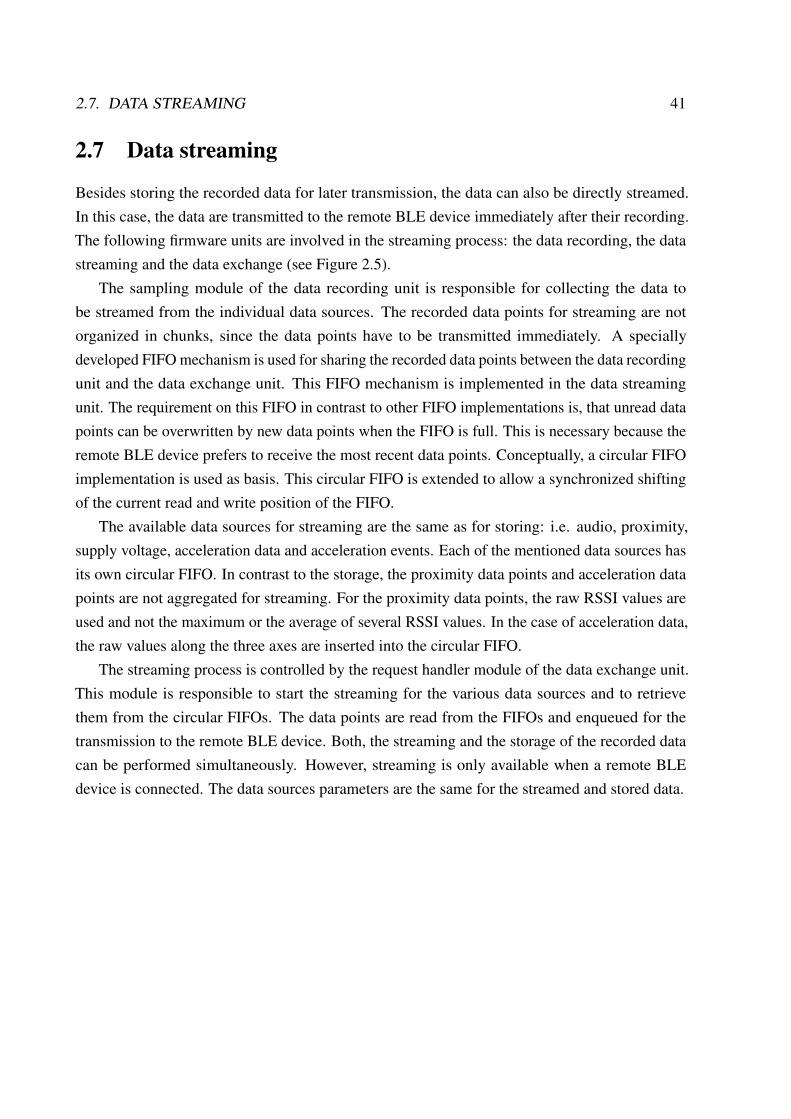
2.7. DATA STREAMING 41
2.7 Data streaming
Besides storing the recorded data for later transmission, the data can also be directly streamed.In this case, the data are transmitted to the remote BLE device immediately after their recording.The following firmware units are involved in the streaming process: the data recording, the datastreaming and the data exchange (see Figure 2.5).
The sampling module of the data recording unit is responsible for collecting the data tobe streamed from the individual data sources. The recorded data points for streaming are notorganized in chunks, since the data points have to be transmitted immediately. A speciallydeveloped FIFO mechanism is used for sharing the recorded data points between the data recordingunit and the data exchange unit. This FIFO mechanism is implemented in the data streamingunit. The requirement on this FIFO in contrast to other FIFO implementations is, that unread datapoints can be overwritten by new data points when the FIFO is full. This is necessary because theremote BLE device prefers to receive the most recent data points. Conceptually, a circular FIFOimplementation is used as basis. This circular FIFO is extended to allow a synchronized shiftingof the current read and write position of the FIFO.
The available data sources for streaming are the same as for storing: i.e. audio, proximity,supply voltage, acceleration data and acceleration events. Each of the mentioned data sources hasits own circular FIFO. In contrast to the storage, the proximity data points and acceleration datapoints are not aggregated for streaming. For the proximity data points, the raw RSSI values areused and not the maximum or the average of several RSSI values. In the case of acceleration data,the raw values along the three axes are inserted into the circular FIFO.
The streaming process is controlled by the request handler module of the data exchange unit.This module is responsible to start the streaming for the various data sources and to retrievethem from the circular FIFOs. The data points are read from the FIFOs and enqueued for thetransmission to the remote BLE device. Both, the streaming and the storage of the recorded datacan be performed simultaneously. However, streaming is only available when a remote BLEdevice is connected. The data sources parameters are the same for the streamed and stored data.

42 CHAPTER 2. METHODS
2.8 Data exchange
In order to access data from the badges for monitoring or analysis, it must be exchanged. The dataexchange unit of the firmware is responsible for the interaction with remote BLE devices and forcontrolling the behavior of the badge. This section provides an overview of the applied advertising-based and connection-oriented data exchange. In addition, the communication protocol, theprocessing of external requests and the clock synchronization are described in more detail.
2.8.1 Advertising
The periodic broadcasting of advertising packets by the badges is essential for the functionalityof the system. On the one hand, the advertising packets are received by other badges duringBluetooth scans. The RSSI values are used to determine the proximity between the badges. Onthe other hand, useful information can be retrieved to monitor the badges including the currentsupply voltage and the status of the badge.
The advertising process is managed by the advertising module of the data exchange unit. Withthis module the broadcasting of the advertising packet can be started or stopped. The device namethat appears in the badge’s advertising packet is “HDBDG”, the broadcasting period of the packetis 200 ms. In addition, the module has interfaces for inserting customized information into theadvertising packet. The customized information includes the ID and group number, the MACaddress, the current supply voltage and status information of the badge, e.g. the currently activateddata sources and whether its clock is synchronized or not. To minimize the size of the advertisingpacket, the status information flags are encoded by the bits of one status byte. Furthermore, thesupply voltage Vsupply, which has the data type float (4 bytes), is encoded in a single byte B bythe following compression:
B = Vsupply ∗ 100− 100 (2.4)
This compression allows a voltage range from 1 V to 3.55 V to be covered in one byte with aresolution of 0.01 V. The covered range is sufficient for the coin cell batteries. The receiver of theadvertising packet can calculate the original voltage by solving equation 2.4 for Vsupply.

2.8. DATA EXCHANGE 43
2.8.2 Connection-based communication
In addition to unidirectional data exchange based on advertising packets, bi-directional connection-based BLE communication can also be selected for data exchange. The remote BLE central device,for example a hub, initiates the connection. After the connection has been established, the NordicUART Service is used for the bi-directional communication. This BLE service has the RX- and theTX-characteristic. Using these two characteristics, raw bytes can be sent between the connectedBLE devices. When data are received, a notification in form of a callback is generated by theSoftDevice to handle the bytes. The number of bytes that can be transmitted by the applicationat once is limited to 20 bytes [Gom12]. To enable the transmission and reception of more than20 bytes, an additional abstraction based on the Nordic UART Service was implemented inthe sender module. Internally, this module uses two FIFOs, one for transmission and one forreception, to handle packets larger than 20 bytes. To transmit data, the application inserts the datainto the TX-FIFO. The sender module reads the first 20 bytes from the TX-FIFO and transmitsthem via the Nordic UART Service. This process is repeated until no more bytes are left in theTX-FIFO. The repetition time of this process is crucial for the resulting transmission speed. Tobe able to repeat the process, special mechanisms must be applied in order to avoid blockingthe application. It can be implemented in three different ways. The first approach registers acallback function in the SoftDevice, which is called as soon as the 20 bytes have been successfullytransmitted. If the TX-FIFO is not empty yet, the callback function reads the next 20 bytes (orless) from the TX-FIFO and restarts the transmission. The second available technique to achievethe repeated execution is the scheduler. The function that reads the bytes from the TX-FIFOand starts the transmission is executed again by inserting itself into the scheduler queue. Thethird method starts an asynchronous timer that periodically calls a function to read the bytesfrom the TX-FIFO and start the transmission. The timer is stopped as soon as there are no morebytes in the TX-FIFO. The advantage of the last approch is that the timer period is tunable viaa parameter so that the transmission speed can be influenced. Additionally, the highest datathroughput can be achieved with this method. Therefore, this timer-based approach is used in thenew implementation. Another method to influence the transmission speed is the adjustment ofthe connection interval settings on the remote BLE central device. The central device defines theconnection parameters used with the peripheral device. Smaller connection intervals imply higherdata throughput.
To handle the received data from the remote BLE device, the sender module uses a FIFO.As soon as data are received, they are inserted into this RX-FIFO. Furthermore, a registerablenotification handler is called to inform the application about the reception of data.

44 CHAPTER 2. METHODS
An additional feature of the sender module is the timeout mechanism to automatically discon-nect if no data exchange occurs within a predefined time interval. This is important in case thatthe disconnect event of the central device is not received by the badge. The automatic disconnectfeature can be disabled during development and testing.
2.8.3 Communication protocol
In addition to the physical data exchange of raw bytes, their correct interpretation by the involvedcommunication partners is essential for the functionality of the entire system. The interpretationof the raw bytes is enabled by a communication protocol. This protocol defines rules for recon-struction of the exchanged message. Since communication takes place between devices developedwith different programming languages, the rules of the communication protocol must also beimplemented in these languages. Therefore, the developed serialization library Tinybuf, whichsupports C and Python, is used for the implementation of the communication protocol. Tinybufenables a very simple, flexible and extensible design of messages to be exchanged. Furthermore,it is characterized by an efficient binary representation of the messages after serialization. Thesmaller the binary representation of the messages, the faster they can be exchanged. In theimplemented communication protocol, messages are divided into two groups: Requests andresponses. All messages transmitted from the remote BLE device to the badge are called requests.Conversely, all messages transmitted from the badge are referred as responses. All requests aswell as all responses are placed in a Tinybuf oneof field. By using oneof fields, the informationwhich message is encoded can be directly inserted into the binary representation. This eliminatesthe need to manually insert an additional header to identify the message. The sender moduledescribed above sequentially transmits all bytes in the TX-FIFO in 20 byte packets, withoutconsidering message boundaries. Therefore, additional information must be included in the binaryrepresentation so that the recipient can separate the messages. This additional information isprovided in the form of a 2 byte header, which contains the length of the following serializedmessage.
The entire communication process is managed by the request handler module of the dataexchange unit. This includes processing received requests, controlling the data recording unit,reading recorded data, and generating messages for transmission. The internal procedure forprocessing received messages is illustrated in Figure 2.16.
When data are received via the BLE interface, the notification handler is called to informthe request handler module that new data are available in the RX-FIFO of the sender module.Afterwards, the received data are read out and the request is reconstructed by decoding the binary

2.8. DATA EXCHANGE 45
success + no response required
failure
success
failure
success
failure
success + data remaining
Request
processing
Response
generation
Response
serialization
and sending
Notification
handler
Request
finished
Error handler (in case of too many failures)
Figure 2.16: Message processing. The flowchart shows the individual steps from receiving amessage to generating a response and transmitting it.
representation using the tinybuf module. The resulting request, such as assigning the badge IDand group number, is then processed. Requests can be divided into two groups: Requests thatexpect a response and those that do not. If no response is expected by the remote BLE device, theprocessing of the request is finished. Otherwise, a response must be generated, for instance froma data chunk read from memory. After the response is generated, it is serialized using the tinybufmodule and inserted into the TX-FIFO of the sender module. If further data have to be transmitted,the response generation is triggered again. If one of the steps is currently not executable because arequired resource is in use or not enough space is available in the TX-FIFO, the step is executedagain by the scheduler at a later time. In the case that a step fails too often, an error handler iscalled to reset the internal state and to perform a certain action, such as disconnecting from theremote BLE device.
The communication protocol offers a broad spectrum of available requests to control the badgeor to retrieve data from the badge. Each data source can be started by its own request, which alsoprovides the parameters for data recording. If a start request is received for an already runningdata source, it will be ignored unless the parameters have changed. The streaming of data pointsas well as the storage of data chunks for later transmission can be performed simultaneously. Tostop a specific data source, a stop request has to be sent to the badge. The stored data chunksof each data source can be retrieved from a particular timestamp in the past until now by a datarequest. In addition to the data related requests, further requests exist to manage the badge. Thestatus request enables the remote BLE device to retrieve the current status of the badge and tooptionally assign its ID and group number. Furthermore, requests are available to restart the badge,to perform peripheral testing, or to identify the badge by blinking one of its status LEDs.

46 CHAPTER 2. METHODS
2.8.4 Clock synchronization
An accurate time basis of the badges is essential for the subsequent data analysis. The timestampsof the data chunks are used to correlate the data of different badges in order to analyze thecommunication patterns of the participants. To achieve an accurate time basis, the badgessynchronize their internal clocks with an external time source. After the local time of the badgehas been synchronized, the incorporated RTC oscillator with a nominal frequency of 32768 Hz[Abr12] is used to provide the internal time. At its frequency, the oscillator increments an internaltick counter that starts at 0. Based on these oscillator ticks and the synchronized reference time,the current local time can be calculated with the following equation.
tcur =1
32768 Hz∗ (tickscur − ticksisync) + tisync (2.5)
In this equation, tcur denotes the calculated current time, tickscur is the number of ticks,ticksisync represents the number of ticks at the i-th synchronization timepoint and tisync is thei-th received synchronization time. The i-th synchronisation point corresponds to the latestsynchronisation point. The oscillator frequency is assumed to be constant over time. In general,this assumption is not correct as the frequency of the oscillators may drift over time. Althoughthe frequency error is usually quite small, the cumulative error over a long time period resultsin an observable difference in the calculated time [Hwa04]. Several reasons might exist for thefrequency deviation of oscillators from their specified frequency. On the one hand, environmentalfactors can influence the oscillator frequency. These include variations in temperature or supplyvoltage as well as physical vibrations or shocks. On the other hand, the manufacturing processand the aging of the oscillator itself might have an influence on its frequency [Els02] [Dia17].
To avoid a local clock drift, it is necessary to apply special synchronization techniques.The simplest approach is a frequent synchronization with an external accurate time source. Byensuring a small time interval between the synchronization points, the time error caused by drift isreduced. However, in addition to the local clock drift, it is also a challenge to provide an accurateexternal time source for the synchronization process. In order to create such an accurate externaltime base, various influencing factors have to be considered. First, the accuracy of the externaltime base itself plays an important role. Furthermore, several factors that influence the time fortransmission of the synchronization message must be taken into account. These include the timefrom message creation to transmission, the actual transmission time, and finally the time frommessage reception to processing [Els02]. A commonly used synchronization method is NTP[Mil91]. This technique is often applied for time synchronization of devices in variable-latencynetworks, such as the internet. It uses a software-based approach to compensate the latency of the

2.8. DATA EXCHANGE 47
synchronization message transfer and to adjust the local oscillator frequency to minimize the localtime drift. The Timing-sync Protocol for Sensor Networks (TPSN) from Ganeriwal et al. [Gan03]is based on the MAC layer of the communication interface. It uses the MAC layer to exchangethe synchronization timestamps between the devices. As a result, fluctuations in packet latencyare minimized and can be easily compensated.
In the current setup of the system multiple hubs provide the external time base for the badges.Therefore it is necessary to synchronize the hubs with each other. Since the hubs have access tothe internet, the NTP is used for this synchronization [Led16b]. Due to its complex protocol andenergy inefficiency, NTP has not been selected as synchronization technique between the badgesand the hubs. The TPSN is also not applicable because it requires access to the MAC layer of thecommunication interface, but the used SDK allows no direct access to the BLE MAC layer. Dueto the drawbacks of the described methods a simple, energy efficient but nevertheless effectivetime synchronisation technique was developed in this work. This technique has the advantage thatit is compatible with the protocol of the previous firmware and therefore no changes to the existinghub software have to be done. The time synchronization process of the badge is as follows: Thehub connects to the badge and sends a request containing the current timestamp. When the badgereceives this timestamp message, it retrieves the current number of oscillator ticks. Finally, thebadge takes the number of ticks and the received timestamp to adjust its internal time.
The resulting equations are explained in more detail in the following. The current time tcuris calculated similarly to equation 2.5. The only difference is that the slope of the straight lineis no longer constant. The slope mi is the EWMA of the latest optimal slope mi. The latestoptimal slope mi is the slope of the line between the i− 1-th and the i-th synchronization point.The optimal slope mi is limited by plausible values for the oscillator frequency. The limitingparameter is fdev, which describes the maximum deviation from the nominal frequency. Thislimitation enables robustness against outliers.
tcur = mi ∗ (tickscur − ticksisync) + tisync (2.6)
mi =
m1, i = 1
α ∗mi + (1− α) ∗mi−1, i > 1(2.7)
mi =
132768 Hz , i = 1
min{max
{tisync−ti−1
sync
ticksisync−ticksi−1sync
; 132768 Hz+fdev
}; 132768 Hz−fdev
}, i > 1
(2.8)

48 CHAPTER 2. METHODS
The presented time synchronization technique enables the robust compensation of time driftscaused by oscillator frequency changes and is characterized by a simple iterative implementationwith basic arithmetic operations. The tunable parameters of the method are the α coefficient ofthe EWMA and the maximum frequency deviation fdev. In Figure 2.17 the functionality of themethod is illustrated and compared to the approch with a constant slope.
100 200 300 400 500Oscillator ticks
10
12
14
16
18
20
Milli
seco
nds
Synchronized msExtrapolated msError ms
(a)
100 200 300 400 500Oscillator ticks
10
12
14
16
18
20
Milli
seco
nds
Synchronized msExtrapolated msError ms
(b)
Figure 2.17: Illustration time synchronization. Figure (a) shows the constant slope approach.The black circles represents the synchronization points, the blue line corresponds to the lineequation 2.5 with constant slope and the red line illustrate the error between the internal time andthe synchronized time. Due to the constant slope of the straight line, the error cannot be reduced.In contrast, Figure (b) illustrates the method with variable slope from equation 2.6. In this case,the error decreases because the slope of the straight line approaches the true slope.

Chapter 3
Results
In this chapter, results are presented for the various methods described in detail in the preced-ing chapter. First, the developed serialization library Tinybuf is evaluated. Afterwards, thetransmission speed of the different approaches for the exchange of large amounts of data viathe bi-directional BLE connection is analyzed. Then the implemented clock synchronizationtechnique is investigated. Subsequently, the audio data recording strategy is examined. Finally, theresults of the power consumption analysis of the badge in different operating modes is presented.
3.1 Serialization performance
An important factor for both data transmission and data storage is the performance of the de-/serialization technique. The performance can be divided into two categories. The first one is theresulting size of the serialized binary representation of a message. The smaller this size, the moredata can be transferred or stored. The second one is the time required to perform the serializationor deserialization of data. The longer the execution time, the more energy is consumed. Therefore,this time should be as short as possible.
To evaluate the performance of the developed de-/serialization library Tinybuf, Google’sProtocol Buffers library is used as reference. Since most messages of the badge for transmissionand storage typically consist of arrays, a simple message with a repeated field is used for evaluation.The repeated field should contain up to 100 unsigned integer values with a maximum of 2 bytes.On the one hand, the Tinybuf generator creates a 2 byte unsigned integer array with 100 elements.On the other hand, Protocol Buffers uses an array of 100 varint encoded unsigned integer elements.
Due to the varint encoding of the Protocol Buffers library, the resulting encoded length dependson the element values. In order to evaluate this influence, two different approaches are used to
49

50 CHAPTER 3. RESULTS
generate the integer values. In the first approach all array elements have the same integer value.The integer value range is from 25 to 216. In the second approach, the integer values are notconstant across the array, but are randomly derived from an uniform distribution. The value rangefor the uniform distribution starts at 0 and ends with the same values as for the first approach. Theresulting encoded length for Tinybuf and Protocol Buffers is shown in Figure 3.1. The encodedlength for Tinybuf is constant for the investigated integer values. For Protocol Buffers, the encodedlength depends on the integer values of the array.
26 28 210 212 214 216
Integer value range
100
125
150
175
200
225
250
275
300
Enco
ded
leng
th (b
ytes
)
TinybufProtocol Buffersrandom valuesProtocol Buffersconstant values
Figure 3.1: Encoded length. The plot shows the comparison between the encoded length forTinybuf and Protocol Buffers for an array of 100 integer elements.
Both Tinybuf and Protocol Buffers support the programming languages C and Python. For theevaluation of the execution time for encoding and decoding, the described message with a repeatedfield consisting of 100 integer elements is also used. The evaluation of the C implementation hasbeen performed on the nRF51822. The Python based implementation has been analyzed on a64-bit Windows 10 machine with i5 2.5 GHz dual core. The results of the required times of bothimplementations are shown in Figure 3.2. It can be seen, that for both implementations Tinybuf isfaster than Protocol Buffers.

3.2. TRANSMISSION SPEED 51
Encode Decode0
500
1000
1500
2000
Requ
ired
time
(s)
TinybufProtocol Buffers
(a)
Encode Decode0
100
200
300
400
500
600
700
Requ
ired
time
(s)
TinybufProtocol Buffers
(b)
Figure 3.2: Encoding and decoding execution times. For the analysis of the execution times,integer values have been chosen so that the resulting encoded length for Tinybuf and ProtocolBuffers is identical. In (a) the required time of the C implementations executed on the nRF51822is depicted. The results for the Python implementations are shown in (b). The execution timeshave been averaged over multiple measurements.
3.2 Transmission speed
The transmission speed or data throughput of the BLE interface is an important factor for thefunctionality of the system. The transfer of multiple microphone-chunks is used to determine thedata throughput of the badge. The transferred microphone-chunks have a constant size of 127bytes. Based on the number of chunks received and the time elapsed since the request for the data,the remote BLE device can calculate the transmission speed. The used BLE connection interval is50 ms.
The data throughput of the implemented timer-based approach, scheduler-based approach andSoftDevice callback approach are analyzed. The data throughput of the timer-based approach,which periodically tries to transmit the next 20 bytes via the Nordic UART Service, depends onthe selected timer period. The theoretically possible data throughput as a function of the timerperiod TT imer can be computed as follows:
Throughput =20 bytesTT imer
(3.1)
Figure 3.3 shows the measured data throughput of the timer-based approach in dependency of thetimer period. Figure 3.4 presents a comparision between the three different approaches.

52 CHAPTER 3. RESULTS
0 10 20 30 40 50Timer period (ms)
0
500
1000
1500
2000
2500Da
ta th
roug
hput
(byt
es/s
)TheoreticalMeasured
Figure 3.3: Throughput timer-based approach. The measured data throughput of the timer-based approach as function of the timer period is depicted by the blue line. In contrast, the redline illustrates the theoretical possible data throughput.
Previousimplementation
BLE-Callbackapproach
Timer-basedapproach (6 ms)
0
500
1000
1500
2000
2500
Data
thro
ughp
ut (b
ytes
/s)
Figure 3.4: Comparison data throughput. The previous implementation of the firmware usesthe scheduler-based approach for data transmission. The SoftDevice callback approach is theslowest approach. The timer-based approach developed in this work is the fastest for a certaintimer period.

3.3. CLOCK SYNCHRONIZATION 53
3.3 Clock synchronization
In order to determine the accuracy of the implemented clock synchronization technique, syn-chronisation messages have been sent to the badge in randomized intervals between 0 and 600seconds, which closely approaches a realistic deployment scenario. Each time the badge receivesa message, it outputs the received timestamp and the oscillator ticks at the reception point via itsserial interface. This serial output is recorded and afterwards the set of tuples is used to evaluatethe synchronisation accuracy.
For the evaluation of accuracy, the difference between the received timestamp and the internaltime at the reception point is used. The higher this difference (error), the less accurately theinternal clock is synchronized. In Figure 3.5 a typical error graph over a period of approximately9.5 hours is shown.
0.0 0.2 0.4 0.6 0.8 1.0Ticks 1e9
80
60
40
20
0
20
40
Erro
r (m
s)
EWMA slopeConstant slope
Figure 3.5: Typical error graphs. The red graph represents the errors at the synchronizationpoints when a constant oscillator frequency of 32768 Hz is assumed. In contrast, the blue graphshows the errors when the EWMA slope technique with the parameters α = 0.1 and fdev = 4.0 isapplied. A negative error implies that the internal time of the badge is slower than the externaltime.
The error of the constant slope method can be explained by a constant frequency deviationof the oscillator frequency. This frequency offset is illustrated in Figure 3.6. It shows thesynchronization error in dependency of the time since the last synchronization. The longer the

54 CHAPTER 3. RESULTS
time since the last synchronization point, the greater the accumulation of the internal time errordue to a deviating oscillator frequency. Especially, the constant slope method suffers from thiseffect. The EWMA slope technique can almost completely compensate this oscillator deviation.
0.00 0.25 0.50 0.75 1.00 1.25 1.50 1.75 2.00Ticks since last sync 1e7
80
60
40
20
0
20
40
Erro
r (m
s)
EWMA slopeEWMA slope fitConstant slopeConstant slope fit
Figure 3.6: Frequency offset. The x axis represents the time difference to the last synchronizationmessage. The plots show the measured time error and a fitted straight line to estimate the frequencydeviation.
The tunable parameters for the developed EWMA slope technique are the α coefficient andthe maximum frequency deviation fdev. These parameters have to be optimized to achieve a smallsynchronization error. As measure for the goodness of a parameter combination, the mean of theabsolute synchronization errors has been taken. The smaller this value, the better the parametercombination. An example for an optimization of the two parameters is shown in Figure 3.7. Avalue of 0 for α corresponds to the initial case with constant slope and its average absolute errorcan be regarded as a reference value for the optimization. The optimal parameter combinationfound for several measurements is shown in Table 3.1.

3.3. CLOCK SYNCHRONIZATION 55
0.0 0.2 0.4 0.6 0.8 1.0 coefficient
6
8
10
12
14
16
18
Mea
n ab
solu
te e
rror (
ms)
fdev (Hz)1.02.03.04.05.06.0
Figure 3.7: Clock synchronization optimization. The plot shows the mean absolute error independence of the parameters α and fdev. The optimal point for each parameter combinationis marked with a black circle. In this measurement, the optimal parameter combination is atα = 0.102 and fdev = 6.
µ σ
α 0.11 0.089
fdev 3.833 0.898
Table 3.1: Optimal parameters clock synchronization. The table shows the mean (µ) andthe standard deviation (σ) of the distribution of the optimal parameters α and fdev for severalmeasurements.

56 CHAPTER 3. RESULTS
3.4 Audio data
The low-pass filtered audio signal of the microphone is sampled with a period of 1.42 ms. Every1.42 ms the timer callback function is invoked for reading the digitized value from the ADC.In the previous implementation of the firmware, not one but several readings are taken at eachfunction call to provide more samples for averaging. This averaging is performed every 50 ms.
Since the sampling process of the microphone is rather power-intensive, it was examinedin more detail. The previous implementation spends about 0.1 ms every 1.42 ms to performmicrophone readings. During this time interval, two microphone readings can be taken. Todetermine the influence of the number of samples, the resulting averaged signal is recorded andcompared with different number of samples. In Figure 3.8 the results are shown.
0.0 2.5 5.0 7.5 10.0 12.5 15.0 17.5 20.0Time (s)
0
20
40
60
80
Aver
aged
micr
opho
ne v
alue
ove
r 50
ms Number of microphone
samples every 1.42 ms4 samples3 samples2 samples1 sample
Figure 3.8: Audio signal with different sample numbers. The figure shows an exemplarilyaveraged audio signal with noises for a 20 seconds time interval. The averaged audio signals arecomputed based on different number of samples every 1.42 ms.
The goal is to minimize the number of samples in order to maximize the time the CPU is insleep mode, leading to a reduced power consumption of the badge. Therefore, the quality of theaveraged audio signal as function of the number of samples is investigated. The mean absoluteerror (MAE) is used as a measure for the difference between two signals. This measure is suitableto quantify the difference between two signals xi and yi [Wil05]. The MAE is computed based on

3.4. AUDIO DATA 57
N observation points with the following equation:
MAE =1
N
N∑
i=1
|xi − yi| (3.2)
The resulting MAE based on multiple measurements is shown in Figure 3.9. Since the signal differ-ence between using one sample and using multiple samples is negligible, the new implementationreads only one sample every 1.42 ms to reduce power consumption.
1 vs 2 samplesevery 1.42 ms
1 vs 3 samplesevery 1.42 ms
1 vs 4 samplesevery 1.42 ms
0.0
0.1
0.2
0.3
0.4
0.5
0.6
Mea
n ab
solu
te e
rror
Figure 3.9: Audio signal difference. The signal error between different numbers of samples forthe calculation of the averaged signal. The error is calculated over several measurements with atime interval of 20 seconds each (due to equation 3.2).

58 CHAPTER 3. RESULTS
3.5 Power consumption
The total power consumption of the badge is composed of the consumption of its various com-ponents. To determine this important quantity, the Power Profiler Kit of Nordic Semiconductor[Nor16b] is used. This kit supports a current measurement resolution down to 0.2 µA at a samplingrate of 77 kHz. The measured current of an external device under test (DUT), such as a badge,is transfered via a nRF51 or nRF52 Development Kit to an application that plots the measuredcurrent in real-time. To obtain a representative value for the power consumption, the measuredcurrent is averaged over a configurable time interval.
The power consumption of the data sources, such as the accelerometer, is heavily dependenton their parameterization. In the following, the measured value of each data source also includesthe consumption of the associated data processing and storage. Figure 3.10 shows the influenceof the accelerometer datarate and the read period of the acceleration FIFO. The more frequentlythe FIFO is read, the more often the CPU has to leave the sleep mode, which results in increasedpower consumption. The datarate of the accelerometer not only influences the power consumptionof the accelerometer itself, but also that of the entire system, since the amount of data to be storedis also affected.
150 200 250 300 350 400 450 500FIFO read period (ms)
0
10
20
30
40
50
60
70
80
Aver
age
curre
nt c
onsu
mpt
ion
(A)
Accelerometer datarate10 Hz25 Hz50 Hz
Figure 3.10: Accelerometer consumption. The figure shows the average power consumption ofthe badge as function of the FIFO read period for different accelerometer datarates.

3.5. POWER CONSUMPTION 59
The averaged current consumption of each component is shown in Figure 3.11. The parametersthat influence the power consumption of the badges have been selected appropriate to simulate arealistic deployment scenario. The parameters and a description of the different components aresummarized in Table 3.2.
Baseline
Advertising
Microphone
record Scanrecord Data
transferAcce
leration
recordAcce
leration
event record Battery
record0
100
200
300
400
500
600
700
800
Aver
age
curre
nt c
onsu
mpt
ion
(A)
Previous implementationNew implementationNew implementationadditional
Figure 3.11: Average current consumption overview. The average current consumption ofthe different components is depicted with bar graphs. For each component, the consumption ofthe previous implementation is compared to the new implementation. Since the supply voltageand accelerometer are not used as data sources in the previous implementation, the additionalconsumption of these components in the new implementation is considered separately.

60 CHAPTER 3. RESULTS
Component Description Parameters
Baseline Sleep mode and default enabled peripherals -
Advertising The periodical broadcast of the advertisingpacket
200 ms advertising pe-riod
Microphonerecord
The microphone reading, averaging and chunkstorage
1.42 ms reading period50 ms average period
Scan record The BLE device scanning, sorting and chunkstorage
100 ms scan window300 ms scan interval3 s scan duration15 s scan period
Datatransfer
Data reading and exchange via the BLE connec-tion (assumption: connection established every5 minutes)
-
Accelerationrecord
Acceleration reading, processing and chunk stor-age
10 Hz datarateNormal operation mode500 ms FIFO period
Accelerationevent record
Acceleration event processing and storage (as-sumption: event detected every 5 seconds)
10 Hz datarateNormal operation mode
Battery record Supply voltage reading and storage 60 s reading period
Table 3.2: Component description power analysis. The table describes various components ofthe badge that are important for the power consumption analysis. In addition, the parameters usedfor the analysis are specified.

Chapter 4
Discussion
The goal of this work is the development of a new firmware for the badges of the Rhythm project.Various methods were developed to provide a modular, testable and maintainable architecture ofthe application. These include methods for efficient serialization and storage of structured data,increasing transmission speed, accurate clock synchronization, and optimizing power consumption.This chapter discusses the results in detail and compares them to the previous implementation ofthe firmware.
4.1 Serialization performance
The developed de-/serialization technique Tinybuf offers the possibility to define messages in aflexible way, which can be serialized very efficiently. Tinybuf automatically generates sourcecode for various programming languages. This leads to faster development processes, sincethe de-/serialization functionality does not have to be implemented manually. In the previousimplementation of the firmware each message has its own de-/serialization function. Therefore,in cases where existing messages have to be changed or new messages have to be added, thisapproch is inflexible.
To validate the performance of the developed technique, Tinybuf was compared to Google’sProtocol Buffers library. For the evaluation, a simple message was used containing a field of 100integer elements, each with a size of 2 bytes. The performance test was splitted into two parts:Evaluation of the resulting encoded length of the binary representation and the evaluation of theexecution time for serialization and deserialization.
The results showed, that the encoded length produced by Tinybuf is always 201 bytes long,independent of the chosen integer value of the elements. In contrast, the encoded length of the
61

62 CHAPTER 4. DISCUSSION
message serialized with Protocol Buffers depends strongly on the individual values of the elements,since varint encoding is applied. To substantiate the facts, if the integer values are smaller than27, the encoded length is 102 bytes. In case, that integer values are in the range from 27 to 214,the binary representation has a size of 203 bytes. Finally, if all integer values are greater than orequal to 214, the resulting encoded length produced by Protocol Buffers is 303 bytes. In a realisticscenario, the values are usually distributed randomly over a certain range of values. In this case,the resulting encoded length of Protocol Buffers is partially smaller than, equal to or greater thanthe encoded length of Tinybuf, depending on the chosen range and distribution. However, thesize of the memory to be reserved in RAM for the encoded message differs significantly. ForProtocol Buffers, the worst case must be assumed, which in this case corresponds to an encodedlength of 303 bytes. In contrast, Tinybuf guarantees an encoded length of 201 bytes. Especiallywhen multiple messages with repeated integer fields are defined, the use of Tinybuf considerablyreduces the amount of RAM space to be reserved.
In addition, a significant difference was found regarding the encoded length when usingrepeated fields with another message as data type. This is for example the case in the scan-chunkmessage. A scan-chunk contains a repeated field of messages, which includes the discovereddevice, the corresponding RSSI value and a counter how often the device has been seen (see Figure4.1). In this case, Protocol Buffers adds a field identifier for each field in the ScanResultData-type,which in turn results in a high overhead in the encoded message. As an example: If 29 deviceshas been discovered in a scan, the resulting encoded length for Protocol Buffers is approximately300 bytes. In contrast, Tinybuf encodes the message in only 123 bytes.
message ScanResultData { required uint16 ID;
required int8 rssi; required uint8 count;
} message ScanChunk { required Timestamp timestamp; repeated ScanResultData scan_result_data[29]; }
Figure 4.1: Scan Chunk. The message definition of a scan-chunk. It consists of a timestamp,and an array of scan result data (with device ID, aggregated RSSI value and counter).
The second performance criterion is the execution time of the encoding and decoding op-erations. Both the C and the Python implementations of Tinybuf perform serialization anddeserialization faster than Protocol Buffers. The faster execution time of the encode and decode

4.2. TRANSMISSION SPEED 63
process can be explained by the fact that Protocol Buffers uses varint representation. This inte-ger representation requires more operations than the simple integer byte representation used byTinybuf.
As mentioned above, Tinybuf enables the efficient encoding and decoding of messagesindependent of the actual values of the message fields. Especially, the encoding of repeatedmessage fields results in a significantly smaller binary representation compared to ProtocolBuffers. Futhermore, Tinybuf’s serialized messages are compatible with the previous protocolimplementation and therefore enables the simple integration into the existing system.
4.2 Transmission speed
The Nordic UART Service is used for the bi-directional data exchange between the badges and aremote BLE device. This service allows to transmit a maximum of 20 bytes at once. In order toexchange larger quantities of data, it is necessary to divide the data into 20 byte units and transmitthem one after the other. The time between two consecutive packets is crucial for the resultingtransmission speed. The shorter this time, the higher the resulting data throughput. To performthe repeated transmission of 20 byte packages until no more bytes have to be transmitted, threedifferent approaches were evaluated.
The timer-based approach repeats the transmission at a configurable period. The measuredeffect of the timer period corresponds approximately to the expected theoretical effect. In fact, themeasured data throughput is smaller than the theoretical one. This can be explained as a result ofthe measurement technique used to determine the throughput.
During one run, the method sends a microphone data request to the badge whereupon the badgetransmits a certain amount of microphone-chunks. The time recording starts with transmittingthe request and stops with the reception of the last chunk. This implies that not only the actualtransmission time is measured, but also the time needed to read the chunks from the NVMs and toserialize them. The faster the actual data transmission, the greater the influence of the additionaltime needed to generate the data packets.
Additionally, the theoretical possible data throughput is limited by the maximum transmissionspeed of the BLE interface. The maximum possible data throughput of the SoftDevice dependson the connection interval and the number of packets transmitted per connection event. TheSoftDevice S130 can transmit up to 6 packets per connection event [Nor16c]. Since the selectedconnection interval for the evaluation was 50 ms, the resulting maximum possible data throughputis 2400 bytes per second.

64 CHAPTER 4. DISCUSSION
As the data throughput cannot be significantly increased with timer periods smaller than 6ms, this value has been selected as the optimal timer period. The resulting data throughput of thetimer-based approach with a timer period of 6 ms is approximately 2300 bytes per second. Sincethis value is by far the highest, this approach has been used in the new firmware.
In contrast, the scheduler-based approach applied in the previous implementation of thefirmware provides a data throughput of approximately 730 bytes per second. Here, the transmissionof 20 bytes is repeated by inserting the function, which is responsible for the transmission, in thescheduler queue until no more bytes are left. Since other operations are also inserted into thisqueue, for example the execution of data storage, the repeated transmission process is delayedand consequently the data throughput decreases.
The last approach, which uses the SoftDevice callback to trigger the transmission of the 20byte packages, has the smallest data throughput with approximately 180 bytes per second. TheSoftDevice invokes the callback function if the packet has been transmitted and acknowledgedsuccessfully during a connection event. Depending on the connection interval settings, the durationuntil the callback function is called can be rather long.
4.3 Clock synchronization
The incorporated low-power RTC oscillator with a nominal frequency of 32768 Hz is used asclock source for the internal time of the badge. The time is synchronized by messages that arereceived from a remote BLE central device, such as a hub, during a connection. These messagescontain the current global timestamp to provide the same time base for all badges. For an accuratetime synchronization, various factors must be considered, such as the internal drift of the oscillatorfrequency, the accuracy of the external time base, and the duration between the transmission andreception of the synchronization message.
To evaluate the resulting accuracy of the developed technique with a self-adapting oscillatorfrequency, it is compared to the previous implementation with a constant frequency. In thelatter, long time intervals between the synchronization messages results in a significant time errorcaused by a deviating oscillator frequency. The measured time error of the constant frequencyapproach was up to 40 ms for a synchronization period of 10 minutes. In contrast, with theself-adapting frequency approach, the error could be reduced to 8 ms for the same synchronizationperiod. In order to simulate a real deployment scenario, the synchronization messages weretransmitted in random time intervals. To quantify the time error, the MAE over a time period of9.5 hours was computed. The MAE of the constant frequency approach was 19 ms. By using

4.3. CLOCK SYNCHRONIZATION 65
the self-adapting approach with an optimal choice of parameters, the MAE was reduced to 5 ms.The optimal parameter combination was determined over several measurements and multiplebadges. For the α-coefficient of the EWMA slope the value of 0.11 ± 0.089 was found. For thefrequency deviation fdev the value of 3.833 ± 0.898 Hz was identified. In general, the smallerthe value fdev, the larger α must be chosen to compensate an oscillator frequency drift. This canbe explained by the fact that with smaller fdev less influence is exerted on the current frequencyat each synchronization point. Therefore, α must be chosen larger to expedite the correction.However, a too large α causes outliers to have a strong influence on the frequency calculation anda too small α implies a very slow compensation of the oscillator drift. A similar situation appliesfor the choice of fdev: On the one hand, a too small fdev can prevent a high drift from beingcompletely compensated, because fdev limits the adjusted oscillator frequency to a predefinedrange. On the other hand, a too large fdev allows outliers to have a high impact on the adjustedfrequency. Therefore, a compromise must be found between robustness against outliers, thefast compensation of the oscillator frequency drift and the maximum compensatable drift. Thefound optimal parameter combination represents such a compromise. The presented self-adjustingoscillator frequency technique significantly improves the internal time accuracy compared to theprevious implementation.
One limitation of the self-adjusting frequency approach is that it assumes a constant timebetween the transmission and the reception of the synchronization message. Since a BLEconnection is used for the transmission, the synchronization messages are only sent duringconnection events. Depending on the connection interval settings, the latency between thegeneration of the message and its actual transmission can vary between a few milliseconds up toseveral seconds. This is the reason, why there is noise in the time synchronization although thedrift compensation is applied. This random time offset can be prevented if the timestamp exchangeis implemented on the MAC layer of the communication interface as in the TPSN [Gan03]. Sincethe used SDK provides no interface to control the BLE MAC layer, this technique cannot beapplied. Another approach to compensate this influence is the use of linear regression overmany cycles of synchronization messages [Els02]. The implementation of the linear regressiontechnique could be investigated in future developments of the system.

66 CHAPTER 4. DISCUSSION
4.4 Audio data
The recording of the audio signal generated by the microphone has a strong influence on the powerconsumption of the system. Therefore, the audio recording process has been specially analyzed inorder to find solutions for reducing the power consumption. The amplified and low-pass filteredaudio signal is sampled with a frequency of 700 Hz. The recorded samples are averaged over atime interval of 50 ms to obtain a representative value for vocal activity within this interval. Thepurpose of this averaging is to minimize the amount of data to be stored while still ensuring agood time resolution.
This sampling and averaging process is controlled by two timers: The first timer reads theraw audio signal at a period of 1.42 ms (= 700 Hz), accumulates the values in a variable andincrements the counter in which the number of readings is stored. The second timer calculatesthe average of the audio signal every 50 ms by dividing the accumulated value by the counter. Inthe previous implementation of the firmware, the first timer function reads not only one but twoaudio samples for the accumulation. The detailed analysis showed that the quality of the audiosignal was not significantly influenced by the number of chosen samples. In other words, theaudio signal difference between using one sample and multiple samples is negligible. To underpinthis statement, the MAE between the averaged signal over 20 seconds using one sample and twosamples is 0.22 ± 0.05.
The small difference between using one sample and multiple samples can be explained bythe analog low-pass filter. The low-pass filter limits the maximal frequency in the signal to itscutoff-frequency of approximately 340 Hz. The time that is required to perform one ADC reading,to accumulate the value and to increment the counter is in total approximately 50 µs. When readingmultiple samples, this corresponds to a sampling frequency of 20 kHz. Since the frequency in theaudio signal is limited to a maximum of 340 Hz, the difference between two consecutive samplesrecorded at a frequency of 20 kHz is negligible. Based on this result, in the new implementationonly one sample is recorded every 1.42 ms, leading to a reduction of power consumption.
For the later communication pattern analysis only the vocal activity, which indicates howoften a participant speaks and at what volume, is of relevance. Therefore, it would be sufficient torecord the amplitude envelope of the audio signal. In future designs an envelope detector [Lia12]could be integrated to further reduce the sampling rate.

4.5. POWER CONSUMPTION 67
4.5 Power consumption
The power supply of the badge is provided by a 3 Volts coin cell battery. A common value for thecapacity of these batteries is 230 mAh [VAR16]. As this available amount of energy is rather low,the overall power consumption of the badge must be minimized to ensure an enlarged operatingtime.
The power consumption of the badge is composed of several components. In the inactive statethe badge consumes about 244 µA. This baseline consumption includes the sleep state currentof the nRF51822, the EEPROM and the accelerometer. The following components, which areturned on by default, have the greatest impact on the consumption in the inactive state: the analogmicrophone (155 µA), the analog amplifier circuit (20 µA) and the voltage regulator (65 µA).The periodical broadcast of the advertising packet every 200 ms leads to an average currentconsumption of 130 µA. The power consumption of the audio signal recording is different forthe previous and the new implementation of the firmware. The first-mentioned one reads twosamples every 1.42 ms and consumes about 564 µA. The new implementation reads only onesample, because the audio quality of the averaged signal is comparable. As a result, the averagecurrent consumption can be reduced to 350 µA.
The scan process for surrounding BLE devices has the highest consumption of all components.This can be explained by the high consumption of the active receive operation of the nRF51822,which draws up to 13 mA [Nor16a]. The averaged power consumption of the scan process isapproximately 800 µA. Although the current consumption during the BLE data transfer is slightlyhigher in the new implementation, the average power consumption (64 µA) was considerablydecreased compared to the previous one (173 µA). This can be attributed to the significantlyhigher data throughput. Since the new implementation includes additional data sources, such asthe accelerometer, an additional consumption (42 µA) is generated for their data transmission.The recording of raw acceleration data consumes about 15 µA on average, the acceleration eventrecording about 10 µA and the supply voltage recording about 2 µA. As already mentioned inthe previous chapter, the consumption of the components is highly dependent on the parametersettings.
Finally, for the developed firmware, the total average power consumption of the badgeincluding the additional data sources is 1.66 mA. This results in a theoretically possible lifetime ofapproximately 5.7 days (using a 3 V, 230 mAh coin cell battery). This theoretical lifetime cannotbe achieved as the available capacity of coin cells decreases due to high current peaks that aretypical for BLE applications [Fur11].

68 CHAPTER 4. DISCUSSION
4.6 Filesystem
The implemented filesystem and virtual memory abstraction enables the developer to easily accessthe NVMs for sequential storing and reading. The filesystem divides the memory into partitionswith a configurable size. A partition can be initialized as static or dynamic. In a static partition allelements, such as data chunks, must have the same size. In contrast, a dynamic partition allows avariable length of elements. Within a dynamic partition an XOR linked list is used to efficientlymanage sequential store and read operations.
In the previous implementation, the two physical memories, flash-memory and EEPROM, areconsidered separately. In the flash-memory the recorded microphone-chunks are stored. In theEEPROM the assigned ID and group number as well as the scan-chunks are stored. Due to thisstrict separation it is not possible to divide the available storage space evenly between the datasources. In addition, the data chunks must have a certain size so that they can be stored word-and page-aligned in memory. To meet these alignment requirements, the data chunks must bepartially padded. The use of padding might waste usable memory space. Since in the previousimplementation scan-chunks have a fixed size, memory is wasted if only few devices have beendiscovered during the scan process.
The developed filesystem based on the virtual memory with byte level access overcomes theselimitations. Since there is only one large virtual memory, the available memory space can bedivided arbitrarily between the data sources. In addition, padding is not required anymore dueto the byte level access. The storage of variable size scan-chunks can be realized in a dynamicpartition without wasting memory space. Another advantage of a dynamic partition is that itenables data compression, which generally results in a variable size of data [Szp11].
The implemented filesystem has also some restrictions: For instance, the filesystem does notprovide a mechanism for deleting data elements, but only for sequentially overwriting old elements.Therefore, the filesystem is not suitable for applications which are not based on sequential datageneration and retrieval. Furthermore, the filesystem requires access to the memory at byte level.This implies that an abstraction layer must be implemented if the underlying memory does notallow byte level access.

Chapter 5
Conclusion
Teamwork is becoming increasingly important these days. Collaboration in groups is oftenused to solve complex problems or to develop new solution strategies. In order to improve thecollaboration and productivity of a group, the behavior within and between groups must beunderstood. For the analysis of group dynamics, special techniques must be applied to quantifythe social interaction and communication behavior of members. The open-source Rhythm project[Led18] provides a platform with various tools and devices for analyzing face-to-face interactions,such as turn-taking and speech overlap. These include electronic badges, which each participantwears in front of his chest. The badges are able to record vocal activity, movement, proximity toothers and absolute location. The recorded data can be retrieved during the deployment of thebadges to perform analysis and to optionally provide real-time feedback to the participants.
As part of this work, the firmware of the badges was reimplemented and optimized formodularity, maintainability and extensibility. For this purpose, a strict separation between thedifferent functional units and a high degree of abstraction was introduced. Furthermore, aframework was designed that enables the simple creation, execution and assessment of tests. Byapplying thoroughly testing, implementation errors can be detected and corrected quickly.
Besides the data sources already supported by the previous firmware, such as audio andproximity, the new firmware provides raw acceleration data, the detection of certain accelerationevents and the supply voltage as new data sources. Since the recording of audio data is power-intensive, it has been examined more closely. The evaluation results clearly showed that thenumber of samples read every 1.42 ms has negligible influence on the averaged audio signal.Therefore, the new firmware reads only one sample every 1.42 ms, which significantly reducespower consumption compared to the previous implementation.
A generic serialization library called Tinybuf was developed for the efficient and platform-
69

70 CHAPTER 5. CONCLUSION
independent de-/serialization of structured data. It processes predefined messages to automaticallycreate optimized source code for encoding and decoding. The new firmware uses Tinybuf forthe serialization of structured data prior to storage. Furthermore, it is used to provide a flexibleand efficient protocol for the communication with remote BLE devices. In a benchmark it wascompared to Google’s Protocol Buffers de-/serialization library. Tinybuf executes the encodingand decoding faster than Protocol Buffers, has a smaller binary representation in most cases, andis compatible with the previous protocol implementation.
In addition, a filesystem was developed in this work, which enables an efficient storage ofsequentially generated data in the NVMs. It is based on a virtual memory representation with bytelevel access, which abstracts the different memory types. The filesystem is designed to withstandpower loss during memory accesses. It physically separates the available memory into partitionsfor the different types of data. The partitions can be configured to support either fixed or variablesize elements. In addition to data storage, the new firmware also supports data streaming.
For the communication between the badges and remote BLE devices, a flexible communicationprotocol on the basis of the Tinybuf serialization library was implemented. The protocol providesvarious commands to control, monitor and retrieve data from the badge. Furthermore, a techniquewas applied to significantly increase the data throughput via the BLE connection compared to theprevious implementation. This reduces the time required to transmit data and thus reducing thepower consumption of the badge. Additionally, a clock sychronization method was developed thatenables the effective compensation of oscillator frequency drifts. It leads to a preciser internaltime computation and is compatible with the previous protocol implementation.
Due to the modularization and strict separation of functionalities in the new firmware, thedeveloped methods can also be applied in related projects and on other platforms. In addition, theproject can serve as a reference for modular embedded software development that allows simpleverification of functionalities.
In future work various further developments of the system could be realized. One importantpart is the evaluation of the accelerometer to determine reasonable parameters for datarate,operating mode and event detection threshold. Furthermore, the accelerometer could be usedto automatically deactivate data recording if no movement of the badge/user has been detectedwithin a predefined time interval. For even further reduction of power consumption, the individualparameters of the other data sources could be investigated in more detail.
A useful technique for increasing the amount of data that can be stored in the NVMs isdata compression. Since the developed filesystem already supports the storage of elements withvariable length, the integration of data compression should be realizable. Depending on the type

71
of data, different data compression techniques have to be examined.Since the recorded data are personal, measures for data protection, such as encryption, should
be implemented. For this purpose, an appropriate encryption technique (symmetric, asymmetric,hybrid) must be chosen. Additionally, a special protocol might be required to enable secure keyexchange.
Besides further software developments, hardware improvements should be considered as well.This includes, for example, chip migration to the nRF52 from Nordic Semiconductor. Comparedto the nRF51822, the nRF52 has a significantly reduced power consumption as well as a largerRAM and flash-memory [Nor18b]. For further increase of the available memory, a larger externalmemory chip (flash-memory or EEPROM) might be inserted. Finally, a digital microphone couldbe integrated in order to simplify the circuit of the badge.

72 CHAPTER 5. CONCLUSION

Appendix A
Glossar
IR infrared
RFID radio-frequency identification
BLE Bluetooth Low Energy
ISM Industrial Scientific Medical
GAP Generic Access Profile
ATT Attribute Protocol
GATT Generic Attribute Profile
NUS Nordic UART Service
PCB printed circuit board
SoM system on module
SoC system on chip
RAM random access memory
ADC analog-to-digital converter
SPI serial peripheral interface
UART universal asynchronous receiver-transmitter
73

74 APPENDIX A. GLOSSAR
I2C inter-integrated circuit
I/O input/output
RTC real-time clock
NVM non-volatile memory
EEPROM electrical erasable programmable read-only memory
SMD surface-mounted device
ID identification number
MAC medium access control
RSSI received signal strength indicator
MEMS microelectromechanical system
FIFO first-in first-out
LED light-emitting diode
NTP Network Time Protocol
API application programming interface
XML Extensible Markup Language
JSON JavaScript Object Notation
HW hardware
SDK software development kit
CPU central processing unit
SS slave select
GCC GNU Compiler Collection
HTML Hypertext Markup Language
g gravitational force

75
mg milli gravitational force
EWMA exponentially weighted moving average
varint variable-length integer
CRC cyclic redundancy check
XOR exclusive or
TPSN Timing-sync Protocol for Sensor Networks
MAE mean absolute error
DUT device under test

76 APPENDIX A. GLOSSAR

Appendix B
Patents
77

78 APPENDIX B. PATENTS
B.1 US7216088 (B1)
Title System and method for managing a project based on team memberinterdependency and impact relationships
Publication Number US7216088 (B1)
Publication Date May 8, 2007
Inventor(s) Oscar A. Chappel,Christopher T. Creel
Assignee(s) NTT Data Services Corp
Abstract A system and method for determining interdependencies betweenproject team members working on a development project. Themethod includes receiving data indicative of a temporal relation-ship between a first and a second project team member havingmodified at least one artifact of the development project. Thedata indicative of the temporal relationship between the projectteam members may be statistically analyzed. At least one metricrepresentative of an interdependency relationship between the firstand second project team members may be formed. The metric(s)representative of the interdependency relationship may be stored.

B.2. WO2010099488 (A1) 79
B.2 WO2010099488 (A1)
Title Contact tracking using wireless badges
Publication Number WO2010099488 (A1)
Publication Date September 9, 2010
Inventor(s) Theodore Herman,Philip Polgreen
Assignee(s) University Of Iowa Research Foundation
Abstract This application discusses apparatus and methods for trackingcontacts between various entities in a region. An apparatus in-cludes portable transceiver device having a radio, memory anda power supply. The portable transceiver device can detect andrecord a history of proximity to other transceiver devices. Theportable transceiver device can receive information related to dis-ease exposure of the transceiver device and can include a process-ing component to compute an exposure potential to a contagiousdisease using the history of proximity and the disease exposureinformation.

80 APPENDIX B. PATENTS
B.3 US10049336 (B2)
Title Social sensing and behavioral analysis system
Publication Number US10049336 (B2)
Publication Date August 14, 2018
Inventor(s) Daniel Olguin Olguin,Tuomas Jaanu,Derek Heyman,Benjamin Waber
Assignee(s) Sociometric Solutions Inc
Abstract A method and system for capturing and analyzing human behaviordata is disclosed. The present disclosure describes a method andsystem for a plurality of people, wherein each person wears abadge. The badge transmits data collected from a plurality ofsensors from the badge to a base station. The data is sent from thebase station to a server, which aggregates the data from a pluralityof base stations, and then analyzes and processes the data to createraw human behavior data. From the raw human behavior dataand plurality of metrics is calculated, which can be displayed on acomputer screen according to whichever metrics a user wishes toview.

List of Figures
2.1 Rhythm badge . . . . . . . . . . . . . . . . . . . . . . . . . . . . . . . . . . . . 5
2.2 Rhythm framework . . . . . . . . . . . . . . . . . . . . . . . . . . . . . . . . . 6
2.3 Mobile hub . . . . . . . . . . . . . . . . . . . . . . . . . . . . . . . . . . . . . 10
2.4 Main loop . . . . . . . . . . . . . . . . . . . . . . . . . . . . . . . . . . . . . . 15
2.5 Modules overview . . . . . . . . . . . . . . . . . . . . . . . . . . . . . . . . . . 16
2.6 Successful unit test . . . . . . . . . . . . . . . . . . . . . . . . . . . . . . . . . 21
2.7 Failed unit test . . . . . . . . . . . . . . . . . . . . . . . . . . . . . . . . . . . . 21
2.8 Example coverage analysis . . . . . . . . . . . . . . . . . . . . . . . . . . . . . 23
2.9 Accelerometer mock object . . . . . . . . . . . . . . . . . . . . . . . . . . . . . 24
2.10 Microphone chunk . . . . . . . . . . . . . . . . . . . . . . . . . . . . . . . . . 26
2.11 Protocol Buffers example . . . . . . . . . . . . . . . . . . . . . . . . . . . . . . 33
2.12 Tinybuf workflow . . . . . . . . . . . . . . . . . . . . . . . . . . . . . . . . . . 34
2.13 Virtual storage . . . . . . . . . . . . . . . . . . . . . . . . . . . . . . . . . . . . 37
2.14 Filesystem with management sector . . . . . . . . . . . . . . . . . . . . . . . . 38
2.15 Filesystem with doubly linked list . . . . . . . . . . . . . . . . . . . . . . . . . 40
2.16 Message processing . . . . . . . . . . . . . . . . . . . . . . . . . . . . . . . . . 45
2.17 Illustration time synchronization . . . . . . . . . . . . . . . . . . . . . . . . . . 48
3.1 Encoded length . . . . . . . . . . . . . . . . . . . . . . . . . . . . . . . . . . . 50
3.2 Encoding and decoding execution times . . . . . . . . . . . . . . . . . . . . . . 51
3.3 Throughput timer-based approach . . . . . . . . . . . . . . . . . . . . . . . . . 52
3.4 Comparison data throughput . . . . . . . . . . . . . . . . . . . . . . . . . . . . 52
3.5 Typical error graphs . . . . . . . . . . . . . . . . . . . . . . . . . . . . . . . . . 53
3.6 Frequency offset . . . . . . . . . . . . . . . . . . . . . . . . . . . . . . . . . . 54
3.7 Clock synchronization optimization . . . . . . . . . . . . . . . . . . . . . . . . 55
3.8 Audio signal with different sample number . . . . . . . . . . . . . . . . . . . . 56
81
82 LIST OF FIGURES
3.9 Audio signal difference . . . . . . . . . . . . . . . . . . . . . . . . . . . . . . . 573.10 Accelerometer consumption . . . . . . . . . . . . . . . . . . . . . . . . . . . . 583.11 Average current consumption overview . . . . . . . . . . . . . . . . . . . . . . 59
4.1 Scan Chunk . . . . . . . . . . . . . . . . . . . . . . . . . . . . . . . . . . . . . 62

List of Tables
2.1 Badge components . . . . . . . . . . . . . . . . . . . . . . . . . . . . . . . . . 52.2 Assertions . . . . . . . . . . . . . . . . . . . . . . . . . . . . . . . . . . . . . . 202.3 Accelerometer power consumption . . . . . . . . . . . . . . . . . . . . . . . . . 302.4 Tinybuf data types . . . . . . . . . . . . . . . . . . . . . . . . . . . . . . . . . . 352.5 Element header size . . . . . . . . . . . . . . . . . . . . . . . . . . . . . . . . . 39
3.1 Optimal parameters clock synchronization . . . . . . . . . . . . . . . . . . . . . 553.2 Component description power analysis . . . . . . . . . . . . . . . . . . . . . . . 60
83

84 LIST OF TABLES

Bibliography
[Abr12] Abracon LLC: ABS07-120-32.768kHz-T; TUNING FORK CRYSTAL, 10 2012.
[Aim12] P. Aimonen: Nanopb - Protocol Buffers for Embedded Systems, 2012, https:
//github.com/nanopb/nanopb. Accessed 2018-11-05.
[Bab02] B. Babcock, S. Babu, M. Datar, R. Motwani, J. Widom: Models and issues in data
stream systems, in Proceedings of the twenty-first ACM SIGMOD-SIGACT-SIGART
symposium on Principles of database systems, ACM, 2002, pp. 1–16.
[Bar06] M. Barr, A. Massa: Programming embedded systems: with C and GNU development
tools, O’Reilly Media, Inc., 2006.
[Ber05] J. Berdine, C. Calcagno, P. W. O’hearn: Smallfoot: Modular automatic assertion
checking with separation logic, in International Symposium on Formal Methods for
Components and Objects, Springer, 2005, pp. 115–137.
[Bla03] B. Blanchet, P. Cousot, R. Cousot, J. Feret, L. Mauborgne, A. Mine, D. Monniaux,X. Rival: A static analyzer for large safety-critical software, in ACM SIGPLAN Notices,Vol. 38, ACM, 2003, pp. 196–207.
[Bou97] C. V. Bouten, K. T. Koekkoek, M. Verduin, R. Kodde, J. D. Janssen: A triaxial
accelerometer and portable data processing unit for the assessment of daily physical
activity, IEEE transactions on biomedical engineering, Vol. 44, No. 3, 1997, pp.136–147.
[Bro14] C. Brown, C. Efstratiou, I. Leontiadis, D. Quercia, C. Mascolo, J. Scott, P. Key: The
architecture of innovation: Tracking face-to-face interactions with ubicomp technolo-
gies, in Proceedings of the 2014 ACM International Joint Conference on Pervasive and
Ubiquitous Computing, ACM, 2014, pp. 811–822.
85

86 BIBLIOGRAPHY
[Cal16] D. Calacci, O. Lederman, D. Shrier, A. Pentland: Breakout: An open measurement and
intervention tool for distributed peer learning groups, Proc. 2016 Int’l Conf. Social
Computing Behavioral-Cultural Modeling & Prediction and Behavior Representation
in Modeling and Simulation (SBP-BRIMS 16) Social Cultural and Behavioral Modeling,2016.
[Car02] K. M. Carley: Computational organizational science and organizational engineering,Simulation Modelling Practice and Theory, Vol. 10, No. 5-7, 2002, pp. 253–269.
[Cat10] C. Cattuto, W. Van den Broeck, A. Barrat, V. Colizza, J.-F. Pinton, A. Vespignani:Dynamics of person-to-person interactions from distributed RFID sensor networks,PloS one, Vol. 5, No. 7, 2010, p. e11596.
[Cha14] K.-H. Chang: Bluetooth: a viable solution for IoT?[Industry Perspectives], IEEE
Wireless Communications, Vol. 21, No. 6, 2014, pp. 6–7.
[Che04] B. Chess, G. McGraw: Static analysis for security, IEEE Security & Privacy, Vol. 2,No. 6, 2004, pp. 76–79.
[Cho02] T. Choudhury, A. Pentland: The sociometer: A wearable device for understanding
human networks, in CSCW’02 Workshop: Ad hoc Communications and Collaboration
in Ubiquitous Computing Environments, 2002.
[Dab98] N. Daberko: Operating system including improved file management for use in devices
utilizing flash memory as main memory, July 28 1998, US Patent 5,787,445.
[Dab02] F. Dabek, N. Zeldovich, F. Kaashoek, D. Mazieres, R. Morris: Event-driven program-
ming for robust software, in Proceedings of the 10th workshop on ACM SIGOPS
European workshop, ACM, 2002, pp. 186–189.
[Des06] S. Desikan, G. Ramesh: Software testing: principles and practice, Pearson EducationIndia, 2006.
[Dia17] F. J. Dian, A. Yousefi, K. Somaratne: A study in accuracy of time synchronization of
BLE devices using connection-based event, in Information Technology, Electronics and
Mobile Communication Conference (IEMCON), 2017 8th IEEE Annual, IEEE, 2017,pp. 595–601.

BIBLIOGRAPHY 87
[DiM04] J. M. DiMicco, A. Pandolfo, W. Bender: Influencing group participation with a
shared display, in Proceedings of the 2004 ACM conference on Computer supported
cooperative work, ACM, 2004, pp. 614–623.
[Don10] W. Dong, A. S. Pentland: Quantifying group problem solving with stochastic analysis,in International Conference on Multimodal Interfaces and the Workshop on Machine
Learning for Multimodal Interaction, ACM, 2010, p. 40.
[Doy93] M. Doyle, D. Straus: How to make meetings work, The Berkley Publishing Group,1993.
[Dre96] S. Drew, C. Coulson-Thomas: Transformation through teamwork: the path to the new
organization?, Management Decision, Vol. 34, No. 1, 1996, pp. 7–17.
[Els02] J. Elson, L. Girod, D. Estrin: Fine-grained network time synchronization using reference
broadcasts, ACM SIGOPS Operating Systems Review, Vol. 36, No. SI, 2002, pp. 147–163.
[Fav07] L. Favalli, M. Lanati, P. Savazzi: Wireless communications 2007 CNIT thyrrenian
symposium, 2007.
[For18] D. R. Forsyth: Group dynamics, Cengage Learning, 2018.
[Fur11] K. Furset, P. Hoffman: High pulse drain impact on CR2032 coin cell battery capacity,Nordic Semiconductor and Energizer, 2011.
[Gal05] E. Gal, S. Toledo: A transactional flash file system for microcontrollers., in USENIX
Annual Technical Conference, General Track, 2005, pp. 89–104.
[Gan03] S. Ganeriwal, R. Kumar, M. B. Srivastava: Timing-sync protocol for sensor networks,in Proceedings of the 1st international conference on Embedded networked sensor
systems, ACM, 2003, pp. 138–149.
[GCC05] GCC: gcov - a Test Coverage Program, 2005, https://gcc.gnu.org/
onlinedocs/gcc/Gcov.html. Accessed 2018-10-23.
[Gom12] C. Gomez, J. Oller, J. Paradells: Overview and evaluation of bluetooth low energy: An
emerging low-power wireless technology, Sensors, Vol. 12, No. 9, 2012, pp. 11734–11753.

88 BIBLIOGRAPHY
[Goo08a] Google: Google Test, 2008, https://github.com/google/googletest.Accessed 2018-10-15.
[Goo08b] Google: Protocol Buffers, 2008, https://developers.google.com/
protocol-buffers/. Accessed 2018-11-05.
[Gre03] J. Greenberg, R. A. Baron: Behavior in Organizations: Understanding and Managing
the Human Side of Work, Pearson Prentice Hall Upper Saddle River, NJ, 2003.
[Ham04] P. Hamill: Unit test frameworks: tools for high-quality software development, O’ReillyMedia, Inc., 2004.
[Hol04] C. C. Holt: Forecasting seasonals and trends by exponentially weighted moving
averages, International journal of forecasting, Vol. 20, No. 1, 2004, pp. 5–10.
[Hwa04] S.-Y. Hwang, D.-H. Yu, K.-J. Li: Embedded system design for network time syn-
chronization, in International Conference on Embedded and Ubiquitous Computing,Springer, 2004, pp. 96–106.
[Jeh01] K. A. Jehn, E. A. Mannix: The dynamic nature of conflict: A longitudinal study of
intragroup conflict and group performance, Academy of management journal, Vol. 44,No. 2, 2001, pp. 238–251.
[Jia09] Z. Jianwu, Z. Lu: Research on distance measurement based on RSSI of ZigBee, inComputing, Communication, Control, and Management, 2009. CCCM 2009. ISECS
International Colloquium on, Vol. 3, IEEE, 2009, pp. 210–212.
[Jia14] Z. Jianyong, L. Haiyong, C. Zili, L. Zhaohui: RSSI based Bluetooth low energy indoor
positioning, in Indoor Positioning and Indoor Navigation (IPIN), 2014 International
Conference on, IEEE, 2014, pp. 526–533.
[Kim08] T. Kim, A. Chang, L. Holland, A. S. Pentland: Meeting mediator: enhancing group
collaborationusing sociometric feedback, in Proceedings of the 2008 ACM conference
on Computer supported cooperative work, ACM, 2008, pp. 457–466.
[Kin18] P. H. Kindt, M. Saur, M. Balszun, S. Chakraborty: Neighbor discovery latency in
BLE-like protocols, IEEE Transactions on Mobile Computing, Vol. 17, No. 3, 2018, pp.617–631.
[Kno12] Knowles Corporation: SPU0414HR5H-SB Product Datasheet, 12 2012, Rev. E.
BIBLIOGRAPHY 89
[Led16a] O. Lederman, D. Calacci, A. MacMullen, D. C. Fehder, F. E. Murray, A. Pentland:Open badges: A low-cost toolkit for measuring team communication and dynamics, in2016 International Conference on Social Computing, Behavioral-Cultural Modeling, &
Prediction and Behavior Representation in Modeling and Simulation , Washington DC,
USA, June 28-July 1, 2016.
[Led16b] O. Lederman et al.: Openbadge Hub Python, 2016, https://github.com/
HumanDynamics/openbadge-hub-py. Accessed 2018-10-12.
[Led16c] O. Lederman et al.: OpenBadge project, 2016, https://github.com/
HumanDynamics/openbadge. Accessed 2018-10-12.
[Led18] O. Lederman, A. Mohan, D. Calacci, A. S. Pentland: Rhythm: A Unified Measurement
Platform for Human Organizations, IEEE MultiMedia, Vol. 25, No. 1, 2018, pp. 26–38.
[Les09] G. Leshed, D. Perez, J. T. Hancock, D. Cosley, J. Birnholtz, S. Lee, P. L. McLeod,G. Gay: Visualizing real-time language-based feedback on teamwork behavior in
computer-mediated groups, in Proceedings of the SIGCHI Conference on Human
Factors in Computing Systems, ACM, 2009, pp. 537–546.
[Lev15] D. Levi: Group dynamics for teams, Sage Publications, 2015.
[Lia12] T.-T. Liao, L.-S. Lo: Audio system and related method integrated with ultrasound
communication functionality, April 17 2012, US Patent 8,160,276.
[Mae12] K. Maeda: Performance evaluation of object serialization libraries in XML, JSON
and binary formats, in Digital Information and Communication Technology and it’s
Applications (DICTAP), 2012 Second International Conference on, IEEE, 2012, pp.177–182.
[Mar12] R. J. I. Marks: Introduction to Shannon sampling and interpolation theory, SpringerScience & Business Media, 2012.
[Mas17] K. Masumoto, T. Yaguchi, H. Matsuda, H. Tani, K. Tozuka, N. Kondo, S. Okada:Measurement and visualization of face-to-face interaction among community-dwelling
older adults using wearable sensors, Geriatrics & gerontology international, Vol. 17,No. 10, 2017, pp. 1752–1758.
[Mer14] D. Merkel: Docker: lightweight linux containers for consistent development and
deployment, Linux Journal, Vol. 2014, No. 239, 2014, p. 2.

90 BIBLIOGRAPHY
[Mil91] D. L. Mills: Internet time synchronization: the network time protocol, IEEE Transac-
tions on communications, Vol. 39, No. 10, 1991, pp. 1482–1493.
[Nad79] D. A. Nadler: The effects of feedback on task group behavior: A review of the
experimental research, Organizational Behavior and Human Performance, Vol. 23,No. 3, 1979, pp. 309–338.
[Nah94] A. Nahavandi, E. Aranda: Restructuring teams for the re-engineered organization,Academy of Management Perspectives, Vol. 8, No. 4, 1994, pp. 58–68.
[Nor16a] Nordic Semiconductor: nRF51822 Product Specification, 7 2016, Rev. 3.3.
[Nor16b] Nordic Semiconductor: Power Profiler Kit, 2016, https://www.nordicsemi.com/eng/Products/Power-Profiler-Kit. Accessed 2018-11-15.
[Nor16c] Nordic Semiconductor: S130 SoftDevice Specification, 4 2016, Rev. 2.0.
[Nor17] Nordic Semiconductor: Nordic Thingy:52, 2017, https://www.nordicsemi.com/eng/Products/Nordic-Thingy-52. Accessed 2018-11-02.
[Nor18a] Nordic Semiconductor: Infocenter, 2018, http://infocenter.nordicsemi.com/. Accessed 2018-10-16.
[Nor18b] Nordic Semiconductor: nRF52840 Product Specification, 3 2018, Rev. 1.0.
[Obe08] P. Oberparleiter: lcov - a graphical GCOV front-end, 2008, https://linux.die.net/man/1/lcov. Accessed 2018-10-23.
[Olg06] D. O. Olguın, J. A. Paradiso, A. Pentland: Wearable communicator badge: Designing
a new platform for revealing organizational dynamics, in Proceedings of the 10th
international symposium on wearable computers (student colloquium), 2006, pp. 4–6.
[Olg09] D. O. Olguın, B. N. Waber, T. Kim, A. Mohan, K. Ara, A. Pentland: Sensible orga-
nizations: Technology and methodology for automatically measuring organizational
behavior, IEEE Transactions on Systems, Man, and Cybernetics, Part B (Cybernetics),Vol. 39, No. 1, 2009, pp. 43–55.
[Olg10] D. O. Olguın, A. Pentland: Sensor-based organisational design and engineering, Vol.1(1-2), 2010, pp. 69–97.
[Osh15] R. Osherove: The art of unit testing, MITP-Verlags GmbH & Co. KG, 2015.

BIBLIOGRAPHY 91
[Pen10] A. Pentland: Defend your research: We can measure the power of charisma-Harvard
Business Review, Harvard Business Review Case Studies, Articles, Books, Pamphlets-
Harvard Business Review. Retrieved from http://hbr. org/2010/01/defend-your-research-
we-can-measure-the-power-of-charisma/ar/1, 2010.
[Pen12] A. Pentland: The new science of building great teams, Harvard Business Review,Vol. 90, No. 4, 2012, pp. 60–69.
[Raz15] S. Raza, P. Misra, Z. He, T. Voigt: Bluetooth smart: An enabling technology for the In-
ternet of Things, in Wireless and Mobile Computing, Networking and Communications
(WiMob), 2015 IEEE 11th International Conference on, IEEE, 2015, pp. 155–162.
[Rig17] Rigado Inc.: BMD-200 Module for Bluetooth 4.2 LE, 8 2017, Rev. 1.7.
[Ruu18] Ruuvi Innovations Oy: What is RuuviTag?, 2018, https://ruuvi.com/
ruuvitag-specs/. Accessed 2018-11-02.
[Sam18] S. Samrose, R. Zhao, J. White, V. Li, L. Nova, Y. Lu, M. R. Ali, M. E. Hoque: CoCo:
Collaboration Coach for Understanding Team Dynamics during Video Conferencing,Proceedings of the ACM on Interactive, Mobile, Wearable and Ubiquitous Technologies,Vol. 1, No. 4, 2018, p. 160.
[Shc14] M. Shchekotov: Indoor localization method based on Wi-Fi trilateration technique, inProceeding of the 16th conference of fruct association, 2014, pp. 177–179.
[STM17] STMicroelectronics: LIS2DH12 Datasheet: MEMS digital output motion sensor:
ultra-low-power high-performance 3-axis ’femto’ accelerometer, 6 2017, Rev. 6.0.
[STM18] STMicroelectronics: M95M02-DR, 9 2018, Rev. 11.0.
[Str12] J. B. Stryker, M. D. Santoro: Facilitating face-to-face communication in high-tech
teams, Research-Technology Management, Vol. 55, No. 1, 2012, pp. 51–56.
[Szp11] W. Szpankowski, S. Verdu: Minimum expected length of fixed-to-variable lossless
compression without prefix constraints, IEEE Transactions on Information Theory,Vol. 57, No. 7, 2011, pp. 4017–4025.
[Tal02] A. Tal: Two flash technologies compared: NOR vs NAND, White Paper of M-Systems,2002.

92 BIBLIOGRAPHY
[Tan95] D. Tannen: The power of talk: Who gets heard and why, Harvard Business Review,Vol. 73, No. 5, 1995, pp. 138–148.
[VAR16] VARTA Microbattery GmbH: CR2032 Lithium Manganese Dioxide Data Sheet, 92016.
[Wak09] Y. Wakisaka, N. Ohkubo, K. Ara, N. Sato, M. Hayakawa, S. Tsuji, Y. Horry, K. Yano,N. Moriwaki: Beam-scan sensor node: Reliable sensing of human interactions in orga-
nization, in Networked Sensing Systems (INSS), 2009 Sixth International Conference
on, IEEE, 2009, pp. 1–4.
[Wat14] J.-i. Watanabe, N. Ishibashi, K. Yano: Exploring relationship between face-to-face
interaction and team performance using wearable sensor badges, PloS one, Vol. 9,No. 12, 2014, p. e114681.
[Why91] G. Whyte: Decision failures: Why they occur and how to prevent them, Academy of
Management Perspectives, Vol. 5, No. 3, 1991, pp. 23–31.
[Wil05] C. J. Willmott, K. Matsuura: Advantages of the mean absolute error (MAE) over the
root mean square error (RMSE) in assessing average model performance, Climate
research, Vol. 30, No. 1, 2005, pp. 79–82.
[Wuc07] S. Wuchty, B. F. Jones, B. Uzzi: The increasing dominance of teams in production of
knowledge, Science, Vol. 316, No. 5827, 2007, pp. 1036–1039.
[Xu10] J. Xu, W. Liu, F. Lang, Y. Zhang, C. Wang: Distance measurement model based on
RSSI in WSN, Wireless Sensor Network, Vol. 2, No. 08, 2010, p. 606.
[Yan12] Z. Yang, C. Wu, Y. Liu: Locating in fingerprint space: wireless indoor localization with
little human intervention, in Proceedings of the 18th annual international conference
on Mobile computing and networking, ACM, 2012, pp. 269–280.