an operationally flexible fuel cell based on quaternary … · quaternary ammonium-biphosphate ion...
TRANSCRIPT
SUPPLEMENTARY INFORMATIONARTICLE NUMBER: 16120 | DOI: 10.1038/NENERGY.2016.120
NATURE ENERGY | www.nature.com/natureenergy 1
An operationally flexible fuel cell based on quaternary ammonium-biphosphate ion pairsAn operationally flexible fuel cell based on quaternary ammonium-biphosphate ion pairs Kwan-Soo Lee1, Jacob S. Spendelow1, Yoong-Kee Choe2, Cy Fujimoto3 and Yu Seung Kim1*
Affiliations:
1MPA-11: Materials Synthesis and Integrated Devices, Los Alamos National Laboratory, Los Alamos,
New Mexico 87545, USA. 2National Institute of Advanced Industrial Science & Technology, Tsukuba 305-8568, Japan. 3Organic Materials Science, Sandia National Laboratory, Albuquerque, New Mexico 87185, USA.
* Corresponding author. E-mail: [email protected]
2 NATURE ENERGY | www.nature.com/natureenergy
SUPPLEMENTARY INFORMATION DOI: 10.1038/NENERGY.2016.120
SUPPLEMENTARY FIGURES
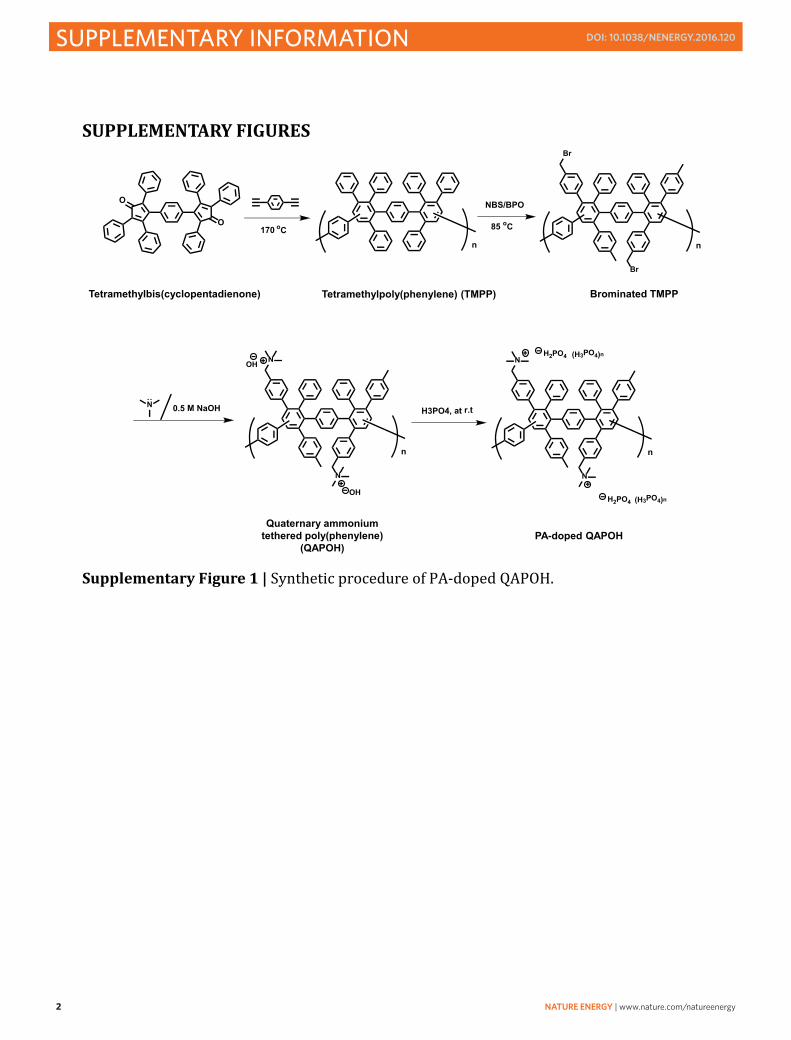
Supplementary Figure 1 | Synthetic procedure of PA-doped QAPOH.
n
O
O
170 oC
NBS/BPO
0.5 M NaOH
n
N
N
OH
OH
H3PO4, at r.tN
n
N
N
H2PO4 (H3PO4)n
H2PO4 (H3PO4)n
n
Br
Br
85 oC
Tetramethylbis(cyclopentadienone) Tetramethylpoly(phenylene) (TMPP) Brominated TMPP
Quaternary ammonium tethered poly(phenylene)
(QAPOH)PA-doped QAPOH

NATURE ENERGY | www.nature.com/natureenergy 3
SUPPLEMENTARY INFORMATIONDOI: 10.1038/NENERGY.2016.120
Supplementary Figure 2 | Synthetic procedure of PA-doped QASOH.
n
Cl
0.5x 0.5x
N Cl
N 0.5x 0.5x
N
DMF, 130 oC
H2N
F
NH2
F
0.5x 0.5x
N
0.1M NaOH
NH
F
n n
n
OH
ClCl
DMF, 130 oCCl
0.5x 0.5x
N NH
F
n
H2PO4
H3PO4 at r.t.
(H3PO4)n
PS-bzCl PS(TEA-co-bzCl)
QAS-Cl
PA-doped QASOHQuaternary ammonium tethered polystyrene
(QASOH)

4 NATURE ENERGY | www.nature.com/natureenergy
SUPPLEMENTARY INFORMATION DOI: 10.1038/NENERGY.2016.120
Supplementary Figure 3 | 1H NMR characterization. 1H NMR (500 MHz, DMSO-d6) spectrum of QAS-Cl (blue); δ 7.8-6.1 (br, 12H, -ArH), 5.0-4.2 (br, 4H, -ArCH2N-), 5.0-4.2 (br, 4H, -ArCH2N-), 3.9-3.6 (m, 2H, -NCH2CH2Ar), 3.05 (br, 6H, -ArCH2N(CH2CH3)3), 1.8-0.3 (br, 17H, -CH2CHAr-, -N(CH2CH3)3, ArCH2CH2N-); QAS-Cl copolymer was dissolved using THF, DMF, and water represented by *; DMSO-d6 is represented by #. 1H NMR (500 MHz, DMSO-d6) spectrum of PS-bzCl (red); δ 7.4-6.2 (br, 3H, -ArH), 4.8-4.3 (br, 2H, -ArCH2Cl), 2.2-1.1 (br, 3H, -CH2CHAr-).
QAS-Cl
PS-bzCl
b’c’ a’

NATURE ENERGY | www.nature.com/natureenergy 5
SUPPLEMENTARY INFORMATIONDOI: 10.1038/NENERGY.2016.120
Supplementary Figure 4 | FTIR of poly(vinylbenzyl chloride) (PS-bzCl) and QASOH. The FTIR spectra revealed that the intensity of a characteristic C-Cl peak at 1261 cm-1 disappeared after the reaction of PS-bzCl with TEA and 4-fluorophenethylamine, but the OH and C-N peak emerged clearly at approximately 3300 and 1363 cm-1, respectively. This result indicates that the Cl of the benzyl group was replaced by TEA and 4-fluorophenethylamine.
6 NATURE ENERGY | www.nature.com/natureenergy
SUPPLEMENTARY INFORMATION DOI: 10.1038/NENERGY.2016.120
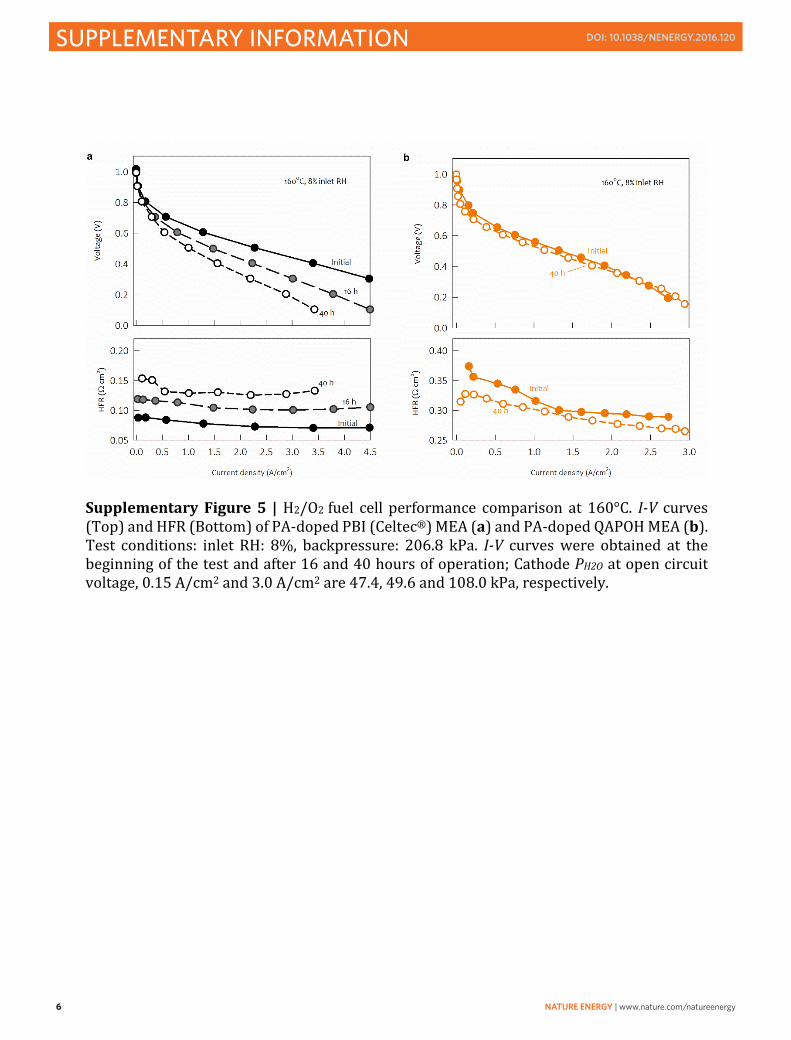
Supplementary Figure 5 | H2/O2 fuel cell performance comparison at 160°C. I-V curves (Top) and HFR (Bottom) of PA-doped PBI (Celtec®) MEA (a) and PA-doped QAPOH MEA (b). Test conditions: inlet RH: 8%, backpressure: 206.8 kPa. I-V curves were obtained at the beginning of the test and after 16 and 40 hours of operation; Cathode PH2O at open circuit voltage, 0.15 A/cm2 and 3.0 A/cm2 are 47.4, 49.6 and 108.0 kPa, respectively.

NATURE ENERGY | www.nature.com/natureenergy 7
SUPPLEMENTARY INFORMATIONDOI: 10.1038/NENERGY.2016.120
Supplementary Figure 5 | H2/O2 fuel cell performance comparison at 160°C. I-V curves (Top) and HFR (Bottom) of PA-doped PBI (Celtec®) MEA (a) and PA-doped QAPOH MEA (b). Test conditions: inlet RH: 8%, backpressure: 206.8 kPa. I-V curves were obtained at the beginning of the test and after 16 and 40 hours of operation; Cathode PH2O at open circuit voltage, 0.15 A/cm2 and 3.0 A/cm2 are 47.4, 49.6 and 108.0 kPa, respectively.
Supplementary Figure 6 | i-V curves, power density and HFR of a QAPOH MEA (PEM thickness: 120 µm) as a function of operating temperature; Tested at 206.8 kPa backpressure without external humidification; Anode: Pt/C (0.6 mgPt/cm2), Cathode: Pt-Ru/C (0.4 mgPt/cm2). Data represented by the filled symbols in the panel refer to the secondary y axe.
8 NATURE ENERGY | www.nature.com/natureenergy
SUPPLEMENTARY INFORMATION DOI: 10.1038/NENERGY.2016.120
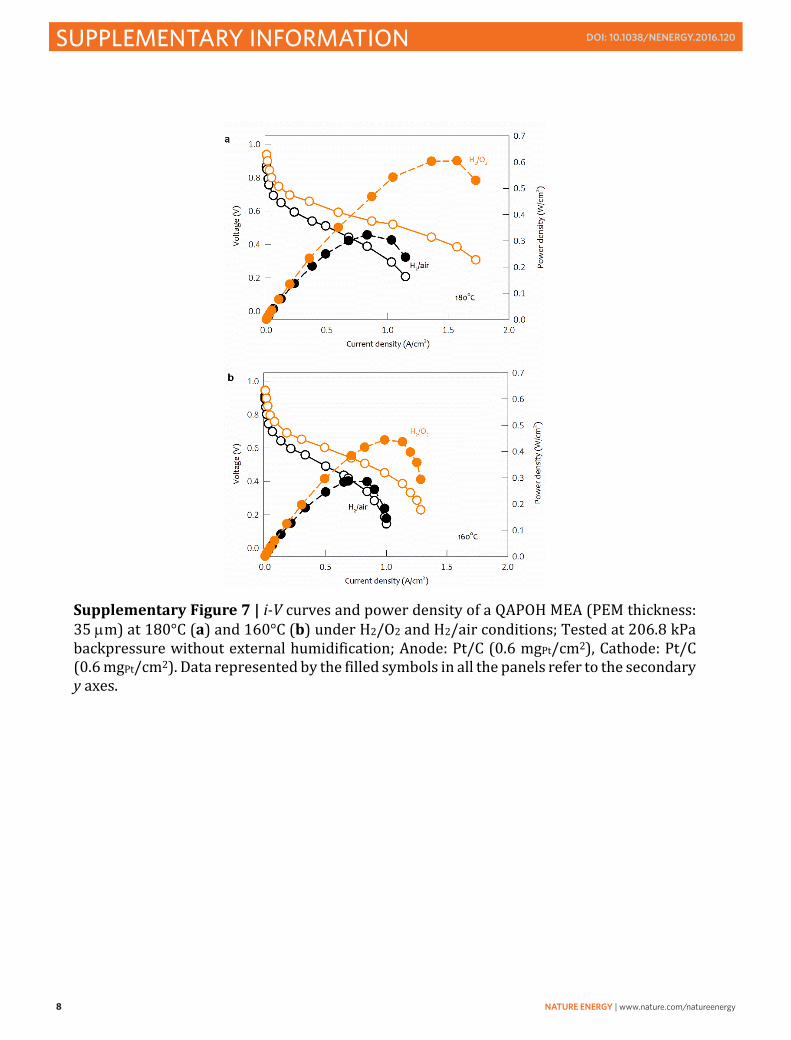
Supplementary Figure 7 | i-V curves and power density of a QAPOH MEA (PEM thickness: 35 µm) at 180°C (a) and 160°C (b) under H2/O2 and H2/air conditions; Tested at 206.8 kPa backpressure without external humidification; Anode: Pt/C (0.6 mgPt/cm2), Cathode: Pt/C (0.6 mgPt/cm2). Data represented by the filled symbols in all the panels refer to the secondary y axes.

NATURE ENERGY | www.nature.com/natureenergy 9
SUPPLEMENTARY INFORMATIONDOI: 10.1038/NENERGY.2016.120
Supplementary Figure 8 | i-V curves for H2/air long-term performance at 120°C. Membrane: PA-doped QAPOH (thickness: 65 µm); The HFR growth rate was 19.4 µΩ cm2/h, and the decay rate of the cell current density was -0.33 mA cm2/h. The increased HFR after the first 276 h of fuel cell operation fully recovered to the initial value with the intermittent PH2O = 76.4 kPa. This suggests that the increased HFR and the current density loss observed for the first 276 h are primarily due to the slow dehydration. The HFR and current density after the intermittent inlet RH gradually changed over the next ~200 h as the cell was drying out again without humidification.

10 NATURE ENERGY | www.nature.com/natureenergy
SUPPLEMENTARY INFORMATION DOI: 10.1038/NENERGY.2016.120
Supplementary Figure 9 | Temperature, inlet RH and cathode water vapor pressure (PH2O) profiles during 1 h AST. Data represented by the filled symbols in the panel refer to the secondary y axes.

NATURE ENERGY | www.nature.com/natureenergy 11
SUPPLEMENTARY INFORMATIONDOI: 10.1038/NENERGY.2016.120
Supplementary Figure 10 | Thermal-oxidative stability of PA-doped QA tethered polymers. TGA temperature scan of QAPOH (a), QASOH (b) in air; the 5% thermal degradation temperature (Td) of PA-doped QAPOH and PA-doped QASOH are 286 and 274°C, respectively. The degradation temperatures are well above fuel cell operating temperatures. The higher Td of PA-doped polymers compared with un-doped polymers indicates that the ion pair interaction increases the thermal stability of the PEMs. TGA time scan of PA-doped QASOH as a function of time at 240°C (c).

12 NATURE ENERGY | www.nature.com/natureenergy
SUPPLEMENTARY INFORMATION DOI: 10.1038/NENERGY.2016.120
Supplementary Figure 11 | Stress-strain curves of PA-doped QAPOH at 80°C as a function of RH. The mechanical properties of PA-doped PBI at 0% RH are relatively poor; the tensile stress was 0.29 MPa with ~ 20% strain. Improved but inconsistent stress-strain behaviour for PA-doped PBI was observed when RH > 0%, with behaviour depending on equilibration conditions.
NATURE ENERGY | www.nature.com/natureenergy 13
SUPPLEMENTARY INFORMATIONDOI: 10.1038/NENERGY.2016.120
SUPPLEMENTARY TABLE
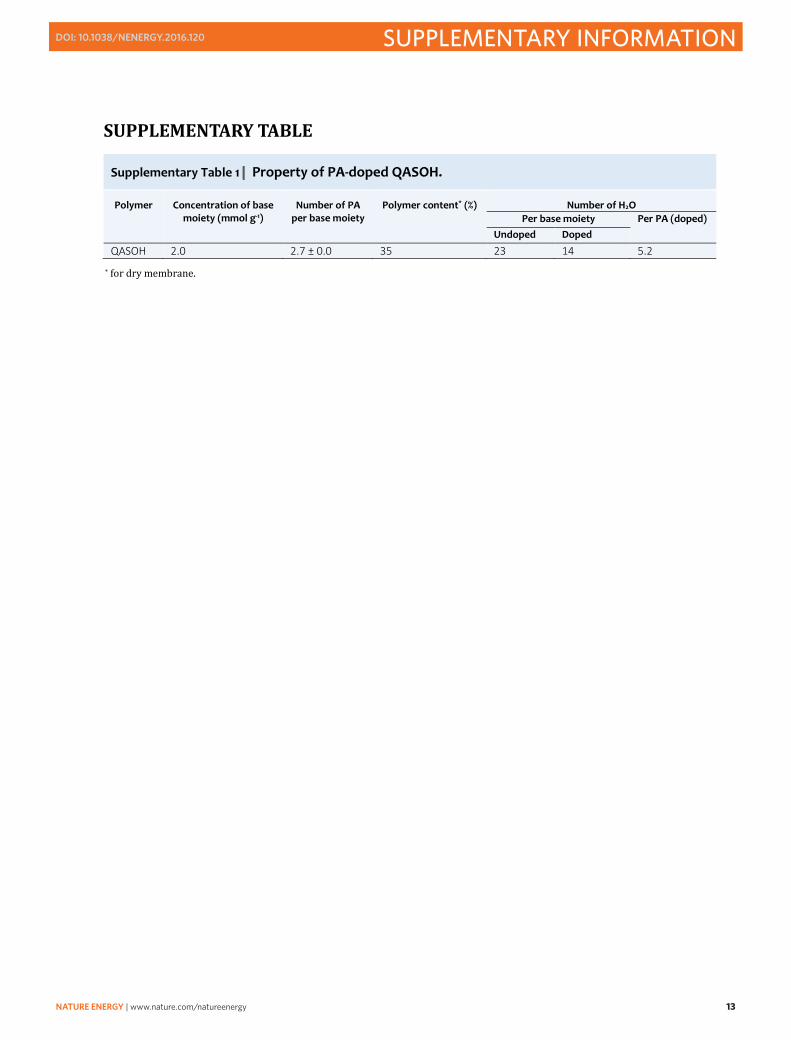
Supplementary Table 1 | Property of PA-doped QASOH.
Polymer Concentration of base moiety (mmol g-1)
Number of PA per base moiety
Polymer content* (%) Number of H2O Per base moiety Per PA (doped)
Undoped Doped
QASOH 2.0 2.7 ± 0.0 35 23 14 5.2
* for dry membrane.