an organizational climate measure for universities and
TRANSCRIPT

39
Validating the NOCM_UH-R
An Organizational Climate Measure for
Universities and Colleges
Catherine C. Fjellgård
Master of Philosophy in Psychology
Department of Psychology
UNIVERSITY OF OSLO
November 2011

39
Preface
The present study is a part of an ongoing research project led by Professor Thomas
Hoff at the University of Oslo. In an earlier part of this project, Hoff and colleagues (Hoff,
2010) developed the Norwegian Organizational Climate Measure_UH (NOCM_UH) as a
means to measure organizational climate in universities and colleges. The NOCM_UH is a
new and extended version of the Organizational Climate Measure (OCM) by Patterson et al.
(2005). The rationale behind adding new dimensions to a valid and general climate measure is
according to Hoff (2011a) to better capture challenges that are specific for the universities and
colleges, in addition to capturing general challenges related to the Norwegian and
international work life.
In an effort to increase the response rate at the participating organizations, Hoff and
colleagues have developed a reduced version of the NOCM_UH, in this paper referred to as
the NOCM_UH-R. The current research team, under the supervision of Hoff, consisted of
three master students in the field of work and organizational psychology. Our part in
developing the NOCM_UH were to give feedback on the new and extended dimensions, and
to implement the changes made by Hoff (2010; 2011b). We translated the NOCM_UH
questionnaires in to English, and were also responsible for the pilot testing of the instrument.
The research team sent out the survey and collected the data. The participating institutions
were promised a rapport on the results from the survey. The research team was therefore
given the responsibility of writing one of the reports, and to present it to the organization.
VALIDATING THE NOCM_UH-R 1
Abstract
The present study describes the development of the Norwegian Organizational Climate
Measure_UH (NOCM_UH), and the validation of the reduced version of the instrument, the
NOCM_UH-R (Hoff 2010; 2011b). The NOCM_UH is a new version of the Organizational
Climate Measure (OCM) by Patterson et al. (2005), and was developed in order to measure
climate at universities and colleges in Norway. The study was carried out on a sample of 669
respondents from three educational institutions in Norway. Structural equation modeling was
conducted to test the fit of the model. The 22 dimensions constituting the NOCM_UH-R had
acceptable levels of reliability and were factorially distinct, thereby supporting the 17-latent
factor structure constituting the original OCM. However, most of the new dimensions in the
NOCM_UH-R were more relevant for scientific employees than administrative and technical
staff. Furthermore, the survey targeted at universities had a methodological weakness, as
opposed to the one targeted towards colleges, that resulted in a lack of consensual validity.
This implies that the data does not qualify for aggregation to reflect a higher level construct,
and that the version for universities is not measuring organizational climate in organizations,
but only measure individual employee perceptions of different aspects of the work
environment.
Keywords: Organizational climate, Organizational Climate Measure, Competing
Values Framework, Norwegian Organizational Climate Measure for universities and colleges

VALIDATING THE NOCM_UH-R 2
Organizational climate
Organizational climate has received considerable attention and been a popular concept
in the field of work and organizational psychology since the 1960’s (Schneider and Reichers,
1983). Research on the topic has suggested that organizational climate is associated with
important outcomes on the organizational-, workgroup and individual level. These include job
satisfaction (Johnson and McIntye, 1998; Tsai and Huang, 2008), organizational productivity
(Ashkanasy, Wilderom & Peterson, 2000), turnover intentions (Rousseau, 1988; Rentsch,
1990), leader behavior (Rousseau, 1988; Rentsch, 1990), and the well-being and the health of
employees (Stone, Du, & Gershon, 2007).
The concept of climate has been defined and operationalized in different ways over the
last decades. This paper will adopt the dominant approach of organizational climate as “the
employees` shared perceptions of organizational events, practices, and procedures”
(Patterson et al., 2005 p. 380). When climate is operationalized this way, the construct is first
measured at the individual level (also referred to as psychological climate) and often by a
questionnaire (Patterson et al., 2005). By aggregating the employees individual scores to the
work group, department or the organization level, the mean score will represent the climate at
that level (Patterson et al., 2005, p 380). The shared perception approach implies that there
has to be agreement among the employees’ perceptions before aggregation can take place
(Anderson and West, 1998). Agreement in individual scores, also known as interrater
agreement, is therefore essential before data is seen as qualified to represent the climate in
organizations (Patterson et al., 2005).
Because measures of climate can be seen as an important source for information for
organizations, the development of valid climate instruments is essential to the field of work
and organizational psychology. Despite the extensive research and empirical studies on
organizational climate, there is a lack of valid measures. According to Patterson et al (2005),
there exist no valid and general climate measures, only a few valid domain-specific
instruments to measure specific types of climates, like climate for service or innovation. In the
lack of a general climate measure, Patterson et al. (2005) developed the multidimensional
Organizational Climate Measure (OCM). Even though general climate measures are criticized
for containing dimension that are not relevant for each specific study, Patterson et al. (2005)
argues that a general approach is advantageous because it provides an overall view of how the
whole organization operates (Patterson et al., 2005; Schneider 1975; 1990; 2000).
The OCM is a general climate measure validated in the manufacturing sector in the
U.K, and the wording of the items in the questionnaire is adapted to this sector, e.g. “The

VALIDATING THE NOCM_UH-R 3
company is slow to respond to the needs of the customer” (Patterson et al., 2005, p. 406).
Because the items in the OCM uses words like company and customer, the OCM is not an
appropriate instrument to measure climate in universities and colleges. Hoff (2010) has
therefore developed a new version of the OCM, the Norwegian Organizational Climate
Measure for universities and colleges (NOCM_UH). The NOCM_UH is the first Norwegian
climate instrument, specifically developed to measure climate in this sector (Hoff, 2011a).
The NOCM_UH has a general approach to climate, but is also taking into account the specific
challenges for universities and colleges, in addition to capture general challenges related to
the Norwegian and international work life (Hoff, 2011a).
This paper will describe the development of the NOCM_UH, and the validation of the
reduced version of the instrument, in this study referred to as the NOCM_UH-R (Hoff 2010;
2011b). Because the NOCM_UH is based on the OCM by Patterson et al. (2005), the
theoretical background will first be described before the instrument and the validation of the
reduced version is presented.
Theoretical background for the NOCM_UH
Organizational Climate Measure
The Organizational Climate Measure by Patterson et al. (2005) was developed as a
consequence of the lack of a valid multidimensional climate measure. The climate dimensions
in the OCM were collected from the extensive research literature on organizational climate
from the four last decades. The final 17 dimensions constituting the instrument were extracted
using confirmatory factor analysis (Patterson et al. 2005). The OCN was validated in the UK
with a sample of 6869 employees across 55 manufacturing organizations. Patterson et al.
(2005) found that the OCM had acceptable levels when tested for concurrent-, predictive and
discriminant validity. The OCM is founded upon Quinn and Rohrbaugh`s (1981; 1983) meta-
theoretical model, the Competing Values Framework (CVF).
Competing Values Framework
The Competing Values Framework emerged from different studies of the factors that
played an important part in highly effective organizations (Cameron, Quinn, DeGraff and
Thakor, 2006, p. 5). The framework was a response to the need of a broadly applicable model
that would help organizations improve effectiveness, promote value creation, and foster
successful leadership (Cameron et al., 2006). Quinn and Rohrbaugh (1981; 1983) claims that

VALIDATING THE NOCM_UH-R 4
there are four basic competing values within an organization: collaborate, create, control and
compete. These values can be placed according to two different dimensions; internal versus
external, and flexibility versus control. The first dimension represents a continuum ranging
from internal capability and integration to an orientation towards a focus on external
opportunities on the other end. The second dimension represents an orientation towards a
focus on adaptability and flexibility, and the focus on consistency and stability (Cameron et
al., 2006; Cameron and Quinn, 2006; Hoff, 2011a). When combining the values and
dimensions this result in four quadrants representing major traditions in the study of
organizational effectiveness (see Figure 1). When developing the OCM, Patterson et al.
(2005) placed the 17 dimensions constituting the OCM into the respectively quadrants from
the CVF, so that the dimensions reflected the models tradition.
Figure 1. An illustration of the Competing Values Framework (Quinn and Rohrbaugh, 1983)
Development of the NOCM_UH
The NOCM_UH was developed as a means to measure organizational climate in
universities and colleges in Norway (Hoff, 2010). In addition to the original 17 factors from
the OCM, the instrument consists of 5 new dimensions. One of the dimensions is new, and
four of the dimensions are differentiations of original dimensions from the OCM. Table 1

VALIDATING THE NOCM_UH-R 5
describes the content of the 22 dimension constituting both the NOCM_UH, and the reduced
version of the instrument, the NOCM_UH-R (Hoff, 2010; Patterson et. al., 2005).
Table 1
Dimension in NOCM_UH and NOCM_UH-R
Original OCM
dimensions
New or Extended
Dimension
Content
Autonomy Reflects the degree of autonomy at work
Integration
Integration Within
Integration Between
Reflects the degree of cooperation and
communication within ones one work group
Reflects the degree of cooperation and
communication between work groups
Supervisory Support Reflects the degree of employee support and
understanding from nearest leader
Emphasis on
training
Reflects the degree of developing employee skills
Employee welfare Reflects the organizations care for its employees
Team Reflects the degree of cooperation when working in
groups
Formalization Reflects the degree of concern with formal rules
and procedures
Tradition Reflects the value of doing things in established
ways
Innovation and
Flexibility
Reflects the degree of accept for new ideas,
innovative processes and readiness for change
Outward focus
Outward focus Teaching
Outward focus Research
Outward focus Society
Responsiveness for the student’s needs
Responsiveness for the research society’s needs
Responsiveness for the society’s needs
Reflexivity
Reflects the degree of employees cognition about
work processes in order to adapt to the environment
Clarity of
organizational goal
Employee understanding of organizational goals
Efficiency Employees productivity and efficiency at work
Effort Reflects to which extend employees work hard to
achieve goals
Performance
feedback
The degree of feedback of job performance for
employees
Pressure to produce The degree of pressure on employees to meet
targets
Quality
Quality Research
Quality Teaching
Reflects employee focus on the quality of research
Reflects employee focus on the quality of teaching

VALIDATING THE NOCM_UH-R 6
New and extended dimension in the NOCM_UH
The new Team dimension seeks to measure the level of collaboration, flexibility and
communication within workgroups and is therefore placed under the human relation quadrant
of CVM (Hoff, 2010). The rationale behind the dimension is the focus knowledge-intensive
organizations have on teamwork (Drucker, 1999). Universities and colleges are knowledge-
intensive organizations. These organizations are characterized by the fact that the work is not
routine-based, difficult to standardize and with a focus on teamwork (Alvesson, 2001;
Drucker, 1999). Most employees have higher education and the focus is on knowledge
production, rather than material production. Continuing innovation is a part of the work and
productivity is not only measured in quantity and output, but also in quality (Alvesson, 2001;
Drucker, 1999). In addition, a recent study investigating the relevance of the OCM for
university employees found through interviews that only 50 % of the respondent’s statements
could be explained by the 17 dimensions in the OCM (Hønsen, 2010). A closer investigation
of the 50 % residual data revealed statements about intragroup behavior (Hønsen, 2010).
Intragroup behavior may therefore be a relevant topic among employees at universities and
colleges.
The original OCM dimension Integration seeks to measure the degree of
interdepartmental trust, cooperation and communication in organization (Patterson et al.,
2005). Universities and colleges have two distinct categories of staff, namely scientific
employees and administrative/ technical employees (Mintzberg, 1989). This makes it relevant
to measure the degree of integration within one’s own job category (i.e. scientific or
administrative/ technical employees), and also to measure the integration between the
different job categories (i.e. scientific and administrative/ technical employees). Because of
the distinction between categories of staff, the OCM dimension Integration is split in two
dimensions referred to as Integration Within and Integration Between.
The original OCM dimension Outward focus measures the company’s degree of
responsiveness to the customers’ needs and the marketplace in general (Patterson et al., 2005).
In NOCM_UH, this dimension is split in three. The rationale behind this split is based on the
purpose of educational institutions as their main tasks are to teach students, to do research,
and to publish their research findings (Hoff, 2010; Universitets- og Høyskoleloven, 2005).
The new dimensions Outward focus Teaching, Outward focus Research and Outward focus
Society therefore seeks to reflect the institutions degree of responsiveness for the student’s
needs, the needs of the research society and the society’s needs in general.

VALIDATING THE NOCM_UH-R 7
The original OCM dimension Quality measures the degree of emphasis given to
quality procedures (Patterson et al., 2005). Some of the main tasks for employees in
universities and colleges are to do research and to teach students. This is the rationale behind
the split of the original OCM dimension Quality in two. The new dimensions labeled Quality
Research and Quality Teaching therefore seeks to capture employees’ views on both research
and teaching quality.
Structure of the NOCM_UH
The NOCM_UH consists of four questionnaires, as seen in Figure 2. The different
questionnaires only intend to differ with regards to contextual aspects and not the content
being measured. One of the versions are targeted at universities and another towards colleges.
The two versions were developed because universities and colleges have different names on
their units and employees (Hoff, 2010). To prevent a methodological weakness related to
poorly descriptive items, the climate items were specifically adapted to each organization, e.g.
“The research unit is suspicious of employees at the administrative unit” (college version)
compared to “The researchers are suspicious of the technical/ administrative department
employees” (university version). The NOCM_UH is further differentiated to measures climate
among scientific employees or among administrative/ technical employees. The rationale
behind the split is related to the different tasks and functions employees have in universities
and colleges (Hoff, 2010). The administrative/ technical employees’ main task in universities
and colleges is to facilitate the work of the scientific employees, and their work can be seen as
separated from the work of the scientific employees (Hoff 2010; Mintzberg, 1989). Because
of the clear distinction between the groups of employees, it is likely that the groups will
develop their own organizational climate. Shared perceptions among a group are essential
before aggregation of individual perceptions to reflect a higher construct can take place
(Anderson and West 1998; Hoff 2010; Patterson et al., 2005).
NOCM_UH-R
The NOCM_UH have extensive questionnaires with 106-108 items reflecting 22
dimensions. Extensive surveys may result in low response rates and Hoff (2011b) has in an
effort to increase the response rate developed a reduced version of the instrument, the
NOCM_UH-R. Hoff (2011b) removed items from each dimension in the NOCM_UH to
develop the NOCM_UH-R. The reduced version of the instrument has the same dimensions

VALIDATING THE NOCM_UH-R 8
and the structure as the NOCM_UH, but only differs with regards to the number of items
reflecting each dimension.
Figur 2. The structure of the NOCM_UH and NOCM_UH-R
The purpose of the study
The purpose of the study is to test the validity of the NOCM_UH-R. If support for the
reduced version of the instrument is found, this will imply that the new and extended
dimensions can be seen as factorially distinct. Such a result will further indicate that all 22-
latent factors are distinct, thereby supporting the 17-latent factor structure constituting the
original OCM.
The Norwegian Organizational Climate Measure (NOCM) is a translation of the OCM
and was validated with 555 participants from the Norwegian service sector. Bernstrøm (2009)
found support for the Norwegian translation and the 17 factor structure constituting the
NOCM. The NOCM_UH was also recently validated in a study with 470 participants from
three universities and colleges in Norway (Nordgård, 2011). Nordgård (2011) found support
for the 22 dimensions constituting the NOCM_UH. Combining the results from the validation
of the NOCM and the NOCM_UH, it is expected that:
Hypothesis 1a: Confirmatory factor analysis will support the 22-latent factor structure
constituting the NOCM_UH-R

VALIDATING THE NOCM_UH-R 9
The two versions targeted at scientific employees and administrative/ technical
employees intended to only differ with regard to the contextual aspects, and not to the content
being measured. The 22-latent factor structure of NOCM_UH-R should therefore remain the
same when testing the model fit for both questionnaires and it is expected that:
Hypothesis 1b: Confirmatory factor analysis will support the 22-latent factor structure
constituting the NOCM_UH-R across the questionnaires for scientific and
administrative/ technical employees
Patterson et al. (2005) claims that the OCM is a valid and general measure, but has
only been tested in the UK and once in the service sector in Norway (Bernstrøm, 2009;
Patterson et al., 2005). As a general measure of organizational climate, the instrument will
increase its generalizability when supported in other sectors. Because the factor structure of
the OCM has been supported in previous research (Bernstrøm 2009; Nordgård, 2010;
Patterson et al., 2005) it is expected that:
Hypothesis 2: Confirmatory factor analysis will support the 17-latent factor structure
constituting the OCM
There is a distinction between scientific and administrative/ technical employees with
regards to the tasks and functions they have in the educational institutions (Hoff 2010;
Mintzberg 1989). Because of this distinction, the new dimensions Team, Outward focus
Teaching, Outward focus Research, Outward focus Society, Quality Teaching and Quality
Research may therefore be more relevant for the scientific employees as their work are related
to these dimensions. It is therefore expected that:
Hypothesis 3: The administrative/technical respondent answering the NOCM_UH-R, will
choose the response alternative “not relevant for me” on the new and extended
dimensions more often than the scientific employees
The NOCM_UH and NOCM_UH-R have a methodological weakness regarding the
descriptive level being measured. According to Patterson et al. (2005) “Each climate
questionnaire item should clearly focus on the specific collective unit which corresponds to
the climate being studied (team, department or organization)” (Patterson et al., 2005, p. 383).

VALIDATING THE NOCM_UH-R 10
The NOCM_UH questionnaires have items that are both worded general e.g. “It is considered
extremely important here to follow the rules”, and items that are worded specific e.g. “The
technical/administrative unit is very inward looking; it does not concern itself with what
happens in society in general “. The problem arises when the intention of the questionnaires is
to either measure the climate among the scientific employees, or among the administrative/
technical employees. The reason for this is that in universities, both the scientific and the
administrative/ technical employees work within the same unit, labeled institute. So when an
administrative/ technical employee in a university answers a general question e.g. “It is
considered extremely important here to follow the rules”, it is not clear whether the employee
answer according to his/her affiliation to the institute, or to the sub-group (i.e. administrative/
technical group). This problem is further complicated by the fact that respondents from the
universities in the e-mail invitation are asked to give their responses based on their affiliation
to the nearest institute. Regarding the questionnaires for the college employees, this is not so
much of a problem because the scientific and the administrative/ technical employees work in
separate units. Because of this, the employees at colleges give their answers based on their
affiliation to a department (i.e. scientific or administrative department) who also is their
subgroup (i.e. scientific or administrative group). Figure 3 provides a simple illustration of the
organizing of universities and colleges.
Figure 3. An illustration of the organizing of universities and colleges
VALIDATING THE NOCM_UH-R 11
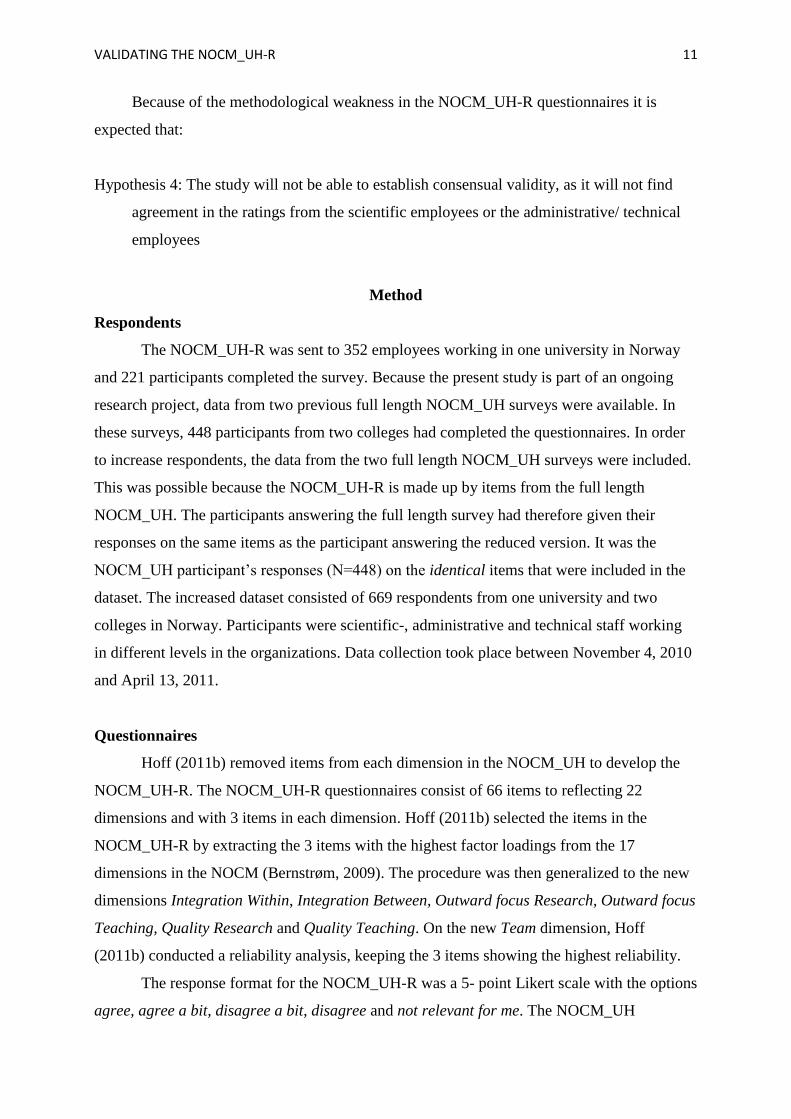
Because of the methodological weakness in the NOCM_UH-R questionnaires it is
expected that:
Hypothesis 4: The study will not be able to establish consensual validity, as it will not find
agreement in the ratings from the scientific employees or the administrative/ technical
employees
Method
Respondents
The NOCM_UH-R was sent to 352 employees working in one university in Norway
and 221 participants completed the survey. Because the present study is part of an ongoing
research project, data from two previous full length NOCM_UH surveys were available. In
these surveys, 448 participants from two colleges had completed the questionnaires. In order
to increase respondents, the data from the two full length NOCM_UH surveys were included.
This was possible because the NOCM_UH-R is made up by items from the full length
NOCM_UH. The participants answering the full length survey had therefore given their
responses on the same items as the participant answering the reduced version. It was the
NOCM_UH participant’s responses (N=448) on the identical items that were included in the
dataset. The increased dataset consisted of 669 respondents from one university and two
colleges in Norway. Participants were scientific-, administrative and technical staff working
in different levels in the organizations. Data collection took place between November 4, 2010
and April 13, 2011.
Questionnaires
Hoff (2011b) removed items from each dimension in the NOCM_UH to develop the
NOCM_UH-R. The NOCM_UH-R questionnaires consist of 66 items to reflecting 22
dimensions and with 3 items in each dimension. Hoff (2011b) selected the items in the
NOCM_UH-R by extracting the 3 items with the highest factor loadings from the 17
dimensions in the NOCM (Bernstrøm, 2009). The procedure was then generalized to the new
dimensions Integration Within, Integration Between, Outward focus Research, Outward focus
Teaching, Quality Research and Quality Teaching. On the new Team dimension, Hoff
(2011b) conducted a reliability analysis, keeping the 3 items showing the highest reliability.
The response format for the NOCM_UH-R was a 5- point Likert scale with the options
agree, agree a bit, disagree a bit, disagree and not relevant for me. The NOCM_UH

VALIDATING THE NOCM_UH-R 12
participants had the same response alternatives on the Likert scale, except for the option not
relevant for me. Even though it might lead to response bias, the items in the surveys were not
randomized. When the items are presented according to the scale they belong to, the
questionnaire is presented more similar to the way it is expected to be used in later studies
(Patterson et al., 2005).
Preparation
The NOCM_UH and the NOCM_UH-R are Norwegian surveys. As a basis to extend
the OCM, Hoff (2010) therefore used the items from the Norwegian translation of the OCM,
the NOCM (Bernstrøm, 2009; Hoff, 2010). The wordings of some of the items from the
NOCM were changed and new items develop as a consequence of a) developing the new
Team dimensions b) the extension of the OCM dimensions Integration, Outward focus and
Quality c) adapting the survey to universities and colleges and d) adapting the survey to
scientific and administrative/ technical staff (Hoff, 2010). Because educational institutions
have multicultural employees, the respondents could answer in either Norwegian or English.
The English questionnaires were a translation of the NOCM_UH questionnaires, and based as
far as possible on the wording of the original items in the OCM.
A Think Aloud pilot test with both scientific and administrative employees from a
university was conducted before the final questionnaires were sent out. This was done to
identify the items that respondents found confusing or vague (Patterson et al., 2005). The pilot
test revealed that most respondents were confused about which level in the organization they
should answer according to. This resulted in that most items in the questionnaires were
specified with the word “here” in an effort to reflect that the respondents should answer
according to their nearest institute or department. Appendix A and B shows the items in the
NOCM_UH-R questionnaires targeted at scientific and administrative/ technical employees in
colleges.
Procedure
Before the NOCM_UH and the NOCM_UH-R surveys were sent out, the employees
from the three institutions received an e-mail from the management that encouraged them to
participate. The management was in return for their participation promised a report on the
results (Hoff 2010; 2011). The e-mail addresses to the employees were provided by the
educational institutions and the lists had some errors that were removed. There might be that
some of the remaining e-mail addresses were not in use, and therefore affected the response

VALIDATING THE NOCM_UH-R 13
rate. The survey was administered to the respondents through the online survey tool
Questback. The participants from both the NOCM_UH-R and the NOCM_UH were given the
same information in the e-mail invitation. They were asked to give an evaluation of their
workplace, and they were told that the questionnaire would take approximately 15 minutes to
complete. Included in the e-mail invitation was information about voluntary consent. The
respondents were told that the data would be handled anonymously and not linked back to
them personally. Participants were encouraged to submit their responses based on how they
perceived the climate within the department or institute, rather than to generalize to the
individual, faculty or organizational level. The surveys were available online for the
respondents for approximately two and a half week. Depending on which educational
institution they worked in, the employees received two or three e-mail reminders that
encouraged them to participate.
Statistical analysis
PASW Statistics 18 and Amos 18 were the statistic programs used in the study to
describe and test the relationships in the data. The following procedures were performed to
test the hypotheses a) structural equation modeling (SEM) b) correlation analysis c) missing
values analysis d) reliability analysis of the scales and e) calculation of rWG(j) index to
represent the degree of interrater agreement (James, Demaree and Wolf, 1984). Because of
missing values and the underlying theory about the direction of the items and the latent
factors, only confirmatory and not exploratory factor analysis was conducted on the data.
SEM analyses were the preferred method because SEM tests how well the predicated model
fits the data, and it also allows one to compare alternative models (Pallant, 2010).
Results
Descriptive statistics
The mean response rate for the three institutions completing the NOCM_UH and
NOCM_UH-R surveys were 60 % (N=669). The response rate ranged from 58% to 63 %
across the institutions and this is high, as the mean for other organizational studies is 35, 7 %
(Baruch and Holtom, 2008). 17 % (N=113) of the respondents were university employees and
83 % (N=556) were college employees. 65, 6 % of the respondents were scientific employees
(N=439), while 34, 4 % (N=230) were technical/ administrative employees.
An independent-samples t-test was conducted to control for response biases between
respondents answering before or after the last e-mail reminder. The analyses showed no

VALIDATING THE NOCM_UH-R 14
significant difference between the respondents answering before or after the last e-mail
reminder for any of the 22 dimensions, p < .01 (two-tailed).
The response alternative “not relevant for me” was coded as a missing value in the
analyses and only the 221 respondents answering the NOCM_UH-R were given this response
option. When N=669, the percent missing for each question ranged from 0 - 7, 6 %. Little’s
MCAR test showed that the data was not Missing Completely at Random (Schafer and
Graham, 2002). Because a list-wise deletion would result in the loss of respondents,
Expectation-maximization algorithm (EM) was used to replace missing data in all analyses
including SEM (Dempster, Laird, & Rubin, 1977; Patterson et al., 2005). Because EM uses
the information contained in cases with and without missing data to compute a maximum
likelihood covariance matrix, the algorithm makes more efficient use of the available data
than standard missing data techniques (Patterson et al., 2005, p. 388).
Some of the dimensions in the data set were not normally distributed and this is quite
common in the field of social science (Pallant, 2010). A visual inspection of the boxplot for
these dimensions showed that the dimensions had outliers, meaning that they had cases with
values well above or well below the majority of cases (Pallant, 2010, p. 64). An inspection of
the outliers’ responses in the data file showed no typing error. The outliers were not removed
as the mean value and the 5% trimmed mean value for these dimensions were almost the
same. In combination with a large sample size, this indicates the outliers will most likely not
be problem when performing statistical analyses on the data (Pallant, 2010).
Confirmatory Factor Analysis
SEM analyses were conducted to test the fit of the models. Assessment of fit
essentially calculates how similar the predicted model is to the matrices containing the
relationships in the actual data (Pallant, 2010). Three indices are reported in this paper, the
Non- normal fit index (NNFI) also known as the Tucker Lewis index, Comparative fit index
(CFI) and the Root mean squared error of approximation (RMSEA). A combination of these
indices seeks to cover the lack of one ideally fit index, because different fit indices is sensitive
to sample size, model size, model misspecification and model types (Fan and Sivo, 2007).
Because the model fits are a function of the chi-square and the degrees of freedom, these are
also reported (Curran, Bollen, Chen, Paxton & Kirby, 2003).
Hypothesis 1a. The first hypothesis stated that confirmatory factor analysis would
support the 22-latent factor structure constituting the NOCM_UH-R. The NNFI (Tucker
Lewis index) and the CFI should all have values above 0.90 to be considered good fit (Hu and

VALIDATING THE NOCM_UH-R 15
Bentler, 1999). For the RMSEA, a value below 0.08 is acceptable, but a value below 0.05 is
considered to be a good fit (McDonald and Ho, 2002). As seen in Table 2, all indices met the
acceptable level of fit, thereby supporting the hypothesis.
Table 2
Goodness of fit indices for the 22-factor model
Index All employees
NNFI .91
CFI .92
RMSEA 0.039 LO90: 0.039 HI90:0.041
Chi-square (d.f.) 3701,699 (1848)
N=669
Hypothesis 1b. Regarding the second hypothesis, that confirmatory factor analysis
would support the 22-latent factor structure constituting the NOCM_UH-R across scientific-
and administrative/technical employees, the indices were more contradictory. As seen in
Table 3, the RMSEA for both group were stable and indicating good fit with a value of 0.04.
But only the CFI for the scientific employees were at the acceptable level with a value of
0.90. As argued by Patterson et al. (2005), achieving high levels of fit with large numbers of
items is difficult (Floyd and Widaman, 1995). When items are specified to load on to just one
factor as in the NOCM_UH-R, this also limits the chance of finding acceptable indices
(Patterson et al. 2005). All though some of the fit indices were slightly below the
recommended level, the indices were similar to previous research validating the OCM,
NOCM and NOCM_UH (Bernstrøm, 2009; Nordgård, 2011; Patterson et al., 2005).
Table 3
Goodness of fit indices for the 22-factor model across employees
N = 439/230
Index Scientific employees Admin/tech. employees
NNFI .88 .86
CFI .90 .88
RMSEA 0.045 LO90: 0.043 HI90: 0.048 0.049 LO90: 0.046 HI90: 0.053
Chi-square (d.f.) 3516,524 (1848) 2867,844 (1848)

VALIDATING THE NOCM_UH-R 16
Hypothesis 2. Patterson et al. (2005) argues that the OCM is a valid climate measure
and the instrument has already been supported in other countries and sectors (Bernstrøm
2009, Nordgård 2011). In Hypothesis 2 it was expected that confirmatory factor analysis
would support the 17-latent factor structure constituting the OCM. To test the hypothesis, the
22 dimensions constituting the NOCM_UH-R were reduced to 17 to reflect the same
dimensions as in the original OCM. Excluded from the analysis were the dimensions Team,
Integration Between, Outward focus Research, Outward focus Teaching and Quality
Teaching. The dimensions Integration Within, Outward focus Society and Quality Research
was kept in the analysis as the content of these dimensions were more similar to the content of
the original OCM dimension Integration, Outward focus and Quality. As seen in Table 4, the
hypothesis is supported with a NNFI and a CFI value above 0.90, in combination with a low
and stable RMSEA at the level of 0.03.
Table 4
Goodness of fit indices for the 17-factor model
Index All employees
NNFI .93
CFI .94
RMSEA 0.038 (LO90: 0.035 HI90: 0.040)
Chi-square (d.f.) 2115,870 (1088)
N=669
Missing values analysis
The response option “not relevant for me” was in the dataset coded as a missing value.
In Hypothesis 3, it was stated that descriptive statistics would show that the administrative/
technical respondent answering the NOCM_UH-R chose the response option “not relevant for
me” on the new dimensions more often than the scientific employees. In Table 5, items with
more than 7 % missing values are presented. The administrative/ technical employees chose
the “not relevant for me” option more often regarding the dimensions Integration Between,
Team, Outward focus Research, Quality Research and Quality Teaching. The same results
were not found regarding the dimension Integration Within, Outward focus Teaching and
Outward focus Society.

VALIDATING THE NOCM_UH-R 17
Table 5
Missing values analysis
Question Item Total % Scientific % Admin/ Tech %
Q7 Integration Between 10.9 7.9 16
Q8 Integration Between 7.7 8.6 6.2
Q9 Integration Between 7.2 8,6 4,9
Q22 Team 15.8 13.6 19.8
Q23 Team 16.7 15 19.8
Q24 Team 23.1 20 28.4
Q37 Outward focus Research 9.5 3.6 19.8
Q38 Outward focus Research 14.5 5.7 29.6
Q39 Outward focus Research 17.6 7.9 34.6
Q61 Quality Research 16.7 10 28.4
Q62 Quality Research 14.9 8.6 25.9
Q63 Quality Research 18.1 7.1 37
Q64 Quality Teaching 13.1 0.7 34.6
Q65 Quality Teaching 10.4 10.4 28.4
N = 221. Only items with 7 % missing values or more are presented
Consensual validity
Hypothesis 4 stated that the study would not be able to establish consensual validity as
it would not find agreement in the ratings from the scientific employees or the administrative/
technical employees. To test the hypothesis, interrater agreement (IRA) was estimated using
the within-group agreement index of multiple items scales, also known as the rWG(j) index
(James et al., 1984). rWG(j) values at or above 0.70 are considered acceptable levels of IRA
(LeBreton and Senter, 2007). As presented in Table 6, the results show low levels of within-
group agreement on most dimensions for both the scientific employees and the administrative/
technical employees. Only 9 of the 22 scales for the scientific employees were at or above the
acceptable value of 0.70. For the administrative/ technical employees, only 13 of the 22 scales
were at or above the acceptable value 0.70.
Additional support
The scales internal consistency was estimated using one of the most common
indicators, the Cronbach’s alpha coefficient (DeVellis, 2003; Pallant, 2010). As seen in Table

VALIDATING THE NOCM_UH-R 18
6, all values were at or above 0.70, except the Integration Between scale ( = .68). Although
values above 0.8 are preferable, values above 0.70 are acceptable (DeVellis, 2003). According
to the results, the dimensions in NOCM_UH-R have good internal consistency.
Table 6
Reliability and interrater agreement of scales
CVF quadrant; HR= Human Relations model, IP= Internal Process model, OS= Open
Systems model, RG= Rational Goal model
CVF
quadrant
Scales Cronbach's
Alpha
rWG(j)
Scient.
rWG(j)
Admin/tech.
HR 1 Autonomy 0.70 0.70 0.68
HR 2 Integration Within 0.70 0.62 0.58
HR 3 Integration Between 0.68 0.84 0.81
HR 4 Involvement 0.84 0.57 0.64
HR 5 Supervisory Support 0.85 0.78 0.73
HR 6 Training 0.86 0.45 0.84
HR 7 Welfare 0.89 0.67 0.70
HR 8 Team 0.87 0.72 0.97
IP 9 Formalization 0.76 0.76 0.70
IP 10 Tradition 0.70 0.74 1.16
OS 11 Innovation and flexibility 0.84 0.76 0.62
OS 12 Outwards focus Teaching 0.75 0.67 0.63
OS 13 Outwards focus Research 0.84 0.61 1.38
OS 14 Outwards focus Society 0.88 0.68 1.12
OS 15 Reflexivity 0.77 0.61 1.38
RG 16 Clarity of org. Goals 0.87 0.64 0.63
RG 17 Efficiency 0.77 0.66 0.56
RG 18 Effort 0.83 0.84 0.81
RG 19 Performance Feedback 0.79 0.56 0.44
RG 20 Pressure to produce 0.80 0.64 1.84
RG 21 Quality Research 0.83 0.62 0.76
RG 22 Quality Teaching 0.84 0.71 0.85

VALIDATING THE NOCM_UH-R 19
As expected when dealing with aspects of climate, the correlation matrix shows that
climate dimensions correlates with each other but none of the correlations were above 0.80
(Patterson et al., 2005). Appendix C shows the means, standard deviations and the correlation
matrix for the 22 scales constituting the NOCM_UH-R.
The high factor loading between the dimensions and the items with most items having
loadings above 0.70 is additional support for the model. Appendix D presents the standard
regression weights for all items.
Discussion
The purpose of the study was to describe the development of the NOCM_UH and to
validate the reduced version of the instrument, the NOCM_UH-R. If support for the reduced
version of the instrument was established, then the 22 dimension constituting the
NOCM_UH-R could be seen as factorially distinct. If the original 17- latent factor structure of
the OCM also was supported, it could be seen as additional support for the generalizability of
the original instrument. Another assumption made in the study was that administrative/
technical employees had chosen the response option “not relevant for me” on the new and
extended dimensions more often than scientific employees, supporting that these dimensions
were more relevant for the last group. Further, if the study was not able to establish interrater
agreement in the scores from the employees, this could be seen as support for that the data did
not qualify for aggregation to reflect the organizational climate in the institutions.
Hoff (2011b) removed items from each dimension in the NOCM_UH to develop the
NOCM_UH-R. When items in a survey are reduced, the instruments ability to measure the
dimensions properly may be wakened even though a reduced version may increase response
rate. The reduced version of the NOCM_UH-R had the highest response rate (63 %) as
opposed to the NOCM_UH version. All though the organizations were told that the
questionnaire would take approximately 15 minutes to accomplish, feedbacks from
respondents who had actually answered the full length NOCM_UH version reported that it
could take up to 40 minutes to finish. Talk among colleagues about the extensive
questionnaire may have contributed to that the response rate for the full length version were
lower than the reduced version. An additional benefit of using a reduced version is that the
organizations can add a few specific questions of their own without exceeding the response
time for the questionnaire with more than a couple of minutes.

VALIDATING THE NOCM_UH-R 20
Hypothesis 1a and 1b
Fit indices are sensitive to sample size, model types, model size and model
misspecification. This makes it difficult to establish a final cut-off criteria, although values at
or above 0.9 are the recommended level (Fan and Sivo 2007). The NNFI and the CFI are both
sensitive to model types and to model misspecifications (Fan and Sivo 2007). Because of the
limitations of fit indices, Blunch (2008) has argued that a model with a low RMSEA only
needs a CFI above 0.8 to be regarded as a good model.
Regarding Hypothesis 1a, the hypothesis is supported with a NNFI and a CFI value
above 0.90, combined with a RMSEA value of 0.03. Regarding hypothesis 1b, some of the
indices were slightly below the recommended level of 0.90. But if one accepts that a low
RMSEA only need a CFI above 0.8 to be considered a good fit, the 22-latent factor structure
constituting the version for scientific employees was supported (Blunch, 2008). For the
administrative/ technical employees, only the RMSEA was stable and at the acceptable level
of 0.04. The results are complicated by the fact that the RMSEA rewards simpler models as in
the NOCM_UH-R, where items are specified to load on to just one factor. In addition, the
RMSEA rewards larger models with many items as the NOCM_UH_R, meaning that the
RMSEA decreases, when the number of variables increases (Fan and Sivo 2007; Kenny and
McCoach, 2003). Because the RMSEA value for all the models were well below the
acceptable level of 0.08 and because it is widely accepted that it is difficult to achieve high
levels of fit with a large number of items (Patterson et al., 2005; Floyd and Widaman 1995),
this give support to Hypothesis 1b. The model fits for the scientific and the administrative/
technical employees were also similar to previous research, who accepted the latent factor
structure constituting the instruments (Bernstrøm 2009; Nordgård, 2010; Patterson et al.,
2005). In line with the arguments above, Hypothesis 1a and 1b is therefore accepted. This
implies that the 22 dimensions constituting the NOCM_UH-R are factorially distinct, and that
the new and extended dimensions in the NOCM_UH-R are adding additional information to
the OCM. In addition, since the fit indices across the different job types (i.e. scientific and
administrative/ technical staff) were almost the same, the generalizability of the NOCM_UH-
R is supported as it shows that the factor structure holds for each population (Patterson et al.,
2005).
Hypothesis 2
The 22 dimension constituting the NOCM_UH-R were reduced to reflect the 17
dimension in the original OCM. Even though the items in the two surveys are different, the

VALIDATING THE NOCM_UH-R 21
dimensions are expected to measure the same content. The model fit for the 17-latent factor
structure constituting the original OCM had acceptable indices (above 0.90) as presented in
Table 4. Because the RMSEA value (0.03) was stable and well below the acceptable level of
0.08, Hypothesis 2 is supported. This gives additional support for the generalizability of the
OCM, meaning that the instrument can be used to measure climate in other countries and in
other areas of investigation.
Hypothesis 3
The main job for scientific employees in universities and colleges are to teach student
and to do research, and this work may be done in collaboration (team) with other colleagues.
The new dimensions Integration, Team, Outward focus and Quality might therefore be more
relevant for the scientific employees. This assumption was also supported by the missing
values analysis as the administrative/ technical employees had chosen the option “not relevant
for me” on most of these dimensions. Although Hypothesis 1b was supported, the poorer
model fit for the administrative/ technical employees on the NOCM_UH-R can be seen as
additional support for Hypothesis 3. The result from the missing values analysis in
combination with a poorer model fit may therefore imply that the new dimensions in
NOCM_UH-R are more relevant for the scientific employees.
Hypothesis 4
The study was not able to find interrater agreement in the scores from the scientific or
the administrative/ technical employees, and this supports Hypothesis 4. As argued before, the
reason for this might be that the university employees gave their responses according to
different levels within the organization. If this reason is accepted, the dimensions that had
items reflecting a specific level should yield higher rWG(j) values. The specific items for both
groups were in the dimensions Integration Within and Integration Between. As seen in Table
5, none of the groups had acceptable values at or above 0.70 regarding the Integration Within
scale. Regarding the Integration Between scale, both groups had acceptable values. The
administrative/ technical employee’s items regarding the dimensions Outward focus
Research, Outward focus Society, Quality Research and Quality Teaching were also specified
in the questionnaire. The administrative/ technical employees had acceptable rWG(j) values
on all of these dimensions thereby supporting the hypothesis. Another reason related to the
lack of interrater agreement is that there exist different subgroups among the employees and
the respondents gave their answers based on their affiliation to such a subgroup. The different

VALIDATING THE NOCM_UH-R 22
subgroups may exist inside or across the scientific- and the administrative/ technical
employees. Because the rWG(j) index uses a uniform null distribution, it predicts that there is
one true score for all groups (LeBreton and Senter, 2007). But if one allowed a score to have
multiple true scores using the rWGp (one for each subgroup), the subgroups must be
identified a priori or else the results would be completely at random (LeBreton and Senter,
2007). Because of the size and the diversity of today’s organizations, finding interrater
agreement among employees may be almost impossible when measuring large groups. The
reason for this is that when employees are working close together they will most likely
develop their own climate (Anderson and West 1998). According to Anderson and West
(1998), interrater agreement should therefore be measured at the level of the work group or
subunit, instead of at the organizational level. In the NOCM_UH and NOCM_UH-R, climate
is measured in two large groups of staff, namely the scientific or the administrative/ technical
group. The size of the two groups of employees may have been too large to find interrater
agreement and contributed to that the study was not able to establish consensual validity.
Because of the argumentation above about the methodological weakness in the NOCM_UH-R
version for universities, Hypothesis 4 is accepted. This implies that the NOCM_UH-R
questionnaires for universities is not measuring organizational climate in organization, but
only measures individual employee perception of different aspects of the work environment
(Patterson et al., 2005).
Limitations
The study only tested two models on the data even though other models might yield
the same or better fits. Regardless of this and because of the underlying theoretical
assumption about which items that loads on to which factor, the results give a good
explanation of the relationships in the data.
The NOCM_UH-R only had three items to measure each factor, as opposed to the
NOCM_UH that had 5-7 items. Fewer items may have weakened the instruments ability to
adequately measure the content of the dimensions and another solution to increase the
response rate would be to only use the dimensions relevant for each study, keeping the items
but reducing the dimension.
The items in NOCM_UH-R are based on the NOCM (Bernstrøm 2009). If the
translation and back translation of the NOCM included errors, these may have been
transferred to the NOCM_UH-R questionnaires and resulted in that the respondents
misinterpreted the questions as they were intended to by Patterson et al. (2005). There is still

VALIDATING THE NOCM_UH-R 23
no reason to believe that the items in NOCM had errors as the results from the validation
study were similar to those of Patterson et al. (2005). Before sending out the NOCM_UH-R, a
pilot test was also conducted to prevent that the questionnaires contained items that the
respondents found confusing or ambiguous.
An assumption made in this study was that the responses from the scientific and the
administrative/ technical employees reflected the same dimension, even though some of the
items for the two groups were slightly different. If the items in the questionnaires differed
with regards to the content and not just the context as intended, the respondents may have
answered different items. This may have affected the results from the confirmatory factor
analysis, but this is unlikely as most of the fit indices were acceptable.
Another assumption made in the study is that the answers from the 448 respondents
from the full length version of the NOCM_UH were not affected by the items excluded from
the reduced version. If their answers were biased, it may have affected the results and hence
conclusions about construct validity are not possible.
The Likert scale in the study was a 4- point, meaning that the scale did not include a
mid-point. The lack of a mid-point on a scale can reduce social desirability bias as when
respondents choose the neutral option on the scale because they want to please or be helpful
to the researcher, or not give socially unacceptable answers (Garland 1991). On the other
hand, to force respondents to make statements on subjects they might not agree on may result
in that the variation within the sample is artificially high (Garland 1991). The benefit of
having an alternative option in the Likert scale can seen in results from the missing values
analysis. Because one third of the sample (N = 221) was given the response option “not
relevant for me” (even though it is not a neutral response option), such an option revealed the
items that the employees did not find relevant.
As discussed earlier, the NOCM_UH-R versions for the university employee had a
methodological weakness that resulted in the lack of consensual validity. The weakness was
not intentional, but nevertheless it may have affected that the study were not able to establish
consensual validity.
Further research
More research needs to be done to validate the reduced version of the NOCM_UH as
only 221 of the respondents actually answered this version. Further research on the instrument
should try to specify all items to reflect the same level within the organization, thereby
enabling the instrument to establish consensual validity. As the pilot study also revealed, most

VALIDATING THE NOCM_UH-R 24
respondents were uncertain about which level in the organization they should answer
according to.
The NOCM_UH and NOCM_UH-R questionnaires exist in English versions in
addition to the Norwegian versions. Even though the English versions were based as far as
possible on the items from the original OCM, the items did not include proper translations and
back translations. Further development may therefore want to validate the English versions of
the instruments.
The items in the original OCM were specifically selected to represent the dimensions
of investigation, and so were the items in the new and extended dimensions in NOCM_UH
(Hoff 2010; Patterson et al., 2005). As this implies that the scales have high face validity,
further research may wish to investigate whether other items may yield higher scale reliability
and better model fits.
Regarding the relevance of the OCM, the dimensions in the instrument have a clear
theoretical basis as most of them were gathered from extensive literature on organizational
climate from the four last decades. Because the dimensions can be mapped into the four
quadrants of CVM, they also represent four major traditions in the study of organizational
effectiveness. But as work life has progressed, more people are now working in the service
sector than in the traditionally industry. This may imply that the OCM is not taking into
account the shifting aspects of the new work life (Alvesson, 2001; Torp, 2005). Patterson et
al. (2005) also pointed to the lack of the instruments ability to measures the organizations
emphasis on ethical practice and policy. Further research may therefore want to investigate
whether other dimensions are relevant and more related to the new work life.
Conclusion
Most dimensions in the NOCM_UH-R have a clear theoretical basis. This is because
the instrument is based on the OCM by Patterson et al (2005), who collected the latent factors
from the extensive literature on organizational climate from the four last decades. Because the
dimensions can be mapped into one of the four quadrants of Competing Values Framework
(Quinn and Rohrbaugh 1981; 1983), they also represent four major traditions in the study of
organizational effectiveness.
The study found support of the 22-latent factor structure constituting the NOCM_UH-
R (Hoff, 2011b). This indicates that the new and extended dimensions are factorially distinct
and provides the original OCM with additional information, relevant for universities and
colleges. The same result was also found across the scientific and the administrative/ technical
VALIDATING THE NOCM_UH-R 25
employees, as the instrument separates these two groups because of the different functions
they have in universities and colleges. The study found support of the 17- latent factor
structure constituting the OCM, and this can be seen as additional support for the
generalizability of the OCM. The result implies that the OCM can be used to measure
organizational climate in other countries and in other sectors than in the industry sector in the
UK, where it was first validated.
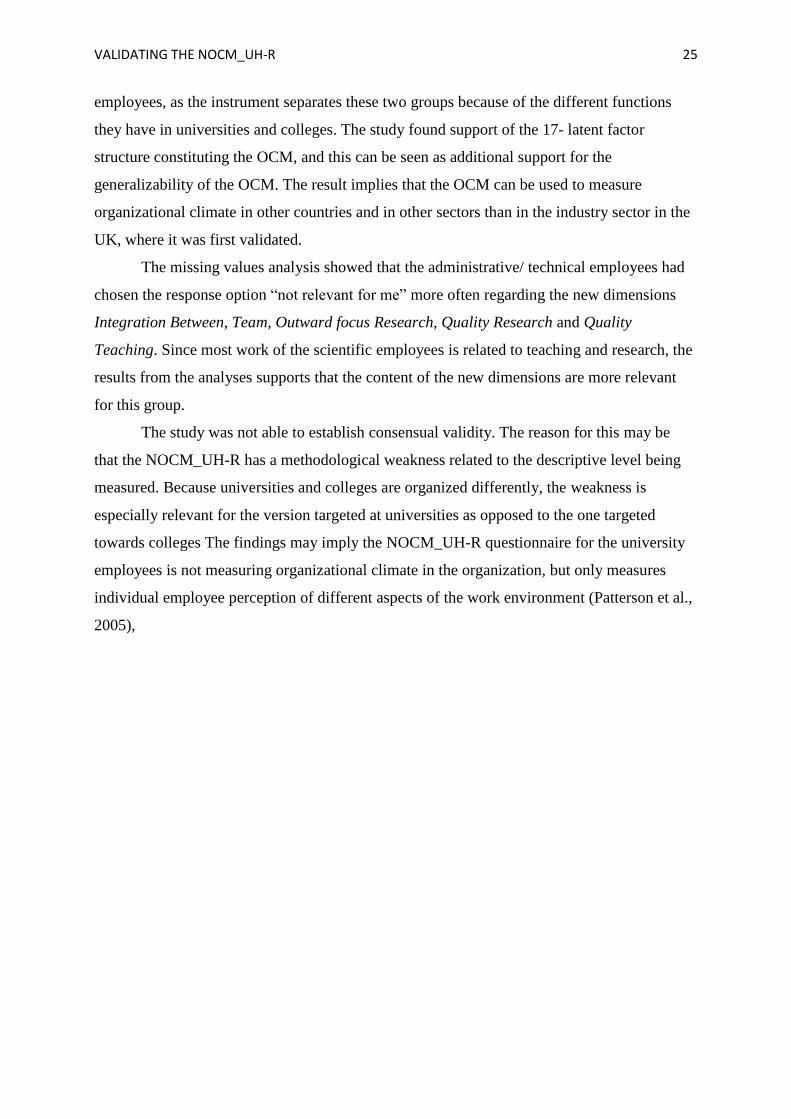
The missing values analysis showed that the administrative/ technical employees had
chosen the response option “not relevant for me” more often regarding the new dimensions
Integration Between, Team, Outward focus Research, Quality Research and Quality
Teaching. Since most work of the scientific employees is related to teaching and research, the
results from the analyses supports that the content of the new dimensions are more relevant
for this group.
The study was not able to establish consensual validity. The reason for this may be
that the NOCM_UH-R has a methodological weakness related to the descriptive level being
measured. Because universities and colleges are organized differently, the weakness is
especially relevant for the version targeted at universities as opposed to the one targeted
towards colleges The findings may imply the NOCM_UH-R questionnaire for the university
employees is not measuring organizational climate in the organization, but only measures
individual employee perception of different aspects of the work environment (Patterson et al.,
2005),

VALIDATING THE NOCM_UH-R 26
References
Alvesson, M. (2001). Knowledge work: Ambiguity, image and identity. Human Relations,
54(7), 863-886. doi: 10.1177/0018726701547004.
Arbuckle, J.L. (1997-2007). Amos 16.0. AMOS Development Corporation.
Ashkanasy, N.M., Wilderom, C.P.M., & Peterson, M.F. (2000). Handbook of organizational
culture and climate. London: Sage.
Bernstrøm, V. H. (2009). Investigating the Organizational Climate Measure's
generalizability. Published master thesis: University of Oslo: Oslo.
Blunch, N. J. (2008). Introduction to structural equation modelling using SPSS and AMOS.
Introduction to structural equation modelling using SPSS and AMOS, vii, pp. 270.
Thousand Oaks, CA: Sage Publications Ltd.
Anderson, N. R., and West, M. A. (1998). Measuring climate for work group innovation:
development and validation of the team climate inventory. Journal of organizational
behavior, 19(3), 235-258.
Cameron, K. S., Quinn, R. E., DeGraff, J., & Thakor, A. V. (2006). Competing Values
Leadership: creating value in organizations. Cheltenham: Edward Elgar Publishing
Limited.
Cameron, K. S., Quinn, R. E. (2006). Diagnosing and Changing Organizational Culture. San
Francisco: Jossey-Bass.
Curran, P.T., Bollen, K.A., Chen, F., Paxton, P. & Kirby, J.B. (2003). Finite sampling
properties of the point estimates and confidence intervals of the RMSEA. Sociological
Methods & Research, 32 (2), 208-252. doi: 10.1177/0049124103256130.
Dempster, A. P., Laird, N. M., & Rubin, D. B. (1977). Maximum likelihood from incomplete
data via the EM algorithm. Journal of the Royal Statistical Society B, 39, 1-38.
DeVellis, R. F (2003). Scale development: Theory and applications. Thousand Oaks,
California: Sage.
DeCoster, J. (1998). Overview of Factor Analysis. Retrieved from http://www.stat-
help.com/factor.pdf.
Drucker, P. F (1999). Knowledge-Worker Productivity: The Biggest Challenge. California
Management Review, XLI:2, 79-94.
Fan, X., and Sivo, S. A. (2007). Sensitivity of fit indices to model misspecification and model
types. Multivariate Behavioral Research, 42(3), 509-529.

VALIDATING THE NOCM_UH-R 27
Floyd, F. J., and Widaman, K. F. (1995). Factor analysis in the development and refinement
of clinical assessment instruments. Psychological Assessment, 7(3), 286-299. doi:
10.1037/1040-3590.7.3.286
Garland, R. (1991). The mid-point on a rating scale: Is it desirable? Marketing Bulletin, 2, 66-
70.
Hoff, T. (2010). Norwegian Organizational Climate Measure for educational institutions.
Unpublished manuscript.
Hoff, T. (2011) a. Nøkkelrapport for tolkning av resultater fra NOCM_UH
arbeidsmiljøundersøkelse. Unpublished manuscript.
Hoff, T. (2011) b. The NOCM_UH-R questionnaire. Unpublished manuscript.
Hotvedt, C. S. (2011). En undersøkelse av Organizational Climate Measure i Universitetes-
og Høyskolesektoren. Unpublished master thesis: University of Oslo, Oslo.
Howard, L. W. (1998).Validating the competing values model as a representation of
organizational culture. The International Journal of Organizational Analysis, 6(3), 231-
250.
Hønsen, L. (2010). Arbeidsmiljø i en kunnskapsintensiv organisasjon: en analyse av
Organizational Climate Measure gjennom SWOT-intervjuer. Unpublished master thesis:
University of Oslo, Oslo.
Hu, L. and Bentler, P. A. (1999) Cutoff criteria for fit indexes in covariance structure
analysis: Conventional criteria versus new alternatives. Structural Equation Modeling: A
Multidisciplinary Journal, 6(1), 1-55. doi:10.1080/10705519909540118.
Johnson, J. J., and McIntye, C. L. (1998). Organizational culture and climate correlates of job
satisfaction. Psychological Reports, 82, 843-850. doi: 10.2466/PR0.82.3.843-850.
James, L. R., Demaree, R. G., & Wolf, G. (1984). Estimating within-group interrater
reliability with and without response bias. Journal of Applied Psychology, 69(1), 85-98.
doi: 10.1037/0021-9010.69.1.85.
Kenny, D. A., and McCoach, D. B. (2003). Effect of the number of variables on measures of
fit in structural equation modeling. Structural equation modeling, 10, 333-351.
Kwan, P., and Walker, A. (2004). Validating the competing values model as a representation
of organizational culture through inter-institutional comparisons. Organizational Analysis,
12(1), 21-37.
Lamond, D. (2003). The value of Quinn`s competing values model in an Australian context.
Journal of Managerial Psychology, 18(1), 46-59.
VALIDATING THE NOCM_UH-R 28
LeBreton, J. M., and Senter, J. L. (2007). Answers to 20 Questions About Interrater
Reliability and Interrater Agreement. Organizational Research Methods, 11(4), 815-852.
doi: 10.1177/1094428106296642.
Lov om universiteter og høyskoler (universitets- og høyskoleloven), 4. januar 2005. Retrieved
from: http://lovdata.no/cgi-wift/wiftldles?doc=/app/gratis/www/docroot/all/nl-20050401-
015.html&emne=høyskolelov*&&.
McDonald, R. P., and Ho, M. H. R. (2002). Principles and practice in reporting structural
equation analyses. Psychological Methods, 7, 64-82. doi: 10.1037/1082-989X.7.1.64
Mintzberg, H. (1989). Mintzberg On Management. Inside our strange world of organizations.
New York: The Free Press.
Norgård, M. (2011). Validating the Norwegian Organizational Climate Measure for
Universities and Colleges (NOCM_UH). Unpublished master thesis: University of Oslo,
Oslo
Pallant, J. (2010). SPSS Survival Manual. Berkshire: McGraw-Hill.
Patterson, M. G., West, M. A., Shackleton, V. J., Dawson, J. F., Lawthom, R., Maitlis, S., et
al. (2005). Validating the organizational climate measure: Links to managerial practices,
productivity and innovation. Journal of Organizational Behavior, 26(4), 379-408. 23. doi:
10.1002/job.312.
Quinn, R. E., and Rohrbaugh, J. (1981). A Competing Values approach to organizational
effectiveness. Public Productivity Review, 5, 122-140.
Quinn, R. E., and Rohrbaugh, J. (1983). A spatial model of effectiveness criteria: toward a
competing values approach to organizational analysis. Management Science, 29, 363–377.
Rousseau, D. M. (1988). The construction of climate in organizational research. In C. L.
Cooper, & I. T. Robertson (Eds.), International Review of Industrial and Organizational
Psychology, 3,139–158. New York: Wiley.
Rentsch, J. (1990). Climate and culture: interaction and qualitative differences in
organizational meanings. Journal of Applied Psychology, 75, 668–681. doi: 10.1037/0021-
9010.75.6.668.
Schafer, J. L., and Graham, J. W. (2002). Missing data: Our view of the state of the art.
Psychological Methods, 7(2), 147-177. doi: 10.1037/1082-989X.7.2.147.
Stone, P. W., Du, Y., & Gershon, R. R. M. (2007). Organizational Climate and Occupational
Health Outcomes in Hospital Nurses. Journal of Occupational & Environmental Medicine,
49(1), 50-58. doi: 10.1097/01.jom.0000251622.05429.0c.
Schneider, B. (1975). Organizational climates: an essay. Personnel Psychology, 36, 19-36.

VALIDATING THE NOCM_UH-R 29
Schneider, B., and Reichers, A. E. (1983). On the etiology of climates. Personnel Psychology,
36, 19-39. DOI: 10.1111/j.1744-6570.1983.tb00500.x.
Torp, H. (Ed.). (2005). Nytt arbeidsliv: Medvirkning, inkludering og belønning. Oslo:
Gyldendal
Tsai, M.-T., and Huang, C.-C. (2008). The relationship among ethical climate types, facets of
job satisfaction, and the three components of organizational commitment: A study of
nurses in Taiwan. Journal of Business Ethics, 80(3), 565-581.

VALIDATING THE NOCM_UH-R 30
Appendix A: NOCM_UH-R questionnaire. Distributed to scientific employees.
Reversed items are marked with an asterix (*) and were reversed before all analyses were
conducted.
Autonomi (Autonomy)
Q 1 Lederne her lar stort sett ansatte ta sine egne beslutninger
Q2 Lederne her har tillit til at man kan ta arbeidsrelaterte beslutninger uten å innhente
tillatelse først
Q3 Lederne her har et strengt regime over måten ting blir gjort på *
Integrasjon mellom vitenskapelige ansatte (Integration among scientific employees)
Q4 Det er lite konflikt mellom forsker- eller faggruppene her
Q5 De ansatte er innstilt på å dele informasjon på tvers av forsker- eller faggrupper her
Q6 Det er lite respekt mellom forsker- eller faggruppene her *
Integrasjon mellom vitenskapelig- og administrativit/teknisk ansatte (Integration
between scientific and administrativ/technical employees)
Q7 Det er lite konflikt mellom forsker- eller faggruppene og administrasjonsavdelingen
Q8 De ansatte er innstilt på å dele informasjon på tvers av faglige avdelinger og
administrasjonsavdelingen
Q9 Det er lite respekt mellom forsker- eller faggruppene og administrasjonsavdelingen *
Involvering (Involvement)
Q10 Her lar lederne de ansatte medvirke i beslutninger som angår dem
Q11 Endringer blir gjort uten å snakke med de involverte *
Q12 De ansatte føler at beslutninger ofte tas uten at de blir hørt*
Støtte fra ledelsen (Supervisory Support )
Q13 Overordnede er dyktige til å forstå de ansattes problemer
Q14 Overordnede hos oss er vennlige og lette å henvende seg til
Q15 Overordnede viser forståelse for sine ansatte
Fokus på trening (Emphasis on Training)
Q16 De ansatte får ikke tilstrekkelig opplæring i nye systemer eller nytt utstyr*
Q17 Her gis det kun et minimum av den opplæringen de ansatte trenger for å gjøre jobben
sin*
Q18 De ansatte får tilstrekkelig opplæring i å bruke nytt utstyr
Velferd (Welfare)
Q19 Her blir de ansatte tatt vare på
Q20 Her bryr man seg om de ansatte
Q21 Her prøver man å handle rettferdig overfor sine ansatte

VALIDATING THE NOCM_UH-R 31
Teamarbeid (Team)
Q22 Arbeidsgruppene her (komiteer, utvalg og råd, prosjektgrupper etc.) preges av god
informasjonsdeling
Q23 Målene for arbeidsgruppene (komiteer, utvalg og råd, prosjektgrupper etc.) er godt
kjent blant alle medlemmene
Q24 Arbeidsgruppene (komiteer, utvalg og råd, prosjektgrupper etc.) er preget av å være
fleksible slik at man kan dele på oppgavene dersom det er behov for dette
Formalisering (Formalisation)
Q25 Hos oss blir det oppfattet som svært viktig å følge reglene
Q26 Hos oss må alt gjøres etter reglene
Q27 Hos oss blir ingen særlig opprørt hvis reglene brytes *
Tradisjon (Tradition)
Q28 Ledelsen foretrekker å holde seg til de etablerte, tradisjonelle måtene å gjøre ting på
Q29 Måten ting gjøres på her har aldri forandret seg særlig mye
Q30 Stolthet og lange tradisjoner er viktig hos oss
Innovasjon og Fleksibilitet (Innovation and Flexibility)
Q31 Behov for å gjøre ting annerledes fanges raskt opp av ledelsen
Q32 Her er vi fleksible; prosedyrer kan endres for å møte nye vilkår, og problemer løses
når de oppstår
Q33 Det er lett å få støtte til utvikling av nye ideer
Utadrettet fokus Undervisning (Otward focus Teaching)
Q34 Her er vi ganske innadrettet; man bryr seg ikke om hva som skjer i de andre
undervisningsinstitusjonene*
Q35 Det legges lite vekt på måter å bedre tilbudet til studentene*
Q36 Studentenes behov er ikke ansett som topp prioritet hos oss *
Utadrettet fokus Forskning (Outward focus research)
Q37 Her er man ganske innadrettet; man bryr seg ikke om hva som skjer ved
forskningsfronten*
Q38 Det legges ikke mye vekt på måter å bedre kommunikasjonen med andre
forskningsinstitusjoner *
Q39 Problemstillinger som preger den internasjonale forskningsfronten har ikke topp
prioritet hos oss *
Utadrettet fokus Samfunn (Outward focus Society)
Q40 Her er vi ganske innadrettet; man bryr seg ikke om hva som skjer i samfunnet for
øvrig*
Q41 Her legges det lite vekt på å bedre kommunikasjonen med samfunnet for øvrig*
Q42 Samfunnets behov er ikke ansett som topp prioritet hos oss*

VALIDATING THE NOCM_UH-R 32
Refleksivitet (Reflexivity)
Q43 Måten de ansatte jobber sammen på her endres gjerne hvis det bedrer prestasjonen
Q44 Målsetningene her endres i takt med forandringer i samfunnet
Q45 Man tar seg tid til å evaluere målsetningene her
Klarhet i organisasjonens mål (Clarity of organizational goal)
Q46 Organisasjonens fremtidige retning blir klart og tydelig kommunisert til alle
Q47 Alle som jobber her er bevisste på vår fremtidsplan og retning
Q48 Det finnes en klar oppfatning her angående hvilken retning vi går i
Effektivitet (Efficiency)
Q49 Ting kunne blitt gjort mer effektivt her hvis de ansatte tok seg tid til å tenke seg om*
Q50 Her resulterer dårlig planlegging ofte i at man ikke når sine målsetninger*
Q51 Produktiviteten kunne blitt forbedret her om arbeidet ble bedre organisert og planlagt*
Innsats (Effort)
Q52 Hos oss ønsker de ansatte alltid å prestere så godt de kan
Q53 De ansatte er entusiastiske i forhold til jobben sin
Q54 De ansatte er innstilt på å gjøre en ekstra innsats for å utføre en god jobb
Tilbakemelding på prestasjon (Performance Feedback)
Q55 De ansatte får som regel tilbakemelding i forhold til kvaliteten på det arbeidet de gjør
Q56 De ansatte har ingen anelse om hvorvidt de gjør en god jobb*
Q57 Måten de ansatte gjør jobben sin på blir sjelden evaluert*
Produksjonspress (Pressure to produce)
Q58 Det forventes for mye av de ansatte i løpet av en dag
Q59 Ledelsen krever at de ansatte jobber ekstremt hardt
Q60 De ansatte er under sterkt tidspress for å nå målsetninger
Kvalitet på Forskning (Quality Research)
Q61 Her forsøker vi alltid å oppnå de høyeste kvalitetsstandardene for forskning
Q62 Hos oss blir forskningskvalitet tatt seriøst
Q63 De ansattes oppfatning er at suksess avhenger av høy forskningskvalitet
Kvalitet på undervisning (Quality Teaching)
Q64 Her forsøker vi alltid å oppnå de høyeste kvalitetsstandardene for undervisning
Q65 Hos oss blir undervisningskvalitet tatt seriøst
Q66 De ansattes oppfatning et at suksess avhenger av høy kvalitet på undervisningen

VALIDATING THE NOCM_UH-R 33
Appendix B: NOCM_UH-R questionnaire. Distributed to administrative/technical
employees.
Reversed items are marked with an asterix (*) and were reversed before all analyses were
conducted.
Autonomi (Autonomy)
Q1 Lederne her lar stort sett ansatte ta sine egne beslutninger
Q2 Lederne her har tillit til at man kan ta arbeidsrelaterte beslutninger uten å innhente
tillatelse først
Q3 Lederne her har et strengt regime over måten ting blir gjort på *
Integrasjon mellom administrative/tekniske ansatte (Integration among
administrative/technical employees)
Q4 Det er lite konflikt innad i teknisk/administrativ avdeling (for eksempel mellom
studieavdeling, IT, drift, personal)
Q5 De teknisk/administrativt ansatte er innstilt på å dele informasjon på tvers av
teknisk/administrative enheter (for eksempel mellom studieavdeling, IT, drift ,
personal)
Q6 Det er lite respekt mellom noen av de teknisk/administrative enhetene her (for
eksempel mellom studieavdeling, IT, drift, personal) *
Integrasjon mellom vitenskapelig- og administrativite/tekniske ansatte (Integration
between scientific and administrativ/technical employees)
Q7 Det er lite konflikt mellom administrasjonsavdelingen og forsker/faggruppene her
Q8 De ansatte er innstilt på å dele informasjon på tvers av administrasjonsavdelingen og
de faglige avdelinger her
Q9 Det er lite respekt mellom administrasjonsavdelingen og de faglige avdelingene her*
Involvering (Involvement)
Q10 Her lar lederne de ansatte medvirke i beslutninger som angår dem
Q11 Endringer blir gjort uten å snakke med de involverte *
Q12 De ansatte føler at beslutninger ofte tas uten at de blir hørt*
Støtte fra ledelsen (Supervisory Support )
Q13 Overordnede er dyktige til å forstå de ansattes problemer
Q14 Overordnede hos oss er vennlige og lette å henvende seg til
Q15 Overordnede viser forståelse for sine ansatte
Fokus på trening (Emphasis on Training)
Q16 De ansatte får ikke tilstrekkelig opplæring i nye systemer eller nytt utstyr*
Q17 Her gis det kun et minimum av den opplæringen de ansatte trenger for å gjøre jobben
sin*
Q18 De ansatte får tilstrekkelig opplæring i å bruke nytt utstyr

VALIDATING THE NOCM_UH-R 34
Velferd (Welfare)
Q19 Her blir de ansatte tatt vare på
Q20 Her bryr man seg om de ansatte
Q21 Her prøver man å handle rettferdig overfor sine ansatte
Teamarbeid (Team)
Q22 Arbeidsgruppene her (komiteer, utvalg og råd, prosjektgrupper etc.) preges av god
informasjonsdeling
Q23 Målene for arbeidsgruppene (komiteer, utvalg og råd, prosjektgrupper etc.) er godt
kjent blant alle medlemmene
Q24 Arbeidsgruppene (komiteer, utvalg og råd, prosjektgrupper etc.) er preget av å være
fleksible slik at man kan dele på oppgavene dersom det er behov for dette
Formalisering (Formalisation)
Q25 Hos oss blir det oppfattet som svært viktig å følge reglene
Q26 Hos oss må alt gjøres etter reglene
Q27 Hos oss blir ingen særlig opprørt hvis reglene brytes *
Tradisjon (Tradition)
Q28 Ledelsen foretrekker å holde seg til de etablerte, tradisjonelle måtene å gjøre ting på
Q29 Måten ting gjøres på her har aldri forandret seg særlig mye
Q30 Stolthet og lange tradisjoner er viktig hos oss
Innovasjon og Fleksibilitet (Innovation and Flexibility)
Q31 Behov for å gjøre ting annerledes fanges raskt opp av ledelsen
Q32 Her er vi fleksible; prosedyrer kan endres for å møte nye vilkår, og problemer løses
når de oppstår
Q33 Det er lett å få støtte til utvikling av nye ideer
Utadrettet fokus Undervisning (Otward focus Teaching)
Q34 Her er vi ganske innadrettet; man bryr seg ikke om hva som skjer i de andre
undervisningsinstitusjonene*
Q35 Det legges lite vekt på måter å bedre tilbudet til studentene*
Q36 Studentenes behov er ikke ansett som topp prioritet hos oss *
Utadrettet fokus Forskning (Outward focus research)
Q37 Administrasjonsavdelingen er ganske innadrettet; man bryr seg ikke om hva som skjer
i eksterne forskningsfora *
Q38 I administrasjonsavdelingen legges det ikke mye vekt på måter å bedre
kommunikasjonen med eksterne forskningsmiljøer *
Q39 Problemstillinger som preger den internasjonale forskningsfronten har ikke topp
prioritet hos oss *

VALIDATING THE NOCM_UH-R 35
Utadrettet fokus Samfunn (Outward focus Society)
Q40 Administrasjonsavdelingen er ganske innadrettet; man bryr seg ikke om hva som skjer
i samfunnet for øvrig *
Q41 Administrasjonsavdelingen legger ikke mye vekt på å bedre kommunikasjonen med
samfunnet for øvrig *
Q42 Samfunnets behov er ikke ansett som topp prioritet hos administrasjonsavdelingen *
Refleksivitet (Reflexivity)
Q43 Måten de ansatte jobber sammen på her endres gjerne hvis det bedrer prestasjonen
Q44 Målsetningene her endres i takt med forandringer i samfunnet
Q45 Man tar seg tid til å evaluere målsetningene her
Klarhet i organisasjonens mål (Clarity of organizational goal)
Q46 Organisasjonens fremtidige retning blir klart og tydelig kommunisert til alle
Q47 Alle som jobber her er bevisste på vår fremtidsplan og retning
Q48 Det finnes en klar oppfatning her angående hvilken retning vi går i
Effektivitet (Efficiency)
Q49 Ting kunne blitt gjort mer effektivt her hvis de ansatte tok seg tid til å tenke seg om*
Q50 Her resulterer dårlig planlegging ofte i at man ikke når sine målsetninger*
Q51 Produktiviteten kunne blitt forbedret her om arbeidet ble bedre organisert og planlagt*
Innsats (Effort)
Q52 Hos oss ønsker de ansatte alltid å prestere så godt de kan
Q53 De ansatte er entusiastiske i forhold til jobben sin
Q54 De ansatte er innstilt på å gjøre en ekstra innsats for å utføre en god jobb
Tilbakemelding på prestasjon(Performance Feedback)
Q55 De ansatte får som regel tilbakemelding i forhold til kvaliteten på det arbeidet de gjør
Q56 De ansatte har ingen anelse om hvorvidt de gjør en god jobb*
Q57 Måten de ansatte gjør jobben sin på blir sjelden evaluert*
Produksjonspress (Pressure to produce)
Q58 Det forventes for mye av de ansatte i løpet av en dag
Q59 Ledelsen krever at de ansatte jobber ekstremt hardt
Q60 De ansatte er under sterkt tidspress for å nå målsetninger
Kvalitet på Forskning (Quality Research)
Q61 De teknisk/administrativt ansatte forsøker alltid å støtte forskerne slik at de kan oppnå
de høyeste kvalitetsstandardene for forskning
Q62 I teknisk/administrativ avdeling blir støtte til forskningskvalitet tatt seriøst
Q63 De teknisk/administrative ansattes oppfatning er at suksess avhenger av
teknisk/administrativ støtte for å oppnå forskningskvalitet

VALIDATING THE NOCM_UH-R 36
Kvalitet på undervisning (Quality Teaching)
Q64 De teknisk/administrativt ansatte forsøker alltid å oppnå de høyeste
kvalitetsstandardene for undervisning
Q65 Blant de teknisk/administrativt ansatte blir undervisningskvalitet tatt seriøst
Q66 De teknisk/administrativt ansattes oppfatning er at suksess avhenger av høy kvalitet på
undervisningen
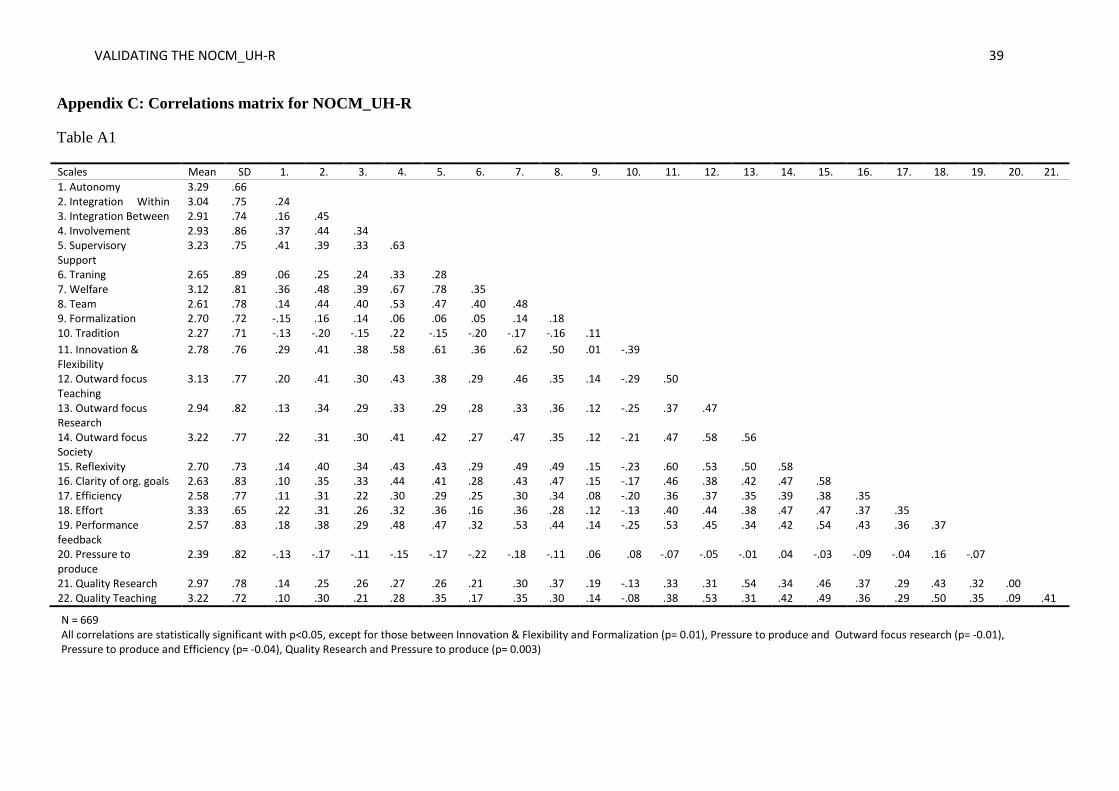
VALIDATING THE NOCM_UH-R 39
Appendix C: Correlations matrix for NOCM_UH-R
Table A1
Scales Mean SD 1. 2. 3. 4. 5. 6. 7. 8. 9. 10. 11. 12. 13. 14. 15. 16. 17. 18. 19. 20. 21.
1. Autonomy 3.29 .66 2. Integration Within 3.04 .75 .24 3. Integration Between 2.91 .74 .16 .45 4. Involvement 2.93 .86 .37 .44 .34 5. Supervisory Support
3.23 .75 .41 .39 .33 .63
6. Traning 2.65 .89 .06 .25 .24 .33 .28 7. Welfare 3.12 .81 .36 .48 .39 .67 .78 .35 8. Team 2.61 .78 .14 .44 .40 .53 .47 .40 .48 9. Formalization 2.70 .72 -.15 .16 .14 .06 .06 .05 .14 .18 10. Tradition 2.27 .71 -.13 -.20 -.15 .22 -.15 -.20 -.17 -.16 .11
11. Innovation & Flexibility
2.78 .76 .29 .41 .38 .58 .61 .36 .62 .50 .01 -.39
12. Outward focus Teaching
3.13 .77 .20 .41 .30 .43 .38 .29 .46 .35 .14 -.29 .50
13. Outward focus Research
2.94 .82 .13 .34 .29 .33 .29 .28 .33 .36 .12 -.25 .37 .47
14. Outward focus Society
3.22 .77 .22 .31 .30 .41 .42 .27 .47 .35 .12 -.21 .47 .58 .56
15. Reflexivity 2.70 .73 .14 .40 .34 .43 .43 .29 .49 .49 .15 -.23 .60 .53 .50 .58 16. Clarity of org. goals 2.63 .83 .10 .35 .33 .44 .41 .28 .43 .47 .15 -.17 .46 .38 .42 .47 .58 17. Efficiency 2.58 .77 .11 .31 .22 .30 .29 .25 .30 .34 .08 -.20 .36 .37 .35 .39 .38 .35 18. Effort 3.33 .65 .22 .31 .26 .32 .36 .16 .36 .28 .12 -.13 .40 .44 .38 .47 .47 .37 .35 19. Performance feedback
2.57 .83 .18 .38 .29 .48 .47 .32 .53 .44 .14 -.25 .53 .45 .34 .42 .54 .43 .36 .37
20. Pressure to produce
2.39 .82 -.13 -.17 -.11 -.15 -.17 -.22 -.18 -.11 .06 .08 -.07 -.05 -.01 .04 -.03 -.09 -.04 .16 -.07
21. Quality Research 2.97 .78 .14 .25 .26 .27 .26 .21 .30 .37 .19 -.13 .33 .31 .54 .34 .46 .37 .29 .43 .32 .00 22. Quality Teaching 3.22 .72 .10 .30 .21 .28 .35 .17 .35 .30 .14 -.08 .38 .53 .31 .42 .49 .36 .29 .50 .35 .09 .41
N = 669 All correlations are statistically significant with p<0.05, except for those between Innovation & Flexibility and Formalization (p= 0.01), Pressure to produce and Outward focus research (p= -0.01),
Pressure to produce and Efficiency (p= -0.04), Quality Research and Pressure to produce (p= 0.003)

VALIDATING THE NOCM_UH-R 40 39
Appendix D. Standard regression weights for scales and items in the NOCM_UH-R
Table A2
HR= Human Relations model, IP= Internal Process model, OS= Open Systems model, RG=
Rational Goal model
CVF
quadrant
Dimension Item Estimate Item Estimate Item Estimate
HR Autonomy Q1 0.686 Q2 0.818 Q3 0.527
HR Integration Within Q4 0.578 Q5 0.723 Q6 0.694
HR Integration Between Q7 0.549 Q8 0.734 Q9 0.625
HR Involvement Q10 0.771 Q11 0.817 Q12 0.813
HR Supervisory support Q13 0.818 Q14 0.785 Q15 0.888
HR Training Q16 0.867 Q17 0.828 Q18 0.770
HR Welfare Q19 0.890 Q20 0.910 Q21 0.807
HR Team Q22 0.834 Q23 0.873 Q24 0.797
IP Formalization Q25 0.843 Q26 0.700 Q27 0.643
IP Tradition Q28 0.770 Q29 0.873 Q30 0.375
OS Innovation & Flexibility Q31 0.808 Q32 0.809 Q33 0.798
OS Outwards focus Teaching Q34 0.548 Q35 0.848 Q36 0.815
OS Outwards focus Research Q37 0.813 Q38 0.807 Q39 0.793
OS Outwards focus Society Q40 0.847 Q41 0.879 Q42 0.825
OS Reflexivity Q43 0.704 Q44 0.760 Q45 0.739
RG Clarity of organizational
goals
Q46 0.796 Q47 0.883 Q48 0.850
RG Efficiency Q49 0.618 Q50 0.872 Q51 0.703
RG Effort Q52 0.803 Q53 0.807 Q54 0.781
RG Performance feedback Q55 0.871 Q56 0.728 Q57 0.629
RG Pressure to produce Q58 0.717 Q59 0.811 Q60 0.770
RG Quality Research Q61 0.888 Q62 0.857 Q63 0.635
RG Quality Teaching Q64 0.853 Q65 0.886 Q66 0.676