an overview and examination of the malaysian service sector
TRANSCRIPT

No. ID-27
OFFICE OF INDUSTRIES WORKING PAPER U.S. INTERNATIONAL TRADE COMMISSION
An Overview and Examination of the Malaysian Service Sector
Lisa Alejandro
Jennifer Baumert Powell Samantha Brady
Isaac Wohl
November 2010
Office of Industries working papers are the result of the ongoing professional research of USITC Staff and are solely meant to represent the opinions and professional research of individual authors. These papers are not meant to represent in any way the views of the U.S. International Trade Commission or any of its individual Commissioners. Working papers are circulated to promote the active exchange of ideas between USITC Staff and recognized experts outside the USITC, and to promote professional development of Office staff by encouraging outside professional critique of staff research.
ADDRESS CORRESPONDENCE TO:
OFFICE OF INDUSTRIES U.S. INTERNATIONAL TRADE COMMISSION
WASHINGTON, DC 20436 USA

An Overview and Examination of the Malaysian Service Sector
Lisa Alejandro, Jennifer Baumert Powell, Samantha Brady, and Isaac Wohl1
U.S. International Trade Commission
ABSTRACT
The service sector is a rapidly growing component of Malaysia’s economy. In 2008, the last year for which data are available, it expanded 7.2 percent to $96.9 billion and employed over half of the country’s workforce. Growth in the Malaysian service sector is largely a product of government policies that promote service industries, including tax benefits and investment, as well as specialization in niche service industries that cater to Islamic consumers. In April 2009, the government eliminated or eased ethnic-Malay equity requirements in 27 service industries in an effort to further increase service industries’ contribution to the Malaysian economy. The growing global competitiveness of Malaysia’s service sector is reflected in steady growth in trade volumes. Malaysia’s cross-border trade in services increased at an average annual rate of 15 percent to $60.6 billion from 2004 through 2008, accounting for 13 percent of total Malaysian cross-border trade and about 1 percent of global services trade in 2008. While the United States maintains a surplus in cross-border services trade with Malaysia;1 its imports from Malaysia in this sector grew faster than the corresponding exports from 2004 through 2008. In 2008, U.S. cross-border services exports to Malaysia totaled $2.0 billion, while services imports from Malaysia totaled $1.3 billion. Intangible intellectual property and tourism services account for the largest shares of U.S. services exports to Malaysia. Quantitative analysis suggests that the existence of nontariff measures continues to inhibit foreign participation in Malaysian service industries. While Malaysia has made significant efforts to liberalize certain service industries, Commission staff analysis indicates that further liberalization could increase Malaysia’s yearly services imports from the rest of the world by as much as $2.6 billion.
1 The invaluable assistance of Monica Reed, Patricia M. Cooper, Cindy Payne, and Joann Peterson is gratefully
acknowledged. Please direct all correspondence to Jennifer Baumert Powell, Office of Industries, U.S. International Trade Commission, 500 E Street, SW, Washington, DC 20436, telephone: 202-205-3450, fax: 202-205-2359, Email: [email protected].
1 U.S. Department of Commerce (USDOC), Bureau of Economic Analysis (BEA), “U.S. International Services: Cross-Border Trade in 2008,” October 2009, 48–59.
2

3
Introduction
The service sector is a large and growing component of Malaysia’s expanding economy, accounting for almost 55 percent of that country’s gross domestic product (GDP)2 and approximately 13 percent of total Malaysian cross-border trade in 2008.3 A significant part of the Malaysian government’s current economic strategy is aimed at improving the competitiveness of the Malaysian service sector, with dedicated programs to encourage domestic and foreign investment in certain service industries and increase these industries’ productivity.4 Malaysia is one of Asia’s key service markets, given its ties with regional partners, including members of the Association of Southeast Asian Nations (ASEAN);5 its significant overall bilateral trade relationship with the United States;6 its status as the site of significant U.S. foreign investment;7 and its ongoing negotiations with the United States in pursuit of a bilateral free trade agreement (FTA).8 This paper is the second in a series of studies that identify and examine important characteristics and trends affecting developing-country markets for services.9 The paper begins with an overview of the Malaysian service sector, including data and analysis on the size and growth of that country’s service sector and a discussion of factors affecting supply and demand in the Malaysian services market. Following the overview, the paper focuses on factors affecting Malaysia’s position in the global service market, Malaysian service trade with the world, and the potential effect of liberalization in the Malaysian service sector. This paper also provides overviews and analyses of three discrete Malaysian service industries which have experienced particularly notable growth or development in recent years, including the banking, healthcare, and logistic services industries.
2 Ibid. The service sector’s value-added reported at constant prices as a percentage of nominal GDP at factor cost.
GDP at factor cost is GDP at market prices, less indirect taxes, plus subsidies. 3 Treasury Malaysia, Economic Report 2009/2010, 2009. 4 Ministry of International Trade and Industry Malaysia, Malaysia: International Trade and Industry Report 2007,
July 2008, 129. These targets for growth are set out in Malaysia’s Third Industrial Master Plan and are coordinated by two councils, the Malaysian Services Development Council and the Malaysia Logistics Council.
5 Economist Intelligence Unit (EIU), Country Profile 2007: Malaysia, 2007, 12. Membership in ASEAN is central to Malaysia’s foreign policy. Additionally, China and ASEAN are currently negotiating the final part of a free trade agreement, which includes an agreement on services, signed in January 2007. In addition to Malaysia, the members of ASEAN include Brunei Darussalam, Cambodia, Indonesia, Laos, Myanmar, the Philippines, Singapore, Thailand and Vietnam.
6 U.S. Department of State, “Background Note: Malaysia,” December 2008. The United States is Malaysia’s largest trading partner.
7 USDOC, The United States Foreign & Commercial Service (USF&CS), and U.S. Department of State, Doing Business in Malaysia: 2008 Country Commercial Guide, February 21, 2008, 2.
8 Ibid., 3. In May 2004, the U.S. and Malaysia signed a trade and investment framework agreement (TIFA), and in June 2006, bilateral negotiations began on a U.S.-Malaysia Free Trade Agreement (FTA). Eight rounds of negotiations were conducted through June 2008.
9 The first study in the series is USITC, An Overview and Examination of the Indian Services Sector, July 2010, http://www.usitc.gov.

Overview of the Malaysian Service Sector
Strong performance in Malaysia’s service sector10 has been the key to recent growth in that country’s economy. According to data reported by Treasury Malaysia, output in Malaysia’s service sector increased by 9.6 percent in 2007 and by 7.2 percent in 2008, surpassing growth in other sectors of the economy and accounting for a significant share of the growth in Malaysia’s total GDP during those respective years—4.5 percent in 2007 and 5.4 percent in 2008.11 Growth in the Malaysian services market was comparable to that posted in other southeast Asian service markets in 2008, including Vietnam and Indonesia (6.1 percent each); the Philippines (3.8 percent); Thailand (2.6 percent); and Singapore (1.1 percent).12
Services industries also account for the largest share of Malaysian employment. Employment in the Malaysian service sector grew at an average annual rate of 3.5 percent between 2004 and 2008, reaching 6.0 million workers, or 52 percent of total employment in 2008.13 By comparison, total employment in Malaysia grew at an average annual rate of 2.6 percent during this period, reaching 11.6 million workers in 2008.14
According to Treasury Malaysia, large private industries within the Malaysian service sector include wholesale and retail trade services and finance and insurance services, which respectively accounted for 24 percent and 21 percent of Malaysian service GDP in 2008 (figure 1).15 In that year, the fastest-growing service industries were government services and the wholesale and retail trade industry, which grew by 11.1 percent and 9.8 percent, respectively.16 Malaysia’s tourism industry—which includes restaurant and accommodation services, among other activities—also experienced significant growth in recent years, partly due to government efforts to support this industry through the hosting of sports events and international conventions.17
10 EIU, Country Profile 2007: Malaysia, 2007, 31; Treasury Malaysia, Economic Report 2009/2010. The Malaysian
service sector is divided into intermediate, final, and government services. Intermediate services include transport and storage; communication; finance and insurance; and real estate and business services. Final services consist of utilities; wholesale and retail trade; hotels and restaurants; and other services, which comprise community, social, and personal services, as well as imputed rent of owner-occupied dwellings. Government services are recorded separately.
11 Treasury Malaysia, Economic Report 2008/2009, 2008,Table 3.1; Treasury Malaysia, Economic Report 2009/2010, 2009. Malaysian total GDP is reported as sectoral GDP for the agriculture, mining, manufacturing, construction, and services sectors of the Malaysian economy, less undistributed financial intermediate services indirectly measured (FISIM), plus import duties.
12 World Bank, “World Development Indicators (WDI) Online Database,” (various dates). Data on services value added for the world are given in constant 2000 dollars, and are only available through 2005. Growth in other regional countries’ services markets is expressed by percentage increase in services value added in 2008.
13 Treasury Malaysia, Economic Report 2009/2010, 2009. 14 Treasury Malaysia, Economic Report 2008/2009, 2008, Table 6.1, and Treasury Malaysia, Economic Report
2009/2010, 2009, Table 2.2. 15 Government services— services consumed by the Malaysian government—accounted for 13.4 percent of
Malaysian GDP during that same year. Treasury Malaysia does not define “government services”; however, it is indicated that growth in this sector reflects increased public services spending. Treasury Malaysia, Economic Report 2009/2010, 2009.
16 Treasury Malaysia, Economic Report 2009/2010, Table 2.3, 2008. 17 EIU, Country Profile 2008: Malaysia, 2008, 24.
4

5
Accommodation and restaurants 4%
Utilities 5%
Transport and storage 7%
Communications 7%
Property & business services 9%
Government services 13%
Other services 10%
Finance & insurance 21% Wholesale and retail
trade 24%
FIGURE 1 Malaysia: Service sectors as a percentage of GDP, 2008
Source: Treasury Malaysia, Economic Reports 2009/2010 , 2010, table 2.3.
Note: Values are estimated.
Total service sector GDP = $96.9 billion
Government policies, including past and present bumiputra, or ethnic Malay, preferences,18 have produced a service sector that is characterized by a large number of small and medium-sized enterprises (SMEs).19 Malaysia’s most recent SME Annual Report indicated that over 99 percent of all Malaysian companies were SMEs, and 474,706 (or almost 87 percent) of Malaysia’s SMEs were service sector enterprises.20 The Malaysian government encourages lending to SMEs with the aim of boosting domestic investment and growth and reducing dependence on large companies.21 One financial assistance program gives grants to service sector SMEs for expenses such as start-up costs, certification and quality management systems, and advertising and promotion. A firm must be at least 60 percent Malaysian owned in order to qualify for this grant.22 In 2008, the Malaysian government also began taking measures designed to help SMEs specifically or, in some cases, all Malaysian businesses, weather the global economic downturn.23 A recent survey indicated that 73 percent of service sector SMEs
18 In April 2009, the Malaysian government abolished the rule that bumiputras must own no less than 30 percent of
equity in 27 service industries. 19 SMEs in most Malaysian service sectors either have no more than 50 full-time employees or have annual sales
turnover of no more than 5 million ringgits ($1.6 million). However, SMEs in manufacturing-related services, manufacturing, and agricultural based industries have either less than 150 full-time employees or less than 25 million ringgits ($8 million) in annual sales turnover. (1 ringgit = 0.3224 U.S. dollars on September 20, 2010). Small- and Medium-Industries Development Corporation, “Definition of SMEs by Size,” 2008.
20 Small- and Medium-Industries Development Corporation, “SME Annual Report,” 2008, 54. 21 EIU, Country Profile 2007: Malaysia, 2007, 30. 22 Small- and Medium-Industries Development Corporation, “SME Information & Advisory Centre,” 2008. 23 Small- and Medium-Industries Development Corporation, “SME Annual Report,” 2008, 37.

were affected by the downturn, with some firms in the retail/food and beverage and construction segments reporting that the downturn had a severe effect on their business.24
Demand
Government policies have helped support the demand for services in Malaysia. Under the Ninth Malaysia Plan,25 the Malaysian government has increased its investment in physical infrastructure, with particular emphasis on expanding its transport and container port infrastructure. Through this effort, Malaysia has sought to become a regional hub for air transport and the preferred transshipment point for the Southeast Asian region.26 These policies will likely increase demand for construction, engineering, financial, airport, travel and tourism services, and other services related to the development and operation of transport infrastructure. The Malaysian government also aims to promote manufacturing-related services such as research and development (R&D), product design, and central utility supply and cold chain storage for the food processing industry.27 The government hopes that these initiatives will help lengthen the country’s value chain and thus increase demand for Malaysian goods and services. Growth in disposable incomes and spending power in Asia may also increase demand for services in Malaysia, particularly in industries related to tourism such as retailing, hotels, and restaurants. Particularly rapid growth in exports of Malaysian tourism services to neighboring Asian economies28 are attributed to recent increases in personal disposable income in these countries.29
Supply
Several factors affect services provision in Malaysia; two major factors are government intervention and the composition of the Malaysian workforce. The supply of services is encouraged by Malaysian government policies promoting service sector investment, including tax incentives and policies liberalizing foreign equity participation and the entry of foreign employees.30 Malaysia’s Third Industrial Master Plan (IMP3), which covers the period 2006–20, contains provisions intended to position Malaysia as a regional center for selected service industries, especially real estate, transport,
24 Ibid., 31. 25 EIU, Country Profile 2007: Malaysia, 2007, 22, and Economic Planning Unit, Prime Minister’s Department,
Ninth Malaysia Plan, 2006. The Ninth Malaysia Plan is the Malaysian government’s current five-year economic plan, which extends until the end of 2010.
26 Ibid., 18. 27 Malaysian Industrial Development Authority (MIDA), “Promotion of Services in Malaysia,” n.d. 28 U.N. World Tourism Organization (UNWTO), Yearbook of Tourism Statistics, 2006 and 2008. Brunei registered
the fastest average annual growth in tourist arrivals to Malaysia (32 percent) from 2002 through 2006, followed by the South Korea (31 percent), the Philippines (18 percent), Thailand (13 percent), Indonesia (12 percent), and India (11 percent). By comparison, from 2002 through 2006, the average annual growth of overall tourist arrivals to Malaysia was 7 percent. The only other countries achieving above-average annual growth in tourist arrivals to Malaysia were Australia and the United States, registering 9 percent and 8 percent growth, respectively.
29 EIU, “EIU Data Tool” (accessed July 7, 2009). During 2002–06, personal disposable income in the South Korea rose 18.8 percent, and in Indonesia and India, 13.6 percent each. At the same time, in the Philippines, personal disposable income rose an estimated 6.1 percent, and in Thailand, an estimated 4.2 percent.
30 Malaysian Industrial Development Authority (MIDA), “Promotion of Services in Malaysia,” n.d.. These incentive schemes apply to services such as business support services for international procurement centers, regional distribution centers, and operational headquarters; research and development (R&D) services; industrial training, including technical and vocational training; and environmental management services.
6
7
telecommunications, information technology, and accommodations and tourism.31 In 2007, domestic and foreign service sector investments totaled approximately $15 billion,32 far surpassing the IMP3’s annual investment target of $13.3 billion.33 The Malaysian government also seeks to grow certain niche industry segments—specifically, Islamic banking, halal34 food logistics, conference services, and medical tourism—in which the country has a competitive advantage due to its geographic location and culturally diverse population. However, service supply in Malaysia has been hindered by persistent labor shortages throughout the past 10 years. As a result, a significant portion of the Malaysian workforce comes from foreign countries, particularly from Indonesia. An estimated 1.8 million legal and 500,000 illegal foreign workers were employed in Malaysia in 2006,35 which is significant considering that Malaysia’s economy employs slightly more than 11 million people.36 These foreign workers are an integral part of the Malaysian economy, making up most of the construction, plantation, manufacturing, and household labor forces in the country. At the same time, Malaysia is experiencing the emigration of its skilled workers, with English-speaking workers being in particularly high demand in India, China, the Middle East, and the United States. Such emigration may undermine Malaysia's efforts to develop its service sector and become a regional and world hub for services.37 Until recently, another factor that likely impeded the supply of services in Malaysia was a government commitment to improve the economic status of the ethnic Malay majority, known as the bumiputra.38 Bumiputra policy was intended to rebalance the social and economic status of ethnic Malays. In 1997, Malaysia exempted its manufacturing industries from bumiputra preferences. As a result, the service sector was seen as a particularly important market segment for the continued economic and social advancement of the bumiputra in Malaysia, and service liberalization that would affect bumiputra preferences was politically sensitive.39 Under these preferences, the government required that both foreign and domestic firms in the service sector take on bumiputra partners and have at least 30 percent bumiputra equity.40 These equity requirements existed for firms in the financial, business and professional, telecommunications, express delivery, and energy distribution industries,41 among others,
31 Target industries, as identified by MIDA, are real estate, transport, energy, telecommunications, distributive
trade, hotel and tourism, financial services, and health services. Malaysian Industrial Development Authority (MIDA),“Services Sector Overview.” n.d.
32 Ministry of International Trade and Industry Malaysia, Malaysia: International Trade and Industry Report 2008, 47.
33 Value converted from ringgits to dollars by USITC staff using the December 31, 2008, interbank rate of RM1 = US$ 0.3336.
34 Halal and haram—words that respectively mean “permitted” and “prohibited” in Arabic—are used to refer to all aspects of Islamic life. Halal foods include all foods that are not haram, such as pork, animals slaughtered in a certain manner, blood and its by-products, alcohol, and items that have been contaminated by haram products, among others. Islamic Foods and Nutrition Council of America, “Frequently Asked Questions: What Is Halal?” n.d..
35 EIU, Country Profile 2007: Malaysia, 2007, 24. 36 Treasury Malaysia, Economic Report 2007/2008, 2007, Table 3.22. 37 Ministry of International Trade and Industry Malaysia, telephone interview by USITC staff, August 8, 2008. 38 EIU, Country Report: Malaysia, May 2008, 4; USF&CS and U.S. Department of State, Doing Business in
Malaysia: 2008 Country Commercial Guide, February 21, 2008, 3. 39 Ministry of International Trade and Industry Malaysia, telephone interview by USITC staff, August 8, 2008. 40 USF&CS and U.S. Department of State, Doing Business in Malaysia: 2008 Country Commercial Guide,
February 21, 2008, 50. 41 USF&CS and U.S. Department of State, Doing Business in Malaysia: 2008 Country Commercial Guide,
February 21, 2008, 2–3; Hashim, “Bumi Preferences Pose a Hurdle in U.S.-Malaysia FTA Talks,” January 13, 2007.

and exceptions to the policy were decided case-by-case.42 In part as a result of these policies, bumiputra participation in the Malaysian service sector is particularly significant in professional services. In 2006, bumiputra accounted for 46,589 (39.6 percent) of 117,652 registered Malaysian professionals, including, for example, 25,748 engineers, 5,700 doctors, and 5,002 lawyers.43 In April 2009, the government eliminated or eased bumiputra equity requirements in 27 service industries, including healthcare, transportation, and tourism, among others.44 This was done in an effort to further increase services industries’ contribution to the overall Malaysian economy, in part by loosening the conditions of foreign investment.45 Among remaining restrictions, those on financial services are the most significant.
42 Ministry of International Trade and Industry Malaysia, telephone interview by USITC staff, August 8, 2008. 43 Department of Statistics Malaysia, “Number and Percentage of Registered Professionals by Ethnic Group, 2006.” 44 EIU, Country Commerce: Malaysia, June 2009. 45 EIU, Country Report: Malaysia, June 2009.
8

9
Participation in the Global Services Market
Malaysian Services Trade with the World
Malaysian services trade has registered steady growth in recent years. In 2008, Malaysia’s services exports and imports totaled $30.3 billion each, accounting for approximately 13 percent of total Malaysian cross-border trade volume. From 2004 through 2008, growth in exports outpaced growth in imports in the sector, 15 percent to 12 percent. Moreover, total Malaysian cross-border services trade (15 percent) grew slightly faster than global services trade (14 percent) from 2004 through 2008. Malaysian cross-border services trade comprises about 1 percent of global services trade. International Monetary Fund (IMF) data on services trade indicate that travel46 accounted for over 50 percent of Malaysian services exports in 2008 (figure 2). The Malaysian travel sector is globally competitive, in part due to government programs such as the Ninth Malaysia Plan and the Third Industrial Master Plan, as discussed above. In 2008, travel was followed by other business services47 and passenger air transport, which accounted for over 13 percent and 11 percent of total service exports, respectively.48 Malaysian exports of air passenger transport services rose relatively quickly from 2004 through 2008, increasing at an average annual rate of 35 percent.
46 The IMF defines “travel” to include goods and services purchased in a certain market by travelers that are
visiting that market for a period of not more than one year. “Travel” does not however include the international transport of passengers, which is captured in IMF statistics on passenger transport. IMF, Balance of Payments Manual, 1993, 64.
47 Other business services include research and development (R&D) services, legal services, accounting, management consulting, public relations services, advertising, market research, public opinion polling, architecture, engineering, environmental remediation, agricultural, mining, leasing, and trade-related services. IMF, “Balance of Payments and International Investment Position Manual, Sixth Edition (BPM6),” December 2008, 263—66.
48 Malaysia does not report any exports of passenger transport services other than those provided by air transport.

Passenger air transport 11%
Other business services 13%
Travel 51%
Communication services 2%
Personal, cultural, & recreational services
3%Construction services 4%Sea freight transport
6%
Other transportation 3%
Computer & info services
3%
Othera 2%
FIGURE 2 Malaysia: Services exports, 2008
Source: International Monetary Fund, Balance of Payments, 2010.
a"Other" includes insurance services ($371 million), government services not included elsewhere ($38 million), financial services ($87 million), and royalties and license fees ($199 million).
Total = $30.3 billion
In 2008, sea freight transport accounted for the largest share (32 percent) of total Malaysian services imports (figure 3).49 From 2004 to 2008, computer and information services registered particularly rapid average annual growth (29 percent), followed by construction services (28 percent), and travel services (21 percent) industries.50
49 Ibid. 50 Ibid.
10

11
Travel 22%
Sea freight transport 32%
Other business services 18%
Other transportation 3%
Personal, cultural, & recreational services
4%Passenger air transport 3%
Construction services 3%
Communication services 3%
Royalities & license fees 4%
Insurance services 2%
Othera 4%
FIGURE 3 Malaysia: Services imports, 2008
Source: International Monetary Fund, Balance of Payments, 2010.
aOther services include computer & information services, government services not included elsewhere,
and financial services.
Total = $30.3 billion
U.S.-Malaysia Services Trade
U.S. Department of Commerce (USDOC) Bureau of Economic Analysis (BEA) data indicate that the United States maintains a surplus in cross-border services trade with Malaysia.51 In 2008, U.S. cross-border services exports to Malaysia totaled $2.0 billion, while services imports from Malaysia totaled $1.3 billion. However, U.S. imports grew more quickly than exports from 2004 through 2008, with imports increasing at an average annual rate of 20 percent, while exports grew at a rate of 13 percent. According to data reported by BEA, the largest component of U.S. services exports to Malaysia is intangible intellectual property, which accounted for $247 million, or 13 percent, of service exports in 2008 (figure 4). Exports of intangible intellectual property generate royalties and license fees. The majority (56 percent) of royalty and license fees exports reflect trade with unaffiliated firms, while the remainder reflects trade between U.S. parent firms and their Malaysian affiliates. General-use computer software accounted for the largest share (39 percent) of royalties and license fees collected from Malaysia, followed by license fees for industrial processes (24 percent). The second-largest component of U.S. cross-border services exports to Malaysia is tourism services, which made up 10 percent of the total in 2008.
51 USDOC, BEA, “U.S. International Services: Cross-Border Trade in 2008,” October 2009, 48–59.

Royalties & licenses fees 13%
Ocean freight 2%
Airport services 4%Ocean port 3%
Telecommunications 2%
Audiovisual services 1%
Management, consulting, & public
relations 4%
Insurance 1%
Other 32%
Air freight 5%
Installation, maintenance, & repair
7%
Education 7%
Financial services 9%Tourism 10%
FIGURE 4 Malaysia: U.S. cross-border exports of private services to Malaysia, 2008
Source: USDOC, BEA, Survey of Current Business 89, no. 10, 48–59.
a"Other" includes R&D and testing services; advertising; computer and information services; legal services and operational leasing; architecture, engineering, and construction services; and other services not included elsewhere.
Total = $2.0 billion
a
By a large margin, research and development services were the largest component of U.S. services imports from Malaysia, accounting for $300 million, or 24 percent of total U.S. services imports from Malaysia in 2008 (figure 5). Next in importance were tourism services, which accounted for 11 percent of U.S. services imports from Malaysia in 2008. While data on affiliate transactions between the United States and Malaysia are very limited, such transactions seem to have risen substantially during the past decade. In 2007, the most recent year for which data are available,52 services supplied to Malaysians by U.S.-owned affiliates totaled $3.7 billion. The 2006–07 increase of 31 percent was 10 percent more than the average growth rate for the 2004–07 period. Services supplied to U.S. persons from Malaysian-owned affiliates totaled $422 million, an increase of 16 percent from the previous year.53
52 Data on affiliate transactions lag those on cross-border services trade by one year. Analyses of cross-border trade
data compare performance in 2008 to trends from 2003 through 2007. Similarly, analyses of affiliate sales compare performance in 2007, the most recent year for which affiliate sales data are available, to trends from 2004 through 2006. In 2008, BEA changed the method of reporting affiliate trade data. New affiliate data report “services supplied,” which better reflect services output than the prior measure “sales of services.” Data for years prior to 2004 do not reflect this change, but report sales of services. For more information, see USDOC, BEA, Survey of Current Business 89, no. 10, 34–36.
53 Data are suppressed for years prior to 2006.
12

13
Tourism 11%
R&D 24%
Management, consulting, & public
relations 7%
Othera 41%
Ocean port services 1%
Passenger fares 6%
Airport services 2%
Telecommunications 2%
Financial services 3%
Computer & information services
4%
Installation, maintenance, & repair
of equipment 2%
FIGURE 5 Malaysia: U.S. cross-border imports of private services from Malaysia, 2008
Source: USDOC, BEA, Survey of Current Business 89, no. 10, 48–59.
a"Other" includes royalties and license fees; education; advertising; legal services; insurance services; air freight services; operational leasing; construction, architectural and engineering services; and other services not included elsewhere.
Total = $1.3 billion
Barriers to Foreign Participation in the Malaysian Services Sector
Under the World Trade Organization (WTO) General Agreement on Trade in Services (GATS), Malaysia scheduled a certain number of commitments on the foreign provision of services, but retained a large degree of freedom to restrict services trade pursuant to development goals. For instance, it made no commitments to grant foreigners licenses in banking, insurance, or telecommunications or to permit foreigners to provide education, environmental, or distribution services through commercial presence (mode 3).54 Malaysia also restricted aggregate foreign equity and holdings in any Malaysian corporation to 30 percent and further stipulated that bumiputras must control 30 percent of all firms in certain subsectors. Malaysia’s most recent publicly available services offer, dated December 2005, retains these ownership limitations.
54 The GATS identifies four modes of supply through which services are traded. Mode 1 refers to cross-border
trade, in which a service is supplied by an individual or firm in one country to an individual or firm in another country. Mode 2 refers to consumption abroad, in which an individual from one country travels to another country and consumes a service in that country. Mode 3 refers to commercial presence, in which a firm based in one country establishes an affiliate, branch or subsidiary in another country and supplies services from that locally established affiliate, branch or subsidiary. Mode 4 refers to the temporary presence of natural persons, in which an individual service supplier from one country travels to another country on a short-term basis to supply a service there.

Since 2005, however, Malaysia has adopted policies under its Ninth Master Plan (2006-2010) to further open its services sector to foreign investment. As noted, in April 2009, the Malaysian government removed bumiputra equity requirements in 27 service sectors, including healthcare and transportation services. In addition, the government eased foreign investment restrictions in financial services (see section on banking), and established new agencies to facilitate the approval of applications for foreign investment in the services sector.55 Malaysia hopes that strengthening its domestic service suppliers through foreign investment will better prepare them to compete on a global scale, enabling the country to improve its services commitments under the GATS.56
Services Liberalization through ASEAN
Though a signatory to the GATS and several existing or potential FTAs, Malaysia has principally liberalized its services trade through ASEAN. Along with other ASEAN members, Malaysia aims to establish an ASEAN Economic Community by 2020. To achieve this goal, member countries have been liberalizing service markets beyond their GATS commitments, which largely codified existing barriers. These efforts stem from the 1995 ASEAN Framework Agreement on Services, which brought about three rounds of service negotiations and four sets of commitments through a “Minus X” formula that enables two or more ASEAN countries to proceed with service sector liberalization without extending concessions to nonparticipating countries.57 These liberalization packages have covered construction, telecommunications, business services, financial services, air and maritime transport, and tourism, providing member countries with preferential access in the employment of professionals and the establishment of commercial affiliates.58 Member countries have also been negotiating a Strategic Plan of Customs Development, as well as mutual recognition arrangements for qualifications in professional services. Malaysian services liberalization under ASEAN includes member-countries’ exemption from its local-content requirements on advertising services.59
Potential Effects of Additional Liberalization
The Commission staff has performed econometric analysis using gravity models to evaluate the potential effects of further liberalization on Malaysia’s cross-border imports of services. Gravity models examine the relationship between certain variables—such as economic size, distance, and other potential sources of “trade resistance”60—and the volume of trade between two countries. Tinbergen developed the basic gravity model nearly 50 years ago,61 and an extensive literature of gravity model-based studies has emerged in the decades since. While gravity models have been used to analyze trade in goods far more often than trade in services, authors such as Grünfeld and Moxnes62 and Kimura and Lee63 have demonstrated their usefulness for analyzing services trade.
55 WTO, “Trade Policy Review Report by the Secretariat, Malaysia,” December 14, 2009, 56. 56 Cheen, “Malaysia: Strategies for the Liberalization of the Services Sector,”, n.d; and WTO, “Trade Policy
Review Report by the Secretariat: Malaysia,” December 14, 2009, 57. 57 Yong, “Towards a Free Flow of Services in ASEAN,” July 5, 2005. 58 WTO, “Trade Policy Review Report by the Secretariat: Malaysia Revision,” March 9, 2006, 26. 59 Rasiah, “Trade-Related Investment Liberalization under the WTO,” December 2005, 453–71. 60 Helpman, Melitz, and Rubinstein, “Estimating Trade Flows,” February 2007, 1. 61 Tinbergen, “Shaping the World Economy,” 1962. 62 Grünfeld and Moxnes, “The Intangible Globalization,” 2003. 63 Kimura and Lee, “The Gravity Equation in International Trade in Services,” April 2006.
14

15
The starting point for our models is the “standard”64 gravity equation:
lnIMij = β1 + β2 lnYi + β3 lnYj + β4ln Dij +εij
where IMij is country i’s imports from country j; Yi and Yj are the GDP of country i and j, respectively; 65 Dij is the distance from country i to country j; and εij is the error term. The log-log specification makes it easier to analyze the elasticity of trade volumes with respect to the trading partners’ GDP and the distance between them. Gravity studies have sought to account for a variety of additional factors influencing the volume of trade. Following Kimura and Lee, we include dummy variables for adjacency and common language.66 The adjacency variable traditionally controls for country pairs that share a border; we extend this to include country pairs facing each other across a small sea. The intuition is that direct neighbors should trade more because they face lower transaction costs. The common-language variable captures the idea that countries that share a language—and the broader cultural affinities associated with the use of that language—may face lower costs to trade. Nontariff measures (NTMs) may also affect flows of trade in services (unlike goods, services are virtually never subject to tariffs). Grünfeld and Moxnes, Kimura and Lee, and Walsh67 use a variety of measures in their models in order to capture the effects of NTMs on services trade. 68 We use a new measure: an index of restrictions on inward FDI in services developed by Golub.69 Measures of FDI restrictions are useful proxies for barriers to cross-border trade in services because empirical analyses strongly suggest that in the case of services, FDI facilitates trade, while restrictions on FDI inhibit trade.70 For example, Fillat-Castejón, Francois, and Wörz examine the extent to which FDI inflows and cross-border imports of services are complements or substitutes. They find strong evidence of a complementary effect of FDI on services imports, in both the short and the long run. Furthermore, they find that barriers to foreign ownership (i.e., FDI) have a significant, negative effect on cross-border imports of services.71 These findings buttress those of Grünfeld and Moxnes, who create gravity models that use service exports and the stock of outward FDI in services as dependent variables. They test for complementarity by regressing the
64 Grünfeld and Moxnes, “The Intangible Globalization,” 2003, 7. 65 Some models use only the share of GDP accounted for by the sector being studied. We ran an alternative model
using the service sector’s share of GDP instead of overall GDP, and found similar results, but with a smaller effect on the variable that measures restrictiveness on foreign direct investment (FDI) in the services sector (SFDIR). We use overall GDP to reflect the fact that traded services are often intermediate inputs in the production of goods as well as services.
66 Kimura and Lee, “The Gravity Equation in International Trade in Services,” 2006, 95. 67 Walsh, “Trade in Services,” October 2006. 68 Grünfeld and Moxnes use Trade Restrictiveness Indexes (TRIs) for six service industries developed by the
Australian Productivity Commission (APC). Kimura and Lee use the Economic Freedom of the World Index developed by the Fraser Institute. Walsh uses the Heritage Foundation’s Index of Economic Freedom, measures of government effectiveness developed by Kaufman et al. of the World Bank, the APC TRIs, and measures based on GATS commitments developed by Hoekman (1995). Walsh runs sector-specific regressions as well as ones for all services trade.
69 Golub, “Openness to Foreign Direct Investment in Services,” 2009. 70 The literature examining the relationship between FDI and cross-border trade is more extensive for trade in goods
than for trade in services. Some of these studies point to substitutive effects as well. See, for example, Blonigen, “In Search of Substitution between Foreign Production and Exports,” February 2001, and Helpman et al., “Export versus FDI,” January 2003.
71 Fillat-Castejón, Francois, and Wörz, “Cross-Border Trade and FDI in Services,” February 2009, 10; 17; 20–21.

residuals from the FDI model on the residuals from the exports model, and find a positive and highly significant relationship, meaning that services exports and investment move in tandem.72 Golub’s index has a number of advantages over alternative indices: it is specific to services; it measures “applied” barriers (as opposed to those “bound” in WTO commitments); and it covers more countries (73) and industries (eight) than other measures of applied services NTMs. Golub scores the countries on a scale of 0 (least restrictive) to 1 (most restrictive), accounting for regulations on foreign ownership and screening and approval rules, as well as operational restrictions for the period 2004–05 (table 1). He assesses barriers in eight industries: business services, telecommunications, construction, distribution, electricity, financial services, tourism, and travel. Golub uses an average of FDI and trade weights to generate an index score for overall restrictions on services FDI for each country.
Table 1: FDI Restriction Scoring Method Foreign Ownership
No foreign equity allowed 1 1–19% foreign equity allowed 0.6 20–34% foreign equity allowed 0.5 35–49% foreign equity allowed 0.4 50–74% foreign equity allowed 0.2 75–99% foreign equity allowed 0.1
Screening and approval
Investor must show economic benefits 0.2 Approval unless contrary to national interest
0.1
Notification (pre- or post-establishment) 0.05 Operational Restrictions
Board of directors/managers majority must be nationals or residents
0.1
at least one must be national or resident
0.05
Duration of work permit for expatriates less than one year 0.1 one to two years 0.05 three to four years 0.025
Other operational restrictions up to 0.1 Total (capped at 1.0) Between 0 and 1 Source: Golub, “Openness to Foreign Direct Investment in Services,” 2009.
Our model also includes a remoteness variable to control for the effects of “relative distance”; countries that are close to each other but far from the rest of the world can be expected to trade more with each other than the rest of the world. We define remoteness (REM) as
REMi = Σdim/ym
where dim is the distance from country i to all trade partners, and ym is the GDP of the trading partners of country i.73
72 Grünfeld and Moxnes, “The Intangible Globalization,” 2003, 20–21.
16

17
We estimate our model two ways: first, with random effects74 using year dummies from 2000 to 2006, and secondly, with ordinary least squares (OLS) for 2004:
1. lnIMjit = β1 + β2 lnYit + β3 lnYjt + β4 lnDijt + β5 Aij + β6 CLij +β7 SFDIRij +
β8lnREMit+ β9lnREMjt+ β10Y01+ β11Y02+ β12Y03+ β13Y04+ β14Y05+ β15Y06+εij
2. lnIMji = β1 + β2 lnYi + β3 lnYj + β4 lnDij + β5 Aij + β6 CLij +β7 SFDIRij +
β8lnREMi+ β9lnREMj +εij
where Aij and CLij are adjacency and common language dummies; SFDIRij is the overall services FDI restrictiveness index; REM is remoteness of country i and country j, respectively; and Y01– Y06 are year dummies in the random effects model.75 We use 2004 data for the OLS model because it is one of the two years for which the SFDIR data were collected. The bilateral service imports data are taken from the Organisation for Economic Co-operation and Development’s (OECD) Statistics on International Trade in Services, which contains 26 of the 31 OECD countries and Russia as exporters, along with 70 importing countries.76 The World Bank’s World Development Indicators (WDI) is the source for GDP, measured in 2000 constant U.S. dollars. Distance, adjacency, and common language are calculated by the Centre d’Etudes Prospectives et d’Informations Internationales.
Results
The services FDI restrictiveness index is right skewed, meaning that most countries in the dataset are relatively open (appendix A, tables A.1 and A.2). The most restrictive score is only 67 percent of the maximum possible. The 2004 data are very similar overall to the panel data. The variables are highly correlated in a few instances, but not so broadly as to undermine the model (tables A.3 and A.4).
73 The remoteness variable has been calculated similarly in a number of previous studies. Often, the
distance between i and bilateral trading partner j is excluded in the summation of all trading partners, m. Doing so would introduce only a slight change in the values of our remoteness variable due to the number of observations in our model. Anderson and Van Wincoop argue that remoteness has little explanatory power and should be replaced by a broader measure (“multilateral resistance”) that accounts for the full range of differences in relative trade costs (Anderson and Van Wincoop, “Gravity with Gravitas,” March 2003, 5–6). Baier and Bergstrand simplify this measurement using a Taylor-series expansion (Baier and Bergstrand, “Bonus Vetus OLS,” 2009, 78–80). Both models require the strong assumption that trade costs are symmetric; that is, the cost of exporting from country i to j is approximately equivalent to the cost of exporting from country j to i. Even if the assumption does not hold for every pair of trading partners, the use of data that include bilateral trade flows can balance out the effects of any asymmetries. However, in our dataset, non-OECD countries appear solely as importers, so we do not have bilateral flows for many country pairs. Therefore, we proceed using the more traditional specification of remoteness.
74 A random effects model allows one to estimate coefficients for variables that do not vary over time, such as SFDIR. Fixed effects and first differences, two other common methods for analyzing panel data, do not permit analysis of time-invariant variables. The random effects model requires the assumption that the effects of any unobserved variables are uncorrelated with the independent variables in the model.
75 The year dummies control for factors specific to those years that may have affected trade among all countries. OECD, OECD.Stat Extracts: Trade in Services by Partner Country Database (accessed August 2009).
76 Ibid.

In both specifications, GDP is strongly and positively associated with exports, while distance is strongly and negatively associated with trade, as expected. Remoteness has a positive effect in the panel regression, with increased significance over the OLS model. This result suggests that the random effects model is a more efficient estimator than the OLS model. Adjacency has a slightly positive but insignificant effect. This may be due to the fact that there are very few country pairs in the dataset which are adjacent; it could also suggest that sharing a border is less important for trade in services than trade in goods. The common language variable has a highly positive and significant effect on trade. The adjusted R-squared values for the random effects and OLS model are .737 and .700, respectively, meaning that the model explains about 70 percent of the variation in cross-border imports of services (table 2). The services FDI restrictiveness index has a substantial explanatory effect. The coefficient is approximately –1.3 in both models, and is significant at the 5 percent and 1 percent level for the OLS and random effects model, respectively. The magnitude of the services FDI restrictiveness index indicates that a decrease of 0.01 in a country’s restrictiveness score is associated with a 1.3 percent increase in imports of services into that country.
Potential Effects of Future Liberalization in Malaysia
Malaysia’s services FDI restrictiveness index score is 0.53. Using the random effects model, we can examine the possible effects of further FDI liberalization for Malaysia. If Malaysia reduced FDI restrictions to the mean (0.24), cross-border imports by Malaysia could be expected to increase by approximately 39.8 percent, ceteris paribus.77 If Malaysia liberalized to the minimum restrictiveness (0.04), cross-border imports by Malaysia could be expected to increase by approximately 67.3 percent (table 3). In 2005, Malaysia imported approximately $3.8 billion of services from 21 countries in the model.
77 The model does not capture such variables as more up-to-date policy indicators for Malaysia (i.e., the latest policy information is from 2004-05); economic growth within Malaysia; or the effects on the Malaysian service sector of trade preferences achieved through the implementation of free trade agreements.
18

TABLE 2 Gravity model: Dependent variable – ln (services imports)
Random effects OLS
Service FDI restrictiveness -1.373 ‡ -1.314 †
(-3.85) (-3.41)
ln (importer's GDP) 0.914 ‡ 0.850 ‡
(29.62) (25.73)
ln (exporter's GDP) 1.809 ‡ 0.987 ‡
(16.64) (25.51)
ln (distance) -1.214 ‡ -0.996 ‡
(-16.9) (-12.44)
ln (importer's remoteness) 0.186 † 0.012
(2.03) (0.12)
ln (exporter's remoteness) 0.746 ‡ 0.121
(6.94) (1.43)
Adjacency 0.096 0.272
(0.61) (1.26)
Common language 1.177 ‡ 1.163 ‡
(7.3) (6.84)
Constant -45.664 ‡ -33.396 ‡
(-19.66) (-14.46)
Year01 -0.008
(-0.25)
Year02 0.037
(1.25)
Year03 0.238 ‡
(7.84)
Year04 0.451 ‡
(14.57)
Year05 0.509 ‡
(15.67)
Year06 0.349 ‡
(4.56)
Number of observations 4455 858
Overall/adjusted R-squared 0.737 0.700
‡ 1 percent level of significance † 5 percent level of significance * 10 percent level of significance
19

TABLE 3 Malaysia liberalization results Malaysia
SFDIR Mean
SFDIR Min.
SFDIR Coefficient Liberalized to average Liberalized to minimum
Random effects 0.53 0.24 0.04 -1.37 39.82% 67.28%
OLS 0.53 0.24 0.04 -1.31 38.11% 64.39%
Liberalizing Malaysia’s services FDI restrictiveness index to the mean score would correlate with an increase in imports to approximately $5.3 billion, and liberalization to the minimum score would correlate with an increase in imports to $6.4 billion.
Sector Industry Profiles
Banking
Overview
Financial services play a significant and increasing role in the Malaysian economy. In 2007, financial services accounted for 16 percent of Malaysia’s gross national product, making it the largest contributor among the service industries.78 Assets in the banking system—including commercial banks, merchant banks, and finance companies—totaled approximately $420 billion in March 2010, a 76 percent increase over 2005 levels.79 In 2009, employment in the finance, insurance, real estate, and business services industries80 was estimated at 814,100, accounting for 7 percent of overall employment. This figure reflects a 11 percent increase over 2005 levels.81
Government Policies and Sector Reform
Under the Financial Sector Master Plan (Plan), which began implementation in 2001, the Malaysian government has placed a strong emphasis on banking consolidation and reform. The Plan, which guides Malaysian banks through 2010, was designed to strengthen domestic financial institutions in order to increase the financial sector’s contribution to economic growth and to prepare domestic firms for increased competition from foreign banks.82 In phase I, the Plan concentrated on consolidating the domestic market through mergers and acquisitions. Phase II was designed to lift restrictions on incumbent foreign banks in order to promote competition. During phase III, the government plans to consider opening the market to new foreign firms.83 The consolidation in phase I was undertaken swiftly, but it is unclear when the provisions outlined in the subsequent phases will be implemented.
78 This figure includes banking, securities, and insurance services, though the latter are not covered in this report.
Ministry of International Trade and Industry Malaysia, Malaysia: International Trade and Industry Report 2007, July 2008, 129.
79 Bank Negara Malaysia, Monthly Statistical Bulletin, March 31, 2010. 80 Official employment statistics of the Government of Malaysia do not disaggregate these sectors. 81 Treasury Malaysia, Economic Report 2009/2010, November 2009. 82 Bank Negara Malaysia, “The Financial Sector Masterplan,” 2001. 83 Ibid.
20

21
Another stated objective of the Plan is to fashion Malaysia into a global hub for Islamic banking. Such banks offer specially designed products that comply with Islamic—or Sharia—law, which prohibits charging interest. The Plan aims for Islamic banking assets to account for 20 percent of total banking assets by 2010, and the government has offered incentives intended to advance the Islamic finance segment of the financial service industry.84 This aggressive approach to developing Islamic banking has led to increases in both the supply of and demand for such services. By the end of September 2009, Islamic banking assets accounted for 16 percent of total banking sector assets, with deposits to Islamic banks growing by 20 percent over the previous year and financing increasing by 8522 percent.
Malaysia’s solid economic growth in recent years has led to rising incomes among individuals and businesses, creating a need for safer and more sophisticated financial services. The Malaysian government has sought to boost public confidence in its financial sector by introducing new consumer protection measures that encourage Malaysians to entrust their money to the formal financial service industry. Most significantly, in 2005, the Malaysia Deposit Insurance Corporation was established to insure deposits up to RM60,000 (approximately $18,575).86
Malaysia’s domestic banking firms are well protected from foreign competition by government regulations specifically designed to this end. New foreign firms are limited to a 49 percent equity stake in investment banks and a 30 percent stake in commercial banks.87 Foreign banks operating in Malaysia must be locally incorporated and maintain all-Malaysian boards of directors. All banks are required to conduct back-office and data activities in the country, putting an extra cost burden on foreign banks. In addition, foreign firms are not permitted to connect their ATM machines to the domestic network. To circumvent that limitation, four foreign banks—Standard Chartered, HSBC, Oversea-Chinese Banking Corp, and United Overseas Bank—collaborated in 2006 to establish their own shared network, allowing their customers to use any of the 300 ATMs operated by those banks.88 The Malaysian banking industry has already undergone some consolidation, and it is likely to consolidate further. Malaysia has 39 commercial banks, including 9 domestically owned, 13 foreign owned but locally incorporated, and 17 Islamic banks.89 Domestic firms dominate the sector—accounting for 80 percent of total banking assets in May 200890—and offer a wide range of banking services, including commercial, retail, and investment services, as well as insurance, property management, and fund management. Starting in 1999, the Malaysian government began consolidating domestically-owned banks. This effort was designed to create larger domestic banks that would be better able to withstand competition from foreign firms entering the market. As a result, 58 banks were consolidated into 9 domestic banking groups, each of which operates a commercial firm as well as an investment and/or an Islamic bank. The three
84 EIU, Country Finance: Malaysia, 2006, 16; EIU, Country Finance: Malaysia, 2007, 3. 85 EIU, Country Finance: Malaysia 2009, 14. 86 EIU, Country Finance: Malaysia, 2007, 9–10. 87 USTR, “Malaysia,” 2008. 88 EIU, Country Finance: Malaysia, 2007,16. 89 Of the 17 Islamic banks in Malaysia, 11 are domestically owned, 3 are foreign owned but locally incorporated,
and 3 are foreign owned. Bank Negara Malaysia, “List of Banking Institutions,” May 31, 2008; EIU, Country Finance: Malaysia, 2009, 6.
90 Bank Negara Malaysia, “Commercial Banks: Statement of Assets of Domestic and Foreign Banks” (accessed May 10, 2010).

largest domestic banking groups in Malaysia are the Maybank Group, Bumiputra-Commerce Holdings Group, and the Public Banking Group, which collectively hold a 57 percent share of the market.91 The government has stated that it aims to further consolidate domestic banks into 3 or 4 firms, but it remains unclear when that might occur.
Growth in the Banking Sector
Malaysia’s foreign banking sector has grown rapidly despite substantial restrictions on market entry and operations. There are 13 foreign banks operating in Malaysia, collectively accounting for $86 billion, or 20 percent, of the commercial banking sector’s total assets.92 This represents a 122 percent gain in foreign bank assets since 2005.93 The five most prominent foreign banks operating in Malaysia—HSBC (UK), Oversea-Chinese Banking Corp (Singapore), Standard Chartered (UK), Citibank (U.S.), and United Overseas Bank (Singapore)—collectively accounted for 18 percent of the Malaysian banking market in July 2009.94 All 13 foreign banks that currently operate in Malaysia are permitted to offer a full range of commercial and retail banking services, though only the top 5 banks have significant branch networks and retail and commercial operations. The remaining banks tend to focus on more specialized market segments, such as providing services to multinational companies or trade financing. In 2005, the central bank announced that existing foreign banks could each open four new branches during the following year, with one in an urban commercial market, two in semiurban centers, and one in a rural area.95 Despite this small increase in the permitted number of branches, foreign firms continue to be at a disadvantage relative to their domestic counterparts because their branching networks are restricted, limiting their access to retail deposits—a vital and inexpensive source of capital for banks. Islamic banks have achieved substantial growth principally due to development of products comparable to those of conventional banks, though government policies have lent a helping hand. These banks operate according to Sharia (Islamic) law, which prohibits the payment or collection of interest and encourages profit and loss sharing. In order to accommodate these basic principles, Islamic banks offer alternative financial vehicles. For example, in lieu of traditional secured loans for real estate, automobiles, etc., that charge the borrower interest, Islamic banks offer arrangements such as murabaha financing, whereby the bank purchases the asset and then sells it to the borrower at an agreed-upon markup.96 Such markups typically reflect conventional interest rates. As Islamic banks cannot pay interest on deposits, funds are either deposited on a fiduciary basis or placed into investment account funds which the bank manages, sharing profits and losses with the depositor.97 In January 2010, Islamic banks accounted for $70 billion, or 18 percent, of total commercial banking assets in Malaysia, representing a 79 percent increase over December 2006 levels.98 Because Malaysia has
91 EIU, Country Finance: Malaysia, 2009, 11. 92 Figure as of January 2010. Bank Negara Malaysia, “Commercial Banks: Statement of Assets of Domestic and
Foreign Banks” (accessed May 10, 2010). 93 Ibid. 94 EIU, Country Finance: Malaysia, 2009, 14. 95 USTR, “Malaysia,” 2008. 96 El-Gamal, Overview of Islamic Finance, August 2006, 4. 97 Ibid., 7. 98 Malaysia’s central bank does not report data on Islamic banks’ assets prior to December 2006. Bank Negara
Malaysia, “Islamic Banking System, Statement of Assets (as of 31 January 2010),” (accessed March 23, 2010).
22

23
placed a priority on becoming a global hub for Islamic banking—and thus has devoted the majority of its recent financial services liberalization efforts to that industry segment—it is likely that future growth in this area will outpace that of conventional banks.
Trade and Investment
While official data on Malaysian exports of financial services are not available, industry data suggest that such exports are small but growing. Only three of Malaysia’s nine commercial banking groups conduct significant operations in foreign markets. The Maybank Group holds the greatest share of foreign assets, totaling $30.9 billion in 2009; these represented 34 percent of the firm’s total assets.99 Most of these assets are concentrated in the Singaporean market, where the bank has focused its foreign operations. Bumiputra-Commerce Holdings Group and the Public Banking Group each conduct overseas operations as well, but on a smaller scale. In 2008, the Bumiputra-Commerce Holdings group had $6.4 billion in foreign assets: these were located mainly in Indonesia, with smaller operations in Singapore, the United Kingdom, Hong Kong, and Mauritius. The firm’s operations in those countries primarily focus on corporate lending and borrowing, and securities transactions.100 The Public Banking Group had the smallest volume of assets in foreign markets in 2009, totaling $6.2 billion, which were dispersed among a half-dozen Asian countries.101 These figures represent growth rates of between 74 and 114 percent from 2006 levels, indicating the banks’ increasing interest in expanding beyond the domestic market. Malaysia’s total imports of financial services—including banking, securities, and insurance services—rose by 69 percent from 2006 to 2007, the latest years for which data are available, though it is unclear which subsector(s) were responsible for the increase.102
Cross-border trade in financial services between Malaysia and the United States is minimal, and is likely concentrated in the trade financing segment. Financial service exports to Malaysia totaled $183 million in 2008, representing a 48 percent increase over the preceding year.103 Imports of financial services from Malaysia totaled $41 million in 2008, a 9 percent decrease from 2007 levels but an 18 percent increase since 2002.104 The general increases in both imports and exports likely reflect rising levels of trade in goods between the two countries. Official data on transactions by Malaysian financial service affiliates in the United States and U.S. financial service affiliates in Malaysia are not available.
Malaysia’s Banking Commitments under the GATS
In its revised GATS offer, dated December 2005, Malaysia committed to partial liberalization of the banking sector by increasing the ceiling on foreign equity investment in certain financial institutions to 49 percent. However, Malaysia’s offer retained some
99 Maybank Group, Annual Report 2007, September 7, 2007, 19, and Annual Report 2009, 2009, 58. 100 Bumiputra-Commerce Holdings Berhad, Annual Report 2007, 2007, 157, and Annual Report 2008, 2008, 149. 101 Public Bank Berhad, Annual Report 2007, 2007, 273, and Annual Report 2009, 2009, 363. 102 Ministry of International Trade and Industry, Malaysia, Malaysia: International Trade and Industry Report
2007, July 2008, 139. 103 USDOC, BEA, “U.S. International Services: Cross-Border Trade in 2008,” October 2009, 50–52. 104 Ibid.

restrictions on the operation of foreign banks included in its 1994 schedule of commitments. For instance, foreign financial institutions wishing to lend to local consumers must do so in conjunction with Malaysian banks. In addition, foreign equity participation in institutions that provide money and foreign exchange broking services is limited to 30 percent. Malaysia’s offer also maintained mode 4 (presence of natural persons) restrictions in certain banking subsectors. These restrictions limit the number of foreign personnel employed in locally established offices of foreign banks.105 According to the WTO’s most recent review of Malaysia’s trade policies, the Malaysian government plans or has implemented new measures to open foreign participation in its banking sector beyond what is stated in the country’s 2005 GATS offer. Such measures, which are outlined in Malaysia’s Financial Sector Master Plan, include raising foreign equity ceilings in Malaysian banks and allowing locally incorporated foreign banks to establish branches for microfinance. In April 2009, the Malaysian government increased foreign equity limitations for both Islamic banks and investment banks from 49 percent to 70 percent.106 In addition, the government issued new licenses to foreign entities wishing to establish either Islamic banks or commercial banks, and planned to issue more licenses in 2010. Finally, the government permitted locally incorporated foreign commercial banks to establish up to 10 microfinance branches, with four additional new branches permitted in 2010.107
Healthcare Services
Overview
The Malaysian healthcare service market is a dual system composed of public and private institutions.108 Government-subsidized public institutions provide primary, secondary, and tertiary care at little or no cost to patients, and ensure that care is provided in rural areas and to the needy.109 Private institutions cater to an increasingly affluent patient population, generally in urban areas, and are frequently equipped with the latest medical technology.110 In 2008, the public sector accounted for 143 hospitals with a total of 41,249 beds, while the private sector accounted for 243 hospitals with 12,137 beds.111 The majority of Malaysian healthcare professionals are employed in the public healthcare sector—60 percent of doctors and 71 percent of nurses in 2008.112
105 WTO, GATS, “Malaysia: Schedule of Specific Commitments,” April 15, 1994, 47–65, and “Malaysia: Revised
Offer,” January 31, 2006, 32–35 and 39–40. 106 WTO, “Trade Policy Review Report by the Secretariat: Malaysia,” December 14, 2009, 61. For Islamic banks,
the 70 percent foreign equity allowance applies only to existing institutions that plan to partner with foreign banks. Such banks must have capital reserves of no less than $1 billion in U.S. currency.
107 Ibid., 59. 108 Public institutions refer to government-owned or -subsidized facilities; private institutions are privately, or non-
government, owned. Malaysian-German Chamber of Commerce and Industry, “Market Watch 2010,” n.d. 109 Yon, “Financing Health Care in Malaysia,” 2004, 43–46. 110 Danish Trade Council, Royal Danish Embassy, The Health Care Sector, March 31, 2009. 111 Public hospitals include government hospitals, special medical institutions, and non-Ministry of Health
government hospitals; private hospitals include maternity and nursing homes. Department of Statistics Malaysia also provides statistics on private facilities; however, there is some discrepancy between the numbers, as they cite 191 private hospitals and 67 private maternity homes. Comparable data are not available for clinics and other facilities. Ministry of Health (MoH), Malaysia, Health Facts 2008, May 2009; Danish Trade Council, Royal Danish Embassy, The Health Care Sector, March 31, 2009.
112 USITC staff calculations based on data from MoH Malaysia, Health Facts 2008, 2009, and MoH, Malaysia Health Facts 2004, 2005.
24
25
The Malaysian healthcare industry has grown in recent years, largely driven by the private sector. Total expenditure on health services increased at an average annual rate of 10.7 percent from 2004 through 2008, accounting for 4.3 percent of GDP in 2008.113 Overall, private spending on healthcare services increased at an average annual rate of 13.9 percent between 2004 and 2008, compared to 7.3 percent for government, or public, expenditure on health.114 Although risk-pooling and prepaid health plans (insurance) are growing in popularity, 73.2 percent of private expenditures on health in 2008 comprised out-of-pocket payments by private households.115
Government Policies and Sector Reform
Government policy has actively promoted growth in Malaysia’s healthcare industry, especially that of private healthcare providers. The Malaysian government is the country’s primary healthcare provider, and remains highly influential in both the public and private healthcare markets, contributing to the development of healthcare infrastructure in both sectors. Under the Ninth Malaysia Plan, the government increased allocations to the public sector, with RM1.3 billion ($354 million) earmarked for the construction of new hospitals and RM4.3 billion ($1.2 billion) for upgrading and renovating existing public facilities.116 The government also enacted policies supporting the private sector, in an effort to shift the provision of healthcare services to the private market.117 These changes include privatization of nonclinical services and the creation of tax incentives for construction, training, equipment, and other healthcare expenses.118 The government also offers tax deductions for Malaysian consumers to offset out-of-pocket medical expenses and insurance costs. Tax deductions are allowed up to RM500 ($146) for a complete medical examination; RM3,000 ($877) for personal medical insurance premiums; RM5,000 ($1,462) for medical expenses for serious diseases; and an additional RM5,000 ($1,462) for medical expenses for parents.119 Malaysia’s economic development and population growth have also stimulated growth in the private healthcare sector, as institutions are established to meet the increasing demands of a growing, increasingly prosperous workforce and urban population.120 The expansion of healthcare financing options, particularly private or employer-sponsored health insurance, also increased the purchasing power of consumers, further motivating
113 Average annual growth rate calculated by USITC staff using annual data from World Health Organization
(WHO), “Malaysia,” March 2010. 114 USITC staff calculations based on data from WHO, “Malaysia,” March 2010. 115WHO, “Malaysia,” March 2010. 116 Economic Planning Unit, Prime Minister’s Department, Ninth Malaysia Plan, 2006, 435. Values converted
from ringgit to dollars by USITC staff. 117 The Seventh Malaysia Plan, enacted from 1996 through 2000, specified a move towards “the corporatization and
privatization of hospitals as well as medical services” and a shift in government participation towards a regulatory role. Khoon, “Privatizing the Welfare State,” 2003, 88.
118 Danish Trade Council, Royal Danish Embassy, Health Care Sector, January 6, 2005; Leng, Medical Tourism in Malaysia, January 2007, 13.
119 Values converted from ringgit to dollars by USITC staff a rate of 3.42 ringgit/dollar, the exchange rate as of January 4, 2010. International Monetary Fund, “Representative Exchange Rates for Selected Currencies for January 2010,” n.d. (accessed January 4, 2010); Inland Review Board of Malaysia, “Tax Relief Summary: List of Tax Relief for Resident Individuals 2010,” n.d. (accessed January 4, 2010); Yon, “Financing Health Care in Malaysia,” 2004.
120 Yong, “Tapping Into the Healthcare Services Sector in Malaysia,” April 15, 2003, and Yon, “Financing Health Care in Malaysia,” 2004.

them to seek care in the private sector.121 The number of private facilities has expanded rapidly in recent years in response to growing demand.122 From 2003 through 2007, the number of establishments in Malaysia’s private healthcare sector increased 30 percent from 3,768 to approximately 4,898.123 As in other developing countries, a “brain drain” is causing a labor shortage in Malaysia’s healthcare system, as many medical professionals leave the country for positions with higher pay or better working conditions. Malaysia has 7 physicians per 10,000 people compared to 26 physicians per 10,000 people in the United States. Malaysia’s low physician-to-patient ratio is largely the result of outward migration by healthcare workers, often to other Islamic countries such as Singapore and Saudi Arabia. 124 Further, regulations restricting pay rates and the procurement of equipment in the public sector have led many healthcare professionals to shift from the public to the private sector within Malaysia.125 To address the acute shortage of healthcare workers, Malaysia’s government has introduced a telehealth initiative, which promotes teleconsulting, electronic health records, and online education for healthcare providers. The goals of this program are to upgrade rural access to healthcare, increase the efficiency of current healthcare workers, attract foreign investment to the Multimedia Super Corridor, and encourage clinicians practicing abroad to return home.126 Additionally, as a more immediate solution, the government has recruited both Malaysian and foreign medical personnel on short-term contracts to serve in the public sector.127 In 2005, over 50 percent of doctors registered in Malaysia were Chinese or Indian; only 37 percent identified themselves as bumiputra, or ethnic Malay.128 Trade and Investment
Malaysia’s healthcare industry is served by many domestic and foreign-invested healthcare operations. One leading domestic operation is Kumpulan Perubatan (Johor) Sdn Bhd (KPJSB), the healthcare division of Johor Corporation, a multinational Malaysian corporation. The KPJSB hospital network includes 19 hospitals in Malaysia and 3 in Indonesia, in addition to facilities offering related services such as pathology, pharmaceutical procurement, and hospital management, as well as a nursing college and training programs in clinical and healthcare management.129 KPJSB also owns KPJ
121 Ganesan, “Taking the Sting out of Medical Bills,” March 10, 2007. 122 USITC staff calculations based on Department of Statistics Malaysia, “Health Services (Private Sector),”
November 3, 2009. In 2007 (the most recent year for which data are available), general medical clinics and private hospitals accounted for over 80 percent of gross output in the private healthcare market.
123 For 2003, the total number of establishments includes medical services and private hospitals and maternity homes. For 2007, the total number of establishments includes general medical clinics, specialty medical clinics, private hospitals, private maternity homes, and healthcare services. Statistics for healthcare services were not provided in 2003, general and specialist medical clinics were not broken out, and statistics for private hospitals and private maternity homes were summed together. Department of Statistics Malaysia, Economic Census 2004 Malaysia—Health, 2004, and “Health Services (Private Sector),” November 3, 2009.
124 WHO, Global Health Statistics 2008, 2008. 125 Danish Trade Council, Royal Danish Embassy, The Health Care Sector, January 6, 2005. 126 Ministry of Health Malaysia, “Bahagian Telekesihatan (Telehealth Flagship Project),” n.d. (accessed June 19,
2008). 127 Yong, “Tapping Into the Healthcare Services Sector in Malaysia,” April 15, 2003; Meng, “The Briefing Session
for Contract Doctors from the Arab Republic of Egypt,” March 2, 2004. 128 Department of Statistics Malaysia, “Number of Registered Medical Professionals by Ethnic Group—Malaysia,”
Economic Census 2006 Malaysia – Health, 2007. 129 KPJ Healthcare Berhad Website, “Hospital Network,” n.d. (accessed June 2008).
(http://www.kpjhealth.com.my//index.php?option=com_content&task=view&id=168&Itemid=139).
26

27
Healthcare, which was Malaysia’s first local private healthcare establishment.130 Additionally, many foreign firms have entered the Malaysian healthcare market, primarily through joint ventures. Consistent with foreign investment in other areas of Southeast Asia, foreign-owned healthcare facilities in Malaysia have been established primarily in urban areas, catering to middle- and upper-income patients.131 For example, Columbia Asia Sdn Bhd, a joint venture between the Malay government-run Employees Provident Fund (30 percent) and the U.S.-based Columbia Pacific Healthcare Sdn Bhd (70 percent), has opened six hospitals in Malaysia and plans to open five more.132 Singaporean hospital system Parkway Holdings Ltd. owns majority shares in two Malaysian hospitals (Gleneagles Medical Centre, Penang and Gleneagles Intan Medical Centre, Kuala Lumpur) and is the operating partner and minority shareholder in Pantai Holdings Bhd, which operates eight Pantai hospitals throughout the country.133 Malaysia maintains a number of restrictions on foreign participation in the healthcare sector. Foreign investment is limited to 30 percent, although higher levels of ownership may be permitted with approval from the Ministry of Health.134 As of 2001, foreign entry into the market was limited to hospitals with at least 100 beds.135 Additional requirements reported in 2001 appeared to be driven by labor market considerations. Employment of foreign nurses was limited to the private sector; employment of foreign specialists was limited to two per hospital, and such specialists could only treat Malaysian patients; and employment of foreign nurses and specialists was subject to an economic needs test. It is not clear if these barriers have since been liberalized. Public and private efforts have spawned a profitable medical tourism industry in Malaysia. The number of foreign patients visiting Malaysia for medical treatment increased from 174,189 in 2004 to 374,063 in 2008, generating RM299.1 million ($82.3 million) in revenue in 2008.136 Within the ASEAN region, Malaysia is the third largest exporter of healthcare services, following Thailand and Singapore.137 Malaysia’s healthcare facilities attract foreign patients from rich and poor countries alike. Efforts to promote medical tourism targeted less-developed countries, such as Indonesia and Bangladesh, where specialized services are not readily available.138 However, Malaysia’s low costs also make it competitive with Thailand, a traditional medical tourism destination for visitors from developed countries.139 The private healthcare
130 Johor Corporation, “Corporate Profile,” n.d. (accessed June 24, 2008). 131 Arunanondchai and Fink, Trade in Health Services in the ASEAN Region, March 2007, 5. 132 Columbia Pacific Healthcare is part of U.S.-based investment firm Columbia Pacific and operates hospitals
throughout the region in India, Indonesia, Malaysia, and Vietnam. Columbia Asia Website. http://www.columbiaasia.com/index.html; Columbia Asia, “Columbia Asia Plans Aggressive Expansion in Malaysia,” April 21, 2009.
133 ParkwayHealth, “Global Presence,” n.d. (accessed June 25, 2008). 134 Ministry of International Trade and Industry Malaysia, “Industry Profile: Services: Healthcare,” n.d. (accessed
June 2008). 135 Ahmad, Healthcare Sector Overview, September 26, 2001. 136 Association of Private Hospitals Malaysia, cited in Malaysia-German Chamber of Commerce and Industry,
“Market Watch 2010,” n.d., 7. Values converted from ringgit to dollars by USITC staff the rate of 3.46 ringgits/dollar, the exchange rate as of December 31, 2008. International Monetary Fund, “Representative Exchange Rates for Selected Currencies for December 2008,” n.d. (http://www.imf.org/external/np/fin/data/rms_mth.aspx?SelectDate=2008-12-31&reportType=REP).
137 Arunanondchai and Fink, Trade in Health Services in the ASEAN Region, March 2007, 3. 138 Ibid., 6; Danish Trade Council, Royal Danish Embassy, The Health Care Sector, January 6, 2005. 139 In 2002, a heart bypass procedure at an upscale private hospital cost $6,315 compared to $10,417 in Singapore
and up to $90,000 in the United States. Business Monitor International, “Key Sectors,” 2006, 46.

industry has supported the development of medical tourism by developing a list of recommended fees for common services sought by foreign patients.140 The publication of such fees increases transparency and is an attempt to the standardize prices charged by providers. The government also provides strong support, as it sees medical tourism as an important component of Malaysia’s evolution from a manufacturing to a service economy. In addition to promoting 35 of the country’s hospitals as medical tourism providers, the government offers tax incentives within designated “wellness zones” for companies providing services to foreign citizens.141 The government has encouraged private healthcare institutions to acquire accreditation or certification in order to promote medical tourism. As a result, most medical centers have either received government accreditation from the Malaysian Society for the Quality of Health or international accreditation via MS ISO 9002.142 Accreditation by universally recognized, industry-specific organizations provides quality assurance, particularly for Western visitors, and is critical to Malaysia’s ability to attract foreign patients in the competitive Southeast Asian market. Penang Adventist Hospital became the first Malaysian hospital to achieve such status when it received Joint Commission International (JCI) accreditation in 2007.143 There are now five JCI-accredited hospitals in Malaysia (including Penang Adventist) and one accredited ambulatory care center.144 Another factor strengthening Malaysia’s international competitiveness as a provider of healthcare services is its status as a Muslim country.145 Middle Eastern countries have been identified as a key market for Malaysia’s medical tourism services, a trend which began following September 11, 2001, as Muslim travelers became reluctant to visit Western countries due to political and visa difficulties.146 Malaysian healthcare providers and marketers emphasize the availability of halal food and other conveniences for practicing Muslims, and this type of marketing is likely the reason Pantai Holdings reports a growing volume of patients from other Islamic countries, such as Indonesia.147 The Malaysian private healthcare market also has benefited from the creation of a Muslim-specific financial instrument, an Islamic real estate investment trust (REIT). The Islamic healthcare REIT provides Muslim investors with a Sharia-compliant international investment opportunity while also generating financial support for Malaysian healthcare facilities. For example, KPJ Healthcare sponsors Al-’Aqar KPJ REIT, which purchased
140 Dewi, “Hospitals Set Fees for Health Tourism,” October 28, 2003. 141 Tax incentives offer a 70 percent income exemption for identified medical services, as well as for machines and
equipment used in service provision. Leng, Medical Tourism in Malaysia, January 2007, 13; Ministry of Tourism Malaysia, “Tax Incentives,” May 30, 2008 (accessed June 3, 2008).
142 Leng, Medical Tourism in Malaysia, 13; Shaw, “Accreditation and ISO,” 1997, 12; Tourism Malaysia, Advertising and Publicity Division, “Health Tourism in Malaysia,” November 5, 2007. Certification by the International Standards Organization (ISO) is accreditation based on an industry model of international standards. In the services sector, general standards focus on the quality of processes rather than results. In the case of healthcare services, ISO attempts to reconcile “patients, population and scientific evidence.” Leng, Medical Tourism in Malaysia, 13; Shaw, “Accreditation and ISO,” 1997, 12; Tourism Malaysia, Advertising and Publicity Division, “Health Tourism in Malaysia,” November 5, 2007.
143 Joint Commission International (JCI), “Joint Commission International (JCI) Accredited Organizations,” 2007, and “About Joint Commission International,” JCI website. http://www.jointcommissioninternational.org/about-jci/ (accessed October 19, 2010). JCI works with global healthcare providers and government ministries of health to improve the safety of patient care. It has supplied accreditation, certification, education, and advisory services to healthcare organizations in more than 80 countries over the past 16 years.
144 JCI, “JCI Accredited Organizations,” 2010. 145 Leng, Medical Tourism in Malaysia, January 2007, 11. 146 Business Monitor International, “Key Sectors,” 2006, 46. 147 The Sun, “Pantai: Health Tourism to drive growth,” September 15, 2004.
28
29
five KPJ hospitals for RM170 million (US $50 million) and became the first listed Islamic REIT in 2006.148 Some Malaysian healthcare firms invest internationally, providing services in foreign markets through joint venture arrangements. For example, a subsidiary of Pantai Holdings has entered into a joint venture with a Saudi Arabian firm to provide healthcare services and open two hospitals in Saudi Arabia.149 Additionally, the company has voiced intentions to expand into West Asia, India, and Sri Lanka.150
Malaysia’s Commitments on Healthcare Services under the GATS With respect to healthcare services, Malaysia’s 2005 GATS offer is nearly identical to its 1994 schedule of commitments. Malaysia’s offer includes commitments on private hospital services only and, as previously noted, requires that foreign hospital service providers meet an economic needs test and set themselves up as a locally incorporated joint venture with a Malaysian entity. However, Malaysia’s offer raises the ceiling for foreign equity in such a joint venture to 40 percent from the 30 percent noted in its 1994 schedule.151 The Malaysian government has designated healthcare as one of several strategic service sectors to promote economic growth; in 2009, it reportedly lifted foreign investment restrictions on select healthcare services.152
Logistics
Overview
Malaysia’s core logistics sector includes firms offering cargo handling, storage and warehousing, and freight forwarding, while related subsectors provide road, rail, maritime, air freight transport, and courier services. In 2005, Malaysia had 226 cargo handling establishments employing 7,025 full-time workers, with an output of $282 million; 36 storage and warehousing establishments employing 17,272 full-time workers, with an output of $150 million; and 976 freight forwarding establishments employing 14,998 full-time workers with an output of $1.1 billion. Each of these subsectors demonstrated strong growth in recent years: between 2004 and 2005, the number of establishments, total output, and full-time employees in the cargo handling segment almost doubled, while the output of freight forwarding establishments increased by 51 percent. Storage and warehousing firms have steadily increased their output by an average of 64 percent per year since 2000. Domestic suppliers dominate this market segment, as 98 percent of cargo handling establishments, 97 percent of freight forwarding firms, and all storage and warehousing firms were owned by Malaysian residents in 2005.153
148 Islamic Finance News, “Al-’Aqar KPJ REIT,” n.d. (accessed June 24, 2008); Business Development Asia,
“Malaysia,” June 2007. 149 New Straits Times, “Pantai to Expand Overseas Ops,” December 7, 2004. 150 Ibid.
151 WTO, GATS, “Malaysia: Revised Offer,” January 31, 2006, 63. 152 WTO, “Trade Policy Review Report by the Secretariat, Malaysia,” December 14, 2009, 56; Tenth Malaysia
Services Plan, 2011–15, 122. 153 Department of Statistics Malaysia, Economic Census 2006: Transport and Communications, December 2007,
99–167. Values converted from ringgits (RM 1.1 billion, RM 5.7 million, and RM 4.1 billion, respectively) to dollars by USITC staff.

Malaysia’s recent economic growth has prompted the development of an efficient logistics sector capable of transporting manufactured products to international markets quickly and inexpensively.154 The sector’s health, however, has strengthened and weakened with the country’s export volumes.155 The importance of exports to the logistics sector is illustrated by the fact that, of a total of $12.5 billion invested in 1,007 logistics projects in 2006, $9.8 billion (78 percent) went towards 429 export-oriented projects.156 The regional context is an important element in the sector’s prospects for expansion. As a result of overall economic growth (and growth in Chinese exports specifically), improved political openness, and increasing trade and investment flows in Southeast Asia, the region’s logistics industry is expected to grow significantly through 2017.157 Malaysian ports and logistics firms compete and measure themselves against their Singaporean counterparts, as Singapore is the established logistics hub in the region. Logistics managers for manufacturing firms consider factors such as transport costs and infrastructure when deciding where to establish plants. In general, firms interested in minimizing costs and accessing stable, high-volume markets set up facilities in Malaysia, while firms that place more value on workforce quality, overall infrastructure, business services, and supportive government policies locate in Singapore.158 Malaysia is emerging as a logistics hub for halal food products, and is positioned to capture much of the global halal logistics market, worth an estimated $28 billion to $57 billion in 2005.159 The halal designation requires dedicated “cold chain”-like protocols throughout the supply chain to ensure compliance with Islamic teachings.160 Malaysian-based MISC Integrated Logistics has developed a halal certification process for cargo processing and is investing in a 41-acre halal storage and processing system in Port Klang’s free trade zone. Malaysia’s government is also planning to construct an industrial food park for halal products. Government Policies and Sector Reform In recent years, the Malaysian logistics industry has benefited from government efforts to improve the sector’s efficiency by developing and implementing market-friendly policies. Among these are the Integrated Logistics Services (ILS) incentives established in 2002, which encourage integration and consolidation among specialized service logistics providers.161 As of December 2007, 20 companies have taken advantage of ILS incentives, investing $1.2 billion in logistics consolidation.162 Malaysia’s government has also made substantial investments in roads, resulting in well-maintained highways that
154 Exports require the ability to move cargo among sea, rail, and air carriers, and Malaysia’s logistics sector has
developed strong intermodal capacities. 155 In turn, improvements in logistics infrastructure have attracted increased investment in Malaysia’s export-
oriented manufacturing sector. 156 Malaysia Industrial Development Authority, “Malaysia's Growing Logistics Services,” February 23, 2007.
Values converted from ringgits (RM 46 billion and RM 35.8 billion respectively) to dollars by USITC staff. 157 Tongzon, “Determinants of Competitiveness in Logistics,” March 2007, 1. 158 Bhatnagar, Jayaram, and Yue Cheng Phua, “Relative Importance of Plant Location Factors,” March 2003, 154. 159 Haq, “Halal Logistics Hits the Middle East,” May 29, 2006. 160 For example, halal and non-halal products cannot be stored in the same container. 161 Ministry of International Trade and Industry Malaysia, “Official Portal of Ministry of International Trade and
Industry Malaysia,” n.d. (accessed July 2, 2008). 162 Values converted from ringgits (RM 4.1 billion) to dollars by USITC staff.
30

31
support efficient overland shipping, and is participating in a proposed 5,500-kilometer trans-Asia railway linking Singapore, Malaysia, Thailand, Cambodia, Burma, Laos, Vietnam, and China. The Malaysian Ministry of International Trade and Industry’s Third Industrial Master Plan, initiated in 2006, sets out ambitious goals for the country’s logistics sector. Its targets for the industry for 2020 include 8.6 percent growth, with the industry ultimately generating 12.1 percent of GDP; growth in total marine cargo to 751 million tons (from 253 million tons in 2005); growth in total air cargo trade to 2.4 million tons (from 1 million tons in 2005); and growth in rail freight volume to 18.6 million tons (from 4 million tons in 2005).163 Malaysia intends to accomplish these goals by integrating its logistics industry with broader industrialization efforts and with global supply chains. It is also investing in new information and communication technologies, and has made efforts to strengthen inter-ministry and -agency policy coordination. Trade and Investment A large number of third-party logistics (3PL) providers—such as Tiong Nam, Linfox, and Trans-Asia Shipping Corp, among others—supply services to Malaysian firms. In one survey, conducted in 2000, 68 percent of all Malaysian firms contracted with 3PL firms instead of conducting logistics in-house (similar to the 65 percent rate for firms in the United States and the 60 percent rate for firms in Singapore).164 Malaysian firms use 3PL providers extensively for international shipping, with 66 percent of the survey’s respondents contracting with 3PL firms to manage both domestic and international logistics. The services most often outsourced were fleet management, shipment consolidation, freight payment, carrier selection, and warehouse management. In 2007, seaborne shipping accounted for 95 percent (by volume) of Malaysia’s total trade in goods.165 The country’s main ports are Port Klang (the 17th busiest port in the world) and Port Tanjung Pelepas, known as PTP (the 19th busiest port). These ports are advantageously located on the Straights of Malacca, the shortest shipping lane between Singapore and the Suez Canal (figure 6).166 Port Klang, which is served by two port operating companies (Westports and Northport), handled 7.2 million 20-foot equivalent units (TEUs)167 in 2007, compared to 6.3 million the previous year.168 PTP, regulated by the Johor Port Authority, handled 5.4 million TEUs in 2007,169 shortly after the rapid expansion of its shipping services and container volume capacity to a maximum of 8
163 Ibid. 164 Sohail, Bhatnagar, and Sohal, “A Comparative Study on the Use of Third Party Logistics Services by
Singaporean and Malaysian Firms,” November 2006, 694. 165 Malaysia Industrial Development Authority, “Malaysia's Growing Logistics Service,” February 23, 2007. 166 American Association of Port Authorities, “World Ports Rankings, 2007,” n.d. (accessed June 12, 2009). 167 A TEU is the cargo capacity of one standard 20-foot long intermodal container; ports primarily handle cargo in
the form of 20- and 40-foot containers. 168 Portsworld.com Malaysia, “Record Performance by Malaysian Ports,” February 11, 2008; Portsworld.com
Malaysia, “Port Klang Authority,” n.d. (accessed July 2, 2008); Ali, “Dubai-Based Operator Pulls Out of PKFZ,” July 19, 2007. This port was privatized in 1986, with Port Klang Authority acting as a landlord, regulator, and trade facilitator. In 2004 Port Klang signed an agreement with Dubai’s Jebel Ali Free Zone International (JAFZA) allowing them to manage the port, but in 2007 JAFZA withdrew from the concession, citing its inability to retain operational control as an equity stakeholder (Port Klang Authority had retained 100 percent of equity).
169 Portsworld.com Malaysia, “Record Performance by Malaysian Ports,” February 11, 2008; Mark, “Global Ambition,” October 2007, 29. PTP has a deep, sheltered bay with a wide approach channel, and is capable of accommodating the Emma Maersk (the world’s largest container ship, which can only dock at a handful of ports). It also has state-of-the-art cargo handling systems and IT infrastructure, as well as a dedicated airport code that lets
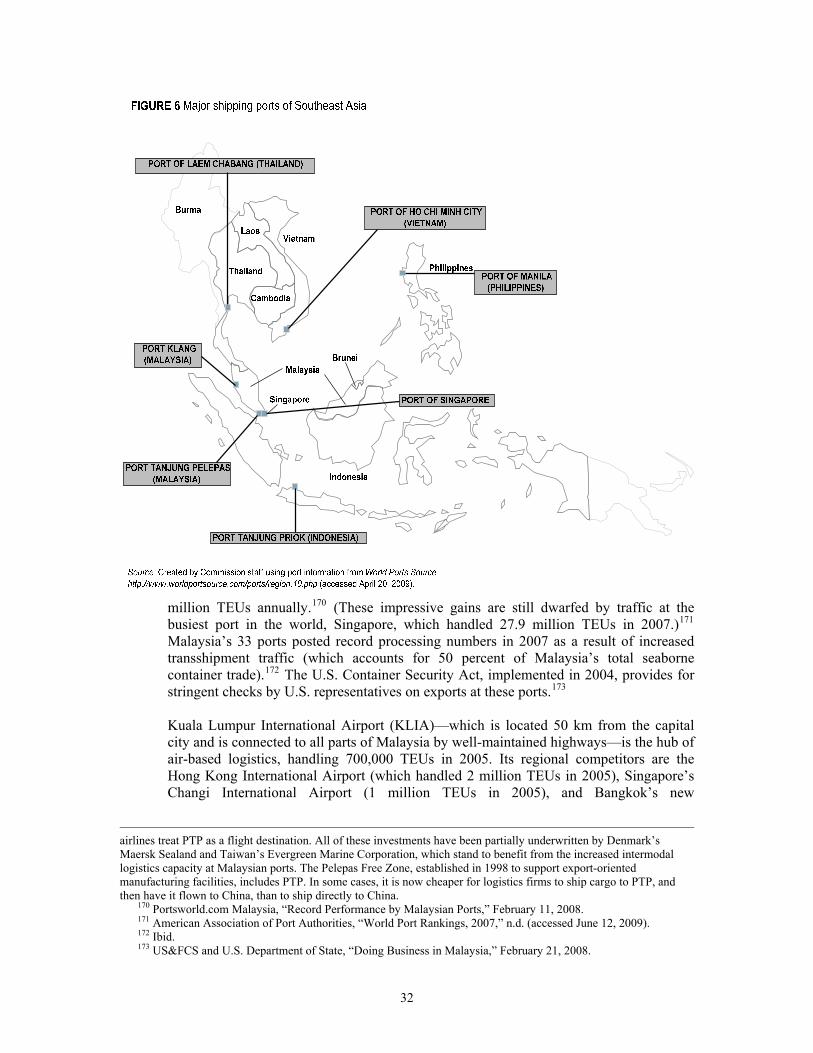
million TEUs annually.170 (These impressive gains are still dwarfed by traffic at the busiest port in the world, Singapore, which handled 27.9 million TEUs in 2007.)171 Malaysia’s 33 ports posted record processing numbers in 2007 as a result of increased transshipment traffic (which accounts for 50 percent of Malaysia’s total seaborne container trade).172 The U.S. Container Security Act, implemented in 2004, provides for stringent checks by U.S. representatives on exports at these ports.173 Kuala Lumpur International Airport (KLIA)—which is located 50 km from the capital city and is connected to all parts of Malaysia by well-maintained highways—is the hub of air-based logistics, handling 700,000 TEUs in 2005. Its regional competitors are the Hong Kong International Airport (which handled 2 million TEUs in 2005), Singapore’s Changi International Airport (1 million TEUs in 2005), and Bangkok’s new
airlines treat PTP as a flight destination. All of these investments have been partially underwritten by Denmark’s Maersk Sealand and Taiwan’s Evergreen Marine Corporation, which stand to benefit from the increased intermodal logistics capacity at Malaysian ports. The Pelepas Free Zone, established in 1998 to support export-oriented manufacturing facilities, includes PTP. In some cases, it is now cheaper for logistics firms to ship cargo to PTP, and then have it flown to China, than to ship directly to China.
170 Portsworld.com Malaysia, “Record Performance by Malaysian Ports,” February 11, 2008. 171 American Association of Port Authorities, “World Port Rankings, 2007,” n.d. (accessed June 12, 2009). 172 Ibid. 173 US&FCS and U.S. Department of State, “Doing Business in Malaysia,” February 21, 2008.
32

33
Suvarnabhumi Airport (the old airport in Bangkok handled 900,000 TEUs in 2005).174 KLIA recently offered a three-year waiver of landing fees to increase its market share in regional passenger and freight transport.175 All foreign air cargo shipments entering the country at KLIA are handled by MASkargo, the state-owned air cargo carrier, which usually clears goods within 20 minutes of their arrival.176 MASkargo has made significant improvements in its operations since 2000: establishing written performance standards, providing online tracking and payment processing, and initiating a Priority Business Center offering premium shipping services to major customers.177 In 2006, MASkargo generated approximately 18 percent of Malaysian Airlines’ total revenue, and despite rising oil prices, MASkargo has been consistently profitable even in years when its parent airline has lost money.178 MASkargo is also responsible for customs clearance, and thus most air cargo entering or leaving the country passes through MASkargo’s 108-acre Advanced Cargo Center at LIA. 179 The Advanced Cargo Center has tight security, which was recently improved due to concerns about bird flu and severe acute respiratory syndrome (SARS).180 Overland logistics in Malaysia are also handled primarily by MASkargo Logistics Sdn Bhd, formerly known as Pengangkutan Kargo Udara MAS (PKUM), a subsidiary of MASkargo and the largest trucking company in the country. PKUM has a fleet of 20 trucks (with capacities of 8 to 20 tons) designed to transport pallets and containers, as well as 20,000 square feet of dedicated warehouse space at KLIA.181 MASkargo also sells freight and logistics services to customers worldwide through a network of general sales agents, competing with major multinational airlines like Asiana Airlines, Singapore Airlines, Korean Airlines, and Polar Air in providing freight transportation services to Malaysian customers. Malaysia relies heavily on imports of freight services for transportation of its goods, especially during periods of strong activity in Malaysia’s merchandise export sectors. During these periods, much of the high demand for logistics services is met by foreign providers (including express operators like DHL, FedEx, UPS, and TNT, along with 3PL providers like Kuehne and Nagel, Exel, Maersk, and Tibbett and Britten, among others).182 These firms have expanded their operations in Southeast Asia to take advantage of regional growth in the logistics market. Malaysia’s exports of transportation services decreased as a percentage of total commercial services, from 22 percent in 1995 to 19 percent in 2004, partly as a result of competitive pressure from Singaporean logistics firms which have become regional leaders.183 However, discrete data on Malaysian trade in logistics services are not
174 Mark, “Global Ambition,” October 2007, 30. 175 Putzger, “Searching for Space,” March 2007, 38. 176 Mark, “Global Ambition,” October 2007, 30; Putzger, “MAS Momentum,” June 2002, 20. The carrier was
partially privatized in 1995, but the main stakeholder, Tajudin Ramli, eventually sold his 29 percent share back to the government.
177 Putzger, “MAS Momentum,” June 2002, 19. 178 Putzger, “Grounded,” September 2006, 44. 179 Mark, “Global Ambition,” October 2007, 30. 180 Ibid. Goods are accepted only from registered shippers, all cargo is held for 24 hours and x-rayed before
shipping, and U.S. customs officials make unannounced visits to monitor security. 181 MASkargo, “Kargo Udara Mas,” n.d. (accessed July 2, 2008). 182 Treasury Malaysia, Ministry of Finance, Economic Report 2007/2008, 2008, 66. 183 Mahmood, “Malaysia’s Export Competitiveness in Services and the Third Malaysia Industrial Master Plan,”
October 8, 2007.

provided in Ministry of Finance economic reports, but Malaysia exported an estimated $5.8 billion and imported about $11.3 billion in transportation services in 2007, yielding a $5.5 billion balance of payments deficit in this industry segment.184
Malaysia’s Commitments on Logistics Services under the GATS
Malaysia’s 2005 GATS offer includes limited commitments on maritime transport services, but no commitments on distribution services, or on air, road, or rail transportation services. For maritime services, commitments pertain to international maritime transportation services, maritime agency services (which were not included in Malaysia’s 1994 GATS schedule), and vessel salvage and refloating services. However, Malaysia’s offer on maritime services restricts the forms of commercial establishment available to foreign firms, specifying that commercial presence must occur through a representative office, a regional office, or a joint-venture corporation. Moreover, for international maritime transport services and maritime agency services, foreign equity participation in joint ventures with Malaysian firms is limited to 30 percent. For vessel salvage and refloating services, joint ventures must include bumiputra shareholding of at least 30 percent.185 Malaysia’s most recent trade policy review under the WTO indicates that the Malaysian government eliminated foreign equity restrictions in certain subsectors of transportation services in 2009, but that government-linked companies continue to play an important role in this sector.186 Outside of the GATS, Malaysia has taken steps towards improving market access for some foreign providers of logistics services. In 2004, Malaysia and Hong Kong negotiated an “open capacity” air services agreement, which granted their respective airlines “fifth freedom” rights (i.e., permission to carry passengers and cargo between the two countries and onto third countries).187 ASEAN members have agreed to allow investors from other ASEAN countries to acquire equity holdings in logistics firms of as much as 49 percent by the end of 2008, 51 percent by 2010, and 70 percent by 2013.188 Currently, Malaysia allows equity holdings by non-ASEAN foreigners of up to 70 percent in shipping companies and 49 percent in freight forwarding agencies, with non-foreign equity being specifically allocated to bumiputras.189
184 Treasury Malaysia, Ministry of Finance, Economic Report 2007/2008, 2008, 65. Values converted from ringgits
(RM 19.9 billion, RM 38.9 billion, and RM 19 billion respectively) to dollars by USITC staff. 185 WTO, GATS, “Malaysia: Revised Offer,” January 31, 2006, 67. 186 WTO, “Trade Policy Review Report by the Secretariat, Malaysia,” December 14, 2009, 56–7. 187 Airline Business, “Asian Cargo Opens Up,” April 2004. 188 Ministry of International Trade and Industry Malaysia, “Official Portal of Ministry of International Trade and
Industry Malaysia,” n.d. (accessed July 2, 2008). 189 US&FCS and U.S. Department of State, Doing Business in Malaysia: 2008 Country Commercial Guide for U.S.
Companies, February 21, 2008.
34

35
Topics for Further Analysis
Research and analysis presented in this paper indicate that the Malaysian government has used various measures to promote the development of its service industries. Policies pursued by the government of Malaysia in the three sectors analyzed—including promoting consolidation within the banking sector, encouraging the development of private hospitals, and investing in port facilities—seek to strengthen the industries and ultimately increase exports. The Malaysian government has liberalized some barriers to the foreign provision of services, and recent liberalization could result in an increase in services exports to that country. There are several aspects of the Malaysian service sector that may merit further investigation. Future research might examine additional Malaysian service industries, particularly the passenger air services and insurance industries. Passenger air services are a significant and growing component of Malaysian service exports, accounting for about 9 percent of such exports in 2006 following an average annual increase of 19 percent from 2002 through 2006. Analysis of the insurance industry would provide an example of a Malaysian industry in which foreign suppliers have a significant presence.190 Further comparisons of Malaysia’s service sector with the service sectors of other nations would underscore the significance of services to the Malaysian economy and provide context for Malaysia’s overall position in global services trade. Finally, additional research examining the effect of previous service liberalization on the Malaysian economy could lead to the refinement of econometric methods of predicting the potential effect of further liberalization on Malaysian services trade.
190 In 2005, 70 percent of life insurance premiums and 40 percent of general insurance premiums in Malaysia were
written by foreign insurers.
BIBLIOGRAPHY Ahmad, Natila. Healthcare Sector Overview. U.S. Department of Commerce. U.S. Commercial
Service, September 26, 2001. Airline Business. “Asian Cargo Opens Up,” vol. 20, no. 4 (April 2004): 25. Ali, Sharidan. “Dubai-Based Operator Pulls Out of PKFZ.” The Star Online, July 19, 2007.
http://biz.thestar.com.my/news/story.asp?file=/2007/7/19/business/18344875&sec. American Association of Port Authorities. “World Port Ratings: 2007,” n.d. http://www.aapa-
ports.org/Industry/content.cfm?ItemNumber=900&navItemNumber=551 (accessed June 12, 2009).
Arunanondchai, Jutamas, and Carsten Fink. Trade in Health Services in the ASEAN Region.
World Bank. World Bank Policy Research Working Paper 4147, March 2007. http://www-wds.worldbank.org/external/default/WDSContentServer/IW3P/IB/2007/02/22/000016406_20070222101041/Rendered/PDF/wps4147.pdf.
Bank Negara Malaysia. “The Financial Sector Masterplan,” 2001.
http://www.bnm.gov.my/index.php?ch=20. ———. “Commercial Banks: Statement of Assets of Domestic and Foreign Banks,” n.d.
(accessed May 10, 2010). ———. “Islamic Banking System, Statement of Assets (as of 31 March 2010).” Monthly Statistical Bulletin, March 14, 2010. http://www.bnm.gov.my/files/publication/msb/2008/4/pdf/2.31.pdf. ———. “List of Banking Institutions (as of 31 May 2008).” Monthly Statistical Bulletin,
May 31, 2008. http://www.bnm.gov.my/files/publication/msb/2008/5/pdf/2.3.pdf. Bhatnagar, Rohit, Jayanth Jayaram, and Yue Cheng Phua. “Relative Importance of Plant Location
Factors: A Cross National Comparison Between Singapore and Malaysia.” Journal of Business Logistics 24, no. 1 (March 2003): 147–70.
Bumiputra-Commerce Holdings Berhad. Annual Report 2007, 2007.
http://www.cimb.com/annual_reports/BCHB/2007/index.html. ———. Annual Report 2008, 2008, 149. Business Development Asia. “Malaysia.” Asian Health Newsletter, no. 51 (June 2007): 6. Business Monitor International. “Key Sectors.” Malaysia Business Forecast Report 4th Quarter,
2006: 36–46. http://search.ebscohost.com/login.aspx?direct=true&db=buh&AN=21975129&site=ehost-live.
36

Cheen, Lim Chze. “Malaysia: Strategies for the Liberalization of the Services Sector.” WTO: Managing the Challenges of WTO Participation; Case Study 25, n.d. http://www.wto.org/english/res_e/booksp_e/casestudies_e/case25_e.htm.
Columbia Asia. “Columbia Asia Plans Aggressive Expansion in Malaysia.” News release, April
21, 2009. Danish Trade Council. The Health Care Sector. Royal Danish Embassy, Kuala Lumpur,
Malaysia. January 6, 2005. http://www.ambkualalumpur.um.dk/NR/rdonlyres/591284AC-AB7E-4376-9A22-00145E297993/0/TheHealthCareSector.pdf.
———. Royal Danish Embassy, Kuala Lumpur Malaysia. The Health Care Sector, March 31,
2009. Department of Statistics Malaysia. Economic Census 2006 Malaysia: Health. December 2007. ———. Economic Census 2004 Malaysia: Health. December 2005. ———. Economic Census 2006 Malaysia: Transport and Communications, December 2007. ———. “Health Services (Private Sector),” November 3, 2009. ———. “Number and Percentage of Registered Professionals by Ethnic Group, 2006.” Yearbook
of Statistics Malaysia, 2007, 235, table 9.3. Dewi, K Kasturi. “Hospitals Set Fees for Health Tourism.” The Star, October 28, 2003.
http://www.hospitals-malaysia.org/newsmaster.cfm?&menuid=38&parentid=28&action=view&retrieveid=259.
Economist Intelligence Unit (EIU). Country Commerce: Malaysia. New York: Economist
Intelligence Unit, June 2009. http://www.eiu.com/index.asp?layout=displayIssueArticle&issue_id=1753435360&opt=full.
———. Country Profile 2007: Malaysia. London: Economist Intelligence Unit, 2007.
http://www.eiu.com/report_dl.asp?issue_id=1612811546&mode=pdf. ———. Country Profile 2008: Malaysia. London: Economist Intelligence Unit, 2008.
http://www.eiu.com/report_dl.asp?issue_id=161285586&mode=pdf. ———. Country Report: Malaysia. London: Economist Intelligence Unit, May 2008.
http://www.eiu.com/report_dl.asp?issue_id=613374246&mode=pdf. ———. Country Report: Malaysia. London: Economist Intelligence Unit, June 2009. ———. Country Finance: Malaysia, 2006, 16. ———. Country Finance: Malaysia, 2007, 3, 14. ———. Country Finance: Malaysia, 2009, 14.
37

———. “EIU Data Tool.” http://data.eiu.com/default.aps (accessed various dates). El-Gamal, Mahmoud Amin. Overview of Islamic Finance. Office of International Affairs Occasional Paper 4. U.S. Department of Treasury, Office of International Affairs, August 2006. http://www.treas.gov/offices/international-affairs/occasional-paper- series/08042006_OccasionalPaper4.pdf. Filat-Castejón, Carmen, Joseph F. Francois, and Julia Wörz, “Cross-Border Trade and FDI in
Services.” February 2009. Ganesan, Vasantha. “Taking the Sting out of Medical Bills.” New Straits Times, March 10, 2007. Golub, Stephen. “Openness to Foreigh Direct Investment in Services: An International
Comparative Analysis.” World Economy, vol. 32, issue 8, August 2009, 1245-1268. Government of Malaysia. Prime Minister’s Department. Economic Planning Unit. Ninth
Malaysia Plan, 2006–2010. Putrajava, 2006. ———.Tenth Malaysia Plan, 2011–2015. Putrajaya, 2010. Grünfeld, Leo A., and Andreas Moxnes. “The Intangible Globalization: Explaining the Patterns
of International Trade in Services.” Norwegian Institute of International Affairs. Working Paper 657, 2003.
———. “The Intangible Globalization,” 2003, 7. ———. “The Intangible Globalization,” 2003, 20–21. Haq, Robeel. “Halal Logistics Hits the Middle East.” ITPBusiness.net, May 29, 2006.
http://www.halaljournal.com/artman/publish/article_793.shtml. Hashim, Salmy. “Bumi Preferences Pose a Hurdle in U.S.-Malaysia FTA Talks.” Bernama.com,
January 13, 2007. http://www.bernama.com/bernama/v3/printable.php?id=241114. Helpman, Elhanan, Marc Melitz, and Yona Rubinstein. “Estimating Trade Flows: Trading
Partners and Trading Volumes.” NBER Worker Paper W12927, February 2007, 1. Inland Review Board of Malaysia. “Tax Relief Summary: List of Tax Relief for Resident
Individuals 2010,” n.d. (accessed January 4, 2010). International Monetary Fund (IMF). Balance of Payments Manual, 1993.
http://imf.org/external/pubs/ft/bopman/bopman.pdf. ———.“Balance of Payments and International Investment Position Manual, Sixth Edition (BPM6),” December 2008, 263–266. ———. “Representative Exchange Rates for Selected Currencies for December 2008,” n.d.
(accessed January 4, 2010).
38

———. “Representative Exchange Rates for Selected Currencies for January 2010,” n.d. (accessed January 4, 2010).
Islamic Finance News. “Al-’Aqar KPJ REIT: The World’s First Listed Islamic Healthcare REIT.”
Deals of the Year 2006 Handbook, n.d. http://www.islamicfinancenews.com/HanbookPDF/8.Al-Aqar.pdf (accessed June 24, 2008).
Islamic Foods and Nutrition Council of America. “Frequently Asked Questions: What Is Halal?” http://www.ifanca.org/halal/ (accessed June 29, 2009). Japanese Ministry of Economy, Trade and Industry (METI). Report on Compliance by Major
Trading Partners with Trade Agreements: WTO, FTA/EPA, BIT, April 2007. http://www meti.go.jp/English/report/data/gCT07_1coe.html (accessed October 8, 2009).
Johor Corporation Web site. “Corporate Profile,” n.d. http://www.jcorp.com.my/ (accessed June
24, 2008). Joint Commission International. “Joint Commission International (JCI) Accredited
Organizations,” 2007. http://www.jointcommissioninternational.org/23218/iortiz/ (accessed multiple dates).
Khoon, Chan Chee. “Privatizing the Welfare State: Health Care Reforms in Malaysia.” New
Solutions 13, no. 1 (2003): 87–105. Kimura, Fukunari, and Hyun-Hoon Lee. “The Gravity Equation in International Trade in
Services.”Review of World Economics 142, no. 1 (April 2006): 92 – 121. Leng, Chee Heng. Medical Tourism in Malaysia: International Movement of Healthcare
Consumers and the Commodification of Healthcare. Asia Research Institute. National University of Singapore. Asia Research Institute Working Paper Series 83, January 2007. http://www.ari.nus.edu.sg/docs/wps/wps07_083.pdf.
Mahmood, Amir. “Malaysia’s Export Competitiveness in Services and the Third Malaysia
Industrial Master Plan: Issues, Assessment, and Prospects,” October 8, 2007. http://www.epu.gov.my/mdi1/mdi/files/Malaysian_Services_Trade_EPU2007_SV.pdf.
Malaysia Industrial Development Authority. “Services Sector Overview,” n.d.
http://www.mida.gov.my/en_v2/index.php?page=services-sector (accessed January 10, 2010).
———. “Malaysia’s Growing Logistics Services,” February 23, 2007. Malaysian-German Chamber of Commerce and Industry. “Market Watch 2010: The Healthcare
Sector in Malaysia,” n.d. (accessed January 10, 2010). Malaysian Industrial Development Authority (MIDA). “Promotion of Services in Malaysia.”
Investment Opportunities in the Services Sector, April 27, 2007. http://www.mida.gov.my/. (accessed January 10, 2010).
39

Mark, Ken. “Global Ambition: Malaysia.” Canadian Transportation & Logistics 110, no. 10 (October 2007): 28−31.
MASkargo. “Kargo Udara Mas,” n.d.
http://www.maskargo.com/module.php?folder=products&filename=pkum (accessed July 2, 2008).
Maybank Group. Annual Report 2007, September 7, 2007.
http://www.maybank2u.com.my/corporate/financial_info.shtml. ———. Annual Report 2009, 2009, 58. Meng, YB Dato’ Chua Jui. “The Briefing Session for Contract Doctors from the Arab Republic
of Egypt.” Transcript of speech, March 2, 2004. http://www.moh.gov.my/MohPortal/speechDetail.jsp?action=view&id=79.
Ministry of Health Malaysia. “Bahagian Telekesihatan (Telehealth Flagship Project),” n.d.
http://www.moh.gov.my/opencms/opencms/moh/bhg_telekesihatan.html (accessed June 19, 2008).
———. Health Facts 2004, October 2005. ———. Health Facts 2008, May 2009. Ministry of International Trade and Industry Malaysia. “Industry Profile: Services: Healthcare,”
n.d. http://www.miti.gov.my/cms/content.jsp?id=com.tms.cms.section.Section_6393a556-c0a8156f-5cff5cff-ecbc7990 (accessed June 2008).
———. Malaysia: International Trade and Industry Report 2007, July 2008.
http://www.miti.gov.my. ———. Malaysia: International Trade and Industry Report 2008, July 2009.
http://www.miti.gov.my. ———. “Official Portal of Ministry of International Trade and Industry Malaysia,” n.d.
http://www.miti.gov.my/cms/index.jsp (accessed July 2, 2008). ———. Telephone interview by USITC staff, August 8, 2008. Ministry of Tourism Malaysia. “Tax Incentives,” n.d.
http://www2.motour.gov.my/index.php/english/tax.html (accessed June 3, 2008). New Straits Times (Business Times). “Pantai to Expand Overseas Ops,” December 7, 2004.
http://www.pantai.com.my/site.cfm?hid=7&sec=newslet&prMode=0&pr_select=63. Organisation for Economic Co-operation and Development . OECD. Stat Extracts: Trade in
Services by Partner Country Database (accessed August 2009).
40

ParkwayHealth. “Global Presence,” n.d. http://www.parkwayhealth.com/Management/Global_Presence.asp (accessed June 25, 2008).
Portsworld.com Malaysia. “Port Klang Authority,” n.d.
http://www.portsworld.com/portauthorities/pka.htm (accessed November 2, 2007). ———. “Record Performance by Malaysian Ports,” February 11, 2008.
http://www.portsworld.com/news/pw1feb11_08.htm. Public Bank Berhad. Annual Report 2007, 2007. http://ww2.publicbank.com.my/. Putzger, Ian. “Grounded.” Journal of Commerce (15307557) 7, no. 38 (2006): 44–45. ———. “MAS Momentum.” Air Cargo World 92, no. 6 (June 2002): 18–21. ———. “Searching for Space.” Air Cargo World 97, no. 3 (March 2007): 32–38. Rasiah, Rajah. “Trade-Related Investment Liberalization under the WTO: The Malaysian
Experience.” Global Economic Review 34, no. 4 (December 2005): 453–71. http://www.tandf.co.uk/journals/titles/1226508x.asp.
Shaw, Charles. “Accreditation and ISO: International Convergence on Health Care Standards.”
International Journal for the Quality in Health Care 9, no. 1 (1997): 11–13. Small and Medium Industries Development Corporation (SMIDC). “SME Annual Report 2008,”
2009. http://www.smidec.gov.my/ (accessed May 13, 2010). ———. “Definition of SMEs by Size,” 2008. http://www/smidec.gov.my/detailpage.jsp?page=defsme (accessed June 29, 2009). ———. “SME Information & Advisory Centre: Statistics,” 2008. http://www.smidec.gov.my/detailpage.jsp?statistic (accessed June 29, 2009). ———. “SME Information & Advisory Centre: Financial Assistance Scheme for SMEs in the Services Sectors,” 2008. http://www.smidec.gov.my/detailpage.jsp?statistic (accessed July 7, 2009). Sohail, M. Sadiq, Rohit Bhatnagar, and Amrik S. Sohal. “A Comparative Study on the Use of
Third Party Logistics Services by Singaporean and Malaysian Firms.” International Journal of Physical Distribution and Logistics Management 36, no. 9 (November 2006): 690–701.
Sun, The. “Pantai: Health Tourism to Drive Growth,” September 15, 2004.
http://www.pantai.com.my/site.cfm?hid=1&sec=newslet&prMode=0&pr_select=61. Tinbergen, Jan. Shaping the World Economy: Suggestions for an International Economic Policy.
(Twentieth Century Fund: New York), 1962.
41

Tongzon, Jose. “Determinants of Competitiveness in Logistics: Implications for the ASEAN Region.” Maritime Economics and Logistics 9, no. 1 (March 2007): 67–83. http://www.palgrave-journals.com/mel/.
Tourism Malaysia. Advertising and Publicity Division. “Health Tourism in Malaysia,” November
5, 2007. http://www.tourism.gov.my/tourismbiz/media_centre/articles/travelideas/PR%20Health%20Tourism%206%20Nov%2007.pdf.
Treasury Malaysia. Economic Report 2007/2008, 2007.
http://www.Treasury.gov.my/inoex.php?che33*pg=165+ac=2053+lang=eng. ———. Economic Report 2008/2009, 2008.
http://www.treasury.gov.my/ndex.php?option=com_content+view=article_id=776%3Alaporan-elconomi-20082009+calid=73%3Asenarai-laporan-ekaromi+Trend=174*lang=en.
———. Economic Report 2009/2010, 2009. http://www.treasury.gov.my/index.php?option=com_content&view=article&id=1340%3
Alaporan-ekonomi-20092010&catid=73%3Asenarai-laporan-ekonomi&Itemid=174&lang=en.
U.N. World Tourism Organization (UNWTO). Yearbook of Tourism Statistics, 2006 and 2008,
______. CDROM. United States Trade Representative (USTR). “Malaysia.” 2008 National Trade Estimate Report
on Foreign Trade Barriers, 2008. http://www.ustr.gov/assets/Document_Library/Reports_Publications/2008/2008_NTE_Report/asset_upload_file356_14651.pdf.
U.S. Department of Commerce (USDOC). Bureau of Economic Analysis (BEA). “U.S.
International Services: Cross-Border Trade in 2007 and Sales through Affiliates in 2006.” Survey of Current Business 88, no. 10 (October 2008): 16–62.
———. “U.S. International Services: Cross-Border Trade in 2008 and Sales Through Affiliates
in 2007.” Survey of Current Business 89, no.10 (October 2009): 40–64. U.S. Department of State. “Background Note: Malaysia,” December 2008.
http://www.state.gov/r/pa/ei/bgn/2777.htm. U.S. Foreign and Commercial Service (US&FCS) and U.S. Department of State. Doing Business
in Malaysia: 2008 Country Commercial Guide, February 21, 2008. http://www.buyusainfo.net/docs/x_8631291.pdf.
Walsh, Keith. “Trade in Services: Does Gravity Hold? A Gravity Model Approach to Estimating
Barriers to Services Trade.” Business School, Dublin City University. Institute for International Integration Studies Discussion Paper 183, October 2006. http://www.tcd.ie/iiis/documents/discussion/pdfs/iiisdp183.pdf.
World Bank. “World Development Indicators (WDI) Online Database.” http://ddp-
ext.worldbank.org/ext/DDPQQ/member.do?method=getMembers&userid=1&queryId=6 (accessed various dates).
42

World Health Organization (WHO). Global Health Statistics 2008. Geneva: WHO Press, 2008.
http://www.who.int/whosis/whostat/EN_WHS08_Table4_HSR.pdf. ———. “Malaysia.” Country Profiles, March 2010. World Trade Organization (WTO). General Agreement on Trade in Services (GATS). “Malaysia:
Schedule of Specific Commitments.” GATS/SC/52, April 15, 1994. ———. “Malaysia: Revised Offer.” TN/S/O/MYS/Rev.1, January 31, 2006. World Trade Organization (WTO). Trade Policy Review Body. “Trade Policy Review Report by
the Secretariat Malaysia Revision.” WT/TPR/S/156/Rev.1, March 9, 2006. ———. “Trade Policy Review Report by the Secretariat, Malaysia.” WT/TPR/S/225, December
14, 2009. Yon, Rohaizat. “Financing Health Care in Malaysia: Safety Net for the Disadvanged Groups
Including Pensioners, Elderly People, the Poor and the Disabled.” NCD Malaysia 3, no. 2 (2004): 43–46.
Yong, Elaine. “Tapping Into the Healthcare Services Sector in Malaysia.” Australia-Malaysia Business Council, April 15, 2003.
http://www.ambcwa.org/articles/Article_Health_Care_services.pdf (accessed June 11, 2008).
Yong, H. E. Ong Keng. “Towards a Free Flow of Services in ASEAN.” Presented at the opening of the ASEAN Forum on Trade in Services, Hanoi, Vietnam, July 5, 2005. http://www.aseansec.org/17536.htm.
43

44
Appendix
TABLE A.1 Summary statistics 2000–06
Variable Observations Mean Standard Deviation Minimum Maximum
ln (services imports) 4582 4.54 2.53 -4.91 10.66
ln (importer’s GDP) 4554 25.92 1.47 22.45 29.26
ln (exporter’s GDP) 4682 26.34 1.36 23.73 30.05
ln (distance) 4682 8.15 1.12 4.09 9.87
ln (importer’s remoteness) 4682 -12.60 0.91 -13.86 -10.98
ln (exporter’s remoteness) 4682 -12.07 1.38 -15.99 -9.77
Adjacency 4682 0.07 0.25 0 1
Common language 4682 0.08 0.27 0 1
Services FDI restrictiveness 4682 0.24 0.14 0.04 0.67 TABLE A.2 Summary statistics 2004
Variable Observations Mean Standard Deviation Minimum Maximum
ln (services imports) 881 4.72 2.43 -4.39 10.49
ln (importer’s GDP) 873 25.92 1.45 22.74 29.22
ln (exporter’s GDP) 897 26.28 1.31 23.87 29.99
ln (distance) 897 8.13 1.12 4.09 9.87
ln (importer’s remoteness) 897 -14.29 0.92 -15.56 -12.56
ln (exporter’s remoteness) 897 -12.33 0.59 -20.11 -11.83
Adjacency 897 0.07 0.25 0 1
Common language 897 0.08 0.27 0 1
Services FDI restrictiveness 897 0.24 0.14 0.04 0.67
TABLE A.3 Correlation matrix 2000–06 lnYi lnYj lnDij lnREMi lnREMj Aij CLij SFDIRij
lnYi 1.00
lnYj 0.10 1.00
lnDij 0.20 0.14 1.00
lnREMi 0.29 0.07 0.79 1.00
lnREMj -0.12 -0.97 -0.09 -0.07 1.00
Aij 0.07 0.03 -0.44 -0.19 -0.06 1.00
CLij 0.05 0.10 0.04 0.10 -0.07 0.18 1.00
SFDIRij 0.05 0.03 0.44 0.56 -0.02 -0.11 0.06 1.00

TABLE A.4 Correlation matrix 2004
lnYi lnYj lnDij lnREMi lnREMj Aij CLij SFDIRij
lnYi 1.00
lnYj 0.09 1.00
lnDij 0.21 0.14 1.00
lnREMi 0.26 0.06 0.81 1.00
lnREMj -0.18 -0.39 -0.06 -0.06 1.00
Aij 0.06 0.03 -0.44 -0.21 -0.10 1.00
CLij 0.06 0.09 0.03 0.09 -0.06 0.19 1.00
SFDIRij 0.07 0.04 0.46 0.56 -0.02 -0.12 0.06 1.00
45