an overview of column selectivity for reversed-phase hplcschulzov/hplc/materialy pro...
TRANSCRIPT

1
1LC Resources
An Overview of Column Selectivityfor Reversed-Phase HPLC
John W. Dolan, Lloyd R. Snyder, Nan S. Wilson
LC Resourcesand
BASi Northwest Laboratory
This paper is a progress report on work we’ve been doing in our lab over the last 4years to help get a better understanding of column selectivity.

2
2LC Resources
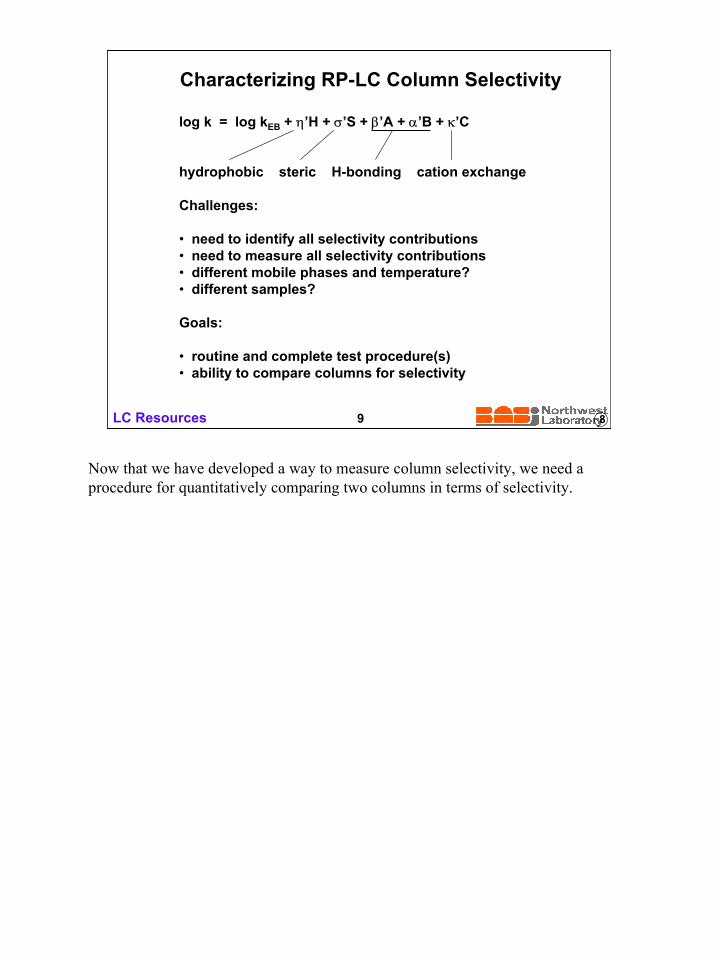
Characterizing RP-LC Column Selectivity
Goals:
• routine and complete test procedure(s)• ability to compare columns for selectivity
Challenges:
• need to identify all selectivity contributions• need to measure all selectivity contributions• different mobile phases and temperature?• different samples?
log k = log kEB + η’H + σ’S + β’A + α’B + κ’C
hydrophobic steric H-bonding cation exchange
Why do we want to characterize column selectivity? For two reasons: first, in orderto select replacement columns that will give the same separation. For example,when a column we have been using is no longer available. Second, to choose acolumn of very different selectivity. In method development we sometimes need tochange selectivity in order to separate overlapping bands. We might also want avery different column for an orthogonal separation.Our goal is to develop a column test that describes all the interactions thatcontribute to column selectivity: hydrophobicity, hydrogen-bonding, ionicinteraction, and so on. Dozens of workers have been working toward this goal forthe past 30 years – so far, with what might be termed limited success. Thechallenges we face include the problem of identifying all the importantcontributions to column selectivity and then measuring these column properties. Wealso need to show that column selectivity defined in this way does not change withseparation conditions or the nature of the sample. Otherwise, we would need to testcolumn selectivity for every possible condition and all possible samples – not verypractical!For the past 4 years we have been looking at a new approach to this problem. Someof you will be familiar with the equation we have developed to describe sampleretention as a function of column selectivity. We will look at this equation again ina moment, but first let’s look at how this equation evolved.

3
3LC Resources
log
k ( In
ert s
il )
log k (average for 10 columns)
Variations in Retention: Inertsil ODS-3 vs. “average” type-B C18 column
There is one important contribution to reversed-phase retention that everyone agreeson, namely hydrophobic interaction of column and sample. If hydrophobicity werethe only column property that affected selectivity, a plot of log k for one column vsanother would give a straight line, with all the points on the line. This is illustratedhere for data for an Inertsil column plotted vs average values for 10 different C18columns. And we do see that most of the points, one for each compound, fall on asingle line. The slope of this plot depends on the hydrophobicity of the Inertsilcolumn compared to the average of 10 columns. We can determine columnhydrophobicity or the value of H from this slope.There are also deviations from this plot, which all chromatographers should begrateful for. These deviations reflect differences in column selectivity that can beused to our advantage. We can see these deviations better in the next slide.

4
4LC Resources
Variations in retention: Inertsil ODS-3column vs. “average” type-B C18 column
+5%
∆
strong basesR-COOHalkyl amide
Here the correlation line is bracketed by dashed lines which represent ±5%deviations in k. Deviations larger than this can result in changes in resolution by aunit or more, and are therefore highly significant. We see for this part of the plotthat 7 compounds deviate by more than 5%; for the entire plot of 67 compounds,there were 26 similar deviant points: about one compound out of three. For each ofthese deviating points we can determine the size of the deviation, which we calldelta (circled data).When we collect values of delta for all the deviating compounds and all of thecolumns, we find that different compounds can be grouped on the basis of similardelta values as a function of the column.

5
5LC Resources
Grouping of Non-hydrophobic Interactions
∆ #46 ∆ #72
∆ #35
∆ #72 ∆ #48
∆ #46
∆ #35 ∆ #48
r2 = 0.98 r2 = 1.00
r2 = 0.25 r2 = 0.19
σ’S κ’CNO2
nitrochalconenitrochalcone
2-nitrobiphenylamitriptyline
propranolol
This is illustrated for 4 of these deviating compounds. Compounds #35 and 72happen to be nitrochalcone and 2-nitrobiphenyl. We see that their delta values arehighly correlated, which would be the case if the same interactions are causing thesedeviations delta. It turns out that delta values for these two compounds determinethe sigma’-S term of our equation. Likewise for compounds #46 and 48, a similarcorrelation of delta values results. These compounds are two strong bases –amitriptyline and propranolol – and their delta values can be assigned to the kappa’-C term of our equation.When delta values for compounds #35 and 46 or #48 and 72 are compared, there islittle or no correlation. The reason is that delta values for these compounds are notcaused by the same sample-column interaction.

6
6LC Resources
Interpretation of Non-hydrophobic Interactions:κ’C
κ’
(molecular charge)
acidsbases
• decreases with end-capping• increases with pH• increases with silica acidity (type-A vs type-B)
BH+
O-O O
κ’ C
Once we have grouped different deviating compounds in this way, and expressedvalues of delta by different terms in our equation, the next question is: what causeseach of these deviations? Can we relate these deviations to specific column-sampleinteractions? If so, this strengthens our entire analysis, and provides a means ofcharacterizing column selectivity completely and quantitatively.Well, it turns out we can do this for each of the 5 terms of our equation. This slide isone example, for the kappa’-C term which measures ionic interaction betweenionized acids or bases and the negative charge on the column due to ionizedsilanols. First, we see that the sample parameter kappa’ correlates well with ioniccharge. Ionized acids with a negative charge are repelled from the negativelycharged column, and have negative value of kappa’. Ionized bases are similarlyattracted by the negative column charge and give positive values of kappa’.If we look at the column parameter C, we find as expected that end-capping resultsin a decrease in C. When the ionized silanols are blocked by end-capping, they arenot as effective. Similarly, an increase in pH leads to an increase in silanolionization, which also means larger values of C. Finally, acidic silicas (or type-A)are more ionized and also give larger values of C.

7
7LC Resources
Characterizing RP-LC Column Selectivity
log k = log kEB + η’H + σ’S + β’A + α’B + κ’C
hydrophobic steric H-bonding cation exchange
Challenges:
• need to identify all selectivity contributions• need to measure all selectivity contributions• different mobile phases and temperature?• different samples?
Goals:
• routine and complete test procedure(s) • ability to compare columns for selectivity
6
So, returning to our first slide, we can now see the way in which our equation forcolumn selectivity has been developed and validated. This is only a small part of thestory, with a lot of other correlations that back up this simple picture of columnselectivity. Because this equation predicts sample retention with an accuracy of 1-2%, we are justified in believing that all important contributions to columnselectivity have been identified and measured. We have also studied the effect ofchanges in the mobile phase or temperature on the column parameters: H, S, and soon. A change in pH changes silanol ionization and changes the value of C, but otherchanges in conditions do not affect column selectivity. So, measurements of thecolumn parameters for one set of conditions and as a function of pH completelydefines column selectivity. Because we have looked at a very wide range in samplestructures, we think this equation will work as well for any sample.For example, besides the usual substituted alkanes and benzenes, we have looked ata number of very different structures. Next slide illustrates a few of thes.

8
8LC Resources
Illustrative Test Compounds
H
OH
Cl
(acid) (quat)
(base)
The 150 or so compounds we have tested so far include a lot of simple moleculessuch as mono-substituted benzenes and alkanes. These kinds of test compoundshave been widely used for column testing by other groups. But we have alsoincluded a diverse group of molecular structures, involving in many casesconsiderable molecular complexity. And these are just a few examples.Because we have challenged our equation with compounds like this, and found thatit is accurate to better than 2%, we are reasonably confident that it will work formost samples.
9
9LC Resources
Characterizing RP-LC Column Selectivity
log k = log kEB + η’H + σ’S + β’A + α’B + κ’C
hydrophobic steric H-bonding cation exchange
Challenges:
• need to identify all selectivity contributions• need to measure all selectivity contributions• different mobile phases and temperature?• different samples?
Goals:
• routine and complete test procedure(s) • ability to compare columns for selectivity
8
Now that we have developed a way to measure column selectivity, we need aprocedure for quantitatively comparing two columns in terms of selectivity.

10
10LC Resources
Comparing Columns
• need similar columns as replacements
• need different columns for method development
• how to compare?
log k (Discovery C8)
log
k (In
erts
il C
8)
SD = 0.13
0 2 4 6Time (min)
1+2
8+95
3 46
7
Inertsil C8
Discovery C8
0 2 4Time (min)
1
2 3 4
5
6• 8
9
We have measured values of the column parameters H, S, etc. for 150 differentreversed-phase columns; how do we select columns that are either similar ordifferent. Similar when we want to replace a column used in a routine procedure orhave a reliable backup, or different when we want to change selectivity in methoddevelopment?One way of comparing column selectivity is to plot log k for one column againstanother, using a sample with different kinds of test compounds. In this example, wehave plotted data of this kind for an Inertsil C8 column vs a Discovery C8 column.We see some scatter in the data, or a standard deviation of 0.13 log units – that’s adeviation of ±35%. Obviously, these two columns are not very similar, as can beseen the the corresponding separations on the two columns.

11
11LC Resources
Comparing Columns
• need similar columns as replacements
• need different columns for method development
• how to compare?
• for neutral samples, only H, S, A important
H
S
A
(H1, S1, A1)
(H2, S2, A2)
difference in selectivity = Fs
= distance between two pointsFs = {(H2-H1)2 + (S2-S1)2 + (A2-A1)2}1/2
so: small Fs, similar columns large Fs, different columns
Plotting retention data as we did in the last slide is a tedious way of comparingcolumns, especially if there are a lot of columns to choose from. Since we now havevalues of the column parameters for 150 columns, there is an easier way. As a firstexample, suppose we have a sample that consists of neutral compounds only. In thiscase, the column parameters B and C will not be important, which simplifies ourillustration. That is, column selectivity now depends only on hydrophobicity H,steric interaction S, and column H-bond acidity A.In the 3-dimensional diagram on the left we show the positions of two columns in aplot of H, S and A. That is, values of H, S and A for each column determine theposition of each data point. Now, it is logical to measure column similarity by thedistance between two columns in this plot. Let’s call that distance, measured incolumn parameter units, as Fs. By analogy with the Pythagorean theorem, Fs isgiven by the expression on the right as a function of the values of H, S and A for thetwo columns.

12
12LC Resources
Fs
SD
r = 0.972
Comparing Columns
For any sample (both neutral and ionic compounds:
Fs = {(H2-H1)2 + (S2-S1)2 + (A2-A1)2 + (B2-B1)2 + (C2-C1
)2}1/2
10 type-B C18 columns
Fs ≈ 3
If we consider all five column parameters, the preceding equation for Fs can bewritten as in this slide. But how well does Fs correlate with column selectivity asmeasured by plots of log k for two columns? The plot on the right compares valuesof the standard deviation from log k plots with values of Fs calculated as in thisslide. We see reasonable agreement, so we must be on the right track. The smalleris Fs, the more similar are two columns. But how large can Fs be, and still haveequivalent separations for two columns?This is illustrated in the plot on the left, which is a blowup of a portion of the plot onthe right. We have also added some more data points from some other columncomparisons. A general rule is that values of the standard deviation should be nogreater than about 0.01, or ±3% in values of the separation factors, α. From thisplot, we see that Fs should not be greater than 3 for two columns to give the sameseparation (SD <≈0.01).
13
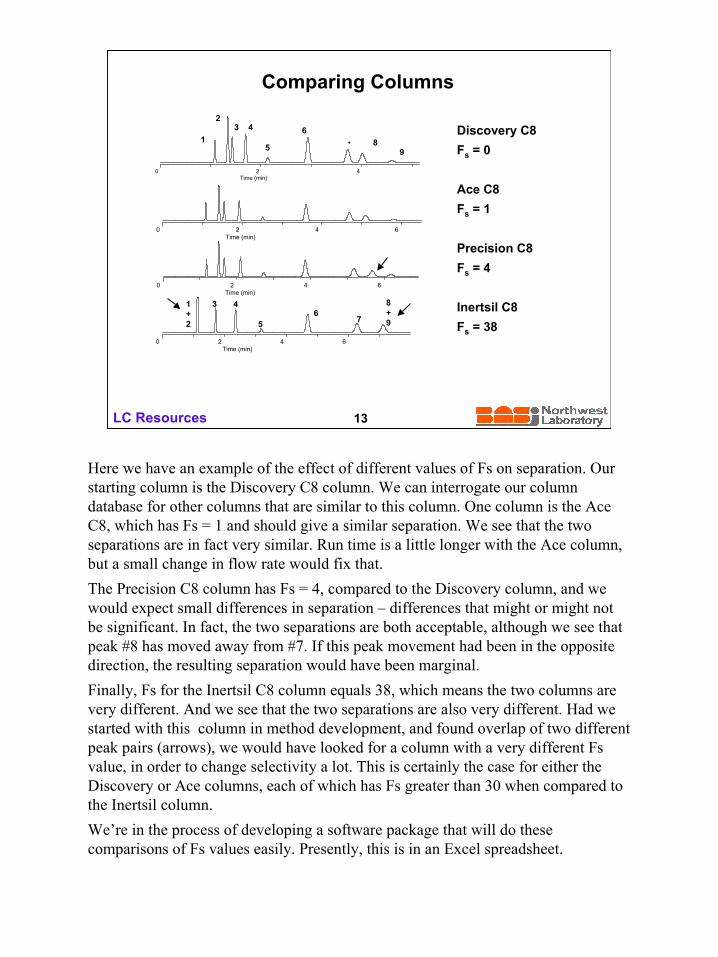
13LC Resources
Comparing Columns
Discovery C8Fs = 0
Ace C8Fs = 1
Precision C8Fs = 4
Inertsil C8Fs = 38
0 2 4 6Time (min)
0 2 4 6Time (min)
0 2 4Time (min)
1
2 3 4
5
6• 8
9
0 2 4 6Time (min)
1+2
8+95
3 46
7
Here we have an example of the effect of different values of Fs on separation. Ourstarting column is the Discovery C8 column. We can interrogate our columndatabase for other columns that are similar to this column. One column is the AceC8, which has Fs = 1 and should give a similar separation. We see that the twoseparations are in fact very similar. Run time is a little longer with the Ace column,but a small change in flow rate would fix that.The Precision C8 column has Fs = 4, compared to the Discovery column, and wewould expect small differences in separation – differences that might or might notbe significant. In fact, the two separations are both acceptable, although we see thatpeak #8 has moved away from #7. If this peak movement had been in the oppositedirection, the resulting separation would have been marginal.Finally, Fs for the Inertsil C8 column equals 38, which means the two columns arevery different. And we see that the two separations are also very different. Had westarted with this column in method development, and found overlap of two differentpeak pairs (arrows), we would have looked for a column with a very different Fsvalue, in order to change selectivity a lot. This is certainly the case for either theDiscovery or Ace columns, each of which has Fs greater than 30 when compared tothe Inertsil column.We’re in the process of developing a software package that will do thesecomparisons of Fs values easily. Presently, this is in an Excel spreadsheet.

14
14LC Resources
Consulting the Column Selectivity Database
Match ColumnClose SUPELCO - Discovery C8
Reasonable Relative Importance:Poor
Rank Fs Column ret. ratio1 0.00 Discovery C8 1.02 0.88 Hypersil BetaBasic-8 0.53 1.27 Ace5 C8 1.54 3.35 Hypurity C8 1.15 3.87 Precision C8 1.56 5.09 Genesis EC C8 120A 2.1
Most Similar
Here’s how our preliminary software works.First we select the column we are trying to match: Supelco – Discovery C8 in thisexample. This immediately calls up columns that are judged similar on the basisselectivity. Notice the color coding, with green indicating columns that are “close”in selectivity to the column we are trying to match; that is, for which Fs <3. Thenwe have the “reasonable” columns in red; Finally, we have columns that are poorlymatched, for which Fs >5.The Ace5 C8 and Precision C8 were two of the columns we looked at in thecomparison of chromatograms in the previous slide.We also see a column labeled retention ratio. Even though we may have a goodselectivity match, two columns may differ in their relative retention or run time. Forexample, we see that the Hypersil BetaBasic-8 column is a good match to ourDiscovery C8 column, but it has half the retention. We could slow down our flowrate to compensate for this, but a better approach is to try for a column with a closermatch of the retention ratio. The best match is probably the Hypurity C8 column. Ithas a good retention match (1.1) and the Fs value is barely greater than 3. The nextslide shows the actual separation.

15
15LC Resources
Experiment vs Theory
0 2 4 6 8Time (min)
0 2 4 6 8Time (min)
Rs = 2.2 Discovery C8
Rs = 1.8 HyPurity C8
We see a little loss in resolution for peaks #2 and 3, but the HyPurity C8 separationis still acceptable. The run time for the HyPurity run is slightly greater than for theDiscovery separation, but an increase in flow rate from 1.5 to 1.55 mL/min wouldmake the two run times the same.If we know something about the sample, for example, if it contains acids but notbases, we can weight the Fs function to better correspond to reality. That is, we willget more reliable predictions of relative column selectivity. This also means that wecan find more columns that are similar to each other. If we do not consider sampletype, then our database program may reject columns that would otherwise beequivalent.

16
16LC Resources
What about Other RP-LC Column Types?
• type-A alkyl-silica columns
• alkyl-silica columns with an embedded polar group
• alkyl-silica columns end-capped with a polar group
• alkyl-zirconia columns
• phenyl, cyano and fluoro-columns
So far, we have looked in detail at four other column types: besides columns madefrom type-B silica, which is largely free of metal impurities, we have studiedcolumns made from type-A silica which contains metal and is more acidic, columnswith an embedded polar group, columns which are polar-end-capped, and alkyl-zirconia columns. Our correlational equation still works for these other columntypes, and it appears that the same interactions between sample and column areresponsible for column selectivity. So, we can still compare columns of one typewith another in the same way as the previous examples which used type-B columns.The next slide summarizes differences in these different column types.

17
17LC Resources
H S A B C
Type-B (95) 0.94 -0.01 -0.11 0.00 0.04
Type-A (38) 0.89 0.06 0.10 0.03 0.76
Embedded polar group (17) 0.68 0.00 -0.53 0.17 -0.28
End-capping polar group (4) 0.94 -0.02 -0.02 0.01 -0.14
Alkyl-zirconia (3) 0.97 -0.02 -0.62 0.00 2.01
hydrophobicity steric interaction
H-bond acidity H-bond basicity
cation exchange
Column type-differences (avg. values)
Here we have listed average value of each column parameter for each type ofcolumn so far studied. The first column type is type-B alkyl silica columns, whichnow includes 95 columns in the study. Let’s compare column parameters for all theother column types and see if they make sense.We see for type-A columns that values of A and C are much larger. Because type-Asilica is more acidic, this leads to stronger hydrogen bonding by silanols and largerA. It also leads to more ionized silanols and larger C. The results meet ourexpectations.Columns with an embedded basic group are much less hydrophobic, or more polar,because of the polar group. Likewise, column basicity B is much larger, whilecolumn acidity as measured by A and C is much smaller.Columns end-capped with a polar group are not much different from type-Bcolumns, presumably because of a smaller effect of the polar group on interactionsof sample and column, or a reduced concentration of polar groups.Finally, alkyl-zirconia columns have no silanol groups, therefore very small valuesof A. These columns also Adsorb phosphate ions from the mobile phase withincrease in column negative charge, therefore very large values of C.So the differences in the various column parameters fit our expectations. This givesfurther evidence that the parameters indeed describe the interactions we’veidentified.

18
18LC Resources
type-Btype-AEPGZr
0.4
0.3
0.2
0.1
0.0
-0.1
-3 -1 1 3
B
C
Here’s another way to compare the different column types.The individual column types can be grouped approximately according to columnbasicity B and acidity C, as seen in this slide. Type-B columns are grouped in atight cluster, while type-A columns are generally more acidic. Columns with anembedded polar group are more basic and less acidic, while columns that are polarend-capped overlap the type-B group. Alkyl-zirconia columns tend to be even moreacidic.This classification of columns leads to some overlap of columns of one type onanother, but this just emphasizes the fact that these column groupings are notcompletely distinct.

19
19LC Resources
0.5 1.0 1.5
0.0
-0.1
B
H
Type-B Columns: B varies inversely with H
+2.5 SD
r2 = 0.61
Let’s look next at column H-bond basicity or values of B.We see in this slide for type-B columns that there is an inverse correlation of valuesof B and H. This can be explained by column basicity being due to water sorbed bythe stationary phase. As H decreases, the column becomes more polar, and morewater is sorbed – increasing column basicity and values of B.Our experiments showed that there was no effect of end capping on columnbasicity, which indicates that the basic column contributions are not due to silanols.Further support for adsorbed water is the observation that for type-B columns,phenols and alcohols do not interact with the column basic groups; this can beexplained by two-fold interaction of water with acids (forming a 5-membered ring).

20
20LC Resources
0.4
0.3
0.2
0.1
0.0
-0.1
0.0 0.5 1.0 1.5
#24a #12a#21a
#11a #14a#22a
#23a#17a#36a #13a
#2a#1a
B
H
Type-A columns #37a
(Type-B)
Variation in B vs. H for Type-A Columns
In the next few slides we compare values of B and H for other kinds of columns,with the data spread for type-B columns superimposed.Looking at type-A columns first, we see that about 2/3 of the data points fall withinthe dashed lines from the previous slide. However, a remaining 1/3 of the points fallabove the dashed lines, corresponding to some additional contribution to columnbasicity. We believe that metals in the silica lattice can interact with carboxylicacids by chelation, hence accounting for the extra column basicity.

21
21LC Resources
Variation in B vs. H for EPG Columns0.4
0.3
0.2
0.1
0.0
-0.1
0.0 0.5 1.0 1.5
B
H
#18b #17b
polar end-cappedcolumn
#16b
(Type-B)
EPG Columns
Here we see results for the embedded polar group columns compared to type-Bresults. The polar-end-capped columns all fall within the error limits for the type-Bcolumns, suggesting that the basicity of these columns is due to sorbed water, notthe polar end-capping group.All but three of the embedded-polar-group columns, all but three fall above the errorlimits for type-B columns. This suggests that the basicity of these columns is due tosomething other than sorbed water, in agreement with our belief that the embeddedbasic polar group is responsible for this greater basicity.
22
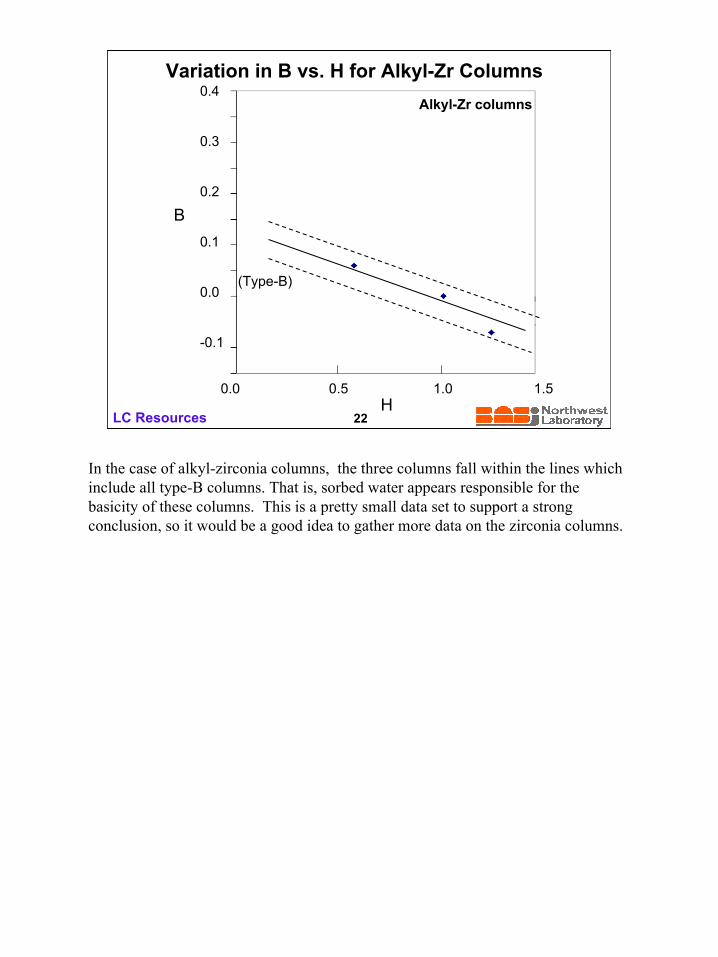
22LC Resources
Variation in B vs. H for Alkyl-Zr Columns0.4
0.3
0.2
0.1
0.0
-0.1
0.0 0.5 1.0 1.5
B
H
Alkyl-Zr columns
(Type-B)
In the case of alkyl-zirconia columns, the three columns fall within the lines whichinclude all type-B columns. That is, sorbed water appears responsible for thebasicity of these columns. This is a pretty small data set to support a strongconclusion, so it would be a good idea to gather more data on the zirconia columns.

23
23LC Resources
Conclusions
• column selectivity can be measured
• a database exists for ≈ 180 RP-LC columns of all kinds (>200 columns planned by end of year)
• columns in the database can be compared
-- either similar or different columns can be selected
• minor differences in selectivity can be corrected by method adjustment
• all of these capabilities will be supported by commercial software
reprints: www.basinorthwest.com
Let’s summarize what we’ve just looked at.First, we have reported a means of measuring column selectivity that seems todescribe the physical processes that take place when a solute interacts with thestationary phase. We’ve been able to identify a small set of solutes (8) that allowsus to predict the behavior of a given column toward other solutes.We have developed a database of about 180 columns including those with Type-Aand Type-B silica, zirconia, and several different POLAR-bonded phases. Thisallows us to find columns closely related to the initial column so that there is analternate column. We can also find a column that is drastically different from thecurrent column so that different selectivity can be obtained during methoddevelopment.We haven’t talked about method adjustment, but recently we’ve publishedtechniques that allow small adjustments in conditions to fine-tune selectivitymatches between similar columns.Finally, we’re in the process of converting our database into a commercial softwarepackage that will make this column comparison capability available to all workers.