an overview of fdi concepts and the significance of fdi in...
TRANSCRIPT
An Overview of FDI Concepts and the Significance of FDI in BRIC and in
India
43
CHAPTER III
AN OVERVIEW OF FDI CONCEPTS AND THE SIGNIFICANCE OF
FDI IN BRIC AND IN INDIA
3.1 Conceptual Understanding of Foreign Direct Investment
Trade has always been a vital part of economy and with the concept of
globalization it reaches to the international level. Foreign direct investment (FDI) has
proved to be resilient during financial crises. The role of Foreign Direct Investment (FDI)
in this development is very crucial. It is widely recognized that foreign direct investment
(FDI) produces economic benefits to the recipient countries by providing capital, foreign
exchange, technology and by enhancing competition and access to foreign markets.
Foreign Direct Investment take place when an investor based in one country acquires
asset in another country in this process, the company investing in the host country also
transfers assets such as technology, management and marketing.
In addition to this the investing company also get chances of power to exercise
control over decision making in a foreign land enterprise to the extent of which it held
equity control such investment could also be in the form of reinvestment of earning in the
shape of retained earnings by the host country‘s enterprises that also strengthen the
control of foreign investors.
3.1.1 Definition of FDI as per IMF and OECD
According to the IMF and OECD definitions, direct investment reflects the aim of
obtaining a lasting interest by a resident entity of one economy (direct investor) in an enterprise
that is resident in another economy (the direct investment enterprise). The ―lasting interest‖
implies the existence of a long-term relationship between the direct investor and the direct
investment enterprise and a significant degree of influence on the management of the latter.
Direct investment involves both the initial transaction establishing the relationship between the
investor and the enterprise and all subsequent capital transactions between them and among
affiliated enterprises, both incorporated and unincorporated. It should be noted that capital
transactions which do not give rise to any settlement, like an interchange of shares among
affiliated companies, must also be recorded in the Balance of Payments and in the IIP.
44
The fifth Edition of the IMF‘s Balance of Payment Manual defines the owner of
10 percent or more of a company‘s capital as a direct investor. This guideline is not a
fast rule, as it acknowledges that smaller percentage may entail a controlling interest in
the company (and, conversely, that a share of more than 10 percent may not signify
control). But the IMF recommends using this percentage as the basic dividing line
between direct investment and portfolio investment in the form of shareholdings.
Thus when a non-resident who previously had no equity in a resident enterprise,
purchases 10 % or more of the shares of that enterprise from a resident, the price of
equity holdings acquired should be recorded as direct investment. From this moment, any
further capital transactions between these two companies should be recorded as a direct
investment. When a non-resident holds less than 10 per cent of the shares of an enterprise
as portfolio investment, and subsequently acquires additional shares resulting in a direct
investment (10 per cent of more), only the purchase of additional shares is recorded as
direct investment in the Balance of Payments. The holdings that were acquired previously
should not be reclassified from portfolio to direct investment in the Balance of Payments
but the total holdings should be reclassified in the IIP.
Concerning the terms direct investor and direct investment enterprise, the IMF
and the OECD define them as follows.
Direct Investor: A direct investor may be an individual, an incorporated or
unincorporated private or public enterprise, a government, a group of related
individuals, or a group of related incorporated and/or unincorporated enterprises
which have a direct investment enterprise, operating in a country other than the
country of residence of the direct investor.
Direct Investment Enterprise: A direct investment enterprise is an incorporated or
unincorporated enterprise in which a foreign investor owns 10 per cent or more of the
ordinary shares or voting power of an incorporated enterprise or the equivalent of an
unincorporated enterprise.
Direct investment enterprises may be subsidiaries, associates or branches that
could establish in the foreign country.
45
A subsidiary is an incorporated enterprise in which the foreign investor controls
directly or indirectly (through another subsidiary) more than 50 percent of the
shareholders‘ voting power. An associate is an enterprise where the direct investor and its
subsidiaries control between 10 percent and 50 percent of the voting shares. A branch is
a wholly or jointly owned unincorporated enterprise such as general partnerships and
limited partnerships.
It should be noted that the choice between setting up either a
subsidiary/associate or a branch in a foreign country is dependent, among other factors,
upon the existing regulations in the host country (and sometimes in its own country, too).
National regulations are often more restrictive for subsidiaries than for branches but this
is not always the case.
In the case of affiliated banks (depository institutions) and affiliated financial
intermediaries such as securities dealers, transactions recorded under direct investment
are those associated with permanent debt (loan capital representing a permanent
interest) and equity (share capital) investment.
In the case of branches, they are fixed assets. Deposits, loans and other claims
and liabilities related to usual banking transactions of depository institutions and of other
financial intermediaries are classified, as appropriate, under portfolio investment or
―other investment‖, but never as direct investment. The stock of foreign assets and
liabilities of banks and other financial intermediaries should be treated in a parallel
manner.
The OECD recommends in its Benchmark definition that for the existence of a
direct investment relationship the ―full consolidated system‖ should be followed. In other
words, it means that when there is a cascade of participations, the percentage of the parent
company in any affiliated companies should be calculated assuming the 100 percent of the
subsidiaries and the corresponding percentage of the associates. This criterion does not
correspond with the consolidation concept in the accounting statement.
From an accounting standpoint, bank branches are wholly considered as being an
integral part of their parent company and, therefore, do not have separate accounts.
However, the requirement for affiliated companies to be included in banks’ consolidated
46
financial statements is two fold: (i) they themselves must carry out a financial activity;
and (ii) at least 20 percent of their capital must be owned by their parent bank, together
with the latter‘s exerting an effective control over them. Non-compliance with any of
these requisites entails that the affiliated company is not consolidated, although it should
be valued according to the ―equity method‖ in its parent bank‘s financial statements.
In accordance with these consolidation rules, a bank will not include in its consolidated
statements the assets and liabilities of all its associates, despite the fact that such
associates may obviously be direct investment enterprises from a BOP/IIP viewpoint.
3.1.2 Valuation of FDI flows and stocks and relations between both of them
The Balance of Payments and the International Investment Position are compiled
under the same framework of methodological rules laid down in the Fifth edition of the
IMF Balance of Payments Manual. According to this, FDI transactions should be
recorded in the Balance of Payments at the accrued value, i.e. ―transactions are
recorded when economic value is created, transformed, exchanged, transferred, or
extinguished”. Thus, the flows recorded do not necessarily coincide with the liquid
proceeds and payments generated. In practice, it is very difficult to apply the accrued
principle to all transactions and many of them are therefore recorded at the time when the
proceeds or payments are generated.
3.1.3 Motives of FDI
One way of viewing FDI is in terms of natural (unskilled workers)
or created (skilled, professional workers) assets.
FDI can be either vertical (investing in suppliers, distributors, retailers) or
horizontal (investing in the same type of firm).
There are a variety of motives for a firm to engage in FDI:
Resource-seeking (location-specific)
Market-seeking (more about responding to market need than reducing costs)
Efficiency-seeking (choosing element in vertical FDI which will be most
beneficial to the company)
47
Strategic asset-seeking (created assets)
Trade/import substituting (requiring FDI to direct trade to avoid customs etc.)
3.1.4 FDI and Entry Modes
The choice of entry mode is considered a strategic decision by the foreign
investor. The key driving forces in such decisions depend on the investor‘s interest in
seeking resources, markets, and efficiency or strategic asset ownership in the host
country. While the major motive of any investment is profit, a firm may opt for a
particular entry strategy best suited to its short- or long-term interests. Basically, FDI can
be wholly owned or joint ventures and Foreign Direct Investment (FDI) inflows can take
place through any of the following entry modes:
Greenfield investment: Direct entry of foreign firms into host country is known as
―Greenfield‖ investment. A form of foreign direct investment where a parent company
starts a new venture in a foreign country by constructing new operational facilities from
the ground up. In addition to building new facilities, most parent companies also create
new long-term jobs in the foreign country by hiring new employees.
Cross Border Merger and Acquisition (M&A): A cross-border merger is a transaction
in which the assets and operation of two firms belonging to or registered in two different
countries are combined to establish a new legal entity. In a cross-border acquisition, the
control of assets and operations is transferred from a local to a foreign company, with the
former becoming an affiliate of the latter. The acquisition of existing domestic firms is
known as ―Cross Border Merger and Acquisition (M&A)‖ investment. The motives of
Cross-border Merger & Acquisitions include: the search for new markets, increased
market power and market dominance; access to proprietary assets; efficiency gains
through synergies; greater size; diversification (spreading of risks); financial motivations;
and personal (behavioural) motivations.
In a cross-border merger, the assets and operations of two different firms
belonging to two different countries join together to form a new legal entity. The stocks
of the companies are surrendered during the amalgamation process and the new
company‘s stocks are issued in the process. One such example is the merger of Essar and

48
Hutchison to form Hutchison Essar. As another example, Daimler-Benz and Chrysler
ceased to exist when the two firms merged, and a new company, Daimler Chrysler, was
created.
In a cross-border acquisition, the control of assets and operations is transferred
from a local to a foreign company. The local company ceases to exist and becomes an
affiliate of the foreign company. An acquisition can be forced through a majority interest
in the management, by purchasing shares in the open market, or by offering a take-over
proposal to the general body of the shareholders. For instance, Ranbaxy Labouratories as
part of its expansion strategy in the US market acquired the New Jersey-based Ohm
Labouratories in 1995. Vodafone‘s acquisition of Hutchinson Essar and Lenova‘s
takeover of IBM´s PC business are more recent examples.
Equity FDI may also include ―Brownfield investment‖, a term often used in the
FDI literature. This represents a hybrid of Greenfield and M&A foreign investment. Such
investment formally appears as M&A, though its effect resembles Greenfield investment.
In Brownfield investment, the foreign investor acquires a firm and undertakes near-
complete renovation of plant and equipment, labour and product lines (UNCTAD 2000).
Other primary modes of FDI entry including wholly Owned Enterprises (WOEs),
Equity Joint Ventures (EJVs), Contractual Joint Ventures (CJVs) and Joint Stock
Companies (JSCs) according to a mode of entry study carried out in China by Wei, Liu
and Liu, 2004. As already seen foreign direct investment (FDI) constitutes three
components; viz., equity; reinvested earnings; and other capital. These are the modes of
FDI that comes into a country under equity FDI.
3.1.5 Discrepancies in FDI data
As for the international comparison of data, despite a common international
methodological framework, discrepancies between countries do occur. In fact, the
worldwide discrepancy between outward and inward direct investment flows should be
zero, if all flows were recorded fully and consistently by both sides. Nevertheless,
according to Lipsey (2001) “the asymmetries have been no higher than 8 percent in any
year from 1993 to 1999, as contrasted with 40 or 50 percent for portfolio investment”.
49
Discrepancies are mainly due to the use of different criteria for valuation or for
geographical allocation of transactions. The increasing complexity of enterprise groups
poses a further challenge to the correct application of the directional principle for
accurately assessing FDI. Similarly, it is rather difficult to consistently capture loans
granted to or received from related enterprises and they are often incorrectly considered
as ―other investment‖, rather than as ―direct investment‖. This problem does not arise,
however, in the case of loans between banks since they are not considered as ―direct
investment‖. Additional circumstances resulting in discrepancies between countries are,
among others: the lack of information on reinvested earnings, the use of a percentage-
ownership threshold different from the recommended 10 percent level for identifying an
investment as direct, and the use of different reporting systems and exemption threshold
by countries for collecting and aggregating data on international transactions. Most
countries use a combination of sources to compile their balance of payments and
international investment position statistics. Data collection may be based on the
compulsory reporting of individual transactions or on aggregates, or alternatively data
may be collected by the statistical agency from an intermediary (such as a dealer that
handles security transactions for clients) or directly from the transactor by means of
mandatory surveys.
3.1.6 FDI and Economic development
FDI plays an important role in the transmission of capital and technology across
home and host countries. FDI inflows benefit the economic development of the host
country at large especially to developing economies which need more capital for its
economic development. These benefits are expected to be positive, although not
automatic and it may impact growth either directly of indirectly. Also these benefits may
have different levels of impact for different countries based on the sector of investment,
its quality and volume. The working assumption nowadays is that in a relatively
non-distorted domestic policy environment, foreign direct investment (FDI) brings in
much-needed capital, technical know-how, organisational, managerial and marketing
practices and global production networks, thus facilitating the process of economic
growth and development in host countries.
50
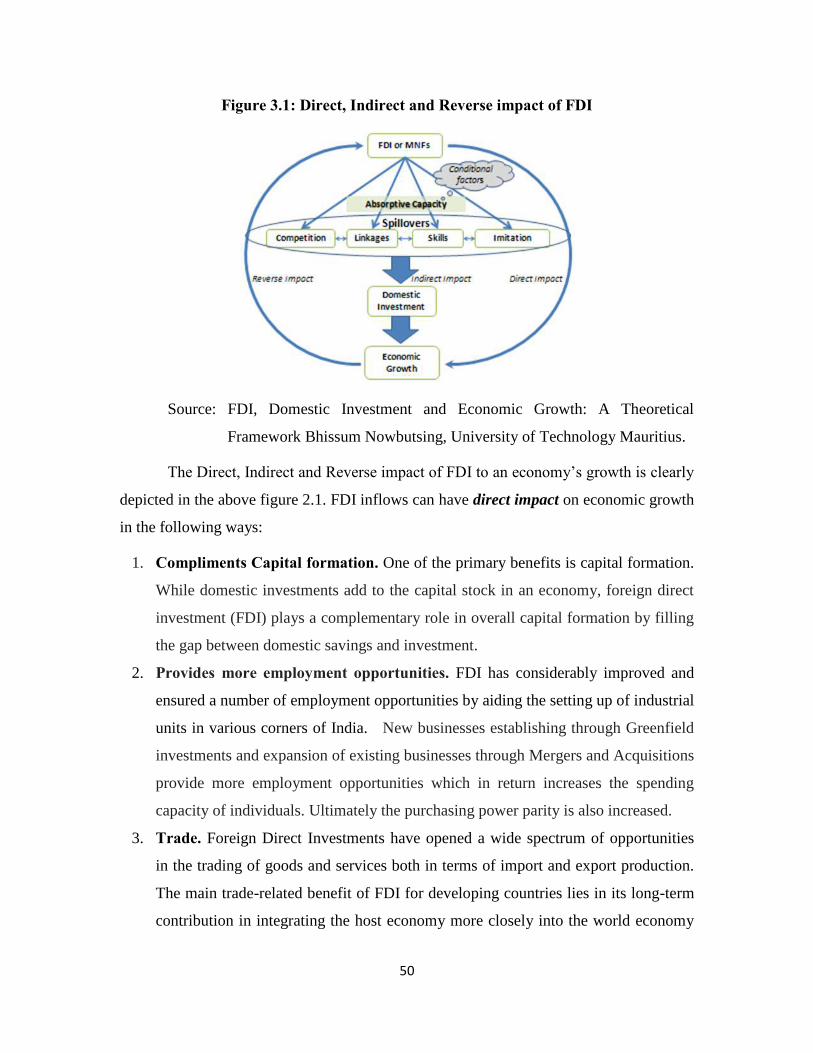
Figure 3.1: Direct, Indirect and Reverse impact of FDI
Source: FDI, Domestic Investment and Economic Growth: A Theoretical
Framework Bhissum Nowbutsing, University of Technology Mauritius.
The Direct, Indirect and Reverse impact of FDI to an economy‘s growth is clearly
depicted in the above figure 2.1. FDI inflows can have direct impact on economic growth
in the following ways:
1. Compliments Capital formation. One of the primary benefits is capital formation.
While domestic investments add to the capital stock in an economy, foreign direct
investment (FDI) plays a complementary role in overall capital formation by filling
the gap between domestic savings and investment.
2. Provides more employment opportunities. FDI has considerably improved and
ensured a number of employment opportunities by aiding the setting up of industrial
units in various corners of India. New businesses establishing through Greenfield
investments and expansion of existing businesses through Mergers and Acquisitions
provide more employment opportunities which in return increases the spending
capacity of individuals. Ultimately the purchasing power parity is also increased.
3. Trade. Foreign Direct Investments have opened a wide spectrum of opportunities
in the trading of goods and services both in terms of import and export production.
The main trade-related benefit of FDI for developing countries lies in its long-term
contribution in integrating the host economy more closely into the world economy
51
through higher imports as well as exports. In other words, trade and investment are
increasingly recognized as mutually reinforcing channels for cross-border activities.
When domestic savings and investment are incremented by foreign investments it
results in increased trade and productivity which will in turn provide more employment
and growth in foreign exchange earnings of a country. Ultimately contributes to an
increase in the Gross Domestic Product and thereby ensuring economic growth.
The indirect impact of FDI inflows to a country can be in the form of:
The indirect benefits are otherwise called as spillover benefits. The most common
factors are:
1. Competition. FDI and the presence of MNEs may exert a significant influence on
competition in host-country markets. However, since there is no commonly
accepted way of measuring the degree of competition in a given market, few firm
conclusions may be drawn from empirical evidence. The presence of foreign
enterprises may greatly assist economic development by spurring domestic
competition and thereby leading eventually to higher productivity, lower prices and
more efficient resource allocation.
2. Linkages. Vertical (backward and forward) linkages with suppliers or purchasers in
the host countries and horizontal linkages with competing or complementary
companies in the same industry will improve the efficiency of domestic suppliers
and enhances the domestic competitor‘s quality of business.
3. Technological and Managerial skills. FDI apparently benefits indirectly through
knowledge spillovers like; managerial skills and latest technology acquired from
foreign enterprises. This may result in domestic businesses and also enhances the
quality of domestic human capital.
4. Imitations. FDI has the potential to bring social and environmental benefits to host
economies through the imitation and dissemination of good practices and
technologies within MNEs, and through their subsequent spillovers to domestic
enterprises.
52
5. Improves the standard of living. Higher tax revenue from the foreign firms will
increase government spending on people‘s benefit. And the new jobs created
increases the purchasing power and thereby acquiring better standards of life.
6. Human capital enhancement. The major impact of FDI on human capital in
developing countries appears to be indirect, when the host country individuals are
employed by MNE subsidiaries, their human capital may be enhanced further
through training and on-the-job learning. Those subsidiaries may also have a
positive influence on human capital enhancement in other enterprises with which
they develop links, including suppliers. Such enhancement can have further effects
as that labour moves to other firms and as some employees become entrepreneurs.
Thus, the issue of human capital development is intimately related with other,
broader development issues.
These benefits happen only when the host country possess the appropriate
absorptive capacity of the economy. Which is depicted clearly in the above figure no.2.1
as conditional factors therefore a host economy welcoming FDI should also make
necessary environmental changes in such a way to absorb the fullest benefits of FDI and
reach economic development. More interestingly one of the most required factors for
attracting FDI to a country is its economic growth. Therefore economic growth attained
through FDI in turn serves to have a reverse impact on attracting further FDI inflows.
It can be rightly stated that this is a viscous cycle and countries have become more
competitive to advertise themselves on their FDI attractive factors.
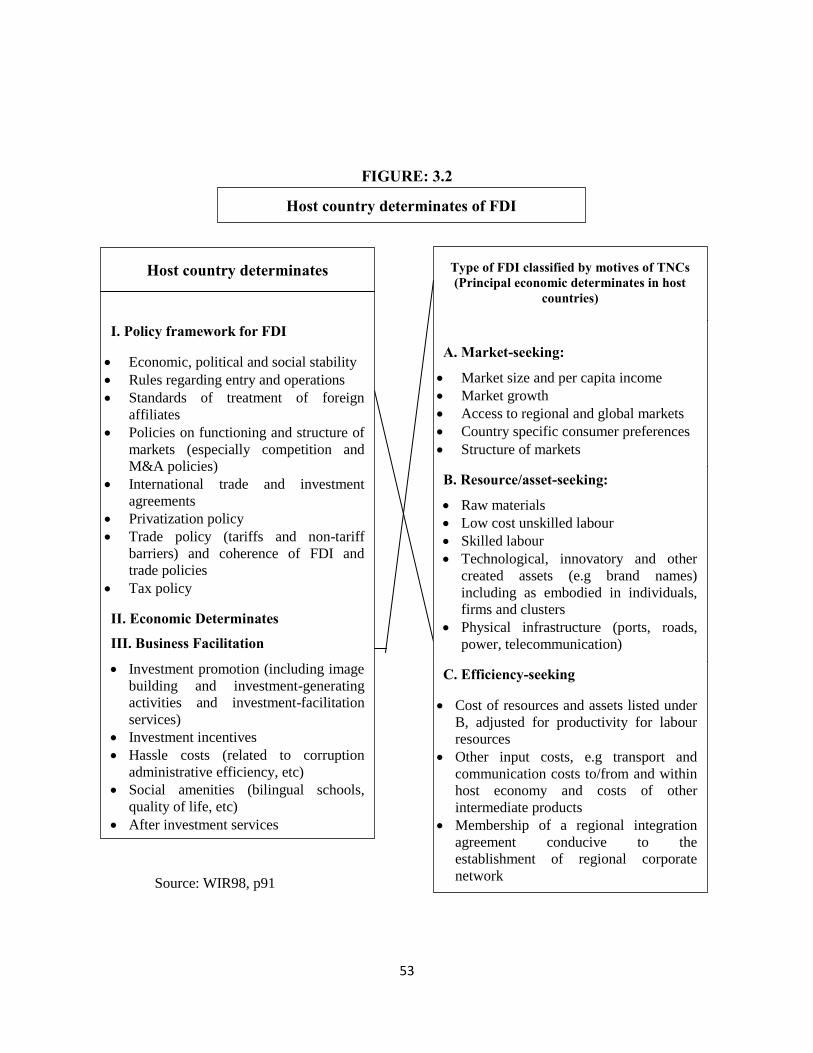
3.1.7 Determinants of FDI
The host country determinants of the FDI may be broadly grouped into three
categories: policy framework for the FDI, economic conditions and business
facilitations.
53
FIGURE: 3.2
Source: WIR98, p91
Host country determinates of FDI
Host country determinates
I. Policy framework for FDI
Economic, political and social stability
Rules regarding entry and operations
Standards of treatment of foreign
affiliates
Policies on functioning and structure of
markets (especially competition and
M&A policies)
International trade and investment
agreements
Privatization policy
Trade policy (tariffs and non-tariff
barriers) and coherence of FDI and
trade policies
Tax policy
II. Economic Determinates
III. Business Facilitation
Investment promotion (including image
building and investment-generating
activities and investment-facilitation
services)
Investment incentives
Hassle costs (related to corruption
administrative efficiency, etc)
Social amenities (bilingual schools,
quality of life, etc)
After investment services
Type of FDI classified by motives of TNCs (Principal economic determinates in host
countries)
A. Market-seeking:
Market size and per capita income
Market growth
Access to regional and global markets
Country specific consumer preferences
Structure of markets
B. Resource/asset-seeking:
Raw materials
Low cost unskilled labour
Skilled labour
Technological, innovatory and other
created assets (e.g brand names)
including as embodied in individuals,
firms and clusters
Physical infrastructure (ports, roads,
power, telecommunication)
C. Efficiency-seeking
Cost of resources and assets listed under
B, adjusted for productivity for labour
resources
Other input costs, e.g transport and
communication costs to/from and within
host economy and costs of other
intermediate products
Membership of a regional integration
agreement conducive to the
establishment of regional corporate
network
54
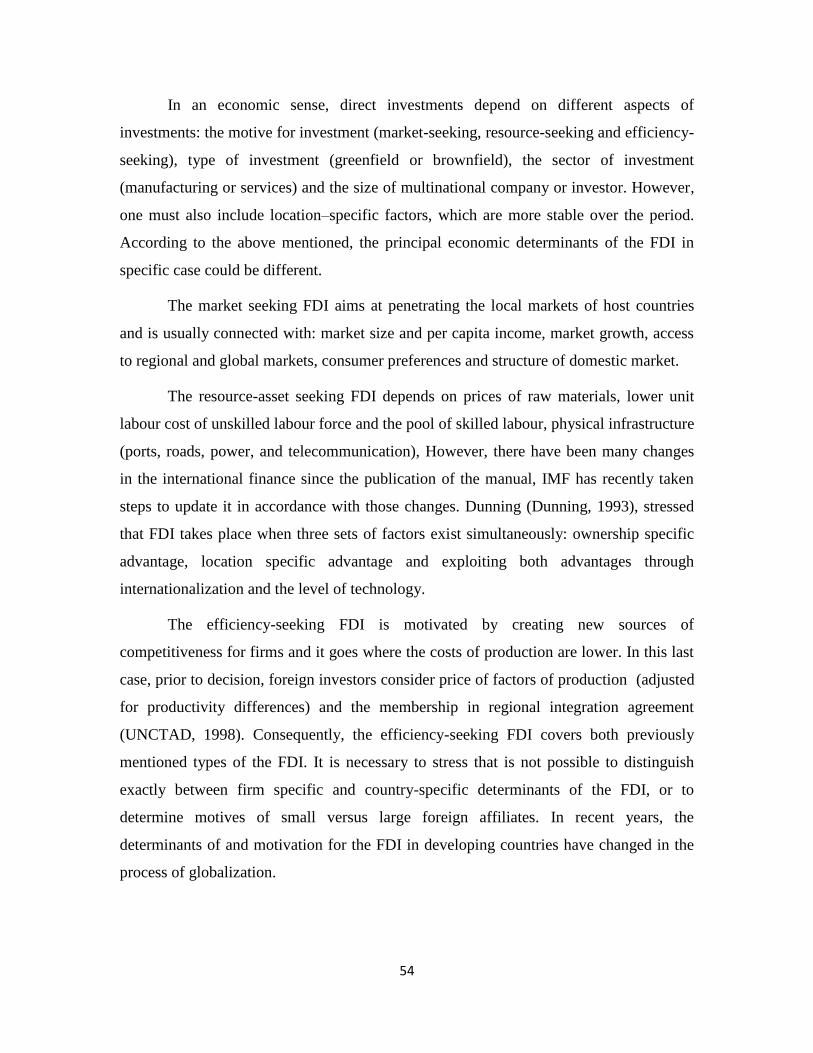
In an economic sense, direct investments depend on different aspects of
investments: the motive for investment (market-seeking, resource-seeking and efficiency-
seeking), type of investment (greenfield or brownfield), the sector of investment
(manufacturing or services) and the size of multinational company or investor. However,
one must also include location–specific factors, which are more stable over the period.
According to the above mentioned, the principal economic determinants of the FDI in
specific case could be different.
The market seeking FDI aims at penetrating the local markets of host countries
and is usually connected with: market size and per capita income, market growth, access
to regional and global markets, consumer preferences and structure of domestic market.
The resource-asset seeking FDI depends on prices of raw materials, lower unit
labour cost of unskilled labour force and the pool of skilled labour, physical infrastructure
(ports, roads, power, and telecommunication), However, there have been many changes
in the international finance since the publication of the manual, IMF has recently taken
steps to update it in accordance with those changes. Dunning (Dunning, 1993), stressed
that FDI takes place when three sets of factors exist simultaneously: ownership specific
advantage, location specific advantage and exploiting both advantages through
internationalization and the level of technology.
The efficiency-seeking FDI is motivated by creating new sources of
competitiveness for firms and it goes where the costs of production are lower. In this last
case, prior to decision, foreign investors consider price of factors of production (adjusted
for productivity differences) and the membership in regional integration agreement
(UNCTAD, 1998). Consequently, the efficiency-seeking FDI covers both previously
mentioned types of the FDI. It is necessary to stress that is not possible to distinguish
exactly between firm specific and country-specific determinants of the FDI, or to
determine motives of small versus large foreign affiliates. In recent years, the
determinants of and motivation for the FDI in developing countries have changed in the
process of globalization.
55
3.1.8 Constraints of Foreign Direct Investment
Apart from the wide array of positive impacts of FDI inflows to a country‘s
economic growth it also has some constraints which is debatable such as:
Exploitation of Resources: Exploitation of natural resources of a host country is not a
very uncommon phenomenon in the case of FDI. MNCs of other countries have been
known to indiscriminately exploit the resources of host countries in order to get short run
gains and profits and have even chosen to ignore the sustainability factors associated with
the local communities and local habitat, very much like what happened in the 17th
century
colonialism.
Threaten Small Scale Industries: MNCs have large economic and pricing power due to
their large sizes. They do not have much problem with regards to financial capital and
can hence resort to using lavish advertisements. Also, these companies are global players
who have their operations spread across countries and have effective supply chains which
enable them to have economies of scale which smaller players in the domestic market of
the host country cannot compete with. All this results in the MNC having cheaper
products and more visibility due to the higher amounts of advertising and have been
known to push out smaller industries out of business.
Technology: Although, the MNCs have access to new and cutting edge technology, they
do not transfer the latest technology to the host country with a fear that their home
country may loose its competitive advantage. Hence the maximum potential of the host
economy cannot be achieved as a result of old technology transferred.
Stimulates inappropriate consumption: Foreign firms stimulate inappropriate
consumption pattens through excessive advertising, creating a false status issues by
consuming international brands and monopolistic market power. The products made by
Multinationals for the domestic markets are not necessaryily low in price and high in
quality. Their technology is generally capital intensive which does not suit the needs of a
labour surplus economy.
Foreign firms may influence political decisions in developing countries: In view of
their large size and power, national sovereignty and control over economic policies may
56
be jeoparadised. In extreme cases, foreign firms may bribe public officials at the highest
levels to secure undue favours. Similarly they may contribute to friendly political parties
and subvert the political process of the host country.
Ambiguity in providing desired impact to the economic growth: It may or may not
have the desired and expected growth-enhancing impact on the economy. FDI might
enter a labour-abundant country with capital-intensive technologies; but, if the labour
laws are not flexible, this would have a relatively lesser impact on employment
generation.
Therefore the host country should be cautious in making promotional activities
and framing investment policies in such a way that it invites a quality FDI and in required
sector.
3.2 An Overview of World FDI
One of the most prominent and striking feature of today‘s globalised world is the
exponential growth of FDI in both developed and developing countries. In the last two
decades the pace of FDI flows are rising faster than almost all other indicators of
economic activity worldwide. Before 1990, Global FDI inflows more than quintupled
from 1990 to 2009, rising from US$208 billion to US$1.1 trillion, resulting in a
cumulative stock of nearly US$18 trillion by end-2009. Global FDI inflows in 2010
reached an estimated $1,244 billion, a small increase from 2009‘s level of $1,185 billion.
Global foreign direct investment (FDI) flows exceeded the pre-crisis average in 2011,
reaching $1.5 trillion despite turmoil in the global economy. However, they still remained
some 23 per cent below their 2007 peak. UNCTAD predicted slower FDI growth in 2012,
with flows levelling off at about $1.6 trillion. Longer-term projections show a moderate
but steady rise, with global FDI reaching $1.8 trillion in 2013 and $1.9 trillion in 2014,
barring any macroeconomic shocks. FDI inflows increased across all major economic
groupings in 2011.
57
3.2.1 FDI inflows in group of economies - Evidencing the shift of FDI inflows from
developed to developing Economies
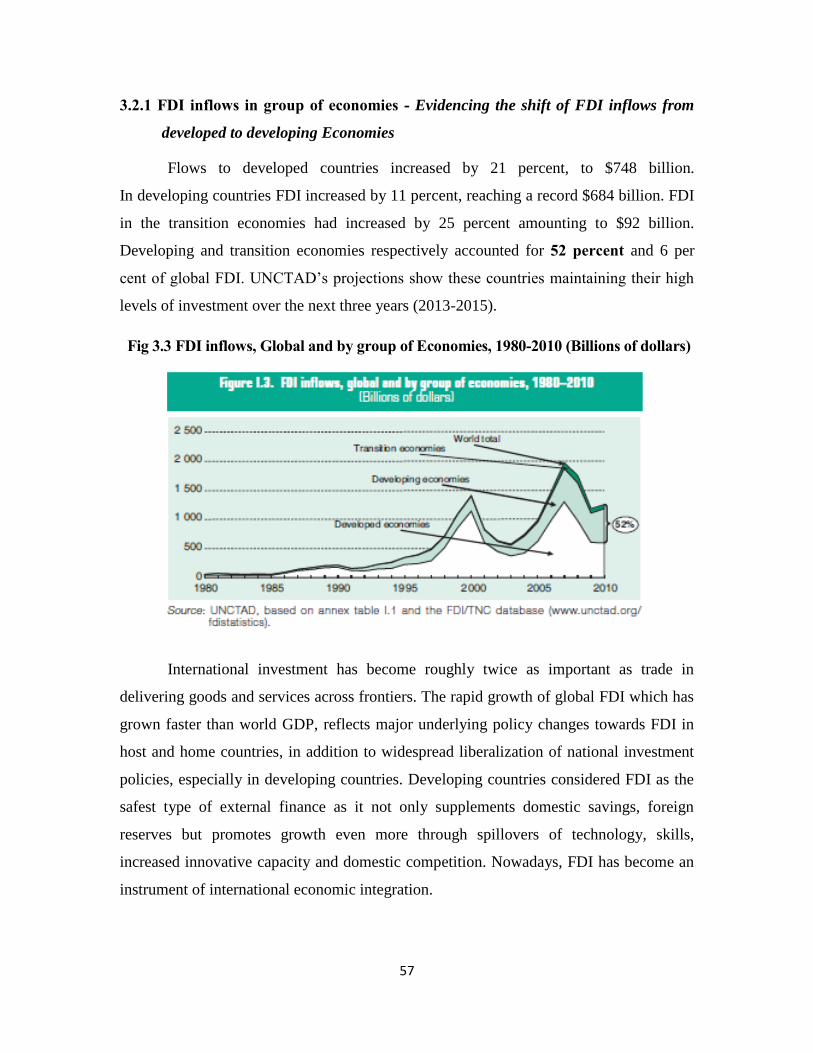
Flows to developed countries increased by 21 percent, to $748 billion.
In developing countries FDI increased by 11 percent, reaching a record $684 billion. FDI
in the transition economies had increased by 25 percent amounting to $92 billion.
Developing and transition economies respectively accounted for 52 percent and 6 per
cent of global FDI. UNCTAD‘s projections show these countries maintaining their high
levels of investment over the next three years (2013-2015).
International investment has become roughly twice as important as trade in
delivering goods and services across frontiers. The rapid growth of global FDI which has
grown faster than world GDP, reflects major underlying policy changes towards FDI in
host and home countries, in addition to widespread liberalization of national investment
policies, especially in developing countries. Developing countries considered FDI as the
safest type of external finance as it not only supplements domestic savings, foreign
reserves but promotes growth even more through spillovers of technology, skills,
increased innovative capacity and domestic competition. Nowadays, FDI has become an
instrument of international economic integration.
Fig 3.3 FDI inflows, Global and by group of Economies, 1980-2010 (Billions of dollars)
58
3.3 BRICs and the significance of FDI in BRICs
3.3.1 Evolution of BRICs
On the desk of Jim O‘Neill, chief economist for Goldman Sachs, stand four
flimsy flags, these flags hint at a more interesting story – of the latest way in which
money and ideas are reshaping the world. And almost a decade ago, O‘Neill decided to
start thinking of them as a group – which he gave the acronym BRIC. It was a simple
mental prop. The bolder move was to predict – publicly, and in Goldman‘s name – that
by 2041 (later revised to 2039, then 2032) the Brics would overtake the six largest
western economies in terms of economic might. The four flags would come to represent
the pillars of the 21st-century economy.
Separated geographically and culturally; they had never acted as a bloc in any
way, never conceived of themselves as a unit. Yet what they all shared in 2001 were large
populations, underdeveloped economies and governments that appeared willing to
embrace global markets and some elements of globalisation. To O‘Neill, these
characteristics made them natural sisters: they all had the potential for rapid future
growth.
3.3.2 The collective strengths of BRICs
Economic and social development of BRICs: The rapidly emergent powers of Brazil,
Russia, India and China (BRIC) are in the process of changing the political and economic
map of the 21st century. In particular, the historically unprecedented economic growth
observed since the 1990s in the ―awakening giants‖ China, India and Brazil has not only
aroused the interest of investors in these future markets, it has astonished the worlds of
politics, science, economics and the media. The global economic significance of the
BRICs nations is undisputed.
59
The population growth of BRICs: Over the past 50 years, the population of the BRICs
has more than doubled. There are 6.8 billion people in the world and 42 percent currently
live in the BRIC countries However, population growth is expected to slow in the BRICs
over the next few decades, pushing down their aggregate share of the global population.
The age structure of the BRICs will also continue to shift progressively towards older
populations. In the process each of the BRICs will encounter or is already encountering
an advantageous ‗demographic window‘ in which the working-age population is
disproportionately large. With an appropriate policy framework, this could provide a
boost to growth in Brazil, China and India for several years. Russia‘s window of
opportunity has probably been shut due to the decreasing rate of population.
Increase in demand and consumption: As household incomes rise, so do sales on
discretionary items such as automobiles and cellular phones. Among the BRIC countries,
China and India show the greatest increase in demand and consumption, while Russia
followed by Brazil reflects higher levels of wealth.
The rise of middle income population Vs Power of Productivity: The other essential
driver of growth is productivity. The rise in middle age population is also an important
reason for the expected rise in productivity. It is believed that the middle class is rising in
BRIC countries and estimate 2 billion will join it by 2030. In August 2009, China passed
the US as the world‘s single largest car market and it is believed that India will surpass
China in the next few decades. (BRICs brochure by GS) Countries with young and
expanded labour forces, which are becoming increasingly efficient, will show the largest
gains in the real GDP. Dominic Wilson and Roopa Purushothaman in their follow-up
paper ―Dreaming with BRICs to 2050‖ they had written in less than 40 years the BRICs
economies together could be larger than G6 in dollar terms.
BRICs in World Economic Growth and Trade - a two decade comparison
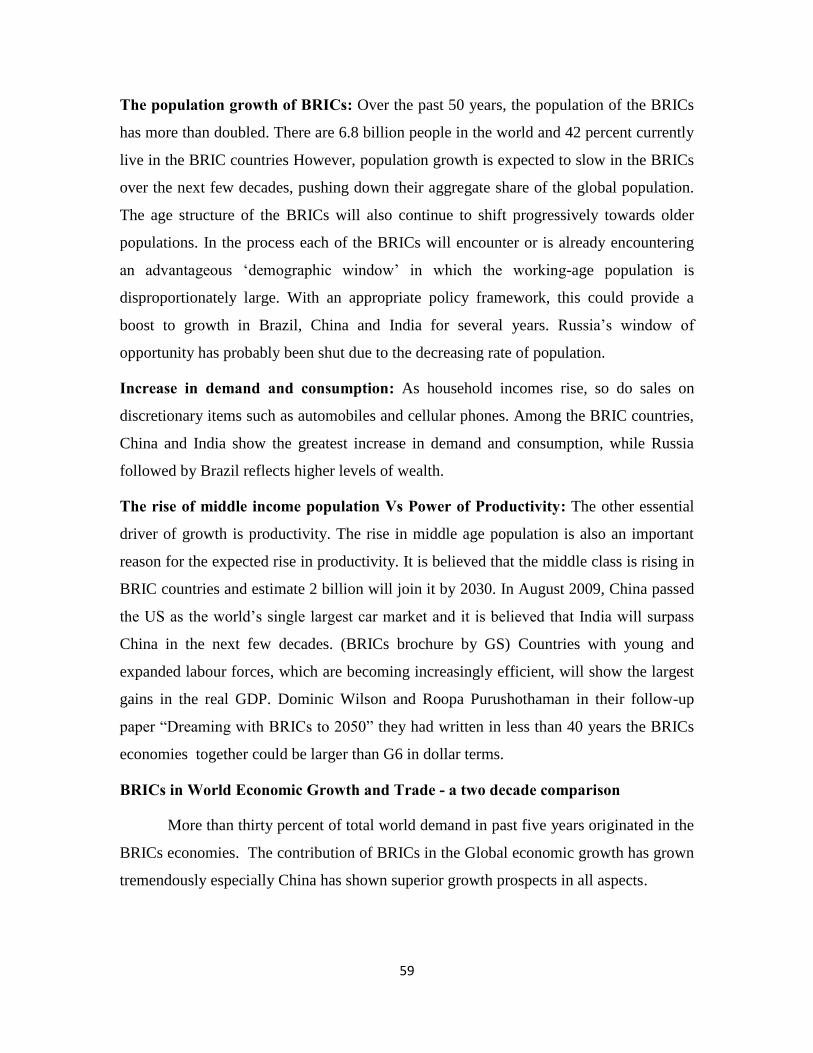
More than thirty percent of total world demand in past five years originated in the
BRICs economies. The contribution of BRICs in the Global economic growth has grown
tremendously especially China has shown superior growth prospects in all aspects.
60
Figure 3.4. The Contribution of BRIC in Global Economic Growth & Trade
Source: IMF database
More than thirty percent of total world demand in past five years originated in the
BRIC economies. Over the last few years the importance of these countries became even
more evident as China took a lead role in world economic growth. The share of BRIC in
World GDP has shown a considerable increase for Russia and India. China has shown a
more than three fold increment in its share of World GDP, in contrast Brazil has shown a
decline from 3.3% in 1990 to 2.9% in 2010. The Share of BRIC in Global Trade has
continued to grow at a rapid pace. Their share in world export increased substantially
over the past two decades, mostly through broad-based diversification, both in
commodities and regions of trade. In case of Global FDI inflows BRIC economies
remained steady even during the recent crisis, reflecting the longer term views on the
growth potentials of the BRIC and the soundness of their financial systems.
0
5
10
15
1990 2010 1990 2010 1990 2010
Brazil
Russia
India
China
InPe
rcen
t
Share in World GDP
Share in Global Trade
Share in Global FDI inflows
61
3.3.3 BRICs economic reforms which accelerated its foreign investments and growth
– a few milestones…
There is a new era arising in international relations. The rise of the BRIC
countries (Brazil, Russia, India and China) is changing power dynamics in world affairs.
For China, India and Russia the transformation towards a market-based economy
deregulation and the opening-up towards the global economy marked the start of
economic acceleration. In China, a rather gradual reform process started in 1978 with the
introduction of the opening-up policy by its leader Deng Xiaoping. Policy changes are
often tested in smaller regions before being fully implemented. By western standards,
China is still far off from a well-functioning market economy. Since 2005, under the
leadership of President Hu Jintao and Prime Minister Wen Jiabao, the process of
liberalization has been gradually continued. An interesting feature of the liberalization
process in China is that, in contrast to Russia, it has occurred without a thorough attempt
to democratization. Even though recent growth is increasingly driven by domestic
demand, growth in the early years was led by an export-oriented policy and later the
inflow of foreign capital. In the latter, there is a large similarity with the earlier success of
other Asian economies, like Japan, South Korea and Taiwan.
Even though the Indian economy started to accelerate in the early 1980s, substantial
policy reform did not occur until a decade later. Before the 1980s, this could best be
characterized as downright hostility, whereas in the early 1980s the economic environment
abruptly changed towards business friendly. During the 1980s, the Indian economy remained
relatively closed, and economic growth was mainly driven by domestic factors. Drastic
market-based economic reform started first in 1991. Many areas of economic activity were
opened to private firms, while investment decisions in most industries did no longer require
government approval. Up to the 1990s, banking was mostly restricted to government
operated firms. Therefore, investment decisions were often politically rather than
economically motivated. Furthermore, from the late 1990s onwards trade restrictions were
gradually removed (even though trade remains more restrictive than in most OECD
countries) and the integration of India into the world economy began. As was the case in
China, this transformation resulted in the inflow of foreign capital.
62
In contrast to China and India, economic reform in Russia occurred in a big bang
fashion rather than gradual, following the collapse of the Soviet Union. Reforms started
in 1987 under Michail Gorbatsjov, with the decision to allow firms to determine output
levels based on demand. Furthermore, companies (although still being state-owned)
became financially independent and were allowed to negotiate prices, such that the
transfer of funds from profitable to unprofitable companies came to an end. Another
reform was that foreign investment became legal. In 1991, in the first year of the
presidency of Boris Yeltsin, Russia implemented what was known as the shock therapy
led by Jegor Gaidar which aimed at a rapid and radical transformation towards a market
economy. The first effects of this policy where disastrous. A full economic collapse
occurred, with GDP declining by about 50 percent between 1991 and 1995. The sudden
removal of price controls resulted in an episode of hyperinflation. After a short period of
recovery, the 1998 financial crisis resulted in a new recession and hyperinflation.
After the financial crisis in 1998, the economy started to recover. Since then, economic
growth has been continuously high, large sums of foreign direct investments have been
attracted, and inflation has remained relatively low. The total stock of FDI originating
from the EU invested in Russia has quadrupled in the five years between 2004 and 2009.
GDP growth is spurred by high revenues from the availability of natural resources,
especially oil and gas.
In the early 1980s, the Brazilian economy experienced a period of economic crisis
that was the result of bad governance and a high dependency on foreign debt. As the
government attempted to reduce indebtedness by reducing imports and economic growth
and the introduction of an import substitution program, the economy entered a deep
recession in 1981. In the mid-1980s this program resulted in a trade surplus, but at that
time the domestic public debt had become problematic and a loose monetary policy had
resulted in hyperinflation. While it took until the early 1990s before fiscal stabilization
was achieved, early attempts to improve macroeconomic stability relied on a price freeze.
While upon introduction in 1986 this was successful initially, supply was soon reduced
such that many goods became scarce. In the late 1980s Brazil returned to hyperinflation.
In 1990, under the presidency of Fernando Collor de Mello, a new attempt was made to
ensure macroeconomic stability. A new prize freeze was implemented, most financial
63
assets were frozen, and fiscal reforms were carried out. This plan failed as well, however,
and the economy entered a new period of recession. It took until 1994 before the crisis
came to an end, when the Brazilian currency (the real) was pegged to the US dollar. Since
then, economic growth has remained generally high and Brazil has succeeded to attract
high levels of FDI. For the EU, Brazil is the second most important destination for FDI of
all BRIC countries.
Therefore, the combined economic strength of the BRICs is undeniable. The
countries will continue to attract foreign direct investment as corporations hope to gain
access to their growing middle class markets. These countries are also increasingly
rebalancing their domestic consumption to achieve more sustainable growth models.
3.3.4 Foreign Direct Investments in BRICs
A Historical background of FDI inflows
Foreign Direct Investment (FDI) is an important source for the development of
strategic sectors of the BRIC countries. Until 1984, Brazil was the major FDI recipient
country among the BRICs, overtaken by China in 1985 and since then China continues to
be a major destiny of FDI, especially in the automotive and consumer durable sectors,
China became the world major recipient of FDI in the 1990s, matching with country‘s
efforts to integrate with the world economy, many multinational companies have moved
their operations to China to take advantage of its low labour costs and huge domestic
market. India received an almost constant and small part of the world total FDI flows
during last two decades.
In Brazil, since the late 19th
century, FDI became more and more important, after
the II world war, FDI played a key role during the Brazilian industrialization process.
Much of the Brazilian history shows that the country has relied upon foreign capital to
finance its development and economic growth. In recent years, foreign investments
inflows are attracted by the large Brazilian market and the rapid economic growth of the
country, besides the fact that Brazil will host the 2014 World cup and 2016 Olympics.
In Russia until the 1990s, the amount of FDI flowing into Russia remained
relatively flat. At the opening of this new millennium, Russia emerges as a country of
64
opportunities for FDI. In fact, FDI inflows has increased over the last years in Russia
thanks to its tremendous natural resources and growing domestic markets. Russia‘s new
status as WTO member will also complement its internal economic reforms and improve
foreign investment climate towards transparency and predictability in business
transactions in the country.
During the course of 1990s, the government of India initiated economic and
financial reforms aimed to progressively integrate Indian economy with the global
economy. FDI is recognized by the Indian government as an important driver of
economic growth and development. As a result of the various policy initiatives taken,
India has rapidly changes from a restrictive regime for Foreign Investments to a more
liberal one.
China has shifted from a closed, state-planned economy to an increasingly open
and internationally integrated market place over the past three decades. During the
1980‘s FDI inflows grew steadily but remained relatively low mainly confined to Joint
ventures with Chinese-State-Owned Enterprises. In the mid-1990‘s, FDI became quite
important for the chinese economy and new rules and regulations have been issued
accordingly. When Chna became member of the WTO in 2001, many new laws and
regulations have been issued after. FDIs in China have benefited from this liberalization
trend, specially the distribution, logistics, financial services and telecommunications
sectors. Given China‘s projection on the global arena, this movement is only expected to
increase in the near future, as China continues to establish its position as one of the
world‘s foremost economic growing power nations.
FDI in BRIC countries still remains bureaucratic and complex, however every
BRIC country shows the same serious intent to make the investment climate and more
and more favourable in the near future. Notably China and Brazil have become powerful
magnets of FDI. Consumption and FDI are the components of GDP and for a developing
economy it is a good predictor of stability and long term growth.
3.3.5 Major investors in BRICs
The EU is among the main investors in each of the BRICs and the dominant
investor in Brazil and Russia. In China and India, the EU has less weight. But, after
65
correcting for particularities in FDI data, such as the prominent role of Hong Kong and
off-shore centers in Chinese FDI and of Mauritius in Indian FDI, the EU ranks higher
also in these countries. In a direct comparison with the US and Japan, the EU emerges as
the leading investor among the Triad countries.
3.3.6 Potential factors determining FDI inflows in BRIC
The most important determinants establishing a congenial environment that attract
FDI and a strong business and investment climate have been mentioned in UNCTAD
study which was a general overview of possible determinants based on the investor‘s
motive. Based on the discussed literature review, there are a set of potential determinant
variables that influence the FDI flows in BRIC economies. The various broad categories
of determinants have been discussed below:
The Economic indicators Economic conditions such as: prospective GDP, Large
population, increase in trade, a positive current account balance, ample labour etc., plays
an important role in determining a country‘s FDI inflows.
Economic stability and growth prospects: A country which has a stable macroeconomic
condition with high and sustained growth rates will receive more FDI inflows than a
more volatile economy. The proxies measuring growth rate would include: GDP growth
rates, Trade volume, Current account balance, Interest rates and Inflation rates.
Contradicting, when inflation is taken as proxy for the level of economic stability, then
the classic symptoms of fiscal or monetary control will result in unbridled inflation.
In connection with this, investors prefer to invest in more stable economies that reflect a
lesser degree of uncertainty. Therefore, it is expected that GDP growth rate, Industrial
production index, Interest rates would influence FDI flows positively and the Inflation
rate would influence positively or negatively.
Market size and Growth: Larger market size should receive more inflows than that of
smaller countries having lesser market size. Market size is generally measured by Gross
Domestic Product and purchasing power parity of the population. It is expected to be a
positive and significant determinant of FDI inflows. Thus, an economy with a large
market size (along with other factors) should attract more FDI if capturing market is the
firm‘s motive. Market size is important for FDI as it provides potential for local sales,
66
greater profitability of local sales to export sales and relatively diverse resources, which
make local sourcing more feasible. Thus, a large market size provides more opportunities
for sales and also profits to foreign firms and therefore attracts FDI. However, market
size and growth impact may differ under different conditions.
Trade: Volume of Trade is considered to be a key determinant of FDI as represented in
the previous literature. Much of FDI is export oriented and may also require the import of
complementary, intermediate and capital goods. In either case, volume of trade is
enhanced and thus trade openness is generally expected to be a positive and significant
determinant of FDI.
Labour: Cheap labour is another important determinant of FDI inflow to developing
countries. A high wage-adjusted productivity of labour attracts efficiency-seeking FDI
both aiming to produce for the host economy as well as for export from host countries.
Countries with a large supply of skilled human capital attract more FDI, particularly in
sectors that are relatively skill intensive. Higher labour cost would result in higher cost of
production and is expected to limit the FDI inflows; therefore, we expect the negative and
significant relationship between labour cost and FDI.
Business Environment: Business environment factors such as Government efficiency,
Legal structure, monetary stability, effective Business regulations, technology readiness
and innovation of a country were considered to be the most important factors that would
determine a country‘s competitiveness for investment decisions.
Government Efficiency: Government‘s attitudes toward markets and the efficiency of its
operations are very important. Excessive bureaucracy and red tape, over regulation,
corruption, dishonesty in dealing with public contracts, lack of transparency and trust
worthiness, inability to provide appropriate services for the business sector, and political
dependence of the judicial system impose significant economic costs to businesses and
slow the process of economic development. The government policies in terms of public
finance, fiscal policy, institutional framework, business legislation and societal
framework can directly and indirectly affect FDI through their effects on market
imperfections. The same government policy can increase and/or decrease market
imperfections and thereby increase and/or decrease FDI inflows. The evidences of the
67
empirical evidence on the impact of government policies on FDI inflows are ambiguous.
Some of them find a positive effect of investment incentives. For example, UNCTAD (1996)
report shows that incentives can have an effect on attracting FDI only at the margin.
A number of previous studies find that fiscal incentives do affect location decisions,
especially for export oriented FDI. On the other hand, the study of Contractor (1991)
finds that changes in policy may have a weak influence on FDI inflows. Caves (1996)
concludes that incentives are generally ineffective once the role of fundamental
determinants of FDI taken into account.
Technology readiness and innovation: In today‘s globalized world, technology is
increasingly essential for firms to compete and prosper. The technological readiness pillar
measures the agility with which an economy adopts existing technologies to enhance the
productivity of its industries, with specific emphasis on its capacity to fully leverage
information and communication technologies (ICT) in daily activities and production
processes for increased efficiency and enabling innovation for competitiveness. ICT has
evolved into the ―general purpose technology‖ of our time, given the critical spillovers to
the other economic sectors and their role as industry-wide enabling infrastructure.
Therefore ICT access and usage are key enablers of country‘s overall technological
readiness. Whether the technology used has or has not been developed within national
borders is irrelevant for its ability to enhance productivity. The central point is that the firms
operating in the country need to have access to advanced products and blueprints and the
ability to absorb and use them. Among the main sources of foreign technology, FDI often
plays a key role, especially for countries at a lower stage of technological development. It is
important to note that, in this context, the level of technology available to firms in a country
needs to be distinguished from the country‘s ability to conduct blue-sky research and develop
new technologies for innovation that expand the frontiers of knowledge.
Legal Structure: Foreign investor must believe that investment is safe, that fair and
equitable treatment is assured, and that disputes can be resolved in a fair and expedient
manner. Without investor protections, equity markets fail to develop and banks become
the only source of finance. Yet weak collateral or property registration systems block
many businesses in developing countries from obtaining even bank loans.
68
Legislative Stability: Consistency in government legislation and policies are important
for attracting MNEs to invest in a country. For example, consistency of the Fiscal (Tax)
Code for longer period build investor‘s confidence and knowledge on the host country,
on the type of taxes an investor has to pay. To attract FDI legislative stability is
necessary. OECD study suggests that foreign companies may be willing to invest into
countries with sound legal and regulatory frameworks that would not otherwise be
considered as ―investor friendly‖ provided they are able to obtain a reasonable degree of
clarity about the environment in which they will be operating. An unstable legislative
environment may give investors the feeling that there is too great a risk of unfavorable
conditions arising, which may dissuade them from investing.
Infrastructure facilities: The availability of quality infrastructure, particularly electricity,
water, transportation and telecommunications, is an important determinant of FDI. When
developing countries compete for FDI, the country that is best prepared to address
infrastructure bottlenecks will secure a greater amount of FDI. The previous literature
shows the positive impact of infrastructure facilities on FDI inflows. A country which has
opportunity to attract FDI flows will stimulate a country to equip with good Infrastructure
facilities. The availability of quality Infrastructure can be related to public expenditure on
capital to acquire fixed capital assets, land, intangible assets and non-financial and non-
military assets for Infrastructure.
Regulations: The previous literature shows the impact of government regulations including
labour regulations, credit regulation and business regulations has significant impact on FDI
inflows into a host country. Though investment incentives are considered another determinant
for FDI, the investment incentives alone are generally not an efficient way to increase national
welfare. Policies to promote FDI take a variety of forms, but the most common are partial or
complete exemptions from corporate taxes and import duties. Standard policies to attract FDI
include tax holidays, import duty exemptions, and different kinds of direct subsidies. FDI
inflows are also affected by corporate tax rate differentiation. Subsidizing FDI helps
multinational firms reduce production costs, improves incentives to create patents, trademarks,
and enhances the relative attractiveness of locating production facilities in the country offering
incentives and raises the economic benefits of FDI relative to exporting.
69
Monetary Stability: A weaker real exchange rate might be expected to increase vertical FDI
as firms take advantage of relatively low prices in host markets to purchase facilities or, if
production is re-exported, to increase home-country profits on goods sent to a third market.
A ―firm-specific asset‖ argument shows that exchange rate depreciation in host countries tend
to increase FDI inflows. But on the other hand, a stronger real exchange rate might be expected
to strengthen the incentive of foreign companies to produce domestically. The exchange rate is
in a sense a barrier to entry in the market that could lead to more horizontal FDI.
3.3.7 The Role of Bilateral Investment Treaties and Double Taxation Agreements in
BRIC economies for attracting FDI
Bilateral Investment Treaties (BITs) guarantee certain standards of treatment that
can be enforced via binding investor-to-state dispute settlement outside the Domestic
Juridicial System. Developing countries believe that the protection from political and
other risks leads to an increase in foreign direct investment (FDI), which is also the stated
purpose of BITs. Although the Bilateral Investment Treaties play a facilitating role and
enhances protection to Foreign Investors, their role in attracting FDI is said to be
minimal. On the other hand by opening up of new sectors in Double Taxation Avoidance
Agreements, BITs do contribute by removing unnecessary barriers. BITs also add a number
of necessary components to the policy and institutional determinants for FDI. If the
agreements are made more specific on the required quality and sector which a country
actually needs, by easing controls and targeting a leading investor it would rather bring real
benefits. Those countries that have signed more free trade agreements with the largest
economies in the world have increased their effectiveness in attracting FDI inflows.
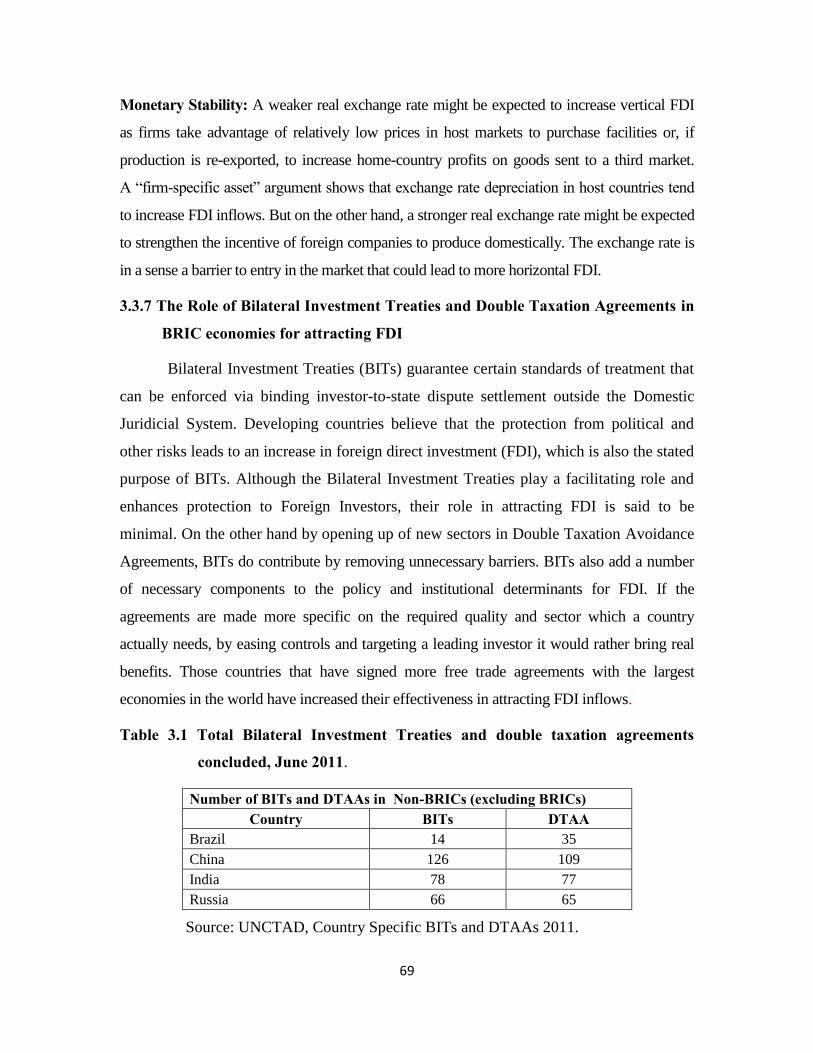
Table 3.1 Total Bilateral Investment Treaties and double taxation agreements
concluded, June 2011.
Number of BITs and DTAAs in Non-BRICs (excluding BRICs) Country BITs DTAA
Brazil 14 35
China 126 109
India 78 77
Russia 66 65
Source: UNCTAD, Country Specific BITs and DTAAs 2011.
70
The above table brings out the total number of BITs and DTAAs signed by Brazil,
Russia, India and China until 2011. As revealed in other areas of growth, China seems to
have signed 126 BITs and 109 DTAAs highest among other three BRIC nations. Though
Brazil shows least number of BITs and DTAAs the growth in FDI is very positive which
is vice versa in the case of Russia. India has signed a fair number of BITs and DTAAs.
This scenario reveals the fact that investment treaties may be one of the element in
investment decisions of foreign investors whereas market size, infrastructure, economic
stability and regulations are more important for attracting FDI as stated by UNCTAD in
its series on International Investment Policies for Development.
3.3.8 World’s Top 20 FDI recipients and the position of BRICs
Table 3.4 depicts a clear picture on worlds top 20 FDI destinations. It is a world
known fact and a topic of appreciation, that China has been successful in retaining its
position in the top five, except the year 2001. It maintained its global second place until
2004, but its position went down from four, seven and third until 2008. From the year
2009 onwards it has been sustaining its second place till date, further it is expected to
reach the first place replacing the US in the coming years. Brazil has sustained its twelfth
place in the world‘s top destinations especially 2001 & 2002, but underwent a setback in
2003 -2005. It is noteworthy that Brazil missed its top twenty positions in the FDI
attraction in the year 2006. However it reached back its fifteenth place in 2007 and
gradually improved to twelfth, fourteenth, eight and fifth place as of 2011. This is the
first time in the whole period Brazil have reached top five position in FDI inflows.
71
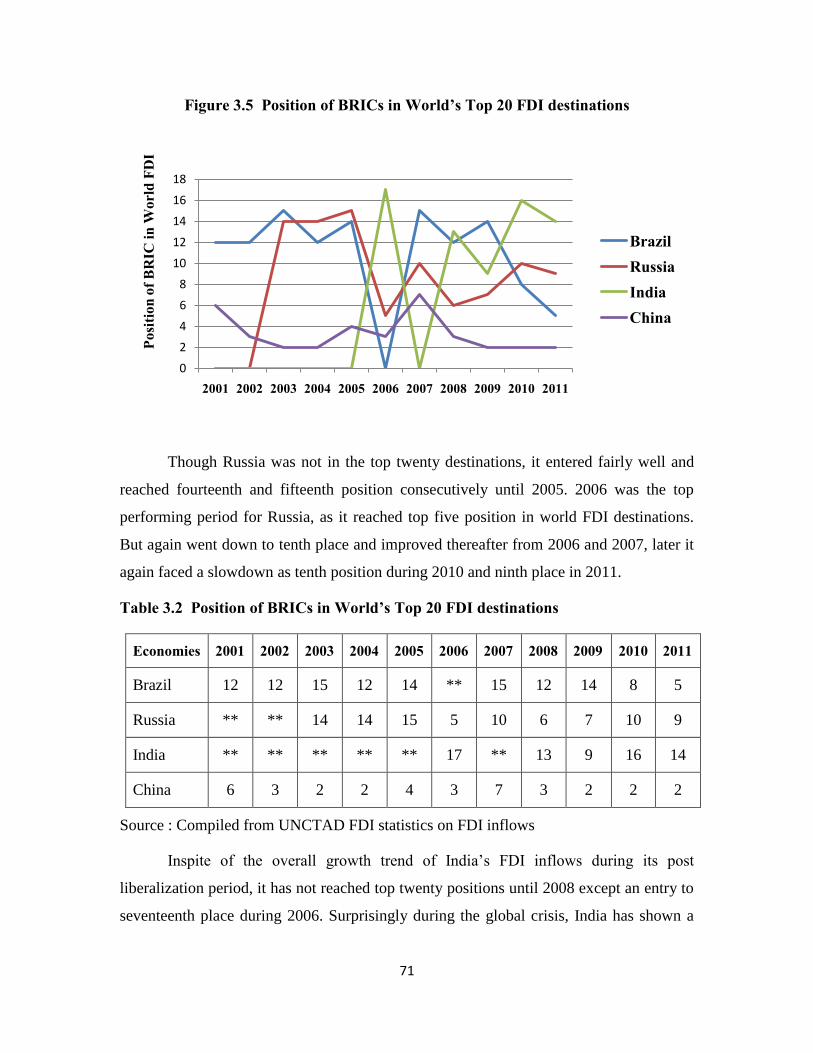
Figure 3.5 Position of BRICs in World’s Top 20 FDI destinations
Though Russia was not in the top twenty destinations, it entered fairly well and
reached fourteenth and fifteenth position consecutively until 2005. 2006 was the top
performing period for Russia, as it reached top five position in world FDI destinations.
But again went down to tenth place and improved thereafter from 2006 and 2007, later it
again faced a slowdown as tenth position during 2010 and ninth place in 2011.
Table 3.2 Position of BRICs in World’s Top 20 FDI destinations
Economies 2001 2002 2003 2004 2005 2006 2007 2008 2009 2010 2011
Brazil 12 12 15 12 14 ** 15 12 14 8 5
Russia ** ** 14 14 15 5 10 6 7 10 9
India ** ** ** ** ** 17 ** 13 9 16 14
China 6 3 2 2 4 3 7 3 2 2 2
Source : Compiled from UNCTAD FDI statistics on FDI inflows
Inspite of the overall growth trend of India‘s FDI inflows during its post
liberalization period, it has not reached top twenty positions until 2008 except an entry to
seventeenth place during 2006. Surprisingly during the global crisis, India has shown a
0
2
4
6
8
10
12
14
16
18
2001 2002 2003 2004 2005 2006 2007 2008 2009 2010 2011
BrazilRussiaIndiaChina
Posi
tion
of B
RIC
in W
orld
FD
I
72
competitive performance in 2009 as occupying ninth position in world FDI destinations.
India‘s position showed a highly disappointing trend, coming down to sixteenth place in
2010 but improved a little in 2011 by reaching fourteenth place.
3.3.9 BRICs in Global Competitiveness
A Nation‘s prosperity depends on its competitiveness which is based on the
productivity, with which it produced goods and services. Competitiveness is rooted in a
nation‘s macroeconomic and microeconomic environment. Macroeconomic factors create
the potential for competitiveness, where as microeconomic factors increases productivity.
Macroeconomic factors include: Government policies, economic growth, stable political
and legal institutions. Microeconomic factors include: business environment factors such
as infrastructure, technology, business regulations, market size, trade etc., Hence the
competitiveness of a nation can be better analysed by studying both micro-economic and
macro-economic factors. The Global Competitiveness Reports (World Economic Forum)
have a solid theoretical foundation and combines publicly available information and
measures many critical factors like set of institutions, policies and set of sustainable
current and medium term levels of economic prosperity. It is built around twelve different
pillars, each of which is critical to driving productivity and competitiveness in national
economies. These pillars are : 1. Institutions, 2. Infrastructure, 3. Macro-economy,
4. Health and primary education, 5. Higher education and training, 6. Market efficiency,
7. Technological readiness, 8. Business sophistication, 9. Innovation, 10. Labour market
efficiency, 11. Financial market development and 12. Market size.
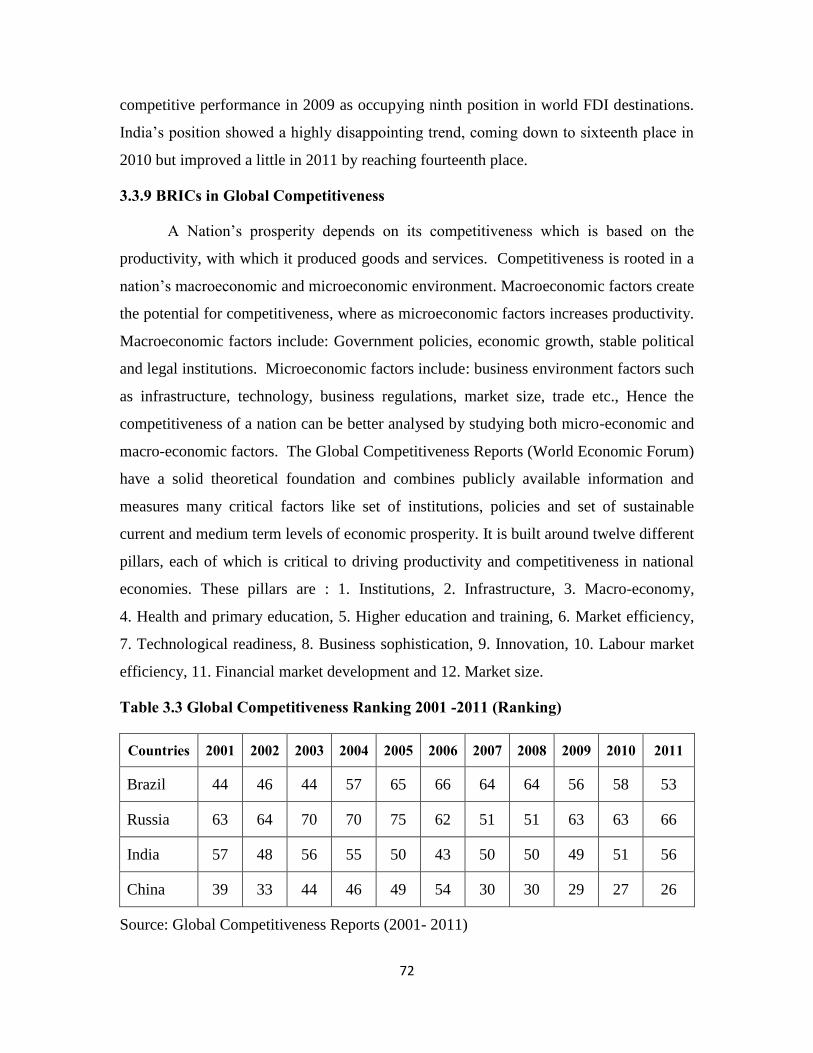
Table 3.3 Global Competitiveness Ranking 2001 -2011 (Ranking)
Countries 2001 2002 2003 2004 2005 2006 2007 2008 2009 2010 2011
Brazil 44 46 44 57 65 66 64 64 56 58 53
Russia 63 64 70 70 75 62 51 51 63 63 66
India 57 48 56 55 50 43 50 50 49 51 56
China 39 33 44 46 49 54 30 30 29 27 26
Source: Global Competitiveness Reports (2001- 2011)
73
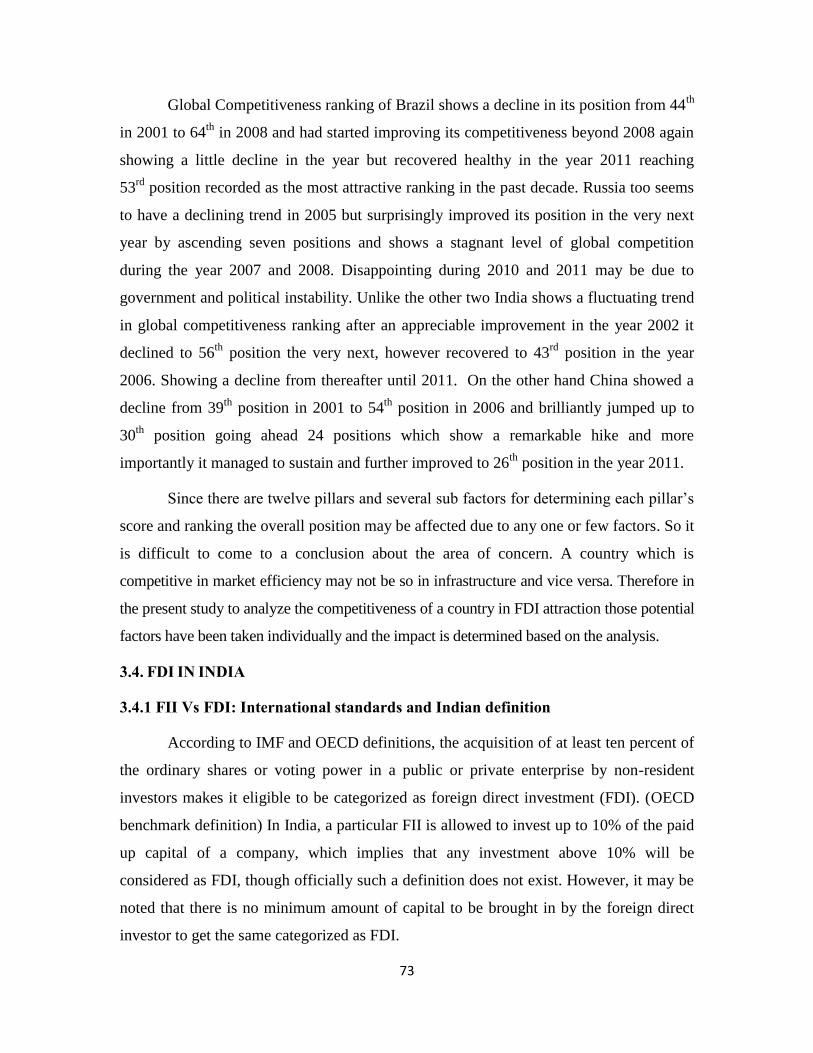
Global Competitiveness ranking of Brazil shows a decline in its position from 44th
in 2001 to 64th
in 2008 and had started improving its competitiveness beyond 2008 again
showing a little decline in the year but recovered healthy in the year 2011 reaching
53rd
position recorded as the most attractive ranking in the past decade. Russia too seems
to have a declining trend in 2005 but surprisingly improved its position in the very next
year by ascending seven positions and shows a stagnant level of global competition
during the year 2007 and 2008. Disappointing during 2010 and 2011 may be due to
government and political instability. Unlike the other two India shows a fluctuating trend
in global competitiveness ranking after an appreciable improvement in the year 2002 it
declined to 56th
position the very next, however recovered to 43rd
position in the year
2006. Showing a decline from thereafter until 2011. On the other hand China showed a
decline from 39th
position in 2001 to 54th
position in 2006 and brilliantly jumped up to
30th
position going ahead 24 positions which show a remarkable hike and more
importantly it managed to sustain and further improved to 26th
position in the year 2011.
Since there are twelve pillars and several sub factors for determining each pillar‘s
score and ranking the overall position may be affected due to any one or few factors. So it
is difficult to come to a conclusion about the area of concern. A country which is
competitive in market efficiency may not be so in infrastructure and vice versa. Therefore in
the present study to analyze the competitiveness of a country in FDI attraction those potential
factors have been taken individually and the impact is determined based on the analysis.
3.4. FDI IN INDIA
3.4.1 FII Vs FDI: International standards and Indian definition
According to IMF and OECD definitions, the acquisition of at least ten percent of
the ordinary shares or voting power in a public or private enterprise by non-resident
investors makes it eligible to be categorized as foreign direct investment (FDI). (OECD
benchmark definition) In India, a particular FII is allowed to invest up to 10% of the paid
up capital of a company, which implies that any investment above 10% will be
considered as FDI, though officially such a definition does not exist. However, it may be
noted that there is no minimum amount of capital to be brought in by the foreign direct
investor to get the same categorized as FDI.
74
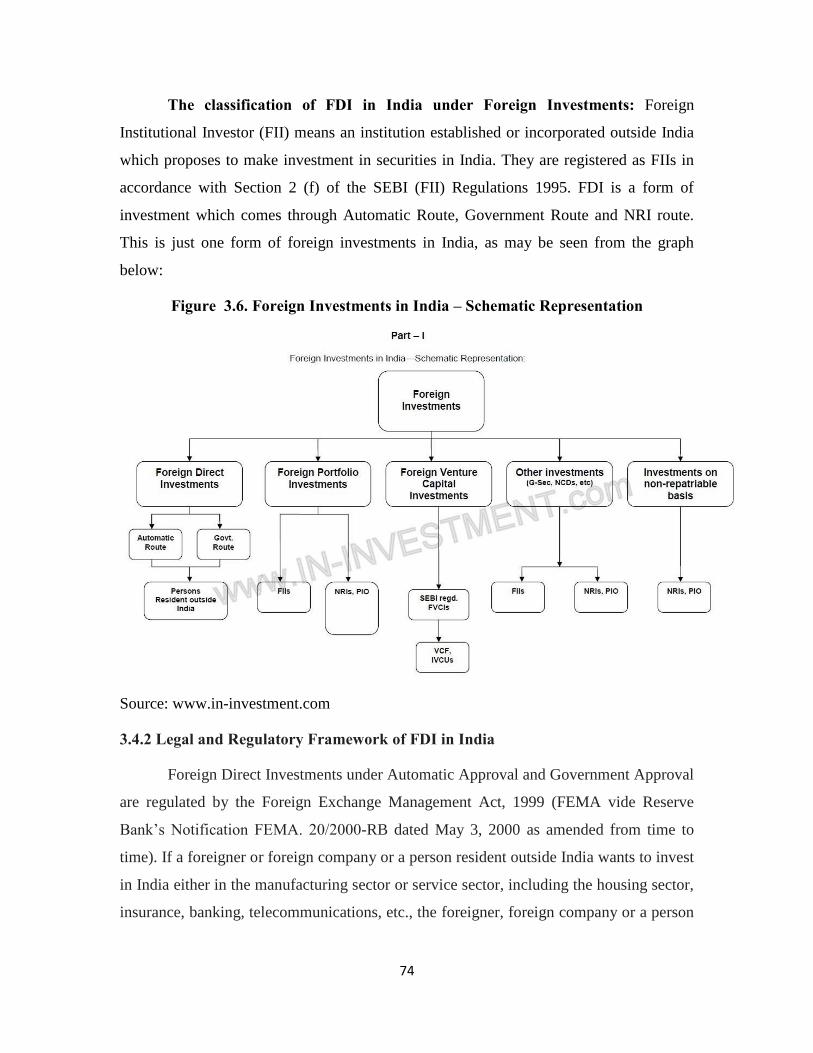
The classification of FDI in India under Foreign Investments: Foreign
Institutional Investor (FII) means an institution established or incorporated outside India
which proposes to make investment in securities in India. They are registered as FIIs in
accordance with Section 2 (f) of the SEBI (FII) Regulations 1995. FDI is a form of
investment which comes through Automatic Route, Government Route and NRI route.
This is just one form of foreign investments in India, as may be seen from the graph
below:
Figure 3.6. Foreign Investments in India – Schematic Representation
Source: www.in-investment.com
3.4.2 Legal and Regulatory Framework of FDI in India
Foreign Direct Investments under Automatic Approval and Government Approval
are regulated by the Foreign Exchange Management Act, 1999 (FEMA vide Reserve
Bank‘s Notification FEMA. 20/2000-RB dated May 3, 2000 as amended from time to
time). If a foreigner or foreign company or a person resident outside India wants to invest
in India either in the manufacturing sector or service sector, including the housing sector,
insurance, banking, telecommunications, etc., the foreigner, foreign company or a person
75
resident outside India has to pay due attention to the conditions, regulations and
procedures which are laid down in different notifications by the Reserve Bank of India
issued in terms of Section 6 of FEMA.
Foreign Investment Policy
Foreign investment is permitted in virtually every sector, except those of strategic
concern such as defense (opened up recently to a limited extent) and rail transport.
Foreign companies are permitted to set up 100 per cent subsidiaries in India. No prior
approval from the exchange control authorities (RBI) is required, except for certain
specified activities. According to the current policy, FDI can come into India in two
ways.
Routes of FDI
Automatic route: FDI in sectors/activities to the extent permitted under the
automatic route does not require any prior approval either by the government or the
Reserve Bank of India (RBI). The investors are only required to notify the concerned
regional office of the RBI within 30 days of receipt of inward remittances and file the
required documents with that office within 30 days of issue of shares to foreign investors.
Prior Government Approval route: In the limited category of sectors requiring
prior government approval, the proposals are considered in a time-bound and transparent
manner by the Foreign Investment Promotion Board (FIPB) under the Department of
Economic Affairs, Ministry of Finance. Approvals of composite proposals involving
foreign investment/foreign technical collabouration are also granted on the
recommendations of the FIPB.
3.4.3 FDI in India in Pre and Post reform period
In India, FDI is considered as a developmental tool, which can help in achieving
self-reliance in various sectors of the economy. The historical background of FDI in India
can be traced back with the establishment of East India Company of Britain. British
capital came to India during the colonial era of Britain in India. However, researchers
could not portray the complete history of FDI pouring in India due to lack of abundant
and authentic data. Before independence major amount of FDI came from the British
76
companies. British companies setup their units in mining sector and in those sectors that
suits their own economic and business interest. After Second World War, Japanese
companies entered Indian market and enhanced their trade with India, yet U.K. remained
the most dominant investor in India.
Further, after Independence issues relating to foreign capital, operations of
MNCs, gained attention of the policy makers. Keeping in mind the national interests the
policy makers designed the FDI policy which aims FDI as a medium for acquiring
advanced technology and to mobilize foreign exchange resources. In the due course of
time the economic and political regimes have been changed in the FDI policy too.
The industrial policy of 1965, allowed MNCs to venture through technical collabouration
in India. However, the country faced two severe crisis in the form of foreign exchange
and financial resource mobilization during the second five year plan (1956-61).
Therefore, the government adopted a liberal attitude by allowing more frequent equity
participation to foreign enterprises, and to accept equity capital in technical
collabourations. The government also provided many incentives such as tax concessions,
simplification of licensing procedures and de- reserving some industries such as drugs,
aluminum, heavy electrical equipments, fertilizers, etc in order to further boost the FDI
inflows in the country.
Under the new foreign investment policy Government of India constituted FIPB
(Foreign Investment Promotion Board) whose main function was to invite and facilitate
foreign investment through single window system from the Prime Minister‘s Office. The
foreign equity cap was raised to 51 percent for the existing companies. Government had
allowed the use of foreign brand names for domestically produced products which was
restricted earlier. India also became the member of MIGA (Multilateral Investment
Guarantee Agency) for protection of foreign investments. Government lifted restrictions
on the operations of MNCs by revising the FERA Act 1973. New sectors such as mining,
banking, telecommunications, highway construction and management were open to
foreign investors as well as to private sector.FDI inflows are welcomed in 63 sectors in
2008 as compared to 16 sectors in 1991.
77
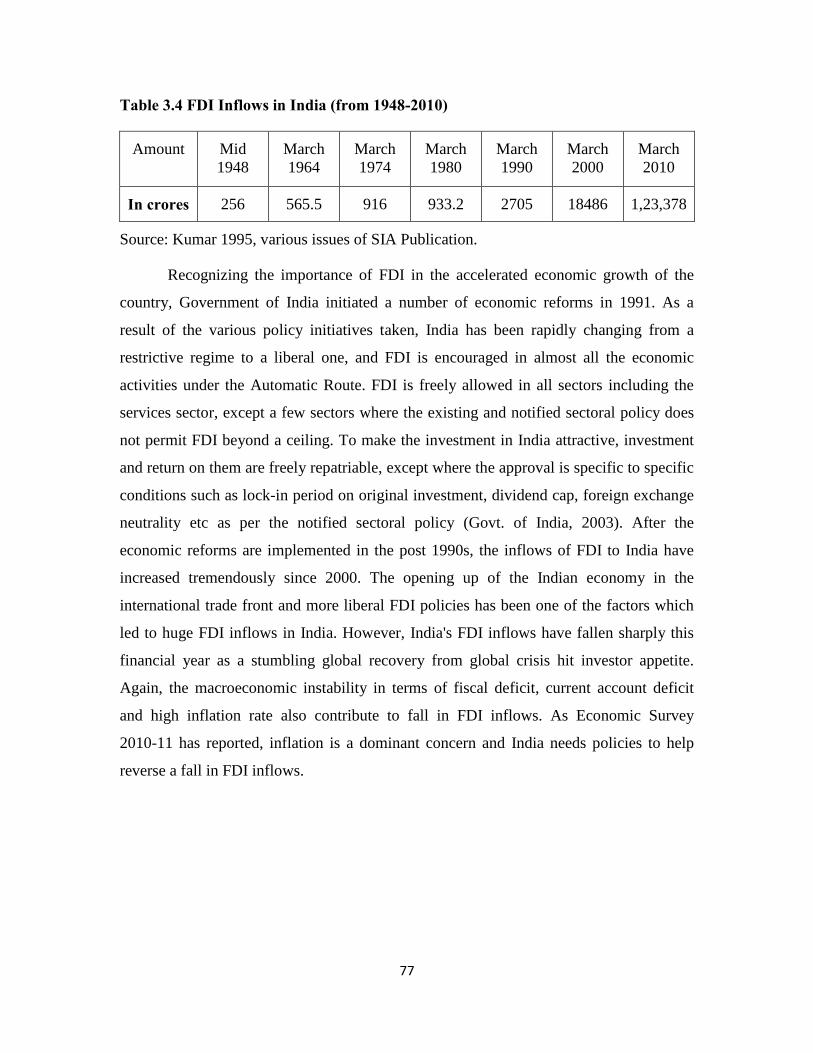
Table 3.4 FDI Inflows in India (from 1948-2010)
Amount Mid
1948
March
1964
March
1974
March
1980
March
1990
March
2000
March
2010
In crores 256 565.5 916 933.2 2705 18486 1,23,378
Source: Kumar 1995, various issues of SIA Publication.
Recognizing the importance of FDI in the accelerated economic growth of the
country, Government of India initiated a number of economic reforms in 1991. As a
result of the various policy initiatives taken, India has been rapidly changing from a
restrictive regime to a liberal one, and FDI is encouraged in almost all the economic
activities under the Automatic Route. FDI is freely allowed in all sectors including the
services sector, except a few sectors where the existing and notified sectoral policy does
not permit FDI beyond a ceiling. To make the investment in India attractive, investment
and return on them are freely repatriable, except where the approval is specific to specific
conditions such as lock-in period on original investment, dividend cap, foreign exchange
neutrality etc as per the notified sectoral policy (Govt. of India, 2003). After the
economic reforms are implemented in the post 1990s, the inflows of FDI to India have
increased tremendously since 2000. The opening up of the Indian economy in the
international trade front and more liberal FDI policies has been one of the factors which
led to huge FDI inflows in India. However, India's FDI inflows have fallen sharply this
financial year as a stumbling global recovery from global crisis hit investor appetite.
Again, the macroeconomic instability in terms of fiscal deficit, current account deficit
and high inflation rate also contribute to fall in FDI inflows. As Economic Survey
2010-11 has reported, inflation is a dominant concern and India needs policies to help
reverse a fall in FDI inflows.
78
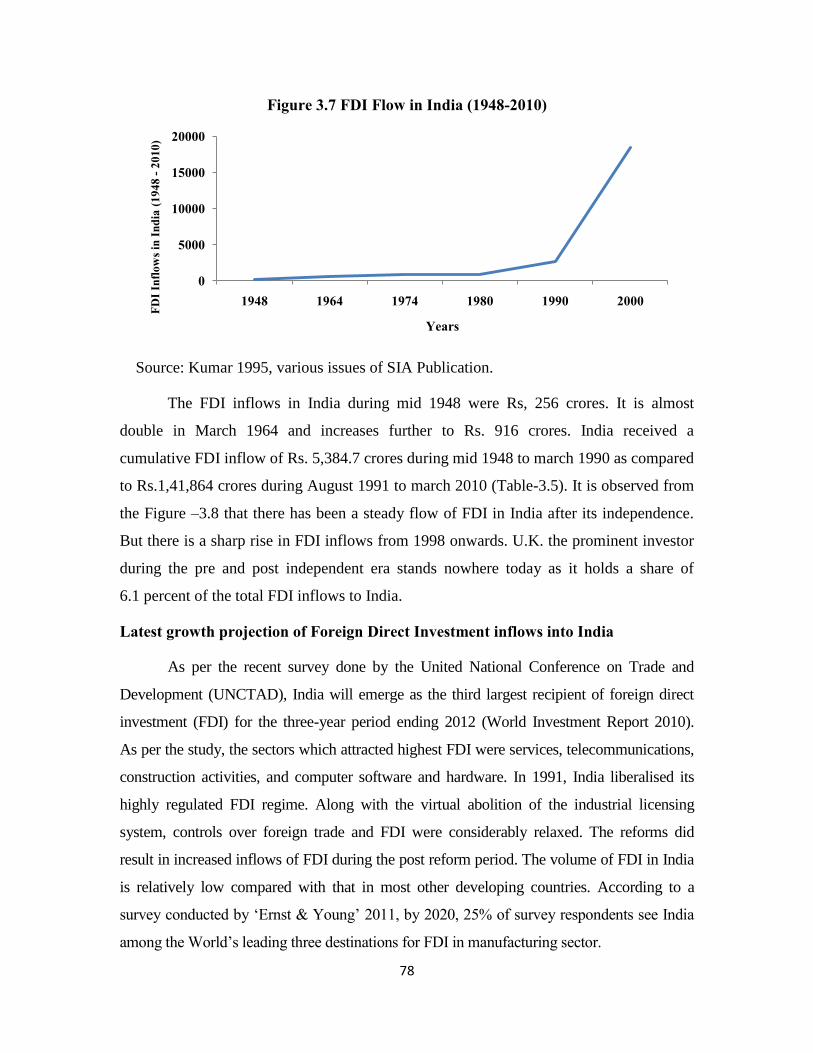
Figure 3.7 FDI Flow in India (1948-2010)
Source: Kumar 1995, various issues of SIA Publication.
The FDI inflows in India during mid 1948 were Rs, 256 crores. It is almost
double in March 1964 and increases further to Rs. 916 crores. India received a
cumulative FDI inflow of Rs. 5,384.7 crores during mid 1948 to march 1990 as compared
to Rs.1,41,864 crores during August 1991 to march 2010 (Table-3.5). It is observed from
the Figure –3.8 that there has been a steady flow of FDI in India after its independence.
But there is a sharp rise in FDI inflows from 1998 onwards. U.K. the prominent investor
during the pre and post independent era stands nowhere today as it holds a share of
6.1 percent of the total FDI inflows to India.
Latest growth projection of Foreign Direct Investment inflows into India
As per the recent survey done by the United National Conference on Trade and
Development (UNCTAD), India will emerge as the third largest recipient of foreign direct
investment (FDI) for the three-year period ending 2012 (World Investment Report 2010).
As per the study, the sectors which attracted highest FDI were services, telecommunications,
construction activities, and computer software and hardware. In 1991, India liberalised its
highly regulated FDI regime. Along with the virtual abolition of the industrial licensing
system, controls over foreign trade and FDI were considerably relaxed. The reforms did
result in increased inflows of FDI during the post reform period. The volume of FDI in India
is relatively low compared with that in most other developing countries. According to a
survey conducted by ‗Ernst & Young‘ 2011, by 2020, 25% of survey respondents see India
among the World‘s leading three destinations for FDI in manufacturing sector.
0
5000
10000
15000
20000
1948 1964 1974 1980 1990 2000
FDI I
nflo
ws i
n In
dia
(194
8 -2
010)
Years
79
3.4.4 The Role of Investment Promotion Agencies of India in attracting FDI
The Foreign Investment Promotion Agencies aims to attract FDI will undertake
the investment promotional activity which entails making extensive contact with potential
investors, lobbying and interacting with individual companies etc. The Council with
distinguished and well known experts as the members will capitalize, manage and
coordinate investment promotion and marketing efforts. It also assists potential investors
in finding joint venture partners and provides information on relevant policies and
procedures. Advisory services are also provided on-line through the website, apart from
information through meetings, promotional events etc.
The Foreign Investment Promotion Council
The Government has constituted a Foreign Investment Promotion Council (FIPC),
to undertake vigorous investment promotion and marketing activities. The Presidents of
the three apex business associations such as ASSOCHAM (Associate Chamber of
Commerce and industry of India), CII (Confederation of Indian Industry) and FICCI will
be members of the Council. Ministry of Industry personnel will be Member-Secretary.
Foreign Investment Promotion Board (FIPB)
The Foreign Investment Promotion Board (FIPB) is a government body that
offers a single window clearance for proposals on Foreign Direct Investment (FDI) in
India that are not allowed access through the automatic route. The objective of the Board
is to promote foreign direct investment into India - 1) by undertaking investment
promotion activities; and 2) facilitating investment in the country by international
companies, Non Resident Indians (NRIs) and other foreign investors.
SIA (Secretariat for Industrial Assistance)
SIA has been set up by Government of India in the Department of Industrial
Policy & Promotion in the Ministry of Industry to provide a single window for
entrepreneurial assistance, investor facilitation, processing all applications which require
Government approval, assisting entrepreneurs and investors in setting up projects
(including liaison with other organizations and State Governments) and in monitoring the
implementation of projects.
80
SIA's Promotional Activities
As an investor friendly agency, it provides information and assistance to Indian
and foreign companies in setting up industry and making investments. It disseminates
information and data on a monthly basis through the "SIA Newsletter" and the "SIA
Statistics" as also through its Website address i.e. http://indmin.nic.in. It also assists
potential investors in finding joint venture partners and provides information on relevant
policies and procedures. Advisory services are also provided on-line through the website,
apart from information through meetings, promotional events etc.
Foreign Investment Implementation Authority (FIIA)
This has been set up to facilitate quick translation of FDI approvals into
implementation as also to provide a one stop service to foreign investors by helping them
to obtain necessary approvals, sort out operational problems and meet with Government
agencies to find solutions to problems. The FIIA is headed by the Secretary (Deptt. Of
Industrial Policy & Promotion) and is serviced by the SIA.
The Department of Industrial Policy & Promotion
The Department of Industrial Policy & Promotion was established in 1995 and
has been reconstituted in the year 2000 with the merger of the Department of Industrial
Development. The role and functions of the Department of Industrial Policy and
Promotion primarily include:
Formulation of Foreign Direct Investment (FDI) Policy and promotion, approval
and facilitation of FDI;
Encouragement to foreign technology collabourations at enterprise level and
formulating policy parameters for the same;
The Department is responsible for encouraging acquisition of technological
capability in various sectors of the industry through liberal foreign technology
collabouration regime. Foreign technology induction is facilitated both through FDI and
through Foreign Technology Collabouration (FTC) agreement. FTC agreements are
approved either through the automatic route under the delegated power exercised by the
RBI or by the Government.
81
The Investment Promotion and Infrastructure Development Cell
This is a specially created cell with the following main functions :
a) Dissemination of information about investment climate in India. b) Investment
facilitation. c) Development and distribution of publicity material and information.
d) Organising meetings, symposiums, seminars on investment promotion. e) Match-
making services for investment promotion. f) Coordination of progress of infrastructure
projects such as in the power, telecom, ports & roads sector. g) Projects on Industrial
model towns, Industrial Parks etc. h) Specific promotion of Investment including foreign
direct investment in the infrastructure sector. i) Dissemination of specific information on
sectoral policies and guidelines about the infrastructure sector. j) Secretariat to Business
Ombudsperson. k) Project Monitoring Wing.
Invest India
Invest India is the country‘s official agency dedicated to investment promotion
and facilitation. Invest India partners with the official investment promotion agencies of
several countries (USA, UK, France, Italy, Japan, Korea and Mauritius) to enhance
investment and broader bilateral economic ties. In recent periods, it has forged close ties
with its counterpart agencies in the UAE, Saudi Arabia and Singapore, and is also the
nodal agency for coordinating the investment-component of a joint initiative of the
Ministry of External Affairs and the Ministry of Commerce and Industry relating to
Africa.
82
References
Alfaro, Laura, Rodriguez-Clare, Andres. (2004). ―Multinationals and Linkages: An Empirical
Investigation‖, Economia, Vol 4, p. 113-169.
Alquacil, Maite, Cuadros, Ana, Orts, Vincente. (2008). ―EU Enlargement and inward
FDI‖, Rewiew of Development Economics, Vol 12, p.594-604.
Blomström, Magnus, Kokko, Ari. (1997). ―Regional Integration and Foreign Direct
Investment‖, Working Paper Series in Economics and Finance, No.172.
Blomström, Magnus, Kokko, Ari. (1998). ―Multinational Corporations and Spillovers‖,
Journal of Economic Surveys, Vol 12, p.247-277.
Cantwell J. & Narula R. (2001). ―The Eclectic Paradigm in the Global Economy‖, International
Journal of Economics and Business, 8 (2): 155-72.
Cantwell J. (2000). ―A Survey of Theories of International Production‖ in Pitelis C. N. &
Sugden R. (eds.), The Nature of the Transnational Firm, London: Routledge.
De Mello, Luiz R Jr. (1999). ―Foreign direct investment-led growth: Evidence from time
series and panel data‖, Oxford Economic Papers, Vol 51, p. 133-151.
Dominic Wilson, Constantin Burgi, Stacy Carlson in BRICs Monthly Issue No: 11/05
Dominic Wilson and Anna Stupnytska (2007). You Reap What You Sow: Our 2006
Growth Environment. Scores (GES). 08-Nov-06.
Dunning J.H. (1988). ―The Eclectic Paradigm of International Production: A Restatement
and Some Possible Extensions‖, Journal of International Business Studies,
19 (1): 1-32.
Dunning, J. H. (1993). Multinational Enterprises and the Global Economy, Workingham:
Addison-Wesley.
Dunning, John H., Narula, Rajneesh. (1996). ―The investment development path
revisited‖, in Foreign Direct Investment and Government‘s: catalysts for
economic restructuring, London, Routledge.
83
Faeth, Isabel. (2009). ―Determinants of Foreign Direct Investment- a Tale of Nine
Theoretical Models‖, Journal of Economic Surveys, Vol. 23, No. 1, p. 165-196.
Foreign Direct Investment for Development: Overview16 © OECD 2002.
Goldman Sachs Global Economics, May 31, 2011 ―Population Growth and Ageing in the
BRICs‖ Commodities and Strategy Research at https://360.gs.com
Helpman E. (1984). ―A Simple Theory of International Trade with Multinational
Corporations‖, Journal of Political economy, 92 (3): 451-71.
http://www.sgi-network.org/brics
http://rbi.org.in/Scripts/BS_FemaNotifications.aspx?Id=174
http://rbi.org.in/Scripts/BS_FemaNotifications.aspx.
http://unctad.org/en/Docs/diaeia20098_en.pdf
http://unctad.org/en/PublicationsLibrary/wir2012overview_en.pdf
http://www.arthapedia.in/index.php?title=Foreign_Institutional_Investor_(FII)
Jim O Neil. The Growth Map. Economic opportunity in the BRICs and beyond, 2011.
June. (2001). IMF, Finance and Development Magazine.
Mundell R. (1957). ―International Trade and Factor Mobility‖, American Economic
Review, 47 (3): 321-35.
O‘Neill 2001, Orgaz et al. (2011).
OECD Fact Book. (2010).
Prakash Loungani and Assaf Razin. (2001). How Beneficial Is Foreign Direct Investment
for Developing Countries?, June 2001. IMF, Finance and Development Magazine.
Razin, Assaf, Sadka, Efraim, Yuen, Chi-Wa. (1999). ―An Information-Based Model of
Foreign Direct Investment: The Gains from Trade Revisited‖, International Tax
and Public Finance, Vol 6, p. 579-596.
Rodriguez-Clare, Andres. (1996). ―Multinationals, linkages and economic development‖,
the American Economic Review, Vol 86, p. 852-874.
84
The role of International Investment Agreements in attracting FDI in developing
countries ; UNCTAD series on International Investment Policies for Development,
UNCTAD, Geneva 2009.
TWE No.1621-5 June (1997). TWN Third World Network ;WWW.twn.org.sg
Wiki Answers - Categories - Business & Finance - Economics - 2009 Economic Stimulus
Plan - Disadvantages of FDI in home and host country?
Source: FDI, Domestic Investment and Economic Growth: A Theoretical Framework
Bhissum Nowbutsing, University of Technology Mauritius.
https://smartech.gatech.edu/bitstream/handle/1853/35284/1245002088_BN_1.pdf