an overview of reports - peregrine academics€¦ · internal analysis report the internal analysis...
TRANSCRIPT

An Overview of Reports
Peregrine Academic Services

Internal Analysis Report

Internal Analysis Report
The Internal Analysis Report is most commonly used for learning outcomes
analyses (with one aggregate pool selection).
School results are compared at the topic and subject levels based on
percent scores and percentile rankings to determine if student performance
is below, at, or above desired thresholds established by the school.

Inbound/Outbound OverviewThe first graph is a side-by-
side overview of the exam
results. If Inbound Exams are
included, this graph will
display both the inbound and
outbound exam averages.
The topic averages and the
sub-topic averages will both
be shown (the topics of
Management and Economics
include sub-topics).

Score/Completion Time Scatter Plots
The scatter plots are sorted by Exam Completion Time (low to high) and
plotted as such with the scores of the shorter completion time shown to the
left and the scores with the longer completion time shown towards the right.
The Y axis is exam score and the X axis is completion time. Scatter plots are
shown for both Inbound and Outbound Exam results for total, topic, and
subtopic.
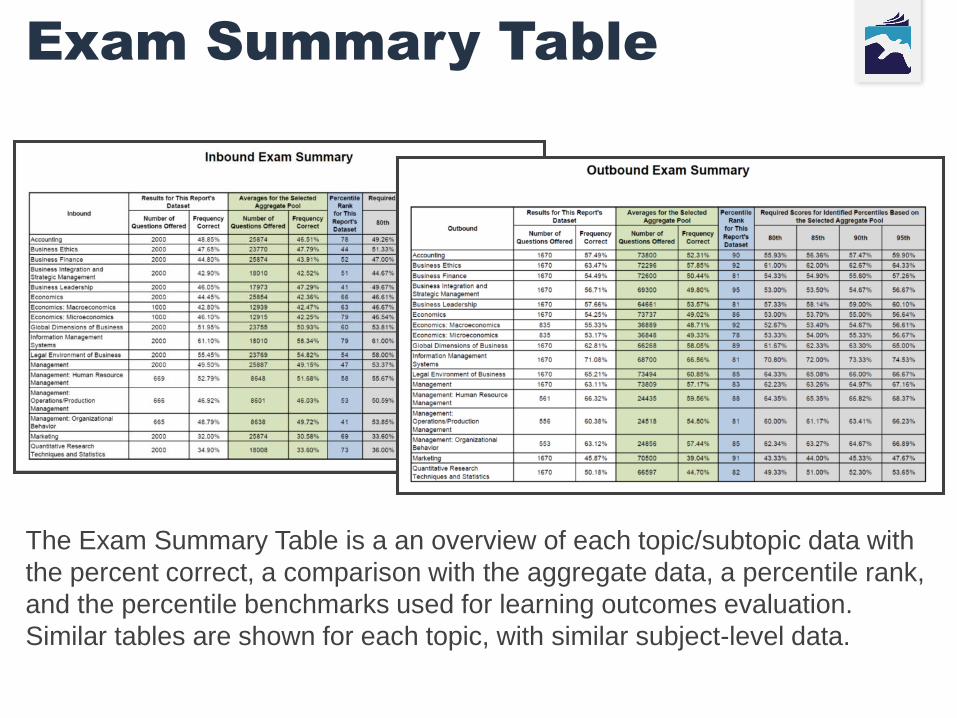
Exam Summary Table
The Exam Summary Table is a an overview of each topic/subtopic data with
the percent correct, a comparison with the aggregate data, a percentile rank,
and the percentile benchmarks used for learning outcomes evaluation.
Similar tables are shown for each topic, with similar subject-level data.

Topic/Subtopic Analysis
For each topic/subtopic for both inbound and
outbound exams, the reported data include:
✓ Inbound Exam/Outbound Exam side-by-
side
✓ Table of the Assessment Summary
Statistics
✓ Scatter Plot of the Score (Y Axis) and
the Completion Time (X Axis)
✓ Bar Graph of the Subjects within the
Topic/Subtopic compared to the selected
aggregate pool used with the report.
✓ A Frequency Analysis Table of the
questions offered on the exam.

Topic/Subtopic Analysis
This table shows the percentile rank and the percentile benchmarks based on the selected aggregate pool. The
percentile ranking calculations and the percentile benchmarks are shown for the selected aggregate pool,
results are subject to sample size limitations.
In general, percentile ranking and percentile benchmarks should be used with caution relative to making
programmatic changes based on the results if the sample of Questions Offered for the aggregate pool is less
than 300 for a specific subject.

External Comparison Report

External Comparison Report
The purpose of the external
comparison report is to show the
school’s inbound and outbound
exam results compared to one or
more selected aggregate pools. Up
to 5 aggregate pools can be selected
for comparison purposes.
Comparisons include a comparison
of the scores and a comparison of
percent change (when inbound
exams are included).

Summary Comparisons
For both inbound and outbound exam sets, overview graphs are provided
for both the comparison of the means and the comparison of percent
change (only available with inbound exams). Different graph sets are
provided for each of the selected aggregate pools.

Topic/Subtopic Comparisons
Comparisons are shown for each topic and subtopic and include both a
comparison of the score means and a comparison of the percent
change from inbound to outbound (if inbound exams are included).

Program/Cohort Comparison Report

Program/Cohort Report
The purpose of this report is to show a side-by-
side comparison of exam results for different
programs or cohorts of students and then
compare these results with one or more selected
aggregate pools.
A “program” is an academic program (e. g. BA in
Business Economics). Usually, these are different
exams, but could also be pull-down menus that
students use when they start the exam.
A “cohort” could be any number of areas including
specializations, campus locations, online vs. on-
campus students, etc.). Students use pull-down
menus to indicate their cohort at the start of the
exam.

Topic/Subtopic Analysis
In this example, the exams for each
of the 5 compared programs
included the topic “Business
Ethics”.
The green line (and data point
shown above the graph) are for the
selected aggregate pool. More than
one pool can be selected when
generating this report.

Longitudinal Analysis Report

Longitudinal Analysis Report
The purpose of this report is to show a side-by-
side comparison of exam results for different
exam periods (e. g. semester, year, quarter) and
then compare these results with one or more
selected aggregate pools.
The user can select up to 4 different exam
periods and each period is defined by a specific
date range.
Aggregate data are available for both Inbound
and Outbound exam averages; however, we do
not have similar aggregate pools for mid-point
exams.
Use of this report is typically with accreditation
submissions to show data points over time.

Topic/Subtopic Analysis
Similar graphs are shown for each topic and subtopic included on the exam.
NOTE: We do not maintain aggregate pool data for mid-point exams because the application and administration of these mid-point exams is not consistent between schools.

Regression Analysis
Similar graphs are shown for
each topic and subtopic included
on the exam.
The regression analysis allows
you to readily see trends
between time periods.

Pairwise Report

Pairwise Report
If the school uses both inbound and outbound
exams, then pairwise reporting is possible once
the individual students who completed an
inbound exam also complete an outbound
exam.
Pairwise reporting is possible after 2-3 years of
testing because it will generally take that long
for a student starting their program (inbound
exam) to then graduate from the program
(outbound exam).
The purpose of the report is to show a
summary of individual student results over time.

Student Analysis
For each selected student, the side-
by-side inbound/outbound exam
results are shown.
Shown for each topic/subtopic are:
✓ Percent Difference
✓ Percent Change
✓ Inbound Average (based on this set of results)
✓ Outbound Average (based on this set of results

Academic Leveling Course Report

ALC Student Summary Report
The purpose of this report is to simply
summarize the total set of results and to
show student-by-student results.
The score results by each student are
the same as what is listed on the
individual student completion
certificates.
The dates of the report are listed on the
report cover.
The student names and ID numbers
included within the report are also listed
on the report cover.

Student Results
For each student, a summary of the
student’s results are shown for each ALC
course. If no data are shown, as with the
post-test score for Quant/Statistics in this
example, it means that the student has
not completed the post-test within the
reported period.
The red vertical line is the total average
scores, that is the averages of the ALC
course post-test scores. This line is
shown to indicate relativity of the scores.

Grade Scale Report
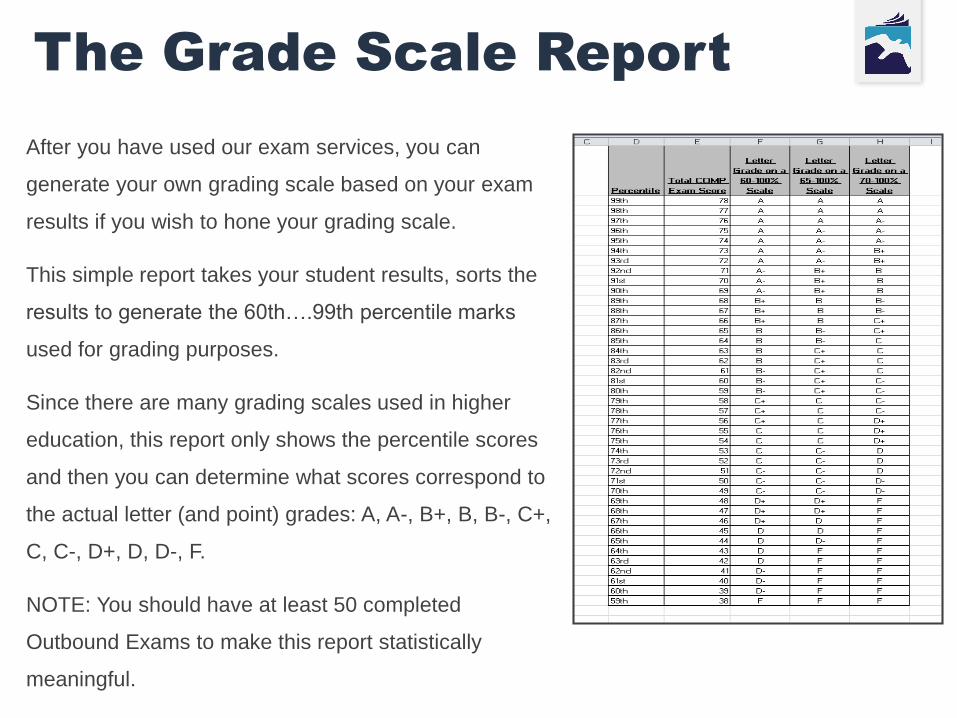
The Grade Scale Report
After you have used our exam services, you can
generate your own grading scale based on your exam
results if you wish to hone your grading scale.
This simple report takes your student results, sorts the
results to generate the 60th….99th percentile marks
used for grading purposes.
Since there are many grading scales used in higher
education, this report only shows the percentile scores
and then you can determine what scores correspond to
the actual letter (and point) grades: A, A-, B+, B, B-, C+,
C, C-, D+, D, D-, F.
NOTE: You should have at least 50 completed
Outbound Exams to make this report statistically
meaningful.

Response Distractors Report

Response Distractors Report
The Response Distractor Report allows school officials to understand the reasons behind why students answered questions incorrectly based on five types of response distractors. The report helps schools with improving the quality of academic programs and delivery of programs to students.

640 N. Hwy. 14-16, Suite J
PO Box 741
Gillette, WY 82717
Phone: +1 307 685 1555
Email: [email protected]
Website: PeregrineAcademics.com
© 2017 Peregrine Academic Services
Contact Information