an overview of south africa ˇs vanadium industry …
TRANSCRIPT

REPORT R55/2008
AN OVERVIEW OF SOUTH AFRICA’S VANADIUM
INDUSTRY DURING THE PERIOD 1997 - 2006
DIRECTORATE: MINERAL ECONOMICS

REPORT R55/2008
AN OVERVIEW OF SOUTH AFRICA’S VANADIUM
INDUSTRY DURING THE PERIOD 1997 - 2006
DIRECTORATE: MINERAL ECONOMICS
Compiled by: Charlotte MosianeEmail: [email protected]
Issued by and obtainable fromThe Director: Mineral Economics, Trevenna Campus,
70 Meintjies Street, Arcadia, Pretoria 0001, Private Bag X59, Arcadia 0001Telephone (012)444-3536, Telefax (012) 444-3134
Website: http://www.dme.gov.za

DEPARTMENT OF MINERAL RESOURCES
Director-General Adv. S Nogxina
MINERAL POLICY AND PROMOTION BRANCH
Deputy Director-General Ms NP Zikalala
MINERAL PROMOTION CHIEF DIRECTORATE
Chief Director Vacant
DIRECTORATE MINERAL ECONOMICS
Director: Mineral Economics Mr M Mabuza
Deputy Director: Precious Metals and Minerals and
Ferrous Minerals: Mr. TR Masetlana
WHEREAS THE GREATEST CARE HAS BEEN TAKEN IN THE COMPILATION OF THE
CONTENTS OF THIS PUBLICATION, THE DEPARTMENT OF MINERALS AND ENERGY DOES
NOT HOLD ITSELF RESPONSIBLE FOR ANY ERRORS OR OMISSIONS.
ISBN: 978-1-919927-81-7 COPYRIGHT RESERVED

i
TABLE OF CONTENTS
Content Page
List of Figures ii
1. Introduction 1
2. Vanadium Operations in South Africa 2
3. Vanadium Extraction Process 3
4. Vanadium Applications 4
5. Global Supply Demand Dynamics 5
5.1. The Effect of Steel Production on Vanadium 5
5.2. The China Factor 5
6. SA’s Vanadium supply and Consumption 6
6.1. Supply 6
Production 6
Vanadium Stocks 7
6.2. Consumption 8
Total Sales 8
SA Vanadium Unit Values 10
Vanadium Export Sales 10
Export Sales Distribution 11
Domestic Sales 12
7. Employment in SA Vanadium Industry 13
8. Conclusions and Outlook 14
9. References 15
Annexure 1 16
Annexure 2 17

ii
LIST OF FIGURES
Figure Page
1. Global Vanadium Reserves, 2006 2
2. Vanadium Consumption, 1999 – 2006 5
3. China’s Steel Contribution to the Global Output, 1997 – 2006 6
4. SA Vanadium Production, 1997-2006 7
5. SA Vanadium Stock, 1997 – 2006 8
6. SA Vanadium Total Sales, 1997 – 2006 9
7. Vanadium Prices, 1997 – 2006 9
8. Unit Values, 1997 – 2006 10
9. SA Vanadium Export Sales, 1997 – 2006 11
10. Export Mass Distribution, 2006 11
11. Export Revenue Distribution, 2006 12
12. Domestic Vanadium Sales, 1997 – 2006 13
13. Employment in the SA Vanadium Industry, 1997 – 2006 14

1
1. INTRODUCTION
Although vanadium is the thirteenth most common metallic element, it is
perceived to be one of the rarest elements in terms of crustal abundance. Its
rarity is due to fact that, despite being widely distributed, concentrations are low.
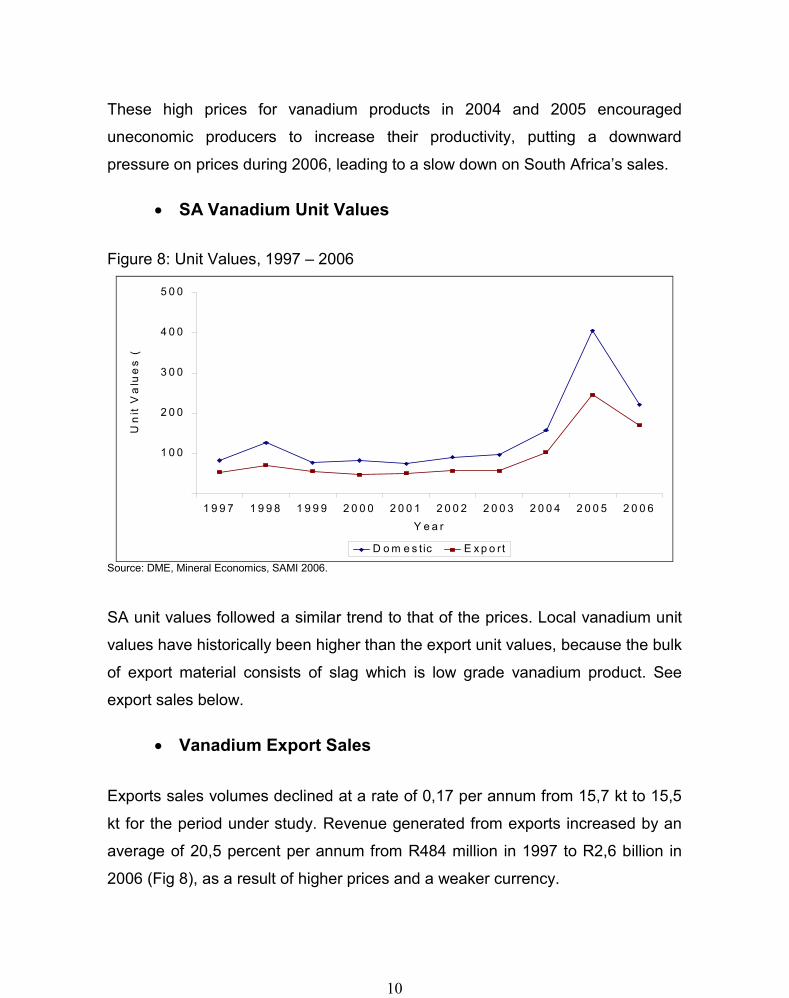
Vanadium can be produced from a number of sources. It is mainly associated
with the titaniferrous magnetite deposits, the bulk of which is hosted in the upper
zone of the Bushveld Complex of South Africa (Annexure 1). Other sources
include uranium ore, phosphorous ore, crude oil, power plant ash and slag.1
The Bushveld Igneous Complex runs across the North-West, Limpopo and
Mpumalanga Provinces, and is also a dominant host of Platinum Group Metals
(PGM’s) and Chromite deposits. Due to the scarcity of the vanadium element,
exploitable values of less than 1,5 percent vanadium are found in South Africa’s
magnetite deposits. Exploitation of vanadium in South Africa dates back to 1957
at Witbank, in the Mpumalanga Province1.
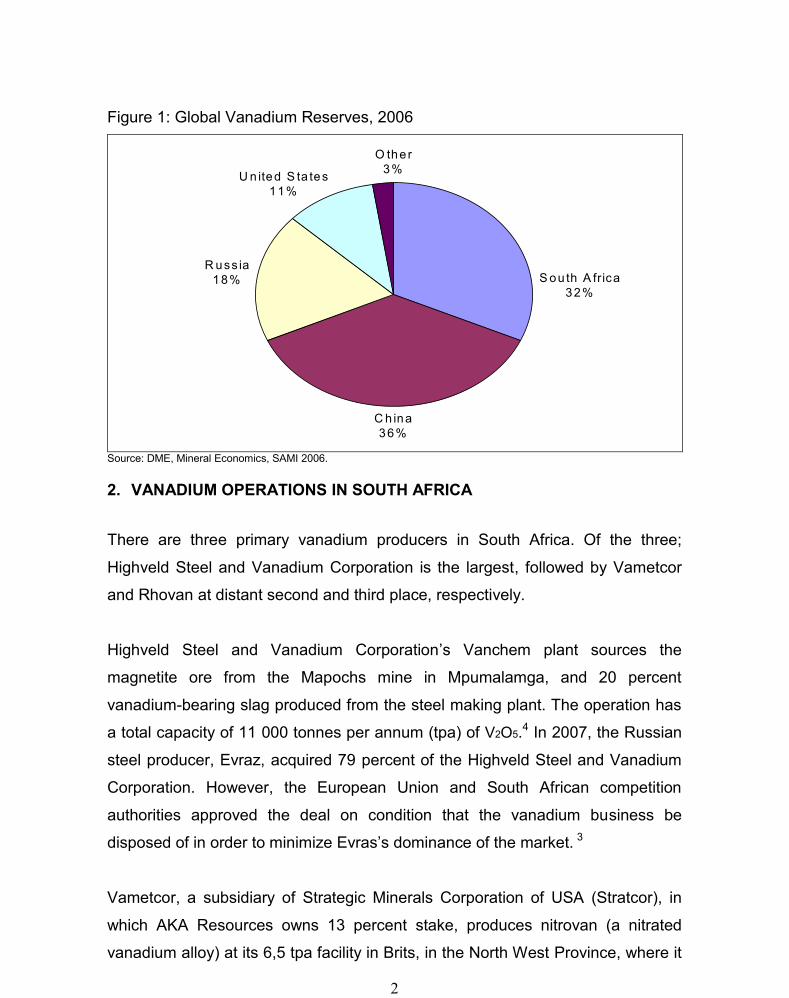
World vanadium reserves amounted to 27 Mt before 2002, dominated by South
Africa, which then accounted for 44 percent (12 Mt). However, in 2002, new
information confirmed additional reserves of 11 Mt from China, boosting its
vanadium reserves and world reserves to 14 Mt and 38 Mt, respectively.
Consequently, South Africa became the second largest host of vanadium after
China, accounting for about 32 percent of the reserves (Fig 1).2
2
Figure 1: Global Vanadium Reserves, 2006
C h ina36%
R uss ia18% S ou th A frica
32%
O ther3%U n ited S ta tes
11%
Source: DME, Mineral Economics, SAMI 2006.
2. VANADIUM OPERATIONS IN SOUTH AFRICA
There are three primary vanadium producers in South Africa. Of the three;
Highveld Steel and Vanadium Corporation is the largest, followed by Vametcor
and Rhovan at distant second and third place, respectively.
Highveld Steel and Vanadium Corporation’s Vanchem plant sources the
magnetite ore from the Mapochs mine in Mpumalamga, and 20 percent
vanadium-bearing slag produced from the steel making plant. The operation has
a total capacity of 11 000 tonnes per annum (tpa) of V2O5.4 In 2007, the Russian
steel producer, Evraz, acquired 79 percent of the Highveld Steel and Vanadium
Corporation. However, the European Union and South African competition
authorities approved the deal on condition that the vanadium business be
disposed of in order to minimize Evras’s dominance of the market. 3
Vametcor, a subsidiary of Strategic Minerals Corporation of USA (Stratcor), in
which AKA Resources owns 13 percent stake, produces nitrovan (a nitrated
vanadium alloy) at its 6,5 tpa facility in Brits, in the North West Province, where it
3
operates a captive mine. 6 However, due to depletion of the economic reserves,
the mine has not been able to satisfy Vametcor’s growing demand for ore, as a
result of which slag from Highveld is used to upgrade the ore.4 Stratcor is 73
percent owned by Evraz, 6 this is part of the reason the vanadium business
acquired from Highveld had to be disposed of, to minimize Evras’s dominance in
the vanadium industry.
Rhovan is part of Xstrata Alloys SA, which sources its titaniferrous magnetite ore
from an integrated operation located in Brits. The plant was built in 1997 with the
original capacity of 4 800 t of vanadium pentoxide. Through capacity expansion,
Xstrata raised production at its Rhovan plant to 9 300 t of V2O5 per annum, to
make up for the closure of PMA’s Windimurra plant in Australia and the
exhaustion of ore at Xstrata’s Vantech operation in 2003.4
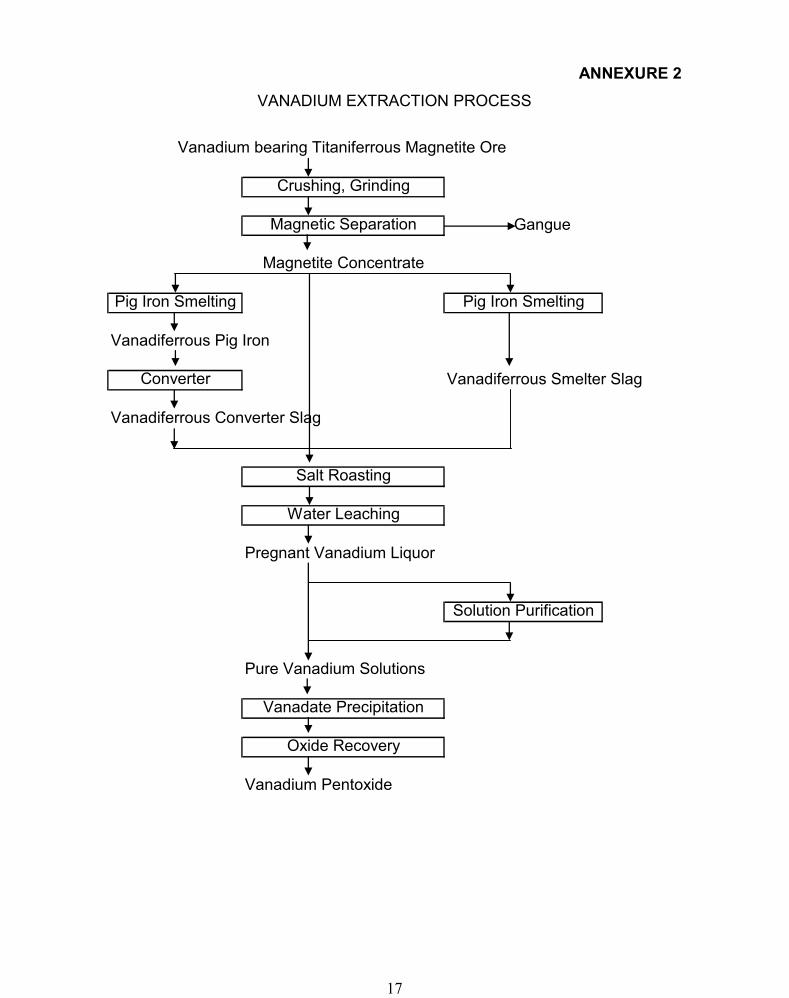
3. VANADIUM EXTRACTION PROCESS
Four vanadium products are produced from the magnetites, i.e. Vanadium
Pentoxide (V2O5), Nitrovanadium (NV), Vanadium in slag and Ferrovanadium
(FeV) alloy.
The magnetite ore is first concentrated through crushing, grinding and magnetic
separation to produce a magnetic concentrate. The concentrate is then roasted
in a kiln to produce a water soluble sodium vanadate, which is then leached with
ammonia to produce a pregnant solution containing V205 with high silica content.
This is followed by the de-silication process, which removes silica to improve
product quality of the pregnant solution. Vanadium is then precipitated from the
solution in the form of ammonium vanadate, which is then filtered and de-
ammonised. The V205 produced is in a form of a powder, which is not suitable for
transportation to customers. Consequently the pentoxide powder is melted in a
fusion furnace and formed into flakes. FeV is produced by first reducing the V205
to Vanadium Trioxide (V203) and then reacting this with iron and aluminium to
produce Ferrovanadium.9 (Annexure 2).

4
4. VANADIUM APPLICATIONS
The general uses of vanadium include metallurgical and chemical applications.
Vanadium demand is largely driven by the carbon steel manufacturing industry,
which accounts for about 90 percent of world vanadium consumption. 5 Niobium,
which has almost similar properties to vanadium, is used as a substitute for
vanadium when vanadium prices are very high or when supply is in deficit.
In metallurgical applications, vanadium is used in steel industry for retarding
grain growth at elevated temperatures with its affinity for carbon and nitrogen to
form carbides & nitrides promoting finer grain size, increased hardenability,
imparting high strength and improved wear resistance. Due to these properties, it
finds extensive use in High Strength Low Alloy Steels (HSLA), constructional
alloy steels, carburizing steel grades, rail steels, heat resisting tool and die
steels, creep resistant martensitic stainless steels as well as in forging and cold
heading steel grades. Today, HSLA steels substitute carbon steels in many
applications which include pipelines, concrete reinforcing bars, structural shapes,
flat steels and automobile components as these steels permit lower design
weight with increased strength coupled with increased weldability through
addition of vanadium. Due to its high temperature strength, vanadium is applied
in super alloy industry for making turbine blades and jet engines. It is also used
as a stabiliser in titanium aluminium alloys in aerospace industry.
In chemical applications, vanadium compounds are used in oxidation catalysts
for the production of sulphuric acids and the cracking of petroleum products in
chemical industry. It is also used as a glass and ceramic pigment, in permanent
magnets, dryers, paints and varnishes, processing of colour films, small
rechargeable batteries and catalysts for the control of exhaust fumes in diesel
engines. Vanadium is also used in electro-chemical energy storage systems in a
form of Vanadium Redox Flow Batteries, where its ability to store electrical
energy as chemical energy is exploited. These batteries act as an excellent back-
up energy supply during power outages.

5
5. GLOBAL SUPPLY DEMAND DYNAMICS
5.1. The Effect of Steel Production on Vanadium
There is a clear correlation between vanadium consumption and steel production
(Fig 2). However, vanadium consumption growth was stronger than that of steel
production as a result of increasing vanadium consumption per ton of steel in the
production of high strength steel alloys, between 2001 and 2006.
Figure 2: World Vanadium Consumption, 1999 - 2006
700
800
900
1,000
1,100
1,200
1,300
Jan-99 Jan-00 Jan-01 Jan-02 Jan-03 Jan-04 Jan-05 Jan-06
'000
Ton
s
130
150
170
190
210
230
M lb
s V 2
O5
equi
vale
nt
Crude steel production Vanadium consumptionSource: Xstrata
5.2. The China Factor
China, which increased its contribution to world steel production from 13,6 percent in
1999 to 38,5 percent in 2006, is the largest steel producer, followed by Japan at 9
percent and USA at 8 percent. South Africa’s contribution is insignificant at less than
2 percent.8 Since vanadium adds significant load bearing strength in construction
steels, Chinese construction authorities require the use of vanadium-added
reinforcement bar (rebar) in earthquake-affected areas, which contributes to the
increased vanadium demand from that country.7
Month-Year

6
Figure 3: China’s Contribution to the Global Steel Output, 1997 - 2006
0
5
1 0
1 5
2 0
2 5
3 0
3 5
4 0
1 9 9 7
1 9 9 8
1 9 9 9
2 0 0 0
2 0 0 1
2 0 0 2
2 0 0 3
2 0 0 4
2 0 0 5
2 0 0 6
Y e a r
Pe
rce
nta
ge
Source: World Steel8.
6. SA’S VANADIUM SUPPLY AND CONSUMPTION
6.1 Supply
Production
South Africa’s vanadium production has grown at an average rate of 4,9 percent
per annum (Fig 4), as a result of the growing demand from the steel industry.
Production increased at an accelerated rate during the second half of the period
under study, reaching an average of 24,4 kt, 38 percent higher than the average
of 17,7 kt achieved in the first half.
Higher production volumes, which persisted for most of the period under study,
were due to new capacity, increased capacity utilization and attractive commodity
prices driven by strong demand from the steel industry. The strong growth
experienced during 1998 was followed by 7 percent decline in 1999 on the back
of lower prices.

7
Figure 4: SA Vanadium Production, 1997-2006
G ro th R a te = 4 .8 6
1 5 0 0 0
1 7 0 0 0
1 9 0 0 0
2 1 0 0 0
2 3 0 0 0
2 5 0 0 0
2 7 0 0 0
2 9 0 0 0
1 9 9 7 1 9 9 8 1 9 9 9 2 0 0 0 2 0 0 1 2 0 0 2 2 0 0 3 2 0 0 4 2 0 0 5 2 0 0 6Y e a r
Ma
ss (
t)
Source: DME, Mineral Economics, SAMI 2006.
By 2002, the market equilibrium was achieved as a result of production cutbacks
from previous years and higher demand from China. Consequently, South
Africa’s vanadium production increased to 25,2 kt that year, followed by a
marginal increase in 2003, prompted by the closure of the Windimurra plant in
Australia. However, production fell by 14 percent in 2004, as a result of
Vantech’s (Xstrata) closure and the high inventory levels that had accumulated in
the previous year. This downward movement continued at a slower rate in 2005,
until the market was brought back to a state of equilibrium in 2006, leading to 5
percent increase in vanadium production.
Vanadium Stocks
Vanadium stocks appear to have been building up in South Africa as production
growth became steeper than the sales (Fig 5). Vanadium stocks have doubled
from 3 kt in 2001 to 6 kt in 2002, increasing to 14 kt in 2004, while sales volumes
increased marginally by 1,5 percent per annum.

8
Figure 5: SA Vanadium Stock, 1997 – 2006
- 5 0 0 0
5 0 0 0
1 0 0 0 0
1 5 0 0 0
2 0 0 0 0
2 5 0 0 0
3 0 0 0 0
1 9 9 7 1 9 9 8 1 9 9 9 2 0 0 0 2 0 0 1 2 0 0 2 2 0 0 3 2 0 0 4 2 0 0 5 2 0 0 6
Y e a r
Ma
ss (
t)
P ro d u c t io n C o n s u m p io n S to c k p ile
Source: DME, Mineral Economics, SAMI 2006.
6.2. Consumption
Total Sales
South Africa’s vanadium sales volumes increased at a rate of 1,54 percent pa,
from 16 kt in 1997 to 17,6 kt in 2006. Revenues generated grew by an average of
22,6 percent per annum, from R847 million in 1997 to R3,09 billion (Fig 6) in
2006. The sales revenue remained more or less stable until 2003, after making a
good recovery in 1999. Revenue increased by 33,5 percent between 2004 and
2005, as a result of steep rise in prices (Fig 7).

9
Figure 6: SA Vanadium Total Sales, 1997 - 2006
G ro w th R a te = 1 .5 4
G ro w th R a te = 2 2 .6
1
2
3
4
5
6
1 9 9 71 9 9 8
1 9 9 92 0 0 0
2 0 0 12 0 0 2
2 0 0 32 0 0 4
2 0 0 52 0 0 6
Y e a r
Re
ve
nu
e (
R'b
illio
n)
5 0 0 0
1 0 0 0 0
1 5 0 0 0
2 0 0 0 0
2 5 0 0 0
Ma
ss
(t)
R e v e n u e (R '0 0 0 ) M a s s ( t) E x p o n . (M a s s ( t) ) E x p o n . (R e v e n u e (R '0 0 0 ))
Source: DME, Mineral Economics, SAMI 2006.
Vanadium prices rose by an average of 9,6 percent pa from 1997 to 2006 (Fig 7),
rising steeply, particularly in 2004 and 2005, with pentoxide price increasing from
$6 per pound (lb) in 2004 and peaking at $9,8 lb in 2005. A combination of
higher vanadium demand from steel producers and more stringent regulations in
China requiring higher levels of vanadium usage in construction projects in that
country, contributed to the rising prices.
Figure 7: Vanadium Prices, 1997 – 2006
0
1 0
2 0
3 0
4 0
5 0
6 0
1 9 9 71 9 9 8
1 9 9 92 0 0 0
2 0 0 12 0 0 2
2 0 0 32 0 0 4
2 0 0 52 0 0 6
Fe
r ro
va
na
diu
m (
$/k
g)
0
2
4
6
8
1 0
1 2
Va
na
diu
m P
en
tox
ide
($
/lb
)
F e r ro v a n a d iu m V a n a d iu m P e n to x id e
Source: DME, Mineral Economics, SAMI 2006.
10
These high prices for vanadium products in 2004 and 2005 encouraged
uneconomic producers to increase their productivity, putting a downward
pressure on prices during 2006, leading to a slow down on South Africa’s sales.
SA Vanadium Unit Values
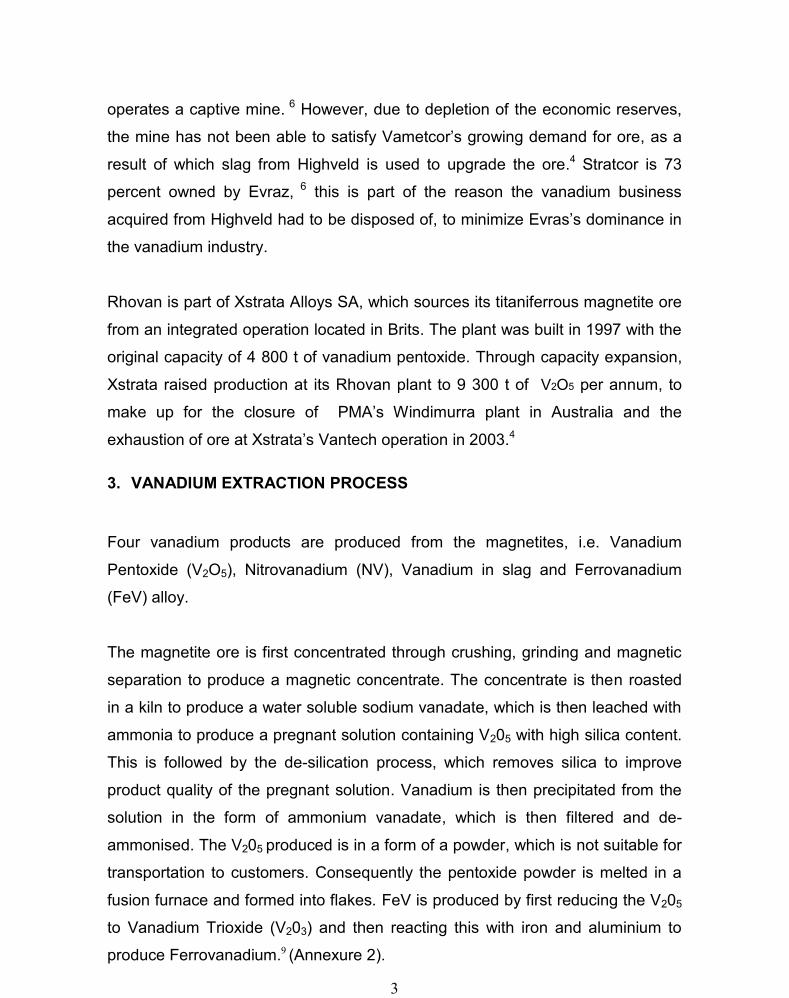
Figure 8: Unit Values, 1997 – 2006
1 0 0
2 0 0
3 0 0
4 0 0
5 0 0
1 9 9 7 1 9 9 8 1 9 9 9 2 0 0 0 2 0 0 1 2 0 0 2 2 0 0 3 2 0 0 4 2 0 0 5 2 0 0 6Y e a r
Un
it V
alu
es
(R
/t)
D o m e s t ic E x p o r t
Source: DME, Mineral Economics, SAMI 2006.
SA unit values followed a similar trend to that of the prices. Local vanadium unit
values have historically been higher than the export unit values, because the bulk
of export material consists of slag which is low grade vanadium product. See
export sales below.
Vanadium Export Sales
Exports sales volumes declined at a rate of 0,17 per annum from 15,7 kt to 15,5
kt for the period under study. Revenue generated from exports increased by an
average of 20,5 percent per annum from R484 million in 1997 to R2,6 billion in
2006 (Fig 8), as a result of higher prices and a weaker currency.

11
Figure 9: SA Vanadium Export Sales, 1997 – 2006
Growth Rate = - 0,17
Growth Rate = 20.5
0.0
0.5
1.0
1.5
2.0
2.5
3.0
3.5
4.0
19971998
19992000
20012002
20032004
20052006
Year
Rev
enue
(R
' bill
ion)
5 000
10 000
15 000
20 000
25 000
Mas
s (t
ons)
Revenue M ass Expon. (M ass) Expon. (Revenue)
Source: DME, Mineral Economics, SAMI 2006.
Export Sales Distribution
At 35 percent, V2O5 in slag constituted a large portion of vanadium exports
volumes. Revenue generated from these volumes amounted to only 4 percent
(Fig 10 and 11) of export sales, at a unit value of around R20 per ton.
Figure 10: Export Mass Distribution, 2006
N itro v a n 8 -1 3 % N itro g e n ,
1 9 %
V 2 O 5 ins la g ,3 5 %
V 2 O 5 infu s e d
p e n to x id e ,1 2 %
F e rro v a n a d iu mV a n a d iu m A llo y ,
3 4 %
Source: DME, Mineral Economics, Statistics 2006.

12
The second largest export volumes are in a form of Ferrovanadium alloy, which
accounts for 34 percent of the export revenue. The corresponding unit value was
R257/t in 2006. Nitrovan and fused pentoxide accounted for 19 and 12 percent of
export sales mass, generating 28 and 16 percent of export revenue at unit values
of R249/t and R215/t, respectively.
Figure 11: Export Revenue Distribution, 2006
F e rro v a n a d iu mV a n a d iu m A llo y ,
5 2 %
N itro v a n 8 -1 3 % N itro g e n ,
2 8 %
V 2 O 5 ins la g ,4 %
V 2 O 5 infu s e d
p e n to x id e ,1 6 %
Source: DME, Mineral Economics, Statistics 2006.
Domestic Sales
The domestic sales mass increased at a rate of 30,1 percent per annum from
313 t in 1997 to 2 034 t in 2006, while revenue from local sales grew by an
average rate of 44 percent per annum from R26 million to R451 million (Fig 12).
However, these sales remained steady at around 290 t from 1997 to 2002, as a
result of unattractive prices, which led to steady revenues during the period.

13
Figure 12: Domestic Vanadium Sales, 1997 - 2006
Growth Rate = 43.73
Growth Rate = 30.1
200
400
600
800
1 000
1 200
1 400
19971998
19992000
20012002
20032004
20052006
Year
Rev
enue
(R'm
illio
n)
500
1 000
1 500
2 000
2 500
3 000
Mas
s (t
)
Value Mass Expon. (Value ) Expon. (Mass)
Source: DME, Mineral Economics, Statistics 2006.
Sales volumes increased by 183 percent from 395 t in 2002 to 1 119 t in 2003,
on the back of attractive prices and higher demand from the international market,
particularly China. As prices continued to rise steeply in 2004 and 2005, local
sales also followed a similar trend. Consequently, revenues generated increased.
In 2005, local sales volumes increased to 2 841 t, generating a revenue of R1,2
billion, as a result of the aforementioned reasons.
7. EMPLOYMENT IN SA VANADIUM INDUSTRY
The number of employees in the SA Vanadium Industry has declined at a rate of
7,9 percent per annum from 1 853 in 1997 to 1 046 in 2006 (Fig 13), this is
attributed to the closure of Xstrata’s Vantech operation and increased technology
utilization. The corresponding remunerations increased at a rate of 2,7 percent
from R131 million in 1997 to R193 million in 2006.

14
Figure 13: Employment in the SA Vanadium Industry, 1997 – 2006
0
50000
100000
150000
200000
250000
19971998
19992000
20012002
20032004
20052006
Y ear
Re
mu
ne
ratio
n (
R'0
00
)
0
500
1000
1500
2000
2500
Nu
mb
er
of
Em
plo
yee
s
R em unera tions E m plyees
Source: DME, Mineral Economics, Statistics 2006.
8. CONCLUSIONS AND OUTLOOK
The South African vanadium production has grown by more than 50 percent from
1997 to 2006. Increased utilisation of vanadium in high strength steel has pushed
its demand upwards leading to higher prices and production. This trend is
projected to continue for an extended period, on a global level, as emerging
economies (China, India and others) continue to industrialise. Increasing intensity of
use, coupled with increasing steel production, is expected to see vanadium
consumption in steel production grow by at least 7 percent per annum from 2006
onwards7.

15
9. REFERENCES
1. Council for Geosciences, The Mineral Resources of South Africa
2. DME Mineral Economics, SAMI 1997 – 2006
3. Highveld Steel and Vanadium Corporation
4. MB Ferroalloy Smith Presentation
5. USGS, Mineral Summary, 2002 & 2006, Vanadium
6. Vametcor, 2008
7. Vanadium Market in the World, Price Status, Trends & Future Pros, BVR Raja
(Internet)
8. World Steel,http://www.worldsteel.org/?action=stats_search&keuze=steel&country=all&from=1997&to=20
06
9. Xstrata Alloys-Vanadium Division IM final rev 29 Nov 2006
16
ANNEXURE 1
VANADIUM DEPOSITS ON THE BUSHFELD COMPLEX
17
ANNEXURE 2VANADIUM EXTRACTION PROCESS
Vanadium bearing Titaniferrous Magnetite Ore
Gangue
Vanadiferrous Pig Iron
Vanadiferrous Smelter Slag
Vanadiferrous Converter Slag
Pregnant Vanadium Liquor
Pure Vanadium Solutions
Vanadium Pentoxide
Pig Iron Smelting Pig Iron Smelting
Salt Roasting
Water Leaching
Crushing, Grinding
Magnetic Separation
Magnetite Concentrate
Solution Purification
Vanadate Precipitation
Oxide Recovery
Converter