an overview of the uits/rt data, analytics, and
TRANSCRIPT

“Getting more from your research data”An Overview of the
UITS/RT Data, Analytics, and Visualization Workshop Series
Eric Wernert UITS Research Technologies
Jan 30, 2018

Goals of these workshops1. Increase awareness of RT groups and services that support research2. Provide a rich set of examples of how services are being used
– Conceptual understanding of methods and technologies– General idea of workflow and effort involved
3. Learn how to find more information or contact experts for follow-up consultation and/or training
Workshops are open to all. This series was designed for students/faculty/staff in social and physical sciences.

Data, Analytics, & Vis Workshop ScheduleSpring 2018 – Tuesdays @ noon - SSRC
Date Topic Presenter(s)
Jan 30 Getting more from your Research Data Eric Wernert, Scott Michael, Esen Tuna, Mike Boyles
Feb 6 Your Statistical Toolbelt Stephanie Dickinson (IU School of Public Health)
Feb 13 Intro to R for Analysis Jefferson Davis, Scott Michael
Feb 20 Databases, Enclaves, and Repositories for Research Esen Tuna, Alan Walsh
Feb 27 Analysis with MATLAB Jefferson Davis, Scott Michael
Mar 6 Intro to Scientific Visualization with Paraview Bill Sherman, Mike Boyles
Mar 13 ( Spring Break)
Mar 20 Creating Computational Interfaces Scott Michael, Tassie Gniady
Mar 27 Structural Equation Modeling Justin Wild
Apr 3 GIS Software & Data Sources for Research Justin Peters
Apr 10 Intro to Information Visualization Jefferson Davis, David Reagan

RT Org Chart
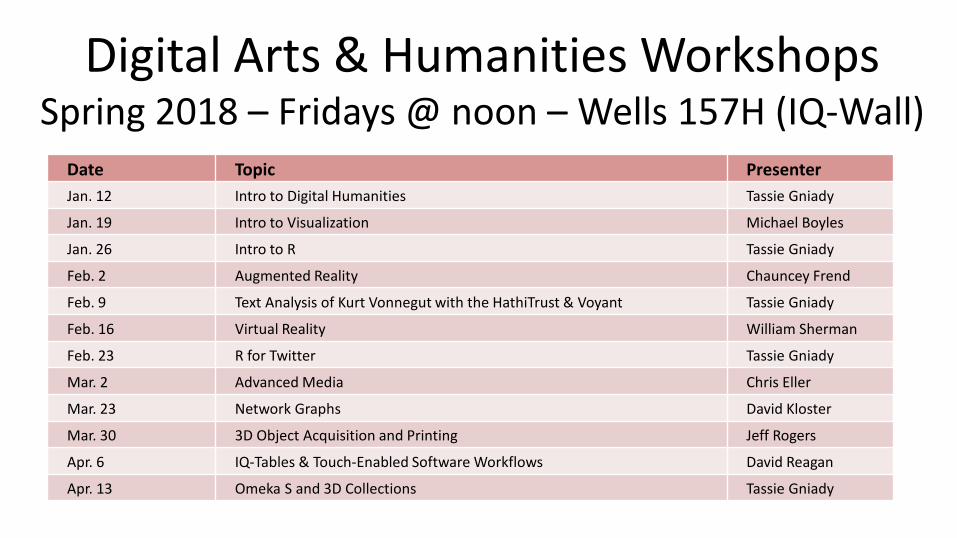
Digital Arts & Humanities WorkshopsSpring 2018 – Fridays @ noon – Wells 157H (IQ-Wall)
Date Topic PresenterJan. 12 Intro to Digital Humanities Tassie Gniady
Jan. 19 Intro to Visualization Michael Boyles
Jan. 26 Intro to R Tassie Gniady
Feb. 2 Augmented Reality Chauncey Frend
Feb. 9 Text Analysis of Kurt Vonnegut with the HathiTrust & Voyant Tassie Gniady
Feb. 16 Virtual Reality William Sherman
Feb. 23 R for Twitter Tassie Gniady
Mar. 2 Advanced Media Chris Eller
Mar. 23 Network Graphs David Kloster
Mar. 30 3D Object Acquisition and Printing Jeff Rogers
Apr. 6 IQ-Tables & Touch-Enabled Software Workflows David Reagan
Apr. 13 Omeka S and 3D Collections Tassie Gniady
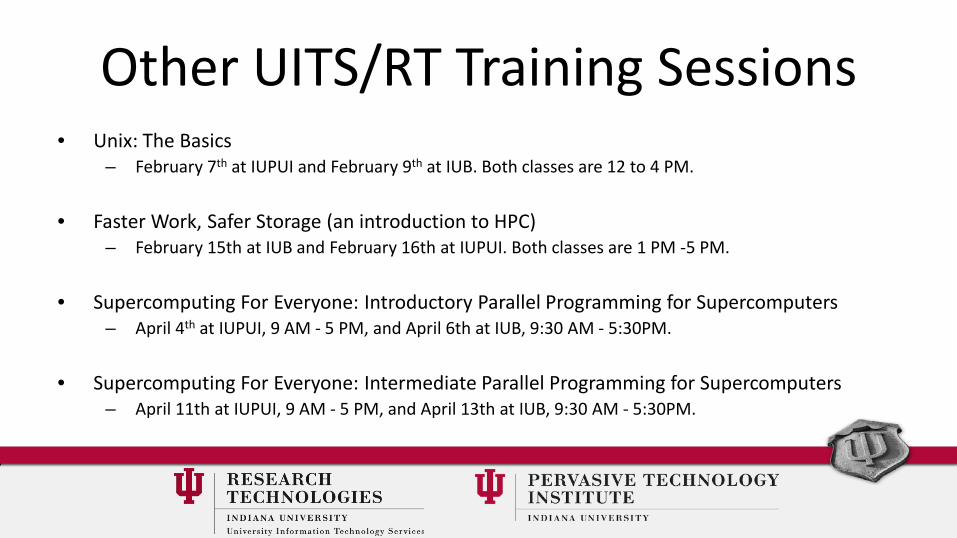
Other UITS/RT Training Sessions• Unix: The Basics
– February 7th at IUPUI and February 9th at IUB. Both classes are 12 to 4 PM.
• Faster Work, Safer Storage (an introduction to HPC)– February 15th at IUB and February 16th at IUPUI. Both classes are 1 PM -5 PM.
• Supercomputing For Everyone: Introductory Parallel Programming for Supercomputers– April 4th at IUPUI, 9 AM - 5 PM, and April 6th at IUB, 9:30 AM - 5:30PM.
• Supercomputing For Everyone: Intermediate Parallel Programming for Supercomputers– April 11th at IUPUI, 9 AM - 5 PM, and April 13th at IUB, 9:30 AM - 5:30PM.

Outline for Today• RT Groups & services in this workshop
– Research Analytics– Research Data Services– Advanced Visualization Lab
• Examples from upcoming workshop sessions
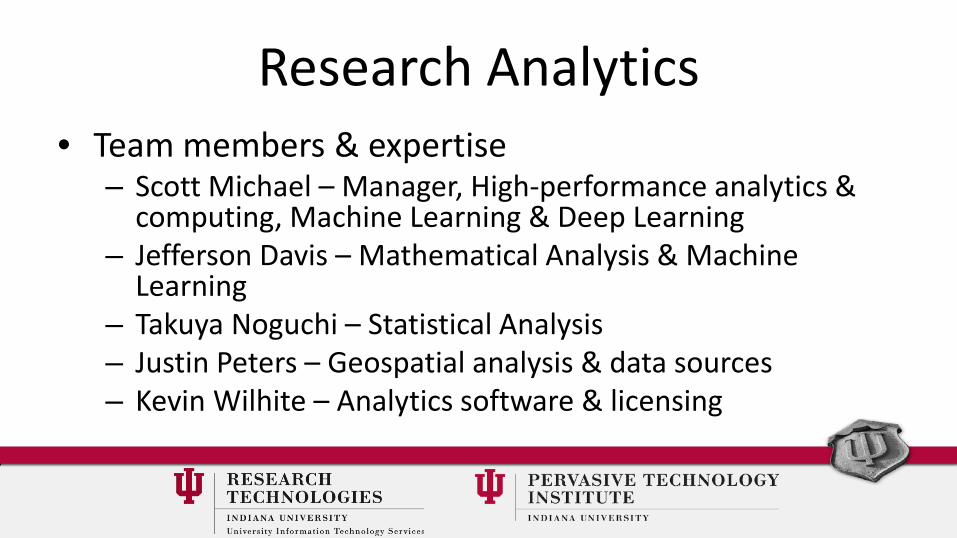
Research Analytics• Team members & expertise
– Scott Michael – Manager, High-performance analytics & computing, Machine Learning & Deep Learning
– Jefferson Davis – Mathematical Analysis & Machine Learning
– Takuya Noguchi – Statistical Analysis– Justin Peters – Geospatial analysis & data sources– Kevin Wilhite – Analytics software & licensing

Research Analytics• Services
– Software licensing and support• Statistical – SPSS, SAS, SAS/JMP, Stata, Amos, NVIVO• Mathematics – Mathematica, Maple• Multi-purpose – MATLAB (no charge), R• Geospatial – ESRI/ArcGIS, QGIS, GRASS
– Consulting:• Analytics methods: statisical, mathematical, geospatial• Computational interfaces

UITS Annual Survey (with RT/CESG & UITS/CSS; http://www.indiana.edu/~uitssur/)

MATLAB Examples(Workshop: Feb 27)
Dr. Shirin HassanSchool of Optometry
organize and analyze street crossing decisions of the visually impaired
Dr. Spencer Hall, Biology
infectious disease in food webs. Run simulations; solve systems; fit models; visualize
Dr. Franco Pestilli,Psych. & Brain Sciences
Study brain structure, function, and behavior

R / R Studio / Shiny Examples(DAV Workshop: Feb 13)
Dr. Peter MikszaJacobs School of Music
Set of R/Shiny tools for emerging music education researchers
Deployed on Jetstream VMhttp://js-156-26.jetstream-cloud.org:3838/
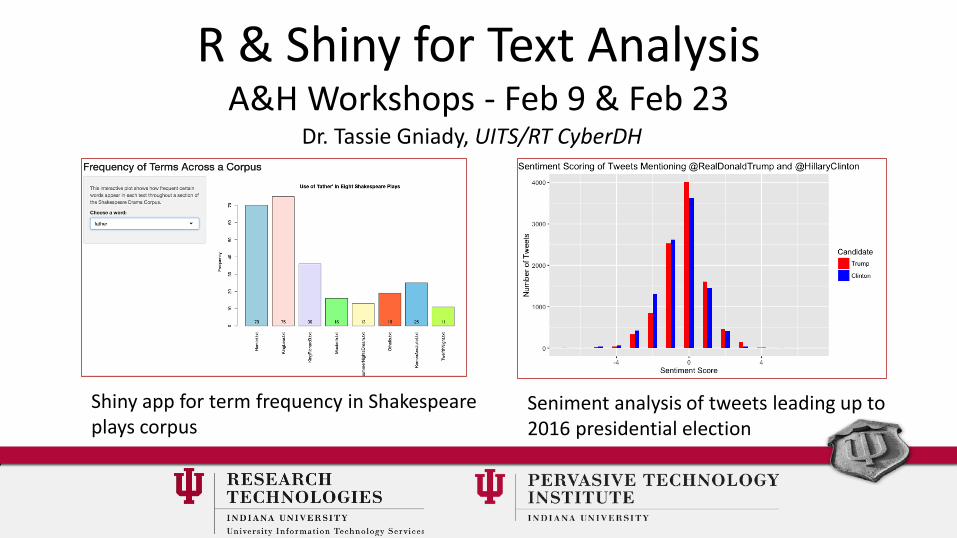
R & Shiny for Text AnalysisA&H Workshops - Feb 9 & Feb 23
Shiny app for term frequency in Shakespeare plays corpus
Seniment analysis of tweets leading up to 2016 presidential election
Dr. Tassie Gniady, UITS/RT CyberDH

Computational Notebooks(DAV Workshop: March 20)
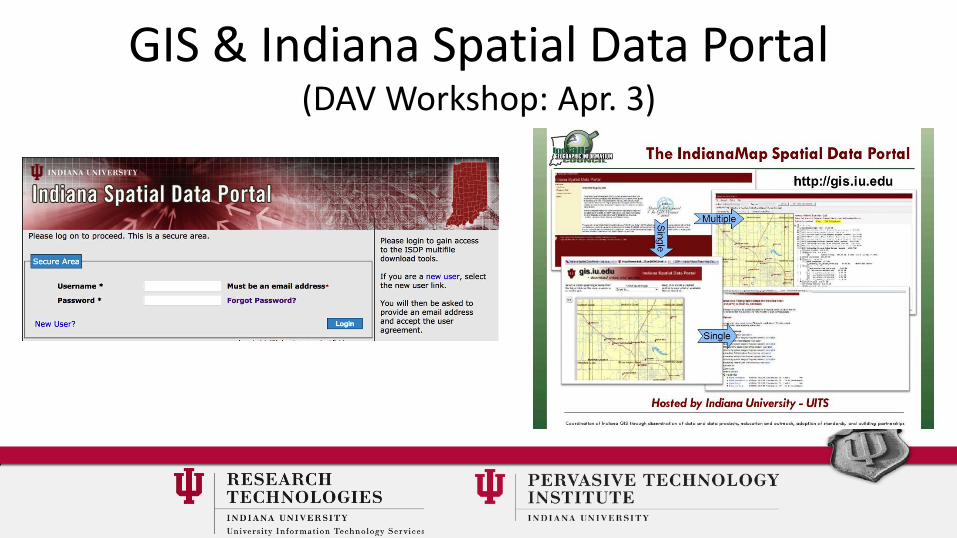
GIS & Indiana Spatial Data Portal(DAV Workshop: Apr. 3)

Research Analytics• For more information
– [email protected]– Search the KB for
• “research analytics”• Specific software title, e.g. “SPSS”, “MATLAB”• Etc.

Research Data Services• Team members & expertise
– Esen Tuna – Manager, Data classifications and policies, RADaRS service
– Alan Walsh – Research Database Complex – Nancy Long – Research Database Complex – Dimitar Nikolov – Data management tools and workflows– Guangchen Ruan – Data intensive HPC workflows– James McCombs – Stampede2 & XSEDE workflows
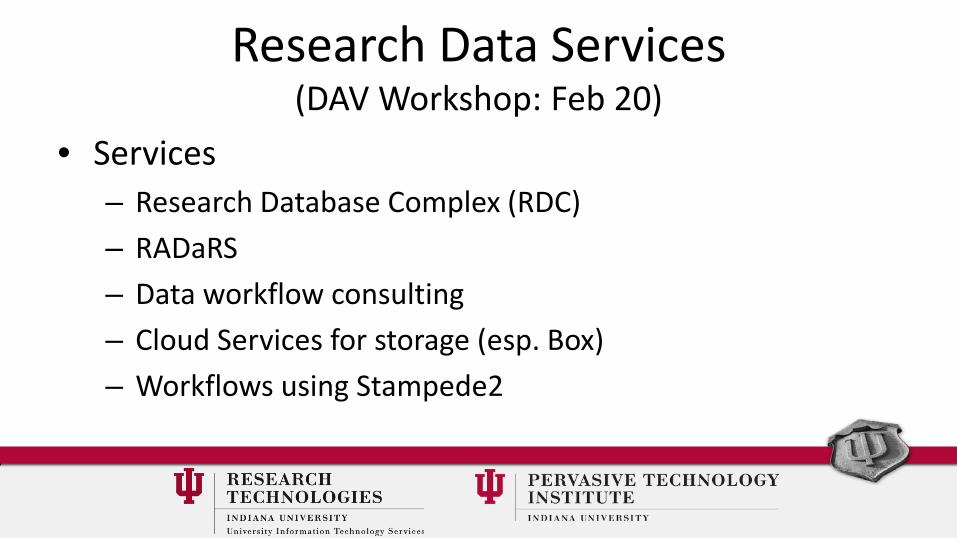
Research Data Services(DAV Workshop: Feb 20)
• Services – Research Database Complex (RDC)– RADaRS– Data workflow consulting– Cloud Services for storage (esp. Box)– Workflows using Stampede2

RADaRS(Restricted Access Data Remote Server)
• Co-managed with Social Science Research Commons (SSRC)• Secure data enclave for social sciences and beyond• Enable data custodians to upload datasets securely• Allow researchers to access the server remotely through VPN connection• Restrict researchers to analysis only
– No user-initiated data transfers in or out – No copy, paste, or print– No web access
• Provide common analysis tools by default– SAS, SPSS, Stata, R, Microsoft Office, etc.

RADaRS Sample DatasetsA few of the data vendors that researchers are working with:
BLS Bureau of Labor StatisticsCPC Carolina Population Center (UNC)FaHCSIA Australian Dep. of Families, Housing, Community Services and Indigenous AffairsICPSR Interuniversity Consortium for Political and Social Research (Univ. of Michigan)IDOE Indiana Department of Education NAPHSIS The National Association for Public Health Statistics and Information SystemsNDACAN National Data Archive on Child Abuse and Neglect (Cornell University)NORC National Opinion Research Center (University of Chicago)NYSDH New York State Department of HealthOSHPD California Office of Statewide Health Planning and Development

Research Database Complex (RDC)• Support for research-related databases
– MySQL & Oracle (currently)– Postgres & Cassandra (coming soon)
• Support data-intensive applications on databases• Provide for database-driven web applications
focusing on research

RDC UsersRDC Client
21st Century Scholar Program Department of Medical and Molecular Genetics, IUSM Kinsey Institute
Advanced Biomedical IT Core, UITS Department of Otolaryngology, IUSM Komen Tissue Bank, IUSM
Center for Genomics and Bioinformatics Department of Pediatrics, IUSM Learning Technologies, UITS
College of Arts & Sciences, Cognitive Science Program Department of Physics Molecular and Cellular Biochemistry Dept., Biotechnology Prog.
College of Arts & Sciences, Dean's Office Department of Political Science Pervasive Technology Institute (PTI), UITS
Computer and Information Technology Division of General Internal Medicine and Geriatrics, IUSM Regenstrief Institute, IUSM
Computer Information Systems Department Health Information & Translational Sciences (HITS), IUSM School of Education
Department of Biology – IUB Hutton Honors College School of Engineering and Technology
Department of Biology – IUN IU Affiliates School of Informatics and Computing (SoIC) – IUB
Department of Biostatistics, IUSM IU Alumni Association School of Informatics and Computing (SoIC) - IUPUI
Department of Geological Sciences IU Bloomington Libraries School of Liberal Arts
Department of History and Philosophy of Science and Medicine IUB-VPGA School of Medicine, IUSM
Department of Information and Library Science Jacobs School of Music School of Public and Environmental Affairs (SPEA)
Dept. of Instructional Systems Tech. (IST), School of Education Jewish Studies Program University Student Services and Systems
Department of Kinesiology, SPH Kelley School Of Business Vice President of Information Technology
Department of Linguistics Kelley School Of Business (IUPUI)

RDC by the numbersRDC (FY2015/2016) Oracle MySQL Total
# of Database Instances 17 103 120
# of Schemas 310 414 724
# of User Logins 10,214,307 2,639,579 12,853,886
Storage - Allocated (TB) 16 6 96 Storage - Used (TB) 7 5 12 Database Growth (% of disk used) 5.7 81.2 -Largest DB - Instance size (TB) 2.8 2.6 -Average DB Size (GB) 472 51 -Median DB Size (GB) 243 0.23 -Backup Utilization - Disk (TB) 13.0 1.7 -Backup Utilization - SDA (TB) 25.1 7.1 -
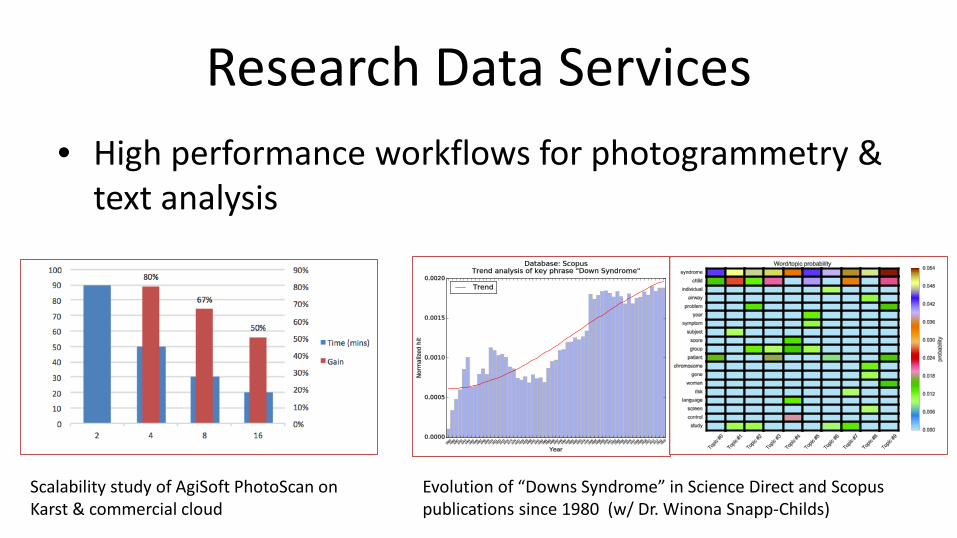
Research Data Services• High performance workflows for photogrammetry &
text analysis
Evolution of “Downs Syndrome” in Science Direct and Scopus publications since 1980 (w/ Dr. Winona Snapp-Childs)
Scalability study of AgiSoft PhotoScan on Karst & commercial cloud

Research Data Services• More information
– [email protected]– Search the KB (kb.iu.edu)
• “RDC” or “research database complex”

Advanced Visualization Lab• Team members & expertise
– Mike Boyles – Manager, SciVis, Vis workflows– Chris Eller – vis systems, esp. IQ-Walls– Bill Sherman – virtual reality & immersive visualization– David Reagan – scientific and information visualization– Jeff Rogers – 3D digitization, CAD and SciVis workflows– Chauncey Frend – augmented and virtual reality– Ed Dambik – Creative applications

Advanced Visualization Lab• Services
– Displays – IQ-Walls & Tables, Reality Labs, Flagship Facilities
– Consulting – Scientific Visualization, Information Visualization, Virtual & Augmented Reality
– Data Acquisition – 3D Scanning, Advanced Media, Photogrammetry

AVL DisplaysA&H Workshops – Feb 2 (AR), Feb 16 (VR), Apr. 6 (IQ-Systems)

SciVis with Paraview(DAV Workshop: Mar. 6)
Dr. Masatoshi AndoSchool of Dentistry
3D analysis of demineralization and restoration of caries lesions
Dr. Enrico VesperiniAstronomy
HPC simulation of evolution of globular star clusters
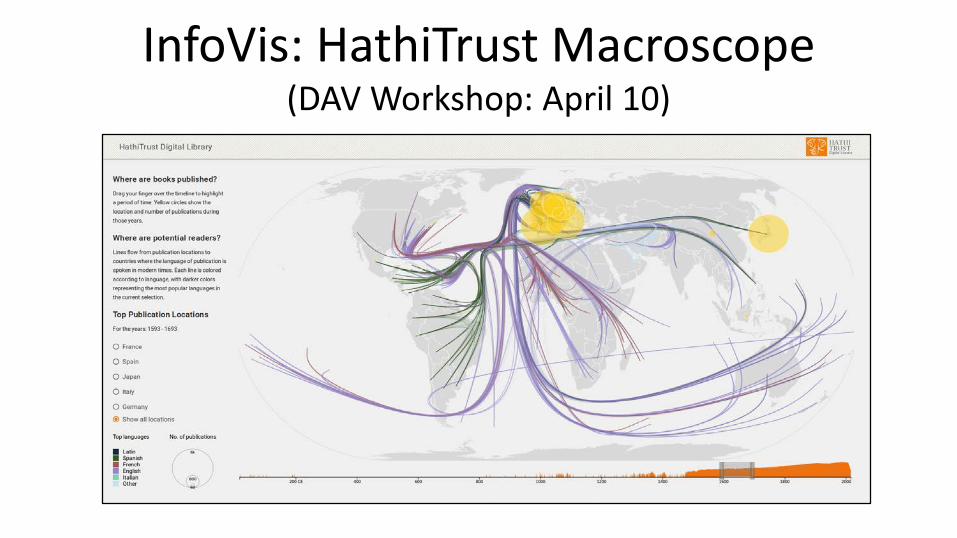
InfoVis: HathiTrust Macroscope(DAV Workshop: April 10)

InfoVis: Science on a Sphere(DAV Workshop: April 10)

AVL – 3D scanning & printing(A&H Workshop – Mar 30)
• Ruth Lilly Medical Library– Historical medical devices from 1687 – onward

Advanced Visualization Lab• More information
– [email protected]– Search the KB for
• “visualization”, “AVL”, etc.

Next week• “Your Statistical Toolbelt”
– Stephanie DickinsonEpidemiology and BiostatisticsIU School of Public Health
– Tuesday, Feb. 6, noon, SSRC

Data, Analytics, & Vis Workshop ScheduleSpring 2018 – Tuesdays @ noon - SSRC
Date Topic Presenter(s)
Jan 30 Getting more from your Research Data Eric Wernert, Scott Michael, Esen Tuna, Mike Boyles
Feb 6 Your Statistical Toolbelt Stephanie Dickinson (IU School of Public Health)
Feb 13 Intro to R for Analysis Jefferson Davis, Scott Michael
Feb 20 Databases, Enclaves, and Repositories for Research Esen Tuna, Alan Walsh
Feb 27 Analysis with MATLAB Jefferson Davis, Scott Michael
Mar 6 Intro to Scientific Visualization with Paraview Bill Sherman, Mike Boyles
Mar 13 ( Spring Break)
Mar 20 Creating Computational Interfaces Scott Michael, Tassie Gniady
Mar 27 Structural Equation Modeling Justin Wild
Apr 3 GIS Software & Data Sources for Research Justin Peters
Apr 10 Intro to Information Visualization Jefferson Davis, David Reagan
Workshop Recording and Slides• Available at:
– https://ssrc.indiana.edu/seminars/uitsrtworkshops.html

License Terms• Please cite as: [###___ Insert recommended citation (and IUScholarWorks handle as appropriate)]• Items indicated with a © are under copyright and used here with permission. Such items may not be reused
without permission from the holder of copyright except where license terms noted on a slide permit reuse. • Except where otherwise noted, contents of this presentation are copyright 2013 by the Trustees of Indiana
University. • This document is released under the Creative Commons Attribution 3.0 Unported license
(http://creativecommons.org/licenses/by/3.0/). This license includes the following terms: You are free to share –to copy, distribute and transmit the work and to remix – to adapt the work under the following conditions: attribution – you must attribute the work in the manner specified by the author or licensor (but not in any way that suggests that they endorse you or your use of the work). For any reuse or distribution, you must make clear to others the license terms of this work.