an ren pges titres tm - investisseur institutionnel de ... · the dispersion of annual returns is...
TRANSCRIPT

Managing for the futureAnnual Report 2005 Additional Information
Annual Report 2005 – Additional Information
I . Tables of returns 1. Audi tors ’ Repor t . . . . . . . . . . . . . . . . . . . . . . . . . . . . . . . . . . . . . . . . . . . . . . . . . . . . . . . . . . . . . . . . . . . . . . . . . . . . . . . . . . . . . . . . . . . . . . . . . 1
2 . Genera l Notes . . . . . . . . . . . . . . . . . . . . . . . . . . . . . . . . . . . . . . . . . . . . . . . . . . . . . . . . . . . . . . . . . . . . . . . . . . . . . . . . . . . . . . . . . . . . . . . . . . . . 2
3 . Shor t Term Investments . . . . . . . . . . . . . . . . . . . . . . . . . . . . . . . . . . . . . . . . . . . . . . . . . . . . . . . . . . . . . . . . . . . . . . . . . . . . . . . . . . . . . . . 4
4 . Real Return Bonds . . . . . . . . . . . . . . . . . . . . . . . . . . . . . . . . . . . . . . . . . . . . . . . . . . . . . . . . . . . . . . . . . . . . . . . . . . . . . . . . . . . . . . . . . . . . . . . 6
5 . Long Term Bonds . . . . . . . . . . . . . . . . . . . . . . . . . . . . . . . . . . . . . . . . . . . . . . . . . . . . . . . . . . . . . . . . . . . . . . . . . . . . . . . . . . . . . . . . . . . . . . . . . 8
6 . Bonds . . . . . . . . . . . . . . . . . . . . . . . . . . . . . . . . . . . . . . . . . . . . . . . . . . . . . . . . . . . . . . . . . . . . . . . . . . . . . . . . . . . . . . . . . . . . . . . . . . . . . . . . . . . . . . 10
7 . F ixed Income - Bonds . . . . . . . . . . . . . . . . . . . . . . . . . . . . . . . . . . . . . . . . . . . . . . . . . . . . . . . . . . . . . . . . . . . . . . . . . . . . . . . . . . . . . . . . . 12
8. Canadian Equi ty . . . . . . . . . . . . . . . . . . . . . . . . . . . . . . . . . . . . . . . . . . . . . . . . . . . . . . . . . . . . . . . . . . . . . . . . . . . . . . . . . . . . . . . . . . . . . . . . 14
9. Canadian Equi ty Quoted Markets . . . . . . . . . . . . . . . . . . . . . . . . . . . . . . . . . . . . . . . . . . . . . . . . . . . . . . . . . . . . . . . . . . . . . . . . . 16
10. U.S. Equi ty (Hedged) . . . . . . . . . . . . . . . . . . . . . . . . . . . . . . . . . . . . . . . . . . . . . . . . . . . . . . . . . . . . . . . . . . . . . . . . . . . . . . . . . . . . . . . . . 18
11. U.S. Equi ty (Unhedged) . . . . . . . . . . . . . . . . . . . . . . . . . . . . . . . . . . . . . . . . . . . . . . . . . . . . . . . . . . . . . . . . . . . . . . . . . . . . . . . . . . . . . . . 20
12. U.S. Equi ty Quoted Markets . . . . . . . . . . . . . . . . . . . . . . . . . . . . . . . . . . . . . . . . . . . . . . . . . . . . . . . . . . . . . . . . . . . . . . . . . . . . . . . . 22
13. EAFE Fore ign Equi ty (Hedged) . . . . . . . . . . . . . . . . . . . . . . . . . . . . . . . . . . . . . . . . . . . . . . . . . . . . . . . . . . . . . . . . . . . . . . . . . . . . 24
14. EAFE Fore ign Equi ty (Unhedged) . . . . . . . . . . . . . . . . . . . . . . . . . . . . . . . . . . . . . . . . . . . . . . . . . . . . . . . . . . . . . . . . . . . . . . . . 26
15. EAFE Fore ign Equi ty Quoted Markets . . . . . . . . . . . . . . . . . . . . . . . . . . . . . . . . . . . . . . . . . . . . . . . . . . . . . . . . . . . . . . . . . . . . 28
16. Emerg ing Markets Equi ty . . . . . . . . . . . . . . . . . . . . . . . . . . . . . . . . . . . . . . . . . . . . . . . . . . . . . . . . . . . . . . . . . . . . . . . . . . . . . . . . . . . . . 30
17. Emerg ing Markets Equi ty Quoted Markets . . . . . . . . . . . . . . . . . . . . . . . . . . . . . . . . . . . . . . . . . . . . . . . . . . . . . . . . . . . . . 32
18. Québec In ternat iona l . . . . . . . . . . . . . . . . . . . . . . . . . . . . . . . . . . . . . . . . . . . . . . . . . . . . . . . . . . . . . . . . . . . . . . . . . . . . . . . . . . . . . . . . . . . 34
19. Investments and In f ras t ruc tures . . . . . . . . . . . . . . . . . . . . . . . . . . . . . . . . . . . . . . . . . . . . . . . . . . . . . . . . . . . . . . . . . . . . . . . . . . . . 36
20. Pr ivate Equi ty . . . . . . . . . . . . . . . . . . . . . . . . . . . . . . . . . . . . . . . . . . . . . . . . . . . . . . . . . . . . . . . . . . . . . . . . . . . . . . . . . . . . . . . . . . . . . . . . . . . .39
21. Real Estate Debt . . . . . . . . . . . . . . . . . . . . . . . . . . . . . . . . . . . . . . . . . . . . . . . . . . . . . . . . . . . . . . . . . . . . . . . . . . . . . . . . . . . . . . . . . . . . . . . 41
22. Real Esta te . . . . . . . . . . . . . . . . . . . . . . . . . . . . . . . . . . . . . . . . . . . . . . . . . . . . . . . . . . . . . . . . . . . . . . . . . . . . . . . . . . . . . . . . . . . . . . . . . . . . . . . . 43
23. Hedge Funds . . . . . . . . . . . . . . . . . . . . . . . . . . . . . . . . . . . . . . . . . . . . . . . . . . . . . . . . . . . . . . . . . . . . . . . . . . . . . . . . . . . . . . . . . . . . . . . . . . . . . . 46
24. Commodi t ies . . . . . . . . . . . . . . . . . . . . . . . . . . . . . . . . . . . . . . . . . . . . . . . . . . . . . . . . . . . . . . . . . . . . . . . . . . . . . . . . . . . . . . . . . . . . . . . . . . . . . . 48
25. Balanced Fund . . . . . . . . . . . . . . . . . . . . . . . . . . . . . . . . . . . . . . . . . . . . . . . . . . . . . . . . . . . . . . . . . . . . . . . . . . . . . . . . . . . . . . . . . . . . . . . . . . 50
II. Financial statistics and review 1. Returns on Spec ia l ized Por t fo l ios by Market Indexes or recognized Indexes . . . . . . . . . . . . . . . 55
2. Changes in depos i tors ’ ho ld ings . . . . . . . . . . . . . . . . . . . . . . . . . . . . . . . . . . . . . . . . . . . . . . . . . . . . . . . . . . . . . . . . . . . . . . . . . . 56
3. Breakdown of depos i tors ’ ho ld ings . . . . . . . . . . . . . . . . . . . . . . . . . . . . . . . . . . . . . . . . . . . . . . . . . . . . . . . . . . . . . . . . . . . . . . . 60
4 . Annual in terest or income paid out on average deposi ts . . . . . . . . . . . . . . . . . . . . . . . . . . . . . . . . . . . . . . . . . 61
5 . Summary o f investments . . . . . . . . . . . . . . . . . . . . . . . . . . . . . . . . . . . . . . . . . . . . . . . . . . . . . . . . . . . . . . . . . . . . . . . . . . . . . . . . . . . . . . 62
6 . Breakdown of investments . . . . . . . . . . . . . . . . . . . . . . . . . . . . . . . . . . . . . . . . . . . . . . . . . . . . . . . . . . . . . . . . . . . . . . . . . . . . . . . . . . 63
7 . Real Estate Group – Mor tgages of $5 mi l l ion and over . . . . . . . . . . . . . . . . . . . . . . . . . . . . . . . . . . . . . . . . . . . . 65
8 . Investments in shares and bonds of pub l ic ly t raded companies . . . . . . . . . . . . . . . . . . . . . . . . . . . . . . . . . 70
9 . Investments in shares and bonds of pr ivate ly he ld companies . . . . . . . . . . . . . . . . . . . . . . . . . . . . . . . . 172
10. Sta tement o f rea l es ta te ho ld ings . . . . . . . . . . . . . . . . . . . . . . . . . . . . . . . . . . . . . . . . . . . . . . . . . . . . . . . . . . . . . . . . . . . . . . . 188
11. Sta tement o f proper t ies he ld for resa le . . . . . . . . . . . . . . . . . . . . . . . . . . . . . . . . . . . . . . . . . . . . . . . . . . . . . . . . . . . . . . . . 190
III. Code of Ethics and Conduct for Directors
IV. Code of Ethics and Professional Conduct for Officers and Employees

I. Tables of returns
Caisse de dépôt et placement du Québec for the period ended December 31, 2005
GIPS® compliant presentation

Deloitte & Touche LLP 1 Place Ville Marie Suite 3000 Montreal QC H3B 4T9 Canada Tel: (514) 393-5321 Fax: (514) 390-4111 www.deloitte.ca
Auditors’ Report To: The Directors of
Caisse de dépôt et placement du Québec
We have examined whether Caisse de dépôt et placement du Québec – Depositors accounts (the “Company”) complied with the Global Investment Performance Standards (“GIPS®”), on a firm-wide basis. We have also examined the performance calculation included in the accompanying Schedules (the “Schedules”) of the Company for the year ended December 31, 2005. The Company’s management is responsible for compliance with the GIPS® Standards and for the Schedules. Our responsibility is to express an opinion based on our audit. We conducted our audit in accordance with standards for assurance engagements established by the Canadian Institute of Chartered Accountants, and in accordance with the requirements for a firm-wide basis and Performance Examination verifications as defined by the GIPS® Standards. Those standards require that we plan and perform the procedures for a Verification and Performance Examination set forth by the GIPS® Standards and such other procedures as we considered necessary in the circumstances. In our opinion, the Company has, in all material respects, for the year ended December 31, 2005 complied on a firm-wide basis and presented the Schedule in conformity with the requirements of the GIPS® Standards.
Chartered Accountants Montreal, Quebec February 14, 2006

General Notes1. Presentation of the firm
The Caisse de dépôt et placement du Québec (the Caisse) is a financial institution that manages funds for pension plans and public and private insurance plans (the Depositors). The Caisse invests in the large capital markets and under the form of private investments and real estate. The Depositors' assets in the individual funds were $121.9 billion as at December 31st, 2005. This document presents the performances related to the funds managed by the Caisse for the Depositors.
2. Compliance statement
The Caisse has prepared and presented this report in compliance with the Global Investment Performance Standards (GIPS®) for the period of January 1st, 1996 to December 31st, 2005. The CFA Institute (formely known as AIMR) has not been involved with the preparation or review of this report.
Deloitte & Touche LLP has audited that the Schedules of Composites and performance calculations of the Caisse de dépôt et placement du Québec composites are in accordance with the Global Investment Performance Standards (GIPS®). This audit covers the period from January 1st, 1998 to December 31st, 2005, except for the composites created at the end of 2003. For these composites, the audit covers the period from January 1st, 1999 to December 31st, 2005.
Results reflect past performance and are no indication of future returns.
3. Performance calculations
Performance calculations are based on monthly valuations. The modified Dietz formula is used to calculate returns. Any deposits or withdrawals are made on the first day of the month. Thus returns are not in any way distorted by cash flows occurring during the month concerned. Returns are presented gross of investment and management fees.
Each discretionary fee-paying portfolio is included in at least one composite. These composites are valued according to trade date and returns are calculated monthly. Returns are then linked geometrically to produce quarterly and annual returns.
Total returns, including realized and unrealized gains plus income, are used to calculate performance. These returns include any income generated on cash or cash equivalents. Interest income is accrued and is included in the market value used to calculate returns. Dividend income is accrued as of its ex-dividend date.
The fair value of fixed-income securities is determined by means of valuation methods used in capital markets, such as the annualization of future cash flows at the current interest rate and the closing prices of the major brokers as well as those provided by recognized financial institutions. In addition, certain valuations are made according to commonly used valuation methods or on the basis of similar arm's-length transactions.
The fair value of shares traded on a stock exchange is determined from the closing prices on the major stock exchanges as well as those provided by recognized financial institutions. For shares not traded on a stock exchange and real estate holdings, valuations are made by independent valuators, while others are made according to commonly used valuation methods or on the basis of similar arm's-length transactions. The valuations of shares and convertible securities that are not publicly traded are reviewed annually by an independent valuation committee.
Derivative financial instruments are recorded at their fair value at year-end. These values are established from closing prices on the major stock exchanges as well as those provided by recognized financial institutions. In the case of unlisted instruments, certain valuations are made on the basis of similar arm's-length transactions or according to recognized, commonly used models.
U.S. composites and indexes are presented before non-resident taxes. For other countries, returns are after such taxes. This is due to the fact that the Caisse has an agreement with the United States that exempts it from paying such taxes because of the non-taxable status of its clientele. The Caisse has no other similar arrangement.
2Annual Report 2005 - Additional Information
4. Specialized portfolios
When the Caisse was created, the depositors held their investments in separate accounts (Individual Funds). Between 1985 and 2000, depending on investment types, the assets held in the Individual Funds were exchanged for units of specialized portfolios. These units are held in the Individual Funds and the Caisse assumes accounting responsibilities for these units and Individual Funds on behalf of the depositors. A unit of a specialized portfolio is similar to a mutual fund unit, meaning that its value fluctuates according to the net asset value of the specialized portfolio.
5. Dispersion measure
The dispersion of annual returns is measured by the standard deviation of annual returns of accounts that are present in the composite for the entire year. No dispersion measure is calculated if there are fewer than five accounts in a composite, since the result is not meaningful.
6. Operating expenses
The Caisse, in its financial statements, groups its management and investment fees as Operating expenses.
Owing to the nature of the Caisse, operating expenses that are charged to the specialized portfolios are those that are actually incurred to manage the funds. Total fees are distributed according to cost drivers specific to the different investment activities. All returns in this presentation are calculated before operating expenses, but after transaction costs. The actual incurred fees for each specialized portfolio are presented in basis points.
7. Currency used for reporting
All returns and assets are presented in Canadian dollars.
8. Net assets under management
The net assets under management presented are those of the combined financial statements, adjusted to meet performance presentation standards, and therefore include all discretionary accounts.
9. New composites
In 2005, the Caisse added a new composite to its GIPS® compliant performance presentation. This following new composite represent a new investment strategy put in place during the year of 2005: • Long Term Bonds
In 2004, the Caisse added two new composites to its AIMR-PPS® compliant performance presentation. These two new composites represent new investment strategies put in place during the year of 2004. They are: • Real Return Bonds • Commodity Financial Instruments
In 2003, the Caisse added eight new composites to its AIMR-PPS® compliant performance presentation. Five of these new composites measure the results of the specialized equity markets and fixed income teams. Previously, these returns were included in more general composites. These new composites are: • Fixed Income - bonds • Canadian Equity Quoted Markets • U.S. Equity Quoted Markets • EAFE Foreign Equity Quoted Markets • Emerging Markets Equity Quoted Markets
Two other new composites result from the creation of specialized portfolios for Private investments. Previously, this type of investment was incorporated into the following composites: Bonds, Canadian Equity, U.S. Equity (Hedged), U.S. Equity (Unhedged), EAFE Foreign Equity (Hedged), EAFE Foreign Equity (Unhedged) and Emerging Markets Equity. As a result of this change, a new global management philosophy for two new composites was implemented on July 1st, 2003. The new composites are: • Private Equity • Investments and Infrastructures
A Hedge Funds composite started on April 1st, 2003 with a fund of fund structure. This new composite is: • Hedge Fund Partnership Units
3Annual Report 2005 - Additional Information
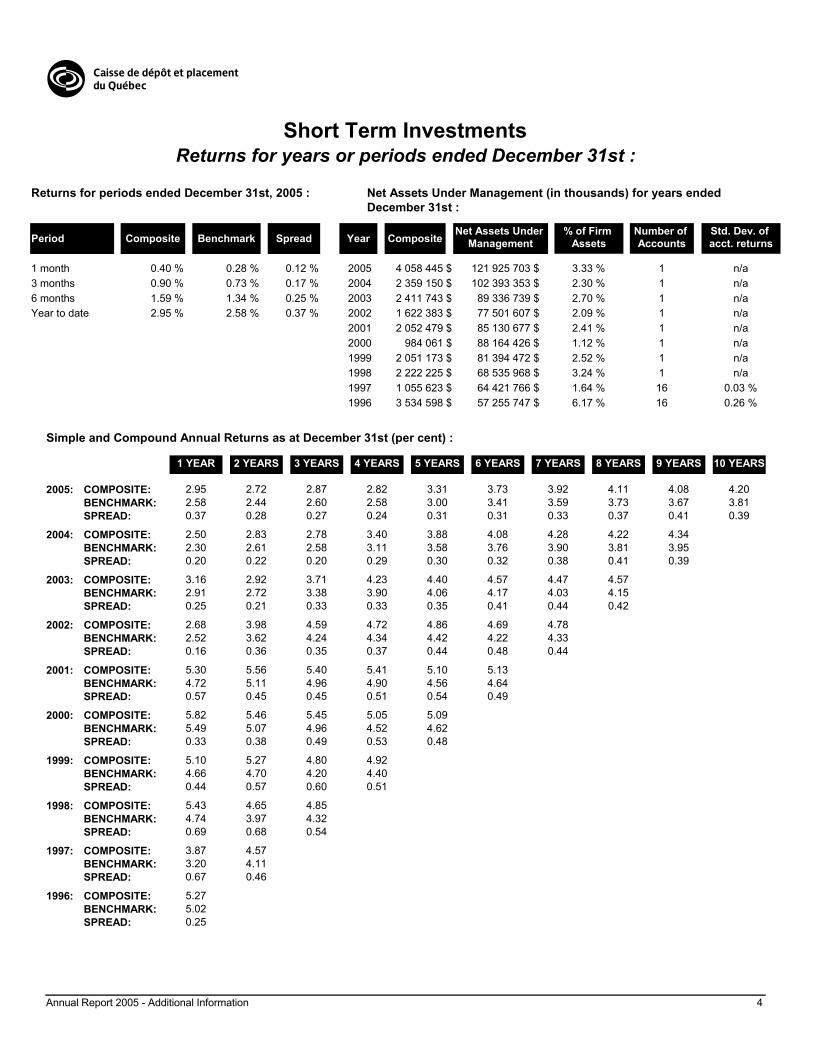
Short Term InvestmentsReturns for years or periods ended December 31st :
Returns for periods ended December 31st, 2005 :
Period Composite Benchmark Spread
Net Assets Under Management (in thousands) for years ended December 31st :
Net Assets Under Management
% of Firm AssetsComposite
Number of Accounts
Std. Dev. of acct. returnsYear
1 month 0.12 %0.28 %0.40 %3 months 0.17 %0.73 %0.90 %6 months 0.25 %1.34 %1.59 %Year to date 0.37 %2.58 %2.95 %
2005 4 058 445 $ 121 925 703 $ 3.33 % 1 n/a2004 2 359 150 $ 102 393 353 $ 2.30 % 1 n/a2003 2 411 743 $ 89 336 739 $ 2.70 % 1 n/a2002 1 622 383 $ 77 501 607 $ 2.09 % 1 n/a2001 2 052 479 $ 85 130 677 $ 2.41 % 1 n/a2000 984 061 $ 88 164 426 $ 1.12 % 1 n/a1999 2 051 173 $ 81 394 472 $ 2.52 % 1 n/a1998 2 222 225 $ 68 535 968 $ 3.24 % 1 n/a1997 1 055 623 $ 64 421 766 $ 1.64 % 16 0.03 %1996 3 534 598 $ 57 255 747 $ 6.17 % 16 0.26 %
Simple and Compound Annual Returns as at December 31st (per cent) :
1 YEAR 2 YEARS 3 YEARS 4 YEARS 5 YEARS 6 YEARS 7 YEARS 8 YEARS 9 YEARS 10 YEARS
2.95 2.72 2.87 2.82 3.31 3.73 3.92 4.11 4.08 4.202.58 2.44 2.60 2.58 3.00 3.41 3.59 3.73 3.67 3.810.37 0.28 0.27 0.24 0.31 0.31 0.33 0.37 0.41 0.39
COMPOSITE:2005:BENCHMARK:SPREAD:
2.50 2.83 2.78 3.40 3.88 4.08 4.28 4.22 4.342.30 2.61 2.58 3.11 3.58 3.76 3.90 3.81 3.950.20 0.22 0.20 0.29 0.30 0.32 0.38 0.41 0.39
COMPOSITE:2004:BENCHMARK:SPREAD:
3.16 2.92 3.71 4.23 4.40 4.57 4.47 4.572.91 2.72 3.38 3.90 4.06 4.17 4.03 4.150.25 0.21 0.33 0.33 0.35 0.41 0.44 0.42
COMPOSITE:2003:BENCHMARK:SPREAD:
2.68 3.98 4.59 4.72 4.86 4.69 4.782.52 3.62 4.24 4.34 4.42 4.22 4.330.16 0.36 0.35 0.37 0.44 0.48 0.44
COMPOSITE:2002:BENCHMARK:SPREAD:
5.30 5.56 5.40 5.41 5.10 5.134.72 5.11 4.96 4.90 4.56 4.640.57 0.45 0.45 0.51 0.54 0.49
COMPOSITE:2001:BENCHMARK:SPREAD:
5.82 5.46 5.45 5.05 5.095.49 5.07 4.96 4.52 4.620.33 0.38 0.49 0.53 0.48
COMPOSITE:2000:BENCHMARK:SPREAD:
5.10 5.27 4.80 4.924.66 4.70 4.20 4.400.44 0.57 0.60 0.51
COMPOSITE:1999:BENCHMARK:SPREAD:
5.43 4.65 4.854.74 3.97 4.320.69 0.68 0.54
COMPOSITE:1998:BENCHMARK:SPREAD:
3.87 4.573.20 4.110.67 0.46
COMPOSITE:1997:BENCHMARK:SPREAD:
5.275.020.25
COMPOSITE:1996:BENCHMARK:SPREAD:
4Annual Report 2005 - Additional Information
Short Term InvestmentsNotes to the Short Term Investments composite :
1. Composite descriptionThis composite groups the core of the Caisse's Canadian and U.S. money market securities and bonds with maturities of less than two years.
The composite uses significant leverage in its normal investment activities. Repo lending activities exist in this composite.
2. Composite creation dateThis composite was created on September 1st, 1998.
3. BenchmarkThe benchmark for this composite is the Scotia Capital 91 days T-bill.
4. Calculation periodThe performance for this composite is calculated for the periods from January 1st, 1996, to December 31st, 2005.
Deloitte & Touche LLP has not audited the schedules for the periods presented from January 1st, 1996, to December 31st, 1997.
5. Date of conversion to specialized portfolioThe holdings in the Depositors' portfolios were transferred to a specialized portfolio on July 1st, 1998. Since that date, the composite has consisted solely of the specialized portfolio.
6. Operating expensesThe performance results are presented before operating expenses, but after transaction fees.
The operating expenses for this composite were 5 basis points for the year ended December 31st, 2005. For the four previous years, from January 1st, 2000, to December 31st, 2004, the fees averaged 12 basis points.
7. Investment universeThe benchmark consists of a universe of Canadian securities. A very limited part of the composite can be invested in foreign countries. This portion may be invested in the United States and the EAFE countries.
8. Use of derivativesThis composite uses derivatives in the normal course of investment management. Derivatives are used mainly to reduce exposure, to hedge and to take positions.
5Annual Report 2005 - Additional Information

Real Return BondsReturns for years or periods ended December 31st :
Returns for periods ended December 31st, 2005 :
Period Composite Benchmark Spread
Net Assets Under Management (in thousands) for years ended December 31st :
Net Assets Under Management
% of Firm AssetsComposite
Number of Accounts
Std. Dev. of acct. returnsYear
1 month 0.00 %3.20 %3.20 %3 months -0.23 %3.66 %3.43 %6 months 0.06 %8.64 %8.70 %Year to date -0.13 %15.20 %15.08 %
2005 1 249 024 $ 121 925 703 $ 1.02 % 1 n/a2004 1 090 673 $ 102 393 353 $ 1.07 % 1 n/a
Simple and Compound Annual Returns as at December 31st (per cent) :
1 YEAR 2 YEARS 3 YEARS 4 YEARS 5 YEARS 6 YEARS 7 YEARS 8 YEARS 9 YEARS 10 YEARS
15.08 16.5415.20 16.36(0.13) 0.18
COMPOSITE:2005:BENCHMARK:SPREAD:
18.0217.530.49
COMPOSITE:2004:BENCHMARK:SPREAD:
6Annual Report 2005 - Additional Information

Real Return BondsNotes to the Real Return Bonds composite :
1. Composite descriptionThis composite groups the Caisse investments in Canadian real return bonds. The face value of real return bonds is in direct connection with the Consumer Price Index. This composite comprises Canadian securities only.
The composite can also include securities lending operations.
2. Composite creation dateThis composite was created on October 1st, 2004.
3. BenchmarkThe benchmark for this composite is the Scotia Capital Real Return Bonds Index.
4. Calculation periodPerformance for this composite is calculated since its inception date, January 1st, 2004, to December 31st, 2005.
Deloitte & Touche LLP has audited the schedules since inception date, to December 31st, 2004.
5. Operating expensesThe performance results are presented before operating expenses, but after transaction fees.
The operating expenses for this composite were 6 basis points for the year ended December 31st, 2005. Since inception of the composite, from January 1st, 2004, to December 31st, 2004, the fees averaged 9 basis points.
6. Investment universeThe benchmark consists of a universe of Canadian securities. Investments authorised are currently limited to Canada.
7. Use of derivativesThis composite can use derivatives in the normal course of investment management. Derivatives will be used mainly to reduce exposure, to hedge and to take positions.
7Annual Report 2005 - Additional Information
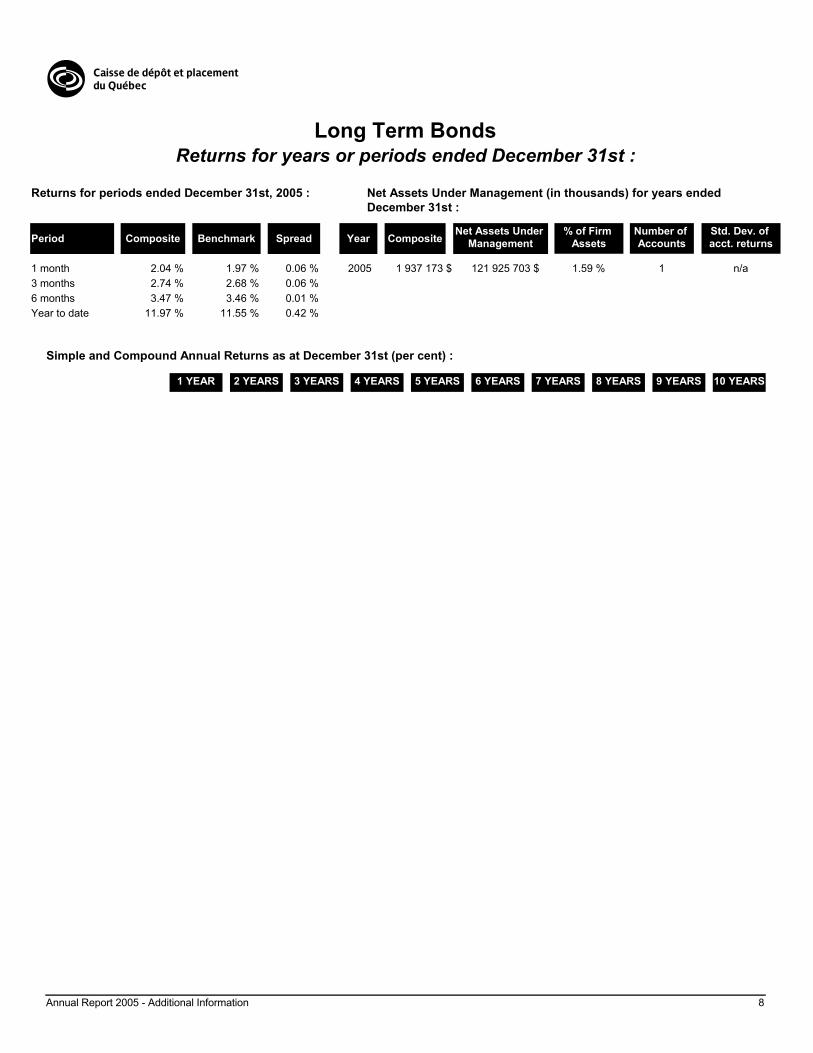
Long Term BondsReturns for years or periods ended December 31st :
Returns for periods ended December 31st, 2005 :
Period Composite Benchmark Spread
Net Assets Under Management (in thousands) for years ended December 31st :
Net Assets Under Management
% of Firm AssetsComposite
Number of Accounts
Std. Dev. of acct. returnsYear
1 month 0.06 %1.97 %2.04 %3 months 0.06 %2.68 %2.74 %6 months 0.01 %3.46 %3.47 %Year to date 0.42 %11.55 %11.97 %
2005 1 937 173 $ 121 925 703 $ 1.59 % 1 n/a
Simple and Compound Annual Returns as at December 31st (per cent) :
1 YEAR 2 YEARS 3 YEARS 4 YEARS 5 YEARS 6 YEARS 7 YEARS 8 YEARS 9 YEARS 10 YEARS
8Annual Report 2005 - Additional Information

Long Term BondsNotes to the Long Term Bonds composite :
1. Composite descriptionThis composite groups Canadian government bonds with a fixed nominal income and maturities greater than ten years. It includes federal, provincial and municipal issues.
The composite can also include securities lending operations.
2. Composite creation dateThis composite was created on April 1st, 2005.
3. BenchmarkAt the initial set up of this specialized portfolio, the benchmark was a combination of 50% SC all goverment bond index and 50% universe federal bond index. This proportion is adjusted monthly by 10% until september 2005, date where the benchmark is totaly composed of the SC all government bond index.
4. Calculation periodPerformance for this composite is calculated since its inception date, March 1st, 2005, to December 31st, 2005.
Deloitte & Touche LLP has audited the schedules since inception date, to December 31st, 2004.
6. Operating expensesThe performance results are presented before operating expenses, but after transaction fees.
The operating expenses for this composite were 9 basis points since its inception, from March 1st, 2005, to December 31st, 2005.
7. Investment universeThe benchmark consists of a universe of Canadian securities. Investments authorised are currently limited to Canada.
8. Use of derivativesThis composite uses derivatives in the normal course of investment management. Derivatives are used mainly to reduce exposure, to hedge positions and to take advantage of arbitrage opportunities.
9Annual Report 2005 - Additional Information

BondsReturns for years or periods ended December 31st :
Returns for periods ended December 31st, 2005 :
Period Composite Benchmark Spread
Net Assets Under Management (in thousands) for years ended December 31st :
Net Assets Under Management
% of Firm AssetsComposite
Number of Accounts
Std. Dev. of acct. returnsYear
1 month 0.06 %0.75 %0.81 %3 months 0.06 %0.69 %0.75 %6 months 0.15 %0.81 %0.95 %Year to date 0.03 %6.46 %6.50 %
2005 36 186 629 $ 121 925 703 $ 29.68 % 1 n/a2004 32 826 835 $ 102 393 353 $ 32.06 % 1 n/a2003 27 831 399 $ 89 336 739 $ 31.15 % 1 n/a2002 22 841 755 $ 77 501 607 $ 29.47 % 1 n/a2001 26 419 401 $ 85 130 677 $ 31.03 % 1 n/a2000 32 539 204 $ 88 164 426 $ 36.91 % 1 n/a1999 28 825 389 $ 81 394 472 $ 35.41 % 1 n/a1998 28 126 484 $ 68 535 968 $ 41.04 % 1 n/a1997 29 830 127 $ 64 421 766 $ 46.30 % 1 n/a1996 24 878 750 $ 57 255 747 $ 43.45 % 16 0.45 %
Simple and Compound Annual Returns as at December 31st (per cent) :
1 YEAR 2 YEARS 3 YEARS 4 YEARS 5 YEARS 6 YEARS 7 YEARS 8 YEARS 9 YEARS 10 YEARS
6.50 6.99 7.18 7.78 7.99 8.36 7.10 7.37 7.79 8.276.46 6.80 6.77 7.25 7.42 7.88 6.55 6.87 7.18 7.670.03 0.19 0.41 0.53 0.57 0.48 0.56 0.50 0.61 0.60
COMPOSITE:2005:BENCHMARK:SPREAD:
7.49 7.52 8.21 8.37 8.74 7.21 7.50 7.95 8.477.15 6.92 7.52 7.66 8.17 6.56 6.93 7.26 7.810.35 0.60 0.69 0.71 0.57 0.65 0.57 0.69 0.66
COMPOSITE:2004:BENCHMARK:SPREAD:
7.55 8.57 8.66 9.05 7.15 7.50 8.02 8.596.69 7.70 7.83 8.43 6.44 6.89 7.28 7.890.86 0.87 0.83 0.62 0.70 0.60 0.73 0.70
COMPOSITE:2003:BENCHMARK:SPREAD:
9.61 9.22 9.56 7.05 7.49 8.09 8.748.73 8.40 9.01 6.38 6.94 7.38 8.060.88 0.81 0.54 0.67 0.55 0.71 0.68
COMPOSITE:2002:BENCHMARK:SPREAD:
8.83 9.53 6.21 6.96 7.79 8.608.08 9.16 5.61 6.49 7.11 7.950.75 0.37 0.60 0.47 0.68 0.64
COMPOSITE:2001:BENCHMARK:SPREAD:
10.24 4.92 6.35 7.54 8.5510.25 4.40 5.97 6.87 7.93(0.01) 0.52 0.38 0.67 0.62
COMPOSITE:2000:BENCHMARK:SPREAD:
(0.14) 4.46 6.65 8.13(1.14) 3.89 5.77 7.361.00 0.57 0.88 0.77
COMPOSITE:1999:BENCHMARK:SPREAD:
9.26 10.22 11.049.18 9.41 10.350.09 0.81 0.69
COMPOSITE:1998:BENCHMARK:SPREAD:
11.18 11.939.63 10.941.55 0.99
COMPOSITE:1997:BENCHMARK:SPREAD:
12.6912.260.43
COMPOSITE:1996:BENCHMARK:SPREAD:
10Annual Report 2005 - Additional Information

BondsNotes to the Bonds composite :
1. Composite descriptionThis composite groups the core of the Caisse's fixed income investments. Before July 1st, 2003, the bond management activities grouped bond investments in listed markets and private investments. Since that date, these two investment activities are now placed in separate composites. This composite groups only bond investments made in listed markets, from July 1st, 2003, but reflects the historical returns of the listed markets and private investments.
A small portion of the composite represents an overlay activity with the intent to create value added. Repo lending activities exist in this composite.
2. Composite creation dateThis composite was created on September 1st, 1998.
3. BenchmarkSince 1991, the benchmark for this composite has been the Scotia Capital Universe Bond Index.
4. Calculation periodThe performance for this composite is calculated for the periods from January 1st, 1996, to December 31st, 2005.
Deloitte & Touche LLP has not audited the schedules for the periods presented from January 1st, 1996, to December 31st, 1997.
5. Date of conversion to specialized portfolioThe holdings in the Depositors' portfolios were transferred to a specialized portfolio on October 1st, 1996. Since that date, the composite has consisted solely of the specialized portfolio.
6. Operating expensesThe performance results are presented before operating expenses, but after transaction fees.
The operating expenses for this composite were 8 basis points for the year ended December 31st, 2005. For the four previous years, from January 1st, 2000, to December 31st, 2004, the fees averaged 13 basis points.
7. Investment universeThe benchmark consists of a universe of Canadian securities. A very limited portion of the composite may be invested in foreign countries. This portion may be invested in the United States, the EAFE countries and emerging markets (the last group is limited to 10% of the composite).
8. Use of derivativesThis composite uses derivatives in the normal course of investment management. Derivatives are used mainly to reduce exposure, to hedge positions and to take advantage of arbitrage opportunities.
11Annual Report 2005 - Additional Information

Fixed Income - BondsReturns for years or periods ended December 31st :
Returns for periods ended December 31st, 2005 :
Period Composite Benchmark Spread
Net Assets Under Management (in thousands) for years ended December 31st :
Net Assets Under Management
% of Firm AssetsComposite
Number of Accounts
Std. Dev. of acct. returnsYear
1 month 0.06 %0.75 %0.81 %3 months 0.06 %0.69 %0.75 %6 months 0.15 %0.81 %0.95 %Year to date 0.03 %6.46 %6.50 %
2005 36 186 629 $ 121 925 703 $ 29.68 % 1 n/a2004 32 826 835 $ 102 393 353 $ 32.06 % 1 n/a2003 27 831 399 $ 89 336 739 $ 31.15 % 1 n/a2002 21 037 849 $ 77 501 607 $ 27.15 % 1 n/a2001 24 150 128 $ 85 130 677 $ 28.37 % 1 n/a2000 29 920 850 $ 88 164 426 $ 33.94 % 1 n/a1999 26 253 117 $ 81 394 472 $ 32.25 % 1 n/a1998 26 670 390 $ 68 535 968 $ 38.91 % 1 n/a1997 28 873 517 $ 64 421 766 $ 44.82 % 1 n/a1996 24 385 511 $ 57 255 747 $ 42.59 % 16 n/a
Simple and Compound Annual Returns as at December 31st (per cent) :
1 YEAR 2 YEARS 3 YEARS 4 YEARS 5 YEARS 6 YEARS 7 YEARS 8 YEARS 9 YEARS 10 YEARS
6.50 6.99 7.11 7.78 8.06 8.46 7.10 7.39 7.79 8.296.46 6.80 6.77 7.25 7.42 7.88 6.55 6.87 7.18 7.670.03 0.19 0.35 0.53 0.64 0.57 0.56 0.52 0.62 0.61
COMPOSITE:2005:BENCHMARK:SPREAD:
7.49 7.42 8.21 8.45 8.85 7.21 7.52 7.96 8.497.15 6.92 7.52 7.66 8.17 6.56 6.93 7.26 7.810.35 0.51 0.69 0.79 0.68 0.65 0.59 0.69 0.68
COMPOSITE:2004:BENCHMARK:SPREAD:
7.36 8.57 8.77 9.19 7.15 7.52 8.02 8.616.69 7.70 7.83 8.43 6.44 6.89 7.28 7.890.66 0.87 0.94 0.77 0.71 0.63 0.74 0.72
COMPOSITE:2003:BENCHMARK:SPREAD:
9.80 9.49 9.81 7.10 7.55 8.14 8.798.73 8.40 9.01 6.38 6.94 7.38 8.061.07 1.08 0.80 0.72 0.62 0.76 0.73
COMPOSITE:2002:BENCHMARK:SPREAD:
9.18 9.82 6.21 7.00 7.81 8.638.08 9.16 5.61 6.49 7.11 7.951.10 0.66 0.60 0.51 0.69 0.67
COMPOSITE:2001:BENCHMARK:SPREAD:
10.47 4.76 6.28 7.47 8.5210.25 4.40 5.97 6.87 7.930.22 0.36 0.31 0.59 0.59
COMPOSITE:2000:BENCHMARK:SPREAD:
(0.65) 4.25 6.48 8.04(1.14) 3.89 5.77 7.360.48 0.36 0.71 0.68
COMPOSITE:1999:BENCHMARK:SPREAD:
9.39 10.24 11.109.18 9.41 10.350.22 0.84 0.75
COMPOSITE:1998:BENCHMARK:SPREAD:
11.10 11.969.63 10.941.47 1.02
COMPOSITE:1997:BENCHMARK:SPREAD:
12.8312.260.57
COMPOSITE:1996:BENCHMARK:SPREAD:
12Annual Report 2005 - Additional Information
Fixed Income - BondsNotes to the Fixed Income - Bonds composite :
1. Composite descriptionThis composite groups the core of the Caisse's fixed income investments in listed markets. Before July 1st, 2003, the bond management activities grouped bond investments in listed markets and private investments. Since that date, these two investment activities are now separate. The Fixed Income - bonds composite groups Bond investments made in listed markets only. For the returns presented until June 30, 2003, the Fixed Income - bonds composite is a carve-out of the Bonds composite reflecting listed market returns only, not private investments. After July 1st, 2003, the Bonds and Fixed Income - bonds composites reflect the same strategy.
A small portion of the composite represents an overlay activity with the intent to create value added. Repo lending activities exist in this composite.
2. Composite creation dateThis composite was created on October 1st, 2003.
3. BenchmarkSince 1992, the benchmark for this composite has been the Scotia Capital Universe Bond Index.
4. Calculation periodThe performance for this composite is calculated for the years from January 1st, 1996, to December 31st, 2005.
Deloitte & Touche LLP has not audited the schedules for the years presented from January 1st, 1995, to December 31st, 1998.
5. Operating expensesThe performance results are presented before operating expenses, but after transaction fees.
The operating expenses for this composite were 8 basis points for the year ended December 31st, 2005. For the four previous years, from January 1st, 2000, to December 31st, 2004, the fees averaged 10 basis points.
6. Investment universeThe benchmark consists of a universe of Canadian securities. A very limited portion of the composite may be invested in foreign countries. This portion may be invested in the United States, the EAFE countries and emerging markets (the last group is limited to 10% of the composite).
7. Use of derivativesThis composite uses derivatives in the normal course of investment management. Derivatives are used mainly to reduce exposure, to hedge positions and to take advantage of arbitrage opportunities.
8. Period of non-complianceFrom January 1st, 1995, to December 31st, 1996, it is not possible to measure the standard deviation of the annual returns of the accounts in this composite. This is due to the fact that, for this period, this composite is a carve-out from the Bonds composite, and management with specialized portfolios was not yet in place for this type of investment. The level of calculation for this carve-out does not permit, with the Caisse's calculation systems, a performance measurement for each account. It is possible to calculate only an aggregate return.
But the reader can refer himself to the Bonds composite. The volatility calculated for this composite gives an idea of the expected volatility for the Fixed Income - bonds composite.
13Annual Report 2005 - Additional Information

Canadian EquityReturns for years or periods ended December 31st :
Returns for periods ended December 31st, 2005 :
Period Composite Benchmark Spread
Net Assets Under Management (in thousands) for years ended December 31st :
Net Assets Under Management
% of Firm AssetsComposite
Number of Accounts
Std. Dev. of acct. returnsYear
1 month -0.29 %4.41 %4.13 %3 months -0.30 %2.86 %2.56 %6 months -1.37 %14.83 %13.46 %Year to date -3.13 %24.13 %21.00 %
2005 17 464 444 $ 121 925 703 $ 14.32 % 1 n/a2004 15 347 875 $ 102 393 353 $ 14.99 % 1 n/a2003 15 630 303 $ 89 336 739 $ 17.50 % 1 n/a2002 19 560 742 $ 77 501 607 $ 25.24 % 1 n/a2001 20 591 367 $ 85 130 677 $ 24.19 % 1 n/a2000 21 637 164 $ 88 164 426 $ 24.54 % 1 n/a1999 22 311 662 $ 81 394 472 $ 27.41 % 1 n/a1998 17 409 407 $ 68 535 968 $ 25.40 % 1 n/a1997 16 622 537 $ 64 421 766 $ 25.80 % 1 n/a1996 14 805 230 $ 57 255 747 $ 25.86 % 1 n/a
Simple and Compound Annual Returns as at December 31st (per cent) :
1 YEAR 2 YEARS 3 YEARS 4 YEARS 5 YEARS 6 YEARS 7 YEARS 8 YEARS 9 YEARS 10 YEARS
21.00 18.07 21.07 9.20 3.51 4.96 8.53 8.42 9.18 10.8524.13 19.21 21.66 12.06 7.63 8.22 11.30 9.60 10.19 11.88(3.13) (1.14) (0.59) (2.86) (4.12) (3.26) (2.77) (1.18) (1.00) (1.03)
COMPOSITE:2005:BENCHMARK:SPREAD:
15.21 21.10 5.52 (0.45) 2.01 6.58 6.73 7.79 9.7814.48 20.45 8.30 3.86 5.29 9.29 7.67 8.56 10.600.72 0.65 (2.78) (4.31) (3.28) (2.71) (0.94) (0.77) (0.82)
COMPOSITE:2004:BENCHMARK:SPREAD:
27.30 0.99 (5.18) (1.04) 4.94 5.38 6.77 9.1226.72 5.34 0.55 3.11 8.28 6.57 7.74 10.120.57 (4.35) (5.73) (4.15) (3.35) (1.19) (0.96) (1.00)
COMPOSITE:2003:BENCHMARK:SPREAD:
(19.88) (18.16) (9.01) (0.01) 1.47 3.69 6.74(12.44) (10.44) (3.74) 4.11 2.95 4.86 7.93(7.44) (7.73) (5.27) (4.12) (1.47) (1.17) (1.19)
COMPOSITE:2002:BENCHMARK:SPREAD:
(16.41) (3.03) 7.65 7.65 9.18 11.97(8.39) 0.93 10.29 7.20 8.71 11.76(8.02) (3.96) (2.64) 0.45 0.47 0.21
COMPOSITE:2001:BENCHMARK:SPREAD:
12.48 22.17 17.12 16.71 18.7111.20 21.02 12.96 13.46 16.291.28 1.14 4.16 3.25 2.42
COMPOSITE:2000:BENCHMARK:SPREAD:
32.69 19.51 18.16 20.3331.71 13.85 14.23 17.600.97 5.65 3.93 2.72
COMPOSITE:1999:BENCHMARK:SPREAD:
7.64 11.50 16.47(1.58) 6.37 13.259.22 5.13 3.22
COMPOSITE:1998:BENCHMARK:SPREAD:
15.51 21.1514.98 21.480.53 (0.33)
COMPOSITE:1997:BENCHMARK:SPREAD:
27.0728.35(1.28)
COMPOSITE:1996:BENCHMARK:SPREAD:
14Annual Report 2005 - Additional Information

Canadian EquityNotes to the Canadian Equity composite :
1. Composite descriptionThis composite groups the core of the Caisse's Canadian equity investments. Before July 1st, 2003, Canadian equity management activities grouped equity investments in quoted markets and private equity. Since that date, these two investment activities are now placed in separate composites. This composite groups only Canadian equity investments made in quoted markets, from July 1st, 2003, but reflects the historical returns of quoted markets and private equity.
Foreign investments in this composite may not exceed the imposed 20% of foreign content limit.
A small portion (less than 1%) of the composite represents an overlay activity with the intent to create value added. Investment activities in this composite may include leverage of up to 5%.
2. Composite creation dateThis composite was created on September 1st, 1998.
3. BenchmarkPrior to November 2000, the benchmark for this composite was the TSE 300. From November 2000 to January 2001, the depositors changed this benchmark to the S&P/TSX Capped Composite Index. The benchmark for this period is a combination of both indexes, to reflect the prevailing environment. Since January 2001, the benchmark has been the S&P/TSX Capped Composite Index.
4. Calculation periodThe performance for this composite is calculated for the periods from January 1st, 1996, to December 31st, 2005.
Deloitte & Touche LLP has not audited the schedules for the periods presented from January 1st, 1996, to December 31st, 1997.
5. Date of conversion to specialized portfolioThe holdings in the Depositors' portfolios were transferred to a specialized portfolio on July 1st, 1995. Since that date, the composite has consisted solely of the specialized portfolio.
6. Operating expensesThe performance results are presented before operating expenses, but after transaction fees.
The operating expenses for this composite were 27 basis points for the year ended December 31st, 2005. For the four previous years, from January 1st, 2000, to December 31st, 2004, the fees averaged 28 basis points.
7. Investment universeThe benchmark consists of a universe of Canadian securities. Up to 20% of the composite may be invested outside Canada.
8. Use of derivativesThis composite uses derivatives in the normal course of investment management. Derivatives are used mainly to reduce exposure, to hedge positions and to take advantage of arbitrage opportunities.
15Annual Report 2005 - Additional Information
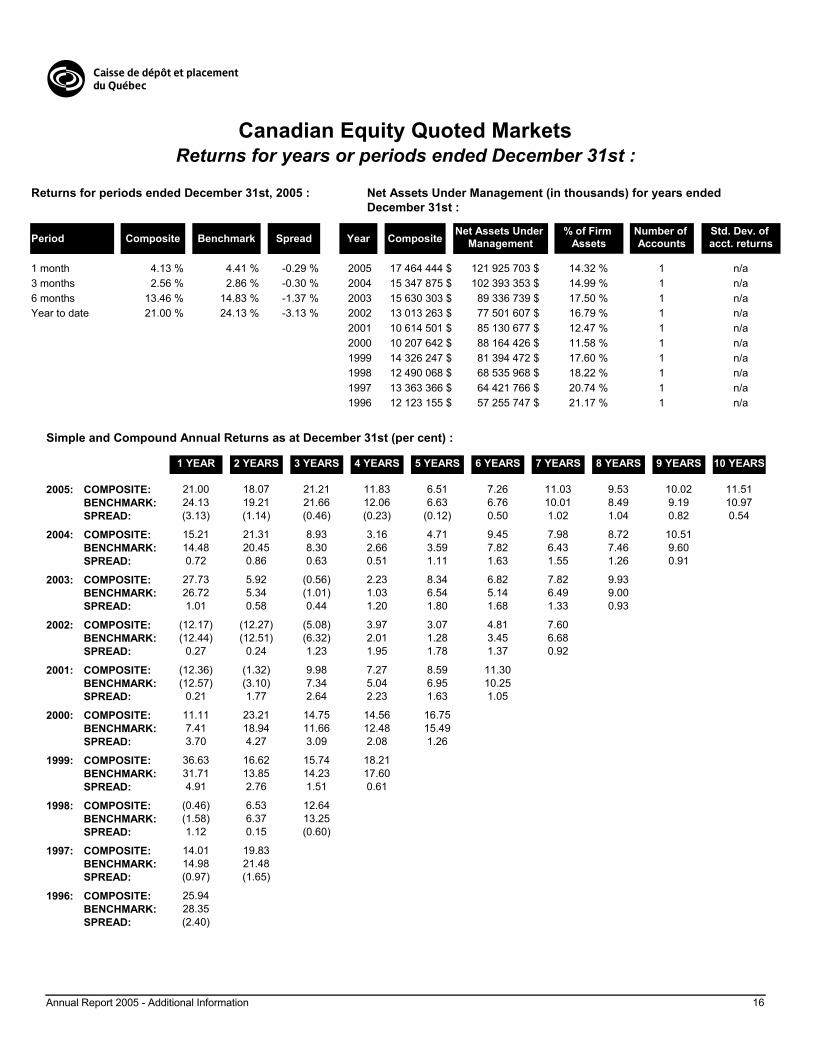
Canadian Equity Quoted MarketsReturns for years or periods ended December 31st :
Returns for periods ended December 31st, 2005 :
Period Composite Benchmark Spread
Net Assets Under Management (in thousands) for years ended December 31st :
Net Assets Under Management
% of Firm AssetsComposite
Number of Accounts
Std. Dev. of acct. returnsYear
1 month -0.29 %4.41 %4.13 %3 months -0.30 %2.86 %2.56 %6 months -1.37 %14.83 %13.46 %Year to date -3.13 %24.13 %21.00 %
2005 17 464 444 $ 121 925 703 $ 14.32 % 1 n/a2004 15 347 875 $ 102 393 353 $ 14.99 % 1 n/a2003 15 630 303 $ 89 336 739 $ 17.50 % 1 n/a2002 13 013 263 $ 77 501 607 $ 16.79 % 1 n/a2001 10 614 501 $ 85 130 677 $ 12.47 % 1 n/a2000 10 207 642 $ 88 164 426 $ 11.58 % 1 n/a1999 14 326 247 $ 81 394 472 $ 17.60 % 1 n/a1998 12 490 068 $ 68 535 968 $ 18.22 % 1 n/a1997 13 363 366 $ 64 421 766 $ 20.74 % 1 n/a1996 12 123 155 $ 57 255 747 $ 21.17 % 1 n/a
Simple and Compound Annual Returns as at December 31st (per cent) :
1 YEAR 2 YEARS 3 YEARS 4 YEARS 5 YEARS 6 YEARS 7 YEARS 8 YEARS 9 YEARS 10 YEARS
21.00 18.07 21.21 11.83 6.51 7.26 11.03 9.53 10.02 11.5124.13 19.21 21.66 12.06 6.63 6.76 10.01 8.49 9.19 10.97(3.13) (1.14) (0.46) (0.23) (0.12) 0.50 1.02 1.04 0.82 0.54
COMPOSITE:2005:BENCHMARK:SPREAD:
15.21 21.31 8.93 3.16 4.71 9.45 7.98 8.72 10.5114.48 20.45 8.30 2.66 3.59 7.82 6.43 7.46 9.600.72 0.86 0.63 0.51 1.11 1.63 1.55 1.26 0.91
COMPOSITE:2004:BENCHMARK:SPREAD:
27.73 5.92 (0.56) 2.23 8.34 6.82 7.82 9.9326.72 5.34 (1.01) 1.03 6.54 5.14 6.49 9.001.01 0.58 0.44 1.20 1.80 1.68 1.33 0.93
COMPOSITE:2003:BENCHMARK:SPREAD:
(12.17) (12.27) (5.08) 3.97 3.07 4.81 7.60(12.44) (12.51) (6.32) 2.01 1.28 3.45 6.68
0.27 0.24 1.23 1.95 1.78 1.37 0.92
COMPOSITE:2002:BENCHMARK:SPREAD:
(12.36) (1.32) 9.98 7.27 8.59 11.30(12.57) (3.10) 7.34 5.04 6.95 10.25
0.21 1.77 2.64 2.23 1.63 1.05
COMPOSITE:2001:BENCHMARK:SPREAD:
11.11 23.21 14.75 14.56 16.757.41 18.94 11.66 12.48 15.493.70 4.27 3.09 2.08 1.26
COMPOSITE:2000:BENCHMARK:SPREAD:
36.63 16.62 15.74 18.2131.71 13.85 14.23 17.604.91 2.76 1.51 0.61
COMPOSITE:1999:BENCHMARK:SPREAD:
(0.46) 6.53 12.64(1.58) 6.37 13.251.12 0.15 (0.60)
COMPOSITE:1998:BENCHMARK:SPREAD:
14.01 19.8314.98 21.48(0.97) (1.65)
COMPOSITE:1997:BENCHMARK:SPREAD:
25.9428.35(2.40)
COMPOSITE:1996:BENCHMARK:SPREAD:
16Annual Report 2005 - Additional Information

Canadian Equity Quoted MarketsNotes to the Canadian Equity Quoted Markets composite :
1. Composite descriptionThis composite groups the core of the Caisse's Canadian equity investments in quoted markets. Before July 1st, 2003, the Canadian equity management activities grouped equity investments in quoted markets and private equity. Since that date, these two investment activities are now separate. The Canadian Equity Quoted Markets composite groups Canadian equity investments made in quoted markets only. For the returns presented until June 30, 2003, the Canadian Equity Quoted Markets composite is a carve-out of the Canadian Equity composite reflecting quoted market returns only, not private equity. After July 1st, 2003, the Canadian Equity and Canadian Equity Quoted Markets composites reflect the same strategy.
Foreign investments in this composite may not exceed the imposed 20% of foreign content limit.
A small portion (less than 1%) of the composite represents an overlay activity with the intent to create value added. Investment activities in this composite may include leverage of up to 5%.
2. Composite creation dateThis composite was created on October 1st, 2003.
3. BenchmarkUntil December 31st, 2002, the benchmark for this composite was the TSE 300 Index. Since January 1st, 2003, the benchmark has been the S&P/TSX Capped Composite Index.
4. Calculation periodThe performance for this composite is calculated for the years from January 1st, 1996, to December 31st, 2005.
Deloitte & Touche LLP has not audited the schedules for the years presented from January 1st, 1995, to December 31st, 1998.
5. Operating expensesThe performance results are presented before operating expenses, but after transaction fees.
The operating expenses for this composite were 27 basis points for the year ended December 31st, 2005. For the four previous years, from January 1st, 2000, to December 31st, 2004, the fees averaged 18 basis points.
6. Investment universeThe benchmark consists of a universe of Canadian securities. Up to 20% of the composite may be invested outside Canada.
7. Use of derivativesThis composite uses derivatives in the normal course of investment management. Derivatives are used mainly to reduce exposure, to hedge positions and to take advantage of arbitrage opportunities.
8. Period of non-complianceFor the year 1995, it is not possible to measure the standard deviation of the annual returns of the accounts in this composite. This is due to the fact that, for this period, this composite is a carve-out from the Canadian Equity composite, and management with specialized portfolios was not yet in place for this type of investment. The level of calculation for this carve-out does not permit, with the Caisse's calculation systems, a performance measurement for each account. It is possible to calculate only an aggregate return.
But the reader can refer himself to the Canadian Equity composite. The volatility calculated for this composite gives an idea of the expected volatility for the Canadian Equity Quoted Markets composite.
17Annual Report 2005 - Additional Information

U.S. Equity (Hedged)Returns for years or periods ended December 31st :
Returns for periods ended December 31st, 2005 :
Period Composite Benchmark Spread
Net Assets Under Management (in thousands) for years ended December 31st :
Net Assets Under Management
% of Firm AssetsComposite
Number of Accounts
Std. Dev. of acct. returnsYear
1 month -0.01 %-0.06 %-0.07 %3 months 0.22 %1.76 %1.98 %6 months 0.31 %5.19 %5.51 %Year to date 1.19 %4.07 %5.26 %
2005 1 673 988 $ 121 925 703 $ 1.37 % 1 n/a2004 3 429 385 $ 102 393 353 $ 3.35 % 1 n/a2003 2 646 077 $ 89 336 739 $ 2.96 % 1 n/a2002 2 384 809 $ 77 501 607 $ 3.08 % 1 n/a2001 2 756 402 $ 85 130 677 $ 3.24 % 1 n/a2000 4 372 910 $ 88 164 426 $ 4.96 % 1 n/a1999 6 460 645 $ 81 394 472 $ 7.94 % 1 n/a1998 5 941 656 $ 68 535 968 $ 8.67 % 1 n/a1997 3 053 227 $ 64 421 766 $ 4.74 % 1 n/a1996 2 258 125 $ 57 255 747 $ 3.94 % 1 n/a
Simple and Compound Annual Returns as at December 31st (per cent) :
1 YEAR 2 YEARS 3 YEARS 4 YEARS 5 YEARS 6 YEARS 7 YEARS 8 YEARS 9 YEARS 10 YEARS
5.26 7.92 13.86 2.60 (0.50) (1.87) 1.05 3.81 6.42 7.774.07 7.82 14.90 4.31 0.73 (1.18) 1.62 4.46 7.04 8.421.19 0.10 (1.04) (1.71) (1.23) (0.69) (0.58) (0.65) (0.62) (0.65)
COMPOSITE:2005:BENCHMARK:SPREAD:
10.66 18.42 1.73 (1.89) (3.24) 0.36 3.60 6.57 8.0611.71 20.73 4.39 (0.09) (2.20) 1.22 4.52 7.42 8.92(1.05) (2.31) (2.66) (1.80) (1.04) (0.86) (0.92) (0.85) (0.86)
COMPOSITE:2004:BENCHMARK:SPREAD:
26.73 (2.47) (5.75) (6.43) (1.58) 2.47 6.00 7.7430.48 0.91 (3.74) (5.39) (0.76) 3.37 6.82 8.57(3.75) (3.37) (2.01) (1.04) (0.83) (0.89) (0.82) (0.84)
COMPOSITE:2003:BENCHMARK:SPREAD:
(24.94) (18.72) (15.43) (7.61) (1.79) 2.89 5.27(21.96) (17.31) (15.01) (7.32) (1.34) 3.31 5.76(2.98) (1.41) (0.42) (0.29) (0.45) (0.42) (0.50)
COMPOSITE:2002:BENCHMARK:SPREAD:
(11.99) (10.23) (0.99) 5.03 9.59 11.37(12.39) (11.30) (1.85) 4.62 9.28 11.26
0.40 1.07 0.86 0.42 0.31 0.11
COMPOSITE:2001:BENCHMARK:SPREAD:
(8.44) 5.02 11.41 15.76 16.74(10.20) 3.89 10.99 15.49 16.70
1.76 1.13 0.42 0.28 0.03
COMPOSITE:2000:BENCHMARK:SPREAD:
20.46 22.89 25.18 24.0520.19 23.40 25.59 24.610.27 (0.50) (0.41) (0.56)
COMPOSITE:1999:BENCHMARK:SPREAD:
25.38 27.61 25.2726.69 28.38 26.11(1.31) (0.77) (0.85)
COMPOSITE:1998:BENCHMARK:SPREAD:
29.87 25.2130.09 25.83(0.22) (0.62)
COMPOSITE:1997:BENCHMARK:SPREAD:
20.7121.70(0.99)
COMPOSITE:1996:BENCHMARK:SPREAD:
18Annual Report 2005 - Additional Information

U.S. Equity (Hedged)Notes to the U.S. Equity (Hedged) composite :
1. Composite descriptionThis composite groups the core of the Caisse's U.S. equity investments that are hedged against currency risk. Before July 1st, 2003, the U.S. equity management activities grouped equity investments in quoted markets and private equity. Since that date, these two investment activities are now placed in separate composites. This composite groups only U.S. equity investments made in quoted markets, hedged against currency risk, from July 1st, 2003, but reflects the historical returns of quoted markets and private equity.
In April 2000, unhedged management of U.S. equity investments was initiated. Previously, hedged and unhedged investments were grouped into one composite, U.S. Equity, created on September 1st 1998. To ensure greater transparency, the Caisse now separates their current and historical performances. The U.S. Equity composite is divided into the U.S. Equity (Hedged) composite and the U.S. Equity (Unhedged) composite.
Furthermore, in April 2000, hedging was implemented to provide full coverage against currency risk. Prior to April 2000, hedging levels varied with the estimated levels of risk.
This composite exactly reproduces the U.S. Equity (Unhedged) composite, with the exception of currency hedging. Investment activities in this composite may include leverage of up to 5%.
2. Composite creation dateThis composite was created on October 1st, 2002.
3. BenchmarkThe benchmark for this composite is the S&P 500 Index (Hedged).
4. Calculation periodThe performance for this composite is calculated since its inception date, January 1st, 1996, to December 31st, 2005.
Deloitte & Touche LLP has not audited the schedules since inception date, to December 31st, 1997.
5. Date of transfer to the specialized portfolioThe holdings were transferred to the specialized portfolio on April 1st, 1994.
6. Operating expensesThe performance results are presented before operating expenses, but after transaction fees.
The operating expenses for this composite were 33 basis points for the year ended December 31st, 2005. For the four previous years, from January 1st, 2000, to December 31st, 2004, the fees averaged 20 basis points.
7. Use of derivativesThis composite uses derivatives in the normal course of investment management. Derivatives are used mainly to reduce exposure, to hedge positions and to take advantage of arbitrage opportunities.
19Annual Report 2005 - Additional Information
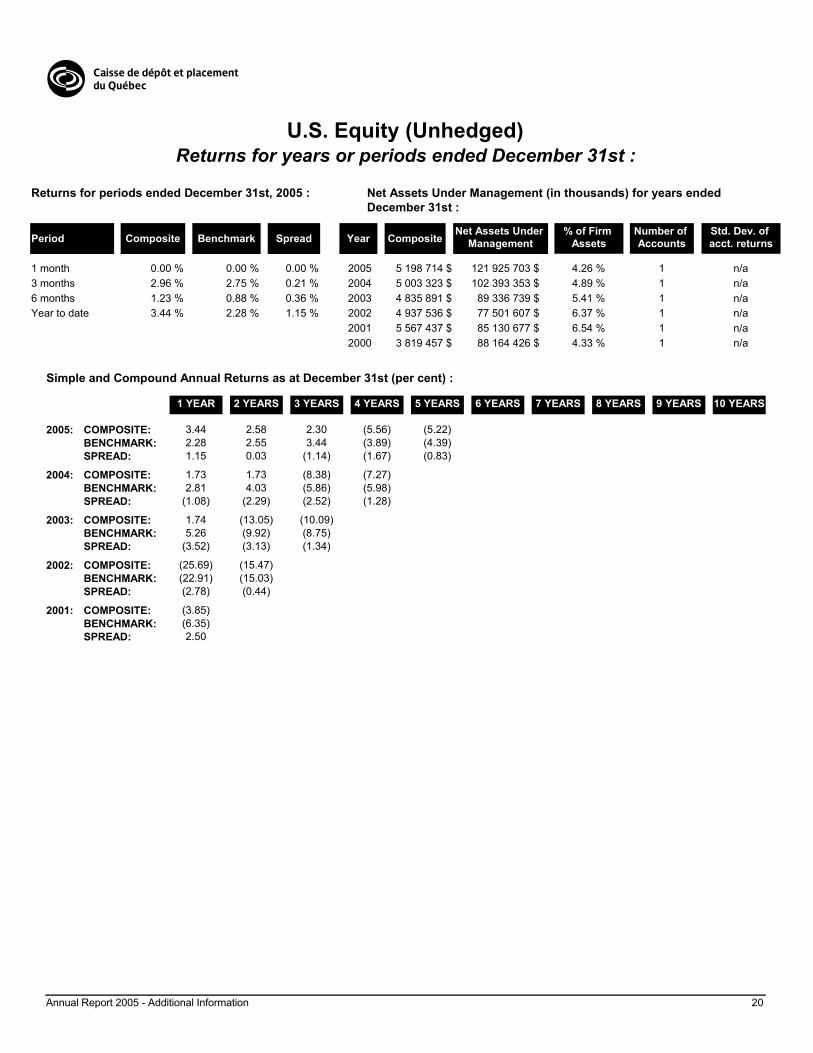
U.S. Equity (Unhedged)Returns for years or periods ended December 31st :
Returns for periods ended December 31st, 2005 :
Period Composite Benchmark Spread
Net Assets Under Management (in thousands) for years ended December 31st :
Net Assets Under Management
% of Firm AssetsComposite
Number of Accounts
Std. Dev. of acct. returnsYear
1 month 0.00 %0.00 %0.00 %3 months 0.21 %2.75 %2.96 %6 months 0.36 %0.88 %1.23 %Year to date 1.15 %2.28 %3.44 %
2005 5 198 714 $ 121 925 703 $ 4.26 % 1 n/a2004 5 003 323 $ 102 393 353 $ 4.89 % 1 n/a2003 4 835 891 $ 89 336 739 $ 5.41 % 1 n/a2002 4 937 536 $ 77 501 607 $ 6.37 % 1 n/a2001 5 567 437 $ 85 130 677 $ 6.54 % 1 n/a2000 3 819 457 $ 88 164 426 $ 4.33 % 1 n/a
Simple and Compound Annual Returns as at December 31st (per cent) :
1 YEAR 2 YEARS 3 YEARS 4 YEARS 5 YEARS 6 YEARS 7 YEARS 8 YEARS 9 YEARS 10 YEARS
3.44 2.58 2.30 (5.56) (5.22)2.28 2.55 3.44 (3.89) (4.39)1.15 0.03 (1.14) (1.67) (0.83)
COMPOSITE:2005:BENCHMARK:SPREAD:
1.73 1.73 (8.38) (7.27)2.81 4.03 (5.86) (5.98)
(1.08) (2.29) (2.52) (1.28)
COMPOSITE:2004:BENCHMARK:SPREAD:
1.74 (13.05) (10.09)5.26 (9.92) (8.75)
(3.52) (3.13) (1.34)
COMPOSITE:2003:BENCHMARK:SPREAD:
(25.69) (15.47)(22.91) (15.03)(2.78) (0.44)
COMPOSITE:2002:BENCHMARK:SPREAD:
(3.85)(6.35)2.50
COMPOSITE:2001:BENCHMARK:SPREAD:
20Annual Report 2005 - Additional Information
U.S. Equity (Unhedged)Notes to the U.S. Equity (Unhedged) composite :
1. Composite descriptionThis composite groups the core of the Caisse's U.S. equity investments that are not hedged against currency risk. Before July 1st, 2003, the U.S. equity management activities grouped equity investments in quoted markets and private equity. Since that date, these two investment activities are now placed in separate composites. This composite groups only U.S. equity investments made in quoted markets, unhedged against currency risk, from July 1st, 2003, but reflects the historical returns of quoted markets and private equity.
Unhedged management began in April 2000. Before October 2002, this type of investment was grouped, along with U.S. Equity (Hedged), in the same composite. To ensure greater transparency, the Caisse now separates their current and historical performances. The U.S. Equity composite is divided into the U.S. Equity (Hedged) composite and the U.S. Equity (Unhedged) composite.
This composite exactly reproduces the U.S. Equity (Hedged) composite, without any currency hedging activity. Investment activities in this composite may include leverage of up to 5%.
2. Composite creation dateThis composite was created on October 1st, 2002.
3. BenchmarkThe benchmark for this composite is the S&P 500 Index (unhedged).
4. Calculation periodPerformance for this composite is calculated since its inception date, April 1st, 2000, to December 31st, 2005.
Deloitte & Touche LLP has audited the schedules since inception date, to December 31st, 2004.
5. Date of transfer to the specialized portfolioThe holdings were transferred to the specialized portfolio on April 1st, 2000.
6. Operating expensesThe performance results are presented before operating expenses, but after transaction fees.
The operating expenses for this composite were 32 basis points for the year ended December 31st, 2005. For the four previous years, from January 1st, 2000, to December 31st, 2004, the fees averaged 20 basis points.
7. Use of derivativesThis composite uses derivatives in the normal course of investment management. Derivatives are used mainly to reduce exposure, to hedge positions and to take advantage of arbitrage opportunities.
21Annual Report 2005 - Additional Information

U.S. Equity Quoted MarketsReturns for years or periods ended December 31st :
Returns for periods ended December 31st, 2005 :
Period Composite Benchmark Spread
Net Assets Under Management (in thousands) for years ended December 31st :
Net Assets Under Management
% of Firm AssetsComposite
Number of Accounts
Std. Dev. of acct. returnsYear
1 month -0.01 %-0.06 %-0.07 %3 months 0.22 %1.76 %1.98 %6 months 0.32 %5.19 %5.51 %Year to date 1.19 %4.07 %5.26 %
2005 6 866 279 $ 121 925 703 $ 5.63 % 1 n/a2004 8 387 152 $ 102 393 353 $ 8.19 % 1 n/a2003 7 508 394 $ 89 336 739 $ 8.40 % 1 n/a2002 6 401 658 $ 77 501 607 $ 8.26 % 1 n/a2001 7 450 849 $ 85 130 677 $ 8.75 % 1 n/a2000 7 931 860 $ 88 164 426 $ 9.00 % 1 n/a1999 6 465 122 $ 81 394 472 $ 7.94 % 1 n/a1998 6 175 061 $ 68 535 968 $ 9.01 % 1 n/a1997 2 414 527 $ 64 421 766 $ 3.75 % 1 n/a1996 2 412 205 $ 57 255 747 $ 4.21 % 1 n/a
Simple and Compound Annual Returns as at December 31st (per cent) :
1 YEAR 2 YEARS 3 YEARS 4 YEARS 5 YEARS 6 YEARS 7 YEARS 8 YEARS 9 YEARS 10 YEARS
5.26 7.93 14.07 3.38 0.72 (0.44) 2.36 5.72 8.98 10.314.07 7.82 14.90 4.31 0.73 (1.18) 1.62 5.39 8.70 10.101.19 0.10 (0.83) (0.93) (0.01) 0.74 0.74 0.34 0.28 0.21
COMPOSITE:2005:BENCHMARK:SPREAD:
10.66 18.75 2.76 (0.39) (1.54) 1.88 5.79 9.45 10.8911.71 20.73 4.39 (0.09) (2.20) 1.22 5.58 9.29 10.79(1.05) (1.98) (1.62) (0.30) 0.66 0.66 0.21 0.17 0.10
COMPOSITE:2004:BENCHMARK:SPREAD:
27.44 (0.97) (3.82) (4.38) 0.21 5.00 9.28 10.9230.48 0.91 (3.74) (5.39) (0.76) 4.59 8.95 10.67(3.04) (1.88) (0.08) 1.02 0.97 0.41 0.34 0.24
COMPOSITE:2003:BENCHMARK:SPREAD:
(23.05) (16.44) (13.11) (5.63) 1.01 6.52 8.74(21.96) (17.31) (15.01) (7.32) 0.06 5.72 8.10(1.09) 0.87 1.90 1.69 0.95 0.80 0.64
COMPOSITE:2002:BENCHMARK:SPREAD:
(9.27) (7.66) 1.01 8.12 13.68 15.19(12.39) (11.30) (1.85) 6.48 12.34 14.13
3.13 3.64 2.86 1.64 1.34 1.05
COMPOSITE:2001:BENCHMARK:SPREAD:
(6.03) 6.58 14.63 20.27 20.82(10.20) 3.89 13.63 19.55 20.33
4.17 2.69 0.99 0.72 0.48
COMPOSITE:2000:BENCHMARK:SPREAD:
20.88 26.60 30.58 28.6520.19 27.83 31.51 29.470.69 (1.23) (0.93) (0.82)
COMPOSITE:1999:BENCHMARK:SPREAD:
32.59 35.72 31.3535.96 37.57 32.72(3.36) (1.85) (1.37)
COMPOSITE:1998:BENCHMARK:SPREAD:
38.91 30.7439.19 31.13(0.28) (0.40)
COMPOSITE:1997:BENCHMARK:SPREAD:
23.0423.54(0.50)
COMPOSITE:1996:BENCHMARK:SPREAD:
22Annual Report 2005 - Additional Information

U.S. Equity Quoted MarketsNotes to the U.S. Equity Quoted Markets composite :
1. Composite descriptionThis composite groups the core of the Caisse's U.S. equity investments in quoted markets. Before July 1st, 2003, the U.S. equity management activities grouped equity investments in quoted markets and private equity. Since that date, these two investment activities are now separate. The U.S. Equity Quoted Markets composite groups U.S. equity investments made in quoted markets. For the returns presented until June 30, 2003, the U.S. Equity Quoted Markets composite groups carve-outs from the U.S. Equity (Hedged) and U.S. Equity (Unhedged) composites reflecting quoted market returns only, not private equity. After July 1st 2003, the U.S. Equity (Hedged), U.S. Equity (Unhedged) and U.S. Equity Quoted Markets composites reflect the same strategy, except for the currency hedging activities. Investment activities in this composite may include leverage of up to 5%.
2. Composite creation dateThis composite was created on October 1st, 2003.
3. BenchmarkIn the previous presentations, the benchmark associated with this composite was the S&P 500 hedged index. But this composite was unhedged before January 1st, 1999. For this reason, we decided to retroactively change this index by another that we feel is more appropriate, the S&P 500 unhedged before January 1st, 1999, and the S&P 500 hedged after this date.
4. Calculation periodThe performance for this composite is calculated for the years from January 1st, 1996, to December 31st, 2005.
Deloitte & Touche LLP has not audited the schedules for the years presented from January 1st, 1995, to December 31st, 1998.
5. Operating expensesThe performance results are presented before operating expenses, but after transaction fees.
The operating expenses for this composite were 33 basis points for the year ended December 31st, 2005. For the four previous years, from January 1st, 2000, to December 31st, 2004, the fees averaged 14 basis points.
6. Use of derivativesThis composite uses derivatives in the normal course of investment management. Derivatives are used mainly to reduce exposure, to hedge positions and to take advantage of arbitrage opportunities.
23Annual Report 2005 - Additional Information
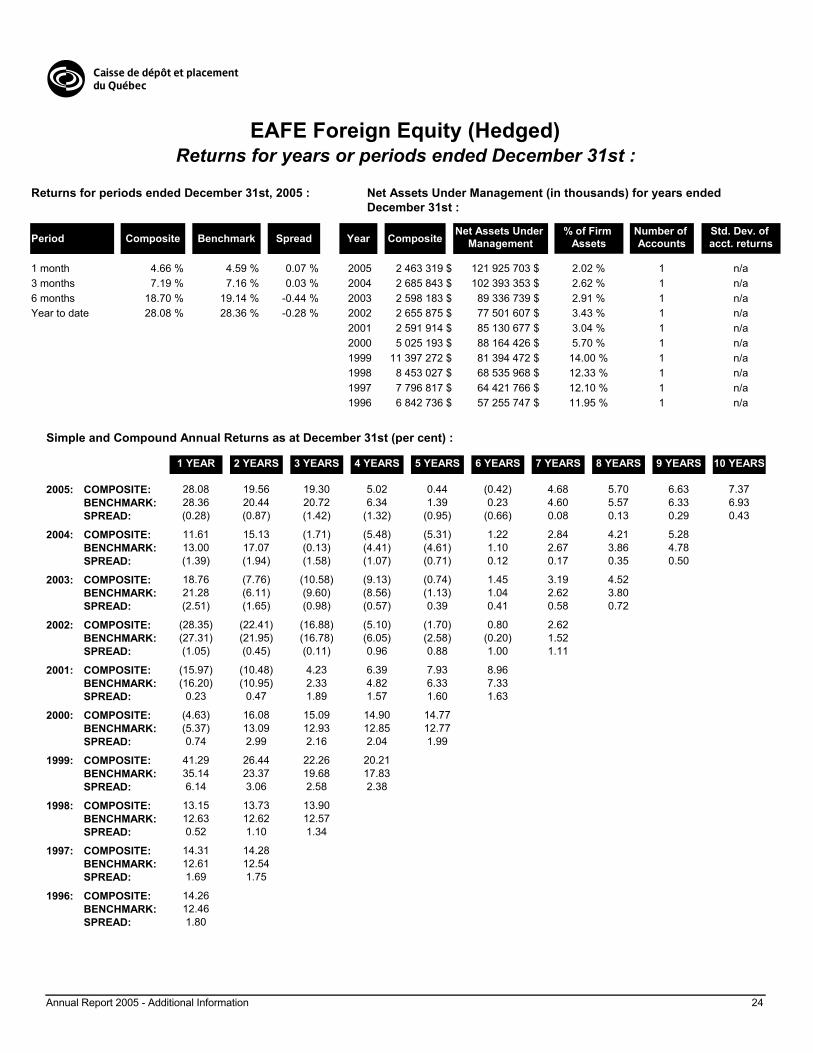
EAFE Foreign Equity (Hedged)Returns for years or periods ended December 31st :
Returns for periods ended December 31st, 2005 :
Period Composite Benchmark Spread
Net Assets Under Management (in thousands) for years ended December 31st :
Net Assets Under Management
% of Firm AssetsComposite
Number of Accounts
Std. Dev. of acct. returnsYear
1 month 0.07 %4.59 %4.66 %3 months 0.03 %7.16 %7.19 %6 months -0.44 %19.14 %18.70 %Year to date -0.28 %28.36 %28.08 %
2005 2 463 319 $ 121 925 703 $ 2.02 % 1 n/a2004 2 685 843 $ 102 393 353 $ 2.62 % 1 n/a2003 2 598 183 $ 89 336 739 $ 2.91 % 1 n/a2002 2 655 875 $ 77 501 607 $ 3.43 % 1 n/a2001 2 591 914 $ 85 130 677 $ 3.04 % 1 n/a2000 5 025 193 $ 88 164 426 $ 5.70 % 1 n/a1999 11 397 272 $ 81 394 472 $ 14.00 % 1 n/a1998 8 453 027 $ 68 535 968 $ 12.33 % 1 n/a1997 7 796 817 $ 64 421 766 $ 12.10 % 1 n/a1996 6 842 736 $ 57 255 747 $ 11.95 % 1 n/a
Simple and Compound Annual Returns as at December 31st (per cent) :
1 YEAR 2 YEARS 3 YEARS 4 YEARS 5 YEARS 6 YEARS 7 YEARS 8 YEARS 9 YEARS 10 YEARS
28.08 19.56 19.30 5.02 0.44 (0.42) 4.68 5.70 6.63 7.3728.36 20.44 20.72 6.34 1.39 0.23 4.60 5.57 6.33 6.93(0.28) (0.87) (1.42) (1.32) (0.95) (0.66) 0.08 0.13 0.29 0.43
COMPOSITE:2005:BENCHMARK:SPREAD:
11.61 15.13 (1.71) (5.48) (5.31) 1.22 2.84 4.21 5.2813.00 17.07 (0.13) (4.41) (4.61) 1.10 2.67 3.86 4.78(1.39) (1.94) (1.58) (1.07) (0.71) 0.12 0.17 0.35 0.50
COMPOSITE:2004:BENCHMARK:SPREAD:
18.76 (7.76) (10.58) (9.13) (0.74) 1.45 3.19 4.5221.28 (6.11) (9.60) (8.56) (1.13) 1.04 2.62 3.80(2.51) (1.65) (0.98) (0.57) 0.39 0.41 0.58 0.72
COMPOSITE:2003:BENCHMARK:SPREAD:
(28.35) (22.41) (16.88) (5.10) (1.70) 0.80 2.62(27.31) (21.95) (16.78) (6.05) (2.58) (0.20) 1.52(1.05) (0.45) (0.11) 0.96 0.88 1.00 1.11
COMPOSITE:2002:BENCHMARK:SPREAD:
(15.97) (10.48) 4.23 6.39 7.93 8.96(16.20) (10.95) 2.33 4.82 6.33 7.33
0.23 0.47 1.89 1.57 1.60 1.63
COMPOSITE:2001:BENCHMARK:SPREAD:
(4.63) 16.08 15.09 14.90 14.77(5.37) 13.09 12.93 12.85 12.770.74 2.99 2.16 2.04 1.99
COMPOSITE:2000:BENCHMARK:SPREAD:
41.29 26.44 22.26 20.2135.14 23.37 19.68 17.836.14 3.06 2.58 2.38
COMPOSITE:1999:BENCHMARK:SPREAD:
13.15 13.73 13.9012.63 12.62 12.570.52 1.10 1.34
COMPOSITE:1998:BENCHMARK:SPREAD:
14.31 14.2812.61 12.541.69 1.75
COMPOSITE:1997:BENCHMARK:SPREAD:
14.2612.461.80
COMPOSITE:1996:BENCHMARK:SPREAD:
24Annual Report 2005 - Additional Information
EAFE Foreign Equity (Hedged)Notes to the EAFE Foreign Equity (Hedged) composite :
1. Composite descriptionThis composite groups the core of the Caisse's Europe, Australasia and Far-East (EAFE) equity investments, hedged against currency risk. Before July 1st, 2003, the EAFE equity management activities grouped equity investments in quoted markets and private equity. Since that date, these two investment activities are now placed in separate composites. This composite groups only EAFE Foreign Equity investments made in quoted markets, hedged against currency risk, from July 1st, 2003, but reflects the historical returns of quoted markets and private equity.
In April 2000, unhedged management of EAFE equity investments was initiated. Previously, hedged and unhedged investments were grouped in one composite, EAFE Foreign Equity, created on September 1st 1998. This composite also included Emerging Markets Equity, which began in October 1993. Investing activities in emerging markets were separated from EAFE foreign equity investments in January 1995. To ensure greater transparency, the Caisse now separates their current and historical performances. The former Foreign Equity composite is now divided into the EAFE Foreign Equity (Hedged) composite, the EAFE Foreign Equity (Unhedged) composite and the Emerging Markets Equity composite.
Furthermore, in April 2000, hedging was implemented to provide full hedging against currency risk. Prior to April 2000, hedging levels varied with the estimated levels of risk.
This composite exactly reproduces the EAFE Foreign Equity (Unhedged) composite, with the exception of currency hedging. Investment activities in this composite may include leverage of up to 5%.
2. Composite creation dateThis composite was created on October 1st, 2002.
3. BenchmarkThe benchmark for this composite is the MSCI EAFE Index (Hedged).
4. Calculation periodThe performance for this composite is calculated for the periods from January 1st, 1996, to December 31st, 2005.
Deloitte & Touche LLP has not audited the schedules for the periods presented from January 1st, 1996, to December 31st, 1997.
5. Date of conversion to specialized portfolioThe holdings in the Depositors' portfolios were transferred to a specialized portfolio on June 1st, 1989. Since that date, the composite has consisted solely of the specialized portfolio.
6. Operating expensesThe performance results are presented before operating expenses, but after transaction fees.
The operating expenses for this composite were 43 basis points for the year ended December 31st, 2005. For the four previous years, from January 1st, 2000, to December 31st, 2004, the fees averaged 37 basis points.
7. Investment universeThe composite may invest outside its benchmark. The proportion of investments in a country not included in the benchmark is limited.
8. Use of derivativesThis composite uses derivatives in the normal course of investment management. Derivatives are used mainly to reduce exposure, to hedge positions and to take advantage of arbitrage opportunities.
25Annual Report 2005 - Additional Information

EAFE Foreign Equity (Unhedged)Returns for years or periods ended December 31st :
Returns for periods ended December 31st, 2005 :
Period Composite Benchmark Spread
Net Assets Under Management (in thousands) for years ended December 31st :
Net Assets Under Management
% of Firm AssetsComposite
Number of Accounts
Std. Dev. of acct. returnsYear
1 month 0.06 %4.62 %4.68 %3 months 0.04 %4.76 %4.80 %6 months -0.49 %9.57 %9.08 %Year to date -0.27 %10.69 %10.42 %
2005 5 801 343 $ 121 925 703 $ 4.76 % 1 n/a2004 5 369 555 $ 102 393 353 $ 5.24 % 1 n/a2003 5 517 354 $ 89 336 739 $ 6.18 % 1 n/a2002 5 686 686 $ 77 501 607 $ 7.34 % 1 n/a2001 6 469 225 $ 85 130 677 $ 7.60 % 1 n/a2000 4 509 944 $ 88 164 426 $ 5.12 % 1 n/a
Simple and Compound Annual Returns as at December 31st (per cent) :
1 YEAR 2 YEARS 3 YEARS 4 YEARS 5 YEARS 6 YEARS 7 YEARS 8 YEARS 9 YEARS 10 YEARS
10.42 10.17 10.38 2.43 (1.73)10.69 11.09 11.84 3.87 (0.57)(0.27) (0.92) (1.47) (1.44) (1.16)
COMPOSITE:2005:BENCHMARK:SPREAD:
9.91 10.35 (0.11) (4.55)11.49 12.42 1.69 (3.20)(1.58) (2.07) (1.79) (1.35)
COMPOSITE:2004:BENCHMARK:SPREAD:
10.80 (4.77) (8.93)13.36 (2.89) (7.66)(2.56) (1.88) (1.28)
COMPOSITE:2003:BENCHMARK:SPREAD:
(18.15) (17.44)(16.81) (16.66)(1.34) (0.78)
COMPOSITE:2002:BENCHMARK:SPREAD:
(16.73)(16.51)(0.22)
COMPOSITE:2001:BENCHMARK:SPREAD:
26Annual Report 2005 - Additional Information

EAFE Foreign Equity (Unhedged)Notes to the EAFE Foreign Equity (Unhedged) composite :
1. Composite descriptionThis composite groups the core of the Caisse's EAFE foreign equity investments that are not hedged against currency risk. Before July 1st, 2003, EAFE equity management activities grouped equity investments in quoted markets and private equity. Since that date, these two investment activities are now placed in separate composites. This composite groups only EAFE foreign equity investments made in quoted markets, unhedged against currency risk, from July 1st, 2003, but reflects the historical returns of quoted markets and private equity.
Unhedged management began in April 2000. Before October 2002, this type of investment was grouped in the same composite as EAFE Foreign Equity hedged and Emerging Markets Equity. To ensure greater transparency, the Caisse now separates their current and historical performances. The former Foreign Equity composite is now divided into the EAFE Foreign Equity (Hedged) composite, the EAFE Foreign Equity (Unhedged) composite, and the Emerging Markets Equity composite.
This composite exactly reproduces the EAFE Foreign Equity (Hedged) composite, without any currency hedging activity. Investment activities in this composite may include leverage of up to 5%.
2. Composite creation dateThis composite was created on October 1st, 2002.
3. BenchmarkThe benchmark for this composite is the MSCI EAFE Index (Unhedged).
4. Calculation periodPerformance for this composite is calculated since its inception date, April 1st, 2000, to December 31st, 2005.
Deloitte & Touche LLP has audited the schedules since inception date, to December 31st, 2004.
5. Date of transfer to the specialized portfolioThe holdings were transferred to the specialized portfolio on April 1st, 2000.
6. Operating expensesThe performance results are presented before operating expenses, but after transaction fees.
The operating expenses for this composite were 37 basis points for the year ended December 31st, 2005. For the four previous years, from January 1st, 2000, to December 31st, 2004, the fees averaged 37 basis points.
7. Investment universeThe composite may invest outside its benchmark. The proportion of investments in a country not included in the benchmark is limited.
8. Use of derivativesThis composite uses derivatives in the normal course of investment management. Derivatives are used mainly to reduce exposure, to hedge positions and to take advantage of arbitrage opportunities.
27Annual Report 2005 - Additional Information
EAFE Foreign Equity Quoted MarketsReturns for years or periods ended December 31st :
Returns for periods ended December 31st, 2005 :
Period Composite Benchmark Spread
Net Assets Under Management (in thousands) for years ended December 31st :
Net Assets Under Management
% of Firm AssetsComposite
Number of Accounts
Std. Dev. of acct. returnsYear
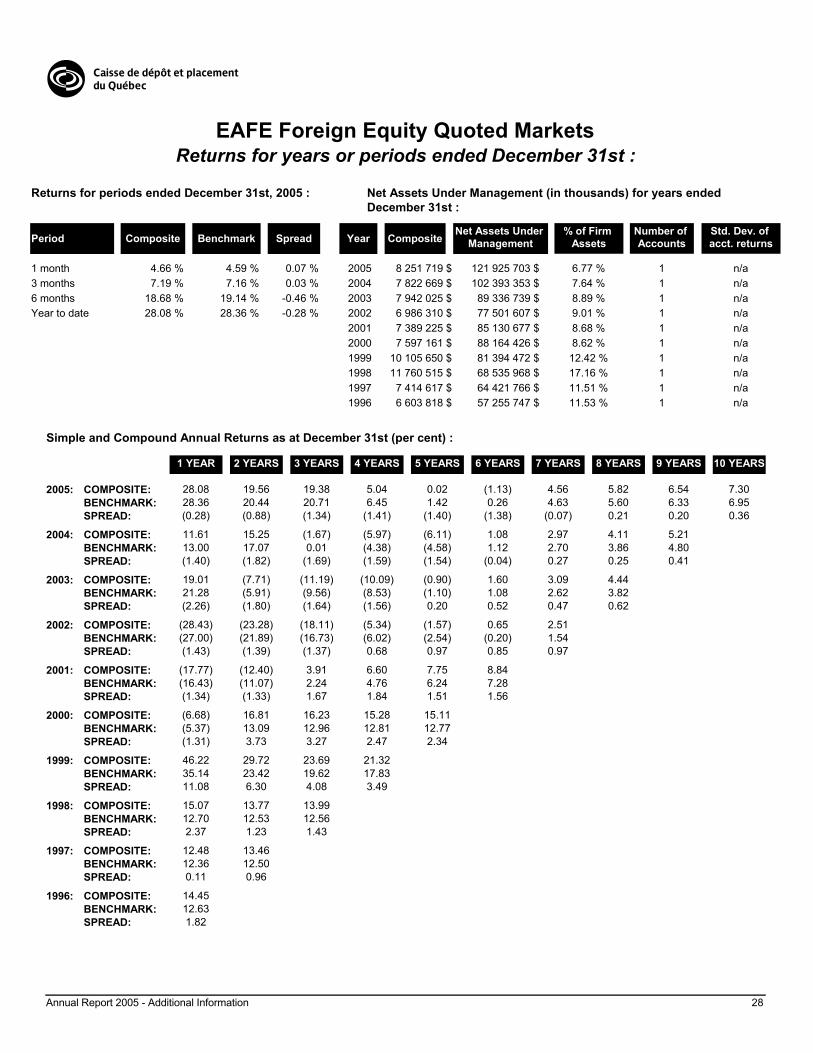
1 month 0.07 %4.59 %4.66 %3 months 0.03 %7.16 %7.19 %6 months -0.46 %19.14 %18.68 %Year to date -0.28 %28.36 %28.08 %
2005 8 251 719 $ 121 925 703 $ 6.77 % 1 n/a2004 7 822 669 $ 102 393 353 $ 7.64 % 1 n/a2003 7 942 025 $ 89 336 739 $ 8.89 % 1 n/a2002 6 986 310 $ 77 501 607 $ 9.01 % 1 n/a2001 7 389 225 $ 85 130 677 $ 8.68 % 1 n/a2000 7 597 161 $ 88 164 426 $ 8.62 % 1 n/a1999 10 105 650 $ 81 394 472 $ 12.42 % 1 n/a1998 11 760 515 $ 68 535 968 $ 17.16 % 1 n/a1997 7 414 617 $ 64 421 766 $ 11.51 % 1 n/a1996 6 603 818 $ 57 255 747 $ 11.53 % 1 n/a
Simple and Compound Annual Returns as at December 31st (per cent) :
1 YEAR 2 YEARS 3 YEARS 4 YEARS 5 YEARS 6 YEARS 7 YEARS 8 YEARS 9 YEARS 10 YEARS
28.08 19.56 19.38 5.04 0.02 (1.13) 4.56 5.82 6.54 7.3028.36 20.44 20.71 6.45 1.42 0.26 4.63 5.60 6.33 6.95(0.28) (0.88) (1.34) (1.41) (1.40) (1.38) (0.07) 0.21 0.20 0.36
COMPOSITE:2005:BENCHMARK:SPREAD:
11.61 15.25 (1.67) (5.97) (6.11) 1.08 2.97 4.11 5.2113.00 17.07 0.01 (4.38) (4.58) 1.12 2.70 3.86 4.80(1.40) (1.82) (1.69) (1.59) (1.54) (0.04) 0.27 0.25 0.41
COMPOSITE:2004:BENCHMARK:SPREAD:
19.01 (7.71) (11.19) (10.09) (0.90) 1.60 3.09 4.4421.28 (5.91) (9.56) (8.53) (1.10) 1.08 2.62 3.82(2.26) (1.80) (1.64) (1.56) 0.20 0.52 0.47 0.62
COMPOSITE:2003:BENCHMARK:SPREAD:
(28.43) (23.28) (18.11) (5.34) (1.57) 0.65 2.51(27.00) (21.89) (16.73) (6.02) (2.54) (0.20) 1.54(1.43) (1.39) (1.37) 0.68 0.97 0.85 0.97
COMPOSITE:2002:BENCHMARK:SPREAD:
(17.77) (12.40) 3.91 6.60 7.75 8.84(16.43) (11.07) 2.24 4.76 6.24 7.28(1.34) (1.33) 1.67 1.84 1.51 1.56
COMPOSITE:2001:BENCHMARK:SPREAD:
(6.68) 16.81 16.23 15.28 15.11(5.37) 13.09 12.96 12.81 12.77(1.31) 3.73 3.27 2.47 2.34
COMPOSITE:2000:BENCHMARK:SPREAD:
46.22 29.72 23.69 21.3235.14 23.42 19.62 17.8311.08 6.30 4.08 3.49
COMPOSITE:1999:BENCHMARK:SPREAD:
15.07 13.77 13.9912.70 12.53 12.562.37 1.23 1.43
COMPOSITE:1998:BENCHMARK:SPREAD:
12.48 13.4612.36 12.500.11 0.96
COMPOSITE:1997:BENCHMARK:SPREAD:
14.4512.631.82
COMPOSITE:1996:BENCHMARK:SPREAD:
28Annual Report 2005 - Additional Information

EAFE Foreign Equity Quoted MarketsNotes to the EAFE Foreign Equity Quoted Markets composite :
1. Composite descriptionThis composite groups the core of the Caisse's Europe, Australasia and Far-East (EAFE) foreign equity investments in quoted markets. Before July 1st, 2003, EAFE equity management activities grouped equity investments in quoted markets and private equity. Since that date, these two investment activities are now separate. The EAFE Foreign Equity Quoted Markets composite groups EAFE equity investments made in quoted markets. For the returns presented until June 30, 2003, the EAFE Foreign Equity Quoted Markets composite groups carve-outs from the EAFE Foreign Equity (Hedged) and EAFE Foreign Equity (Unhedged) composites reflecting quoted market returns only, not private equity. After July 1st, 2003, the EAFE Foreign Equity (Hedged), EAFE Foreign Equity (Unhedged) and EAFE Foreign Equity Quoted Markets composites reflect the same strategy, except for the currency hedging activities. Investment activities in this composite may include leverage of up to 5%.
2. Composite creation dateThis composite was created on October 1st, 2003.
3. BenchmarkThe benchmark for this composite is the MSCI EAFE Index (Hedged).
4. Calculation periodThe performance for this composite is calculated for the years from January 1st, 1996, to December 31st, 2005.
Deloitte & Touche LLP has not audited the schedules for the years presented from January 1st, 1995, to December 31st, 1998.
5. Operating expensesThe performance results are presented before operating expenses, but after transaction fees.
The operating expenses for this composite were 42 basis points for the year ended December 31st, 2005. For the four previous years, from January 1st, 2000, to December 31st, 2004, the fees averaged 17 basis points.
6. Investment universeThe composite may invest outside its benchmark. The proportion of investments in a country not included in the benchmark is limited.
7. Use of derivativesThis composite uses derivatives in the normal course of investment management. Derivatives are used mainly to reduce exposure, to hedge positions and to take advantage of arbitrage opportunities.
29Annual Report 2005 - Additional Information

Emerging Markets EquityReturns for years or periods ended December 31st :
Returns for periods ended December 31st, 2005 :
Period Composite Benchmark Spread
Net Assets Under Management (in thousands) for years ended December 31st :
Net Assets Under Management
% of Firm AssetsComposite
Number of Accounts
Std. Dev. of acct. returnsYear
1 month 0.68 %5.87 %6.55 %3 months 0.96 %7.87 %8.84 %6 months 0.45 %20.57 %21.02 %Year to date -0.16 %30.64 %30.48 %
2005 1 281 022 $ 121 925 703 $ 1.05 % 1 n/a2004 939 335 $ 102 393 353 $ 0.92 % 1 n/a2003 957 481 $ 89 336 739 $ 1.07 % 1 n/a2002 1 120 303 $ 77 501 607 $ 1.45 % 1 n/a2001 1 347 422 $ 85 130 677 $ 1.58 % 1 n/a2000 1 070 284 $ 88 164 426 $ 1.21 % 1 n/a1999 1 438 231 $ 81 394 472 $ 1.77 % 1 n/a1998 862 099 $ 68 535 968 $ 1.26 % 1 n/a1997 1 035 301 $ 64 421 766 $ 1.61 % 1 n/a1996 900 108 $ 57 255 747 $ 1.57 % 1 n/a
Simple and Compound Annual Returns as at December 31st (per cent) :
1 YEAR 2 YEARS 3 YEARS 4 YEARS 5 YEARS 6 YEARS 7 YEARS 8 YEARS 9 YEARS 10 YEARS
30.48 22.23 25.54 12.74 9.53 1.58 8.95 4.09 2.83 3.1630.64 23.32 24.68 15.83 13.30 4.98 11.98 6.21 5.12 4.73(0.16) (1.10) 0.85 (3.09) (3.78) (3.40) (3.03) (2.12) (2.30) (1.56)
COMPOSITE:2005:BENCHMARK:SPREAD:
14.50 23.14 7.38 4.84 (3.38) 5.72 0.79 (0.19) 0.5116.41 21.81 11.27 9.34 0.49 9.14 3.11 2.30 2.19(1.91) 1.33 (3.89) (4.50) (3.87) (3.42) (2.33) (2.49) (1.68)
COMPOSITE:2004:BENCHMARK:SPREAD:
32.44 3.99 1.80 (7.39) 4.05 (1.33) (2.13) (1.12)27.46 8.79 7.08 (3.13) 7.74 1.05 0.43 0.534.98 (4.80) (5.28) (4.26) (3.69) (2.38) (2.56) (1.65)
COMPOSITE:2003:BENCHMARK:SPREAD:
(18.35) (10.75) (17.80) (2.04) (6.97) (6.94) (5.16)(7.14) (1.85) (11.60) 3.31 (3.53) (3.48) (2.82)
(11.21) (8.90) (6.20) (5.35) (3.44) (3.46) (2.34)
COMPOSITE:2002:BENCHMARK:SPREAD:
(2.44) (17.53) 4.09 (3.89) (4.47) (2.76)3.74 (13.75) 7.05 (2.61) (2.73) (2.08)
(6.18) (3.78) (2.96) (1.28) (1.75) (0.69)
COMPOSITE:2001:BENCHMARK:SPREAD:
(30.28) 7.53 (4.37) (4.97) (2.83)(28.29) 8.75 (4.64) (4.28) (3.20)(1.99) (1.22) 0.27 (0.70) 0.37
COMPOSITE:2000:BENCHMARK:SPREAD:
65.84 12.00 5.36 5.5864.93 9.97 5.40 4.340.92 2.03 (0.04) 1.24
COMPOSITE:1999:BENCHMARK:SPREAD:
(24.36) (16.02) (9.17)(26.67) (15.74) (10.43)
2.31 (0.28) 1.25
COMPOSITE:1998:BENCHMARK:SPREAD:
(6.76) (0.47)(3.19) (1.00)(3.58) 0.53
COMPOSITE:1997:BENCHMARK:SPREAD:
6.251.245.00
COMPOSITE:1996:BENCHMARK:SPREAD:
30Annual Report 2005 - Additional Information
Emerging Markets EquityNotes to the Emerging Markets Equity composite :
1. Composite descriptionThis composite groups the core of the Caisse's emerging markets equity investments. From December 1st, 2000, to June 30th, 2003, the emerging markets equity management activities grouped equity investments in quoted markets and private equity. Starting July 1st, 2003, these two investment activities are now placed in separate composites. This composite groups only emerging markets equity investments made in quoted markets, from July 1st, 2003, but reflects the historical returns of quoted markets and private equity.
This type of investment began in October 1993, as a part of foreign equity investments. Management of Emerging Markets Equity was separated as a whole in January 1995. Before October 2002, it was grouped within the same composite as EAFE Foreign Equity (Hedged) and EAFE Foreign Equity (Unhedged). To ensure greater transparency, the Caisse now separates their current and historical performances. The former Foreign Equity composite is now divided into the EAFE Foreign Equity (Hedged) composite, the EAFE Foreign Equity (Unhedged) composite, and the Emerging Markets Equity composite.
Currency hedging has varied over time. Private equity investments were always fully hedged against local currency risk. For investments in listed markets, before January 1st, 2000, the currency risk between the U.S. and Canadian currencies was fully hedged. From January 1st to June 30th, 2000, the same hedge was applied to varying degrees. Since July 1st, 2000, the composite has been unhedged. Investment activities in this composite may include leverage of up to 5%.
2. Composite creation dateThis composite was created on October 1st, 2002.
3. BenchmarkThe benchmark for this composite is the MSCI EM Index. The hedging of the composite has varied over time. Before January 1st, 2000, the index was fully hedged for currency risk between the Canadian and U.S. currencies. From January 1st, to June 30th, the same hedge was applied partially. Since July 1st, 2000, the index has not been hedged.
4. Calculation periodThe performance for this composite is calculated since its inception date, January 1st, 1996, to December 31st, 2005.
Deloitte & Touche LLP has not audited the schedules since inception date, to December 31st, 1997.
5. Date of transfer to the specialized portfolioThe holdings were transferred to the specialized portfolio on January 1st, 1995.
6. Operating expensesThe performance results are presented before operating expenses, but after transaction fees.
The operating expenses for this composite were 139 basis points for the year ended December 31st, 2005. For the four previous years, from January 1st, 2000, to December 31st, 2004, the fees averaged 82 basis points.
7. Investment universeThe composite may invest outside its benchmark. The proportion of investments in a country not included in the benchmark is limited.
8. Use of derivativesThis composite uses derivatives in the normal course of investment management. Derivatives are used mainly to reduce exposure, to hedge positions and to take advantage of arbitrage opportunities.
31Annual Report 2005 - Additional Information
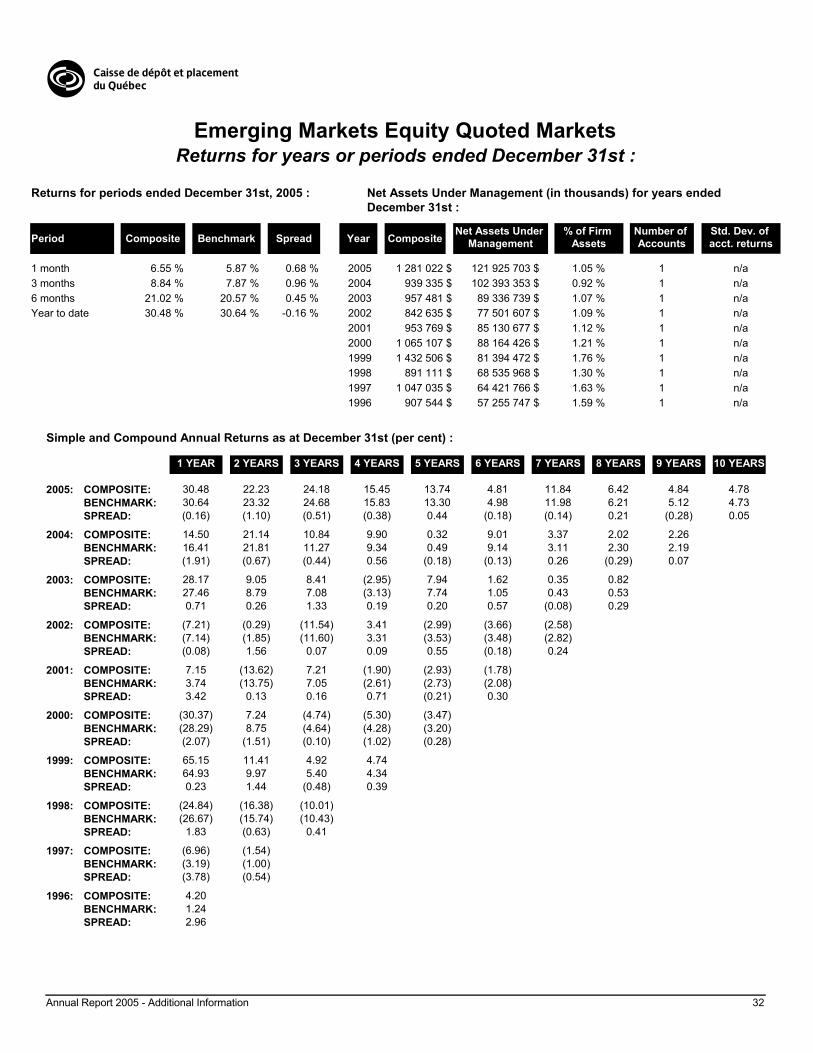
Emerging Markets Equity Quoted MarketsReturns for years or periods ended December 31st :
Returns for periods ended December 31st, 2005 :
Period Composite Benchmark Spread
Net Assets Under Management (in thousands) for years ended December 31st :
Net Assets Under Management
% of Firm AssetsComposite
Number of Accounts
Std. Dev. of acct. returnsYear
1 month 0.68 %5.87 %6.55 %3 months 0.96 %7.87 %8.84 %6 months 0.45 %20.57 %21.02 %Year to date -0.16 %30.64 %30.48 %
2005 1 281 022 $ 121 925 703 $ 1.05 % 1 n/a2004 939 335 $ 102 393 353 $ 0.92 % 1 n/a2003 957 481 $ 89 336 739 $ 1.07 % 1 n/a2002 842 635 $ 77 501 607 $ 1.09 % 1 n/a2001 953 769 $ 85 130 677 $ 1.12 % 1 n/a2000 1 065 107 $ 88 164 426 $ 1.21 % 1 n/a1999 1 432 506 $ 81 394 472 $ 1.76 % 1 n/a1998 891 111 $ 68 535 968 $ 1.30 % 1 n/a1997 1 047 035 $ 64 421 766 $ 1.63 % 1 n/a1996 907 544 $ 57 255 747 $ 1.59 % 1 n/a
Simple and Compound Annual Returns as at December 31st (per cent) :
1 YEAR 2 YEARS 3 YEARS 4 YEARS 5 YEARS 6 YEARS 7 YEARS 8 YEARS 9 YEARS 10 YEARS
30.48 22.23 24.18 15.45 13.74 4.81 11.84 6.42 4.84 4.7830.64 23.32 24.68 15.83 13.30 4.98 11.98 6.21 5.12 4.73(0.16) (1.10) (0.51) (0.38) 0.44 (0.18) (0.14) 0.21 (0.28) 0.05
COMPOSITE:2005:BENCHMARK:SPREAD:
14.50 21.14 10.84 9.90 0.32 9.01 3.37 2.02 2.2616.41 21.81 11.27 9.34 0.49 9.14 3.11 2.30 2.19(1.91) (0.67) (0.44) 0.56 (0.18) (0.13) 0.26 (0.29) 0.07
COMPOSITE:2004:BENCHMARK:SPREAD:
28.17 9.05 8.41 (2.95) 7.94 1.62 0.35 0.8227.46 8.79 7.08 (3.13) 7.74 1.05 0.43 0.530.71 0.26 1.33 0.19 0.20 0.57 (0.08) 0.29
COMPOSITE:2003:BENCHMARK:SPREAD:
(7.21) (0.29) (11.54) 3.41 (2.99) (3.66) (2.58)(7.14) (1.85) (11.60) 3.31 (3.53) (3.48) (2.82)(0.08) 1.56 0.07 0.09 0.55 (0.18) 0.24
COMPOSITE:2002:BENCHMARK:SPREAD:
7.15 (13.62) 7.21 (1.90) (2.93) (1.78)3.74 (13.75) 7.05 (2.61) (2.73) (2.08)3.42 0.13 0.16 0.71 (0.21) 0.30
COMPOSITE:2001:BENCHMARK:SPREAD:
(30.37) 7.24 (4.74) (5.30) (3.47)(28.29) 8.75 (4.64) (4.28) (3.20)(2.07) (1.51) (0.10) (1.02) (0.28)
COMPOSITE:2000:BENCHMARK:SPREAD:
65.15 11.41 4.92 4.7464.93 9.97 5.40 4.340.23 1.44 (0.48) 0.39
COMPOSITE:1999:BENCHMARK:SPREAD:
(24.84) (16.38) (10.01)(26.67) (15.74) (10.43)
1.83 (0.63) 0.41
COMPOSITE:1998:BENCHMARK:SPREAD:
(6.96) (1.54)(3.19) (1.00)(3.78) (0.54)
COMPOSITE:1997:BENCHMARK:SPREAD:
4.201.242.96
COMPOSITE:1996:BENCHMARK:SPREAD:
32Annual Report 2005 - Additional Information

Emerging Markets Equity Quoted MarketsNotes to the Emerging Markets Equity Quoted Markets composite :
1. Composite descriptionThis composite groups the core of the Caisse's emerging markets equity investments in quoted markets. Before July 1st, 2003, emerging markets equity management activities grouped equity investments in quoted markets and private equity. Since that date, these two investment activities are now separate. The Emerging Markets Equity Quoted Markets composite groups emerging markets equity investments made in quoted markets only. For the returns presented until June 30, 2003, the Emerging Markets Equity Quoted Markets composite is a carve-out of the Emerging Markets Equity composite reflecting quoted market returns only, not private equity. After July 1st, 2003, the Emerging Markets Equity and Emerging Markets Equity Quoted Markets composites reflect the same strategy. Investment activities in this composite may include leverage of up to 5%.
2. Composite creation dateThis composite was created on October 1st, 2003.
3. BenchmarkThe benchmark for this composite is the MSCI EM Index. The hedging of the composite has varied over time. Before January 1st, 2000, the index was fully hedged for currency risk between the Canadian and U.S. currencies. From January 1st to June 30th, the same hedge was partially applied. Since July 1st 2000, the index has not been hedged.
4. Calculation periodThe performance for this composite is calculated since its inception date, January 1st, 1996, to December 31st, 2005.
Deloitte & Touche LLP has not audited the schedules since inception date, to December 31st, 1998.
5. Operating expensesThe performance results are presented before operating expenses, but after transaction fees.
The operating expenses for this composite were 139 basis points for the year ended December 31st, 2005. For the four previous years, from January 1st, 2000, to December 31st, 2004, the fees averaged 67 basis points.
6. Investment universeThe composite may invest outside its benchmark. The proportion of investments in a country not included in the benchmark is limited.
7. Use of derivativesThis composite uses derivatives in the normal course of investment management. Derivatives are used mainly to reduce exposure, to hedge positions and to take advantage of arbitrage opportunities.
33Annual Report 2005 - Additional Information

Quebec InternationalReturns for years or periods ended December 31st :
Returns for periods ended December 31st, 2005 :
Period Composite Benchmark Spread
Net Assets Under Management (in thousands) for years ended December 31st :
Net Assets Under Management
% of Firm AssetsComposite
Number of Accounts
Std. Dev. of acct. returnsYear
1 month 0.14 %2.38 %2.51 %3 months 0.09 %4.28 %4.37 %6 months 0.20 %11.07 %11.27 %Year to date 0.27 %19.12 %19.39 %
2005 10 871 865 $ 121 925 703 $ 8.92 % 1 n/a2004 8 197 537 $ 102 393 353 $ 8.01 % 1 n/a2003 6 078 779 $ 89 336 739 $ 6.80 % 1 n/a2002 5 089 830 $ 77 501 607 $ 6.57 % 1 n/a2001 5 491 411 $ 85 130 677 $ 6.45 % 1 n/a2000 5 405 955 $ 88 164 426 $ 6.13 % 1 n/a1999 2 794 858 $ 81 394 472 $ 3.43 % 1 n/a
Simple and Compound Annual Returns as at December 31st (per cent) :
1 YEAR 2 YEARS 3 YEARS 4 YEARS 5 YEARS 6 YEARS 7 YEARS 8 YEARS 9 YEARS 10 YEARS
19.39 17.91 22.13 10.07 5.21 3.3419.12 17.70 22.10 10.03 5.10 3.200.27 0.21 0.03 0.04 0.11 0.14
COMPOSITE:2005:BENCHMARK:SPREAD:
16.44 23.52 7.13 1.93 0.3916.29 23.61 7.16 1.86 0.280.15 (0.09) (0.03) 0.08 0.11
COMPOSITE:2004:BENCHMARK:SPREAD:
31.03 2.76 (2.49) (3.26)31.39 2.87 (2.54) (3.37)(0.36) (0.11) 0.05 0.11
COMPOSITE:2003:BENCHMARK:SPREAD:
(19.41) (15.88) (12.57)(19.46) (16.06) (12.77)
0.05 0.19 0.21
COMPOSITE:2002:BENCHMARK:SPREAD:
(12.19) (8.93)(12.52) (9.22)
0.33 0.29
COMPOSITE:2001:BENCHMARK:SPREAD:
(5.55)(5.80)0.25
COMPOSITE:2000:BENCHMARK:SPREAD:
34Annual Report 2005 - Additional Information
Quebec InternationalNotes to the Quebec International composite :
1. Composite descriptionThis composite represents a strategy made up of a fixed income portfolio, mainly Québec provincial bonds, with an overlay of an international futures portfolio, based on the MSCI World Index, excluding Canada. The strategy comprises four elements:- Index tracking, including 12 international indexes, through the use of futures;- Fixed income investments, to a maximum of 80% of tangible assets;- Money market investments, to a maximum of 20% of tangible assets;- Value-added investments, through equity (maximum 6%).
The strategy is primarily based on index tracking.
Leverage related to value added activities involving equities must not exceed 20% of the composite.
2. Composite creation dateThis composite was created on July 1st, 1999.
3. BenchmarkThe benchmark for this composite is the Québec International Index, created by the Caisse. It has two components: the return on tangible assets and the return on futures. The total of both these returns provides the return for the Québec International Index.
The tangible assets index consists of the Scotia Capital Québec Provincial Index in a proportion of 80%, and the Scotia Capital 91-days T-bill Index, in a proportion of 20%. These proportions are weighted monthly.
The futures index is determined once a year, on the last day of February, by taking into account the weighting of the MSCI World Index, excluding Canada. It is based on a futures basket based on twelve local indexes. This basket consists of an integer number for each contract. The number of contracts in the basket remains fixed for a year and is rebalanced every March 31st. Changes in the futures basket’s value determines the weighting of each index in the basket.
4. Calculation periodPerformance for this composite is calculated since its inception date, July 1st, 1999, to December 31st, 2005.
Deloitte & Touche LLP has audited the schedules since inception date, to December 31st, 2004.
5. Date of conversion to specialized portfolioThe holdings in the Depositors' portfolios were transferred to a specialized portfolio on July 1st, 1999. Since that date, the composite has consisted solely of the specialized portfolio.
6. Operating expensesThe performance results are presented before operating expenses, but after transaction fees.
The operating expenses for this composite were 8 basis points for the year ended December 31st, 2005. For the four previous years, from January 1st, 2000, to December 31st, 2004, the fees averaged 5 basis points.
7. Use of derivativesAs stated in the composite description, the strategy is based mainly on index tracking using futures contracts.
35Annual Report 2005 - Additional Information

Investments and InfrastructuresReturns for years or periods ended December 31st :
Returns for periods ended December 31st, 2005 :
Period Composite Benchmark Spread
Net Assets Under Management (in thousands) for years ended December 31st :
Net Assets Under Management
% of Firm AssetsComposite
Number of Accounts
Std. Dev. of acct. returnsYear
1 month -1.25 %3.50 %2.25 %3 months -3.48 %6.31 %2.83 %6 months -8.88 %14.09 %5.20 %Year to date -6.23 %18.58 %12.34 %
2005 4 712 933 $ 121 925 703 $ 3.87 % 1 n/a2004 3 889 074 $ 102 393 353 $ 3.80 % 1 n/a2003 2 664 856 $ 89 336 739 $ 2.98 % 1 n/a
Simple and Compound Annual Returns as at December 31st (per cent) :
1 YEAR 2 YEARS 3 YEARS 4 YEARS 5 YEARS 6 YEARS 7 YEARS 8 YEARS 9 YEARS 10 YEARS
12.34 14.7418.58 15.46(6.23) (0.72)
COMPOSITE:2005:BENCHMARK:SPREAD:
17.2012.434.76
COMPOSITE:2004:BENCHMARK:SPREAD:
36Annual Report 2005 - Additional Information
Investments and InfrastructuresNotes to the Investments and Infrastructures composite :
1. Composite descriptionThis composite groups the Caisse's private equity activities that focus mainly on three forms of investment: development, debt and infrastructure. Moreover, certain strategies included in the composite take advantage of market opportunities involving listed securities translating into securities accumulation in the same sectors.
Most of the investments take the form of debt and equity with a view to support maintenance or development of companies in traditional sectors.
The sectors of activity are materials, consumer staples, consumer discretionay, financials, utilities and the industrials.
Until June 30th, 2003, investments in the Investments and infrastructures composite were in the Canadian Equity, U.S. Equity, Foreign EAFE Equity, Emerging Markets Equity and Bond management activities. This type of investment was grouped in its own specialized portfolio on July 1st, 2003. As a result of this change in the organizational structure on July 1st, 2003, a new global management philosophy and strategies were implemented for this type of investment.
Leverage is associated with the debt portion of the composite. The leverage may not exceed the lower of the debt load and 25% of the gross assets of the composite.
2. Composite creation dateThis composite was created on October 1st, 2003.
3. BenchmarkThe benchmark for this composite is the S&P/TSX Index. But the index is adjusted to reflect the investment types in the composite and only the following sectors are included in the index calculations: materials, consumer staples, consumer discretionary, financials, utilities and the industrials. The sector weighting is proportional to market capitalization.
It is important to note that the index used is volatile. The managers have minimum absolute-return objective that includes a forecast long-term return of 7% and a risk premium of 2%. The managers are evaluated according to this objective. For return follow-up and comparison, the long-term comparison index is calculated over a period of five years in order to correspond to the managers' investment horizons.
4. Calculation periodPerformance for this composite is calculated since its inception date, July 1st, 2003, to December 31st, 2005.
Deloitte & Touche LLP has audited the schedules since inception date, to December 31st, 2004.
5. Date of transfer to the specialized portfolioThe holdings were transferred to the specialized portfolio on July 1st, 2003.
6. Operating expensesThe performance results are presented before operating expenses, but after transaction fees.
The operating expenses for this composite were 73 basis points for the year ended December 31st, 2005. Since inception of the composite, from July 1st, 2003, to December 31st, 2004, the fees averaged 80 basis points.
7. Investment universeThe benchmark consists of a universe of Canadian securities. But investments are mainly done in Canada and in the United States. A significant portion of the composite is invested in foreign countries. These investments are subject to strict concentration limits by geographic region.
37Annual Report 2005 - Additional Information
8. Use of derivativesThis composite uses derivatives in the normal course of investment management. Derivatives are used mainly to reduce exposure, to hedge and to take positions.
38Annual Report 2005 - Additional Information

Private EquityReturns for years or periods ended December 31st :
Returns for periods ended December 31st, 2005 :
Period Composite Benchmark Spread
Net Assets Under Management (in thousands) for years ended December 31st :
Net Assets Under Management
% of Firm AssetsComposite
Number of Accounts
Std. Dev. of acct. returnsYear
1 month 3.07 %-1.10 %1.97 %3 months 8.41 %-0.41 %8.00 %6 months 14.03 %-1.38 %12.65 %Year to date 29.15 %0.67 %29.82 %
2005 6 218 634 $ 121 925 703 $ 5.10 % 1 n/a2004 5 101 330 $ 102 393 353 $ 4.98 % 1 n/a2003 6 106 341 $ 89 336 739 $ 6.84 % 1 n/a
Simple and Compound Annual Returns as at December 31st (per cent) :
1 YEAR 2 YEARS 3 YEARS 4 YEARS 5 YEARS 6 YEARS 7 YEARS 8 YEARS 9 YEARS 10 YEARS
29.82 26.030.67 10.3429.15 15.69
COMPOSITE:2005:BENCHMARK:SPREAD:
22.3520.951.41
COMPOSITE:2004:BENCHMARK:SPREAD:
39Annual Report 2005 - Additional Information

Private EquityNotes to the Private Equity composite :
1. Composite descriptionThis composite groups the Caisse's private equity activities that focus primarily on three forms of investment: venture capital, buyout and mezzanine loans.
Most of the investments are made indirectly through external funds around the world.
The sectors of activity are consumer staples, discretionary consumer, healthcare, information technology, telecommunications and the industrials.
Until June 30th, 2003, private equity was included in the Canadian Equity, U.S. Equity, Foreign EAFE Equity, Emerging Markets Equity and Bonds management activities. This type of investment was grouped in its own specialized portfolio on July 1st, 2003. As a result of this change in the organizational structure on July 1st, 2003, a new global management philosophy and strategies were implemented for this type of investment.
2. Composite creation dateThis composite was created on October 1st, 2003.
3. BenchmarkThe benchmark for this composite is the S&P 600 Index. But the index is adjusted to reflect the investment types in the composite, only the following sectors are included in the index calculations: consumer staples, consumer discretionary, healthcare, information technology, telecommunications and the industrials. The sector weighting is fixed.
It is important to note that the index used is volatile. The managers have minimum absolute-return objective that includes a forecast long-term return of 7% and a risk premium of 5%. The managers are evaluated according to this objective. For return follow-up and comparison, the long-term comparison index is calculated over a period of five years in order to correspond to the managers' investment horizons.
4. Calculation periodPerformance for this composite is calculated since its inception date, July 1st, 2003, to December 31st, 2005.
Deloitte & Touche LLP has audited the schedules since inception date, to December 31st, 2004.
5. Date of transfer to the specialized portfolioThe holdings were transferred to the specialized portfolio on July 1st, 2003.
6. Operating expensesThe performance results are presented before operating expenses, but after transaction fees.
The operating expenses for this composite were 69 basis points for the year ended December 31st, 2005. Since inception of the composite, from July 1st, 2003, to December 31st, 2004, the fees averaged 109 basis points.
7. Investment universeThe benchmark consists of a universe of U.S. securities. But investments are made mainly in Canada and the United States. A significant portion of the composite is invested in foreign countries. These investments are subject to strict concentration limits by geographic region.
8. Use of derivativesThis composite uses derivatives in the normal course of investment management. Derivatives are used mainly to reduce exposure, to hedge and to take positions.
40Annual Report 2005 - Additional Information

Real Estate DebtReturns for years or periods ended December 31st :
Returns for periods ended December 31st, 2005 :
Period Composite Benchmark Spread
Net Assets Under Management (in thousands) for years ended December 31st :
Net Assets Under Management
% of Firm AssetsComposite
Number of Accounts
Std. Dev. of acct. returnsYear
1 month -0.01 %0.78 %0.77 %3 months 0.20 %0.74 %0.94 %6 months 1.35 %0.85 %2.20 %Year to date 4.43 %6.51 %10.94 %
2005 6 389 641 $ 121 925 703 $ 5.24 % 1 n/a2004 4 315 533 $ 102 393 353 $ 4.21 % 1 n/a2003 3 254 092 $ 89 336 739 $ 3.64 % 1 n/a2002 3 524 837 $ 77 501 607 $ 4.55 % 1 n/a2001 2 884 041 $ 85 130 677 $ 3.39 % 1 n/a2000 1 978 430 $ 88 164 426 $ 2.24 % 1 n/a1999 1 671 798 $ 81 394 472 $ 2.05 % 1 n/a1998 1 655 603 $ 68 535 968 $ 2.42 % 1 n/a1997 1 548 235 $ 64 421 766 $ 2.40 % 1 n/a1996 1 566 383 $ 57 255 747 $ 2.74 % 1 n/a
Simple and Compound Annual Returns as at December 31st (per cent) :
1 YEAR 2 YEARS 3 YEARS 4 YEARS 5 YEARS 6 YEARS 7 YEARS 8 YEARS 9 YEARS 10 YEARS
10.94 11.45 10.82 10.94 10.63 10.91 9.40 9.10 8.72 9.046.51 6.83 6.78 7.27 7.43 7.89 6.55 6.79 6.53 7.114.43 4.63 4.03 3.67 3.20 3.02 2.84 2.31 2.19 1.93
COMPOSITE:2005:BENCHMARK:SPREAD:
11.97 10.75 10.93 10.55 10.91 9.14 8.84 8.45 8.837.15 6.92 7.52 7.66 8.17 6.56 6.83 6.53 7.184.82 3.83 3.42 2.89 2.74 2.58 2.01 1.92 1.65
COMPOSITE:2004:BENCHMARK:SPREAD:
9.55 10.42 10.08 10.64 8.58 8.33 7.95 8.456.69 7.70 7.83 8.43 6.44 6.77 6.44 7.182.86 2.72 2.25 2.22 2.14 1.55 1.51 1.26
COMPOSITE:2003:BENCHMARK:SPREAD:
11.30 10.35 11.01 8.34 8.08 7.69 8.298.73 8.40 9.01 6.38 6.79 6.40 7.252.57 1.95 2.00 1.96 1.29 1.29 1.04
COMPOSITE:2002:BENCHMARK:SPREAD:
9.41 10.87 7.38 7.29 6.98 7.808.08 9.16 5.61 6.31 5.94 7.011.33 1.71 1.76 0.98 1.04 0.79
COMPOSITE:2001:BENCHMARK:SPREAD:
12.35 6.37 6.60 6.38 7.4810.25 4.40 5.73 5.42 6.792.10 1.98 0.87 0.97 0.68
COMPOSITE:2000:BENCHMARK:SPREAD:
0.72 3.84 4.47 6.29(1.14) 3.54 3.85 5.951.86 0.30 0.62 0.34
COMPOSITE:1999:BENCHMARK:SPREAD:
7.05 6.40 8.228.44 6.44 8.42
(1.39) (0.05) (0.20)
COMPOSITE:1998:BENCHMARK:SPREAD:
5.75 8.804.48 8.411.27 0.39
COMPOSITE:1997:BENCHMARK:SPREAD:
11.9512.49(0.54)
COMPOSITE:1996:BENCHMARK:SPREAD:
41Annual Report 2005 - Additional Information
Real Estate DebtNotes to the Real Estate Debt composite :
1. Composite descriptionThis composite was previously named Mortgages and has been renamed Real Estate Debt on May 1st 2005. This composite groups the core of the Caisse's mortgage investments. Most of the investments are commercial and residential mortgages whose returns are related only to the contractual interest rate. This composite also includes mortgage bonds and commercial mortgage-backed securities (CMBS).
Mortgages are evaluated according to the following steps, at the end of each month:1) A weekly estimate of mortgage rates is done;2) An average spread with the Canadian bonds is calculated for the past five weeks;3) A spread differential is calculated by vocation and geographical region underlying the mortgage loans;4) These spreads are superimposed on the Canada bond yield curve.
Securities such as mortgage bonds and CMBS are priced according to quotations supplied by the security's market maker. The market maker is often the security's issuer who guarantees a secondary market.
A small portion (less than 1%) of the composite consists of real estate that has been recovered as a result of loans in default. This real estate is priced in the same manner as assets in the Real Estate composite, but it is not subject to external audit because it represents a relatively insignificant proportion of the composite. However, if this presence were to become significant, an external audit would be performed annually, in the same manner as for the assets in the Real Estate composite.
The composite uses derivatives to hedge currency risks and to match the composite's duration to that of the index, by means of swaps.
2. Composite creation dateThis composite was created on September 1st, 1998.
3. BenchmarkSince October 1st 2005, the benchmark for this composite is the combination of the Scotia Capital Universe Bond Index at 90% and the Lehman Brothers CMBS B hedged index at 10%. Between January 1st 1999 and September 30th 2005, the benchmark for this composite was the Scotia Capital Universe Bond Index exclusively. Prior to January 1999, the benchmark was the Scotia Capital 3-years Mortgage Market Index.
4. Calculation periodThe performance for this composite is calculated for the periods from January 1st, 1996, to December 31st, 2005.
Deloitte & Touche LLP has not audited the schedules for the periods presented from January 1st, 1996, to December 31st, 1997.
5. Date of conversion to specialized portfolioThe holdings in the Depositors' portfolios were transferred to a specialized portfolio on April 1st, 1995. Since that date, the composite has consisted solely of the specialized portfolio.
6. Operating expensesThe performance results are presented before operating expenses, but after transaction fees.
The operating expenses for this composite were 46 basis points for the year ended December 31st, 2005. For the four previous years, from January 1st, 2000, to December 31st, 2004, the fees averaged 40 basis points.
7. Investment universeThe benchmark consists of a universe of Canadian securities. But the mortgage investment activities are carried out mainly in Canada and the United States.
42Annual Report 2005 - Additional Information

Real EstateReturns for years or periods ended December 31st :
Returns for periods ended December 31st, 2005 :
Period Composite Benchmark Spread
Net Assets Under Management (in thousands) for years ended December 31st :
Net Assets Under Management
% of Firm AssetsComposite
Number of Accounts
Std. Dev. of acct. returnsYear
1 month -4.06 %13.59 %9.53 %3 months 11.82 %13.59 %25.41 %6 months 12.38 %19.80 %32.18 %Year to date 7.62 %31.00 %38.62 %
2005 10 813 364 $ 121 925 703 $ 8.87 % 1 n/a2004 7 796 077 $ 102 393 353 $ 7.61 % 1 n/a2003 7 716 944 $ 89 336 739 $ 8.64 % 1 n/a2002 7 992 610 $ 77 501 607 $ 10.31 % 1 n/a2001 7 553 445 $ 85 130 677 $ 8.87 % 1 n/a2000 5 889 133 $ 88 164 426 $ 6.68 % 1 n/a1999 4 239 814 $ 81 394 472 $ 5.21 % 1 n/a1998 3 518 198 $ 68 535 968 $ 5.13 % 1 n/a1997 3 220 750 $ 64 421 766 $ 5.00 % 1 n/a1996 2 489 070 $ 57 255 747 $ 4.35 % 1 n/a
Simple and Compound Annual Returns as at December 31st (per cent) :
1 YEAR 2 YEARS 3 YEARS 4 YEARS 5 YEARS 6 YEARS 7 YEARS 8 YEARS 9 YEARS 10 YEARS
38.62 33.90 27.46 22.30 20.57 20.18 19.36 18.11 18.36 17.7331.00 25.03 19.99 16.61 15.53 15.34 14.24 14.20 14.59 13.937.62 8.87 7.47 5.69 5.03 4.85 5.13 3.91 3.78 3.80
COMPOSITE:2005:BENCHMARK:SPREAD:
29.34 22.22 17.30 16.43 16.80 16.42 15.44 16.05 15.6119.33 14.84 12.17 11.96 12.43 11.66 11.98 12.68 12.1810.01 7.38 5.13 4.47 4.36 4.76 3.46 3.36 3.44
COMPOSITE:2004:BENCHMARK:SPREAD:
15.49 11.70 12.43 13.86 14.00 13.27 14.26 14.0010.52 8.75 9.61 10.77 10.19 10.80 11.77 11.314.97 2.95 2.82 3.08 3.81 2.47 2.50 2.69
COMPOSITE:2003:BENCHMARK:SPREAD:
8.04 10.93 13.32 13.63 12.83 14.06 13.797.01 9.16 10.86 10.10 10.86 11.98 11.431.03 1.77 2.46 3.53 1.98 2.08 2.36
COMPOSITE:2002:BENCHMARK:SPREAD:
13.88 16.06 15.56 14.06 15.30 14.7811.34 12.84 11.15 11.84 12.99 12.182.55 3.22 4.40 2.23 2.31 2.60
COMPOSITE:2001:BENCHMARK:SPREAD:
18.27 16.40 14.12 15.66 14.9614.35 11.06 12.01 13.41 12.353.92 5.34 2.12 2.25 2.61
COMPOSITE:2000:BENCHMARK:SPREAD:
14.56 12.11 14.80 14.147.86 10.85 13.10 11.856.70 1.26 1.70 2.29
COMPOSITE:1999:BENCHMARK:SPREAD:
9.70 14.92 14.0013.92 15.81 13.21(4.22) (0.89) 0.79
COMPOSITE:1998:BENCHMARK:SPREAD:
20.39 16.2217.74 12.862.65 3.36
COMPOSITE:1997:BENCHMARK:SPREAD:
12.198.194.00
COMPOSITE:1996:BENCHMARK:SPREAD:
43Annual Report 2005 - Additional Information

Real Estate
Notes to the Real Estate composite :
1. Composite descriptionThis composite groups the core of the Caisse's real estate investments. More than 90% of the composite are direct investments. The remainder of the investments includes mortgages, equities and convertible securities, mainly related to real estate assets.
All current income is reinvested in the Real Estate composite. Fitting-up costs and other leasehold improvements are depreciated during the term of the lease.
Real estate investments are priced annually. These valuations are verified by an external auditor. Therefore, all returns are based on audited results. These performances also include returns on cash assets.
Leverage in this composite is maintained at about the maximum permitted, which is 50%.
2. Composite creation dateThis composite was created on September 1st, 1998.
3. BenchmarkSince January 1993, the benchmark for this composite has been the MLH+A (renamed Aon) Index. Until December 31st 2002, this index consisted of the Russell Canada Index, the Russell Quebec Sub-index and the TSE Real Estate Sub-index, including leverage. Since January 1st, 2003, the index comprised the IPD Canadian Property Index in a proportion of 70% and the NCREIF Hedged Index in a proportion of 30%, less a proportion of the Scotia Capital Short Term All Corporate Index to reflect the leverage.
It is important to note that the managers have an annualized minimum absolute-return objective that includes a forecast long-term return of 9%. The managers are evaluated according to this objective. For return follow-up and comparison, the long-term comparison index is calculated over a period of five years to correspond to the managers' investment horizons.
4. Calculation periodThe performance for this composite is calculated for the periods from January 1st, 1996, to December 31st, 2005.
Deloitte & Touche LLP has not audited the schedules for the periods presented from January 1st, 1996, to December 31st, 1997.
Other Returns Presented as at December 31st (per cent) :
Current Income Capital Appreciation (Depreciation)
Total Return
2005 5.95 30.84 38.622004 6.71 21.21 29.342003 8.16 6.77 15.492002 9.53 (1.35) 8.042001 8.72 4.75 13.882000 9.30 8.21 18.271999 10.00 4.15 14.561998 7.93 1.64 9.701997 6.75 12.78 20.391996 9.69 2.28 12.19
44Annual Report 2005 - Additional Information

5. Date of conversion to specialized portfolioThe holdings in the Depositors' portfolios were transferred to a specialized portfolio on October 1st, 1985. Since that date, the composite has consisted solely of the specialized portfolio.
6. Operating expensesThe performance results are presented before operating expenses, but after transaction fees.
The accounting for fees for this composite has been modified. Starting January 1st, 2003, operating expenses incurred directly by the real estate subsidiaries are charged against income from real estate holdings. Operating expenses incurred by the Caisse for the management of the real estate portfolio represent the operating expenses of the composite. This represents the method used by the industry.
The operating expenses for this composite were 12 basis points for the year ended December 31st, 2005. For the four previous years, from January 1st, 2000, to December 31st, 2004, the fees averaged 58 basis points.
7. Use of derivativesThis composite uses derivatives in the normal course of investment management. Derivatives are used mainly to reduce exposure, to hedge and to take positions.
8. Investment valuationEach year, a third of the real estate portfolio is evaluated by an external real estate appraiser. For the remainder of the portfolio, appraisals are updated. Individual appraisals are made of certain properties when market conditions change significantly or when a transaction is planned. Fair value for equities and convertible investments, including securities of closely held companies, is established according to commonly used valuation methods.
9. Other returns presentedThe returns for the Real Estate composite are calculated according to two components, capital appreciation or depreciation, and current operating income. The total return is the geometric sum of both components.
45Annual Report 2005 - Additional Information

Hedge FundsReturns for years or periods ended December 31st :
Returns for periods ended December 31st, 2005 :
Period Composite Benchmark Spread
Net Assets Under Management (in thousands) for years ended December 31st :
Net Assets Under Management
% of Firm AssetsComposite
Number of Accounts
Std. Dev. of acct. returnsYear
1 month 1.17 %0.50 %1.67 %3 months 2.74 %0.22 %2.96 %6 months 4.01 %2.19 %6.20 %Year to date 6.89 %2.01 %8.90 %
2005 3 909 188 $ 121 925 703 $ 3.21 % 1 n/a2004 2 800 298 $ 102 393 353 $ 2.73 % 1 n/a2003 953 501 $ 89 336 739 $ 1.07 % 1 n/a
Simple and Compound Annual Returns as at December 31st (per cent) :
1 YEAR 2 YEARS 3 YEARS 4 YEARS 5 YEARS 6 YEARS 7 YEARS 8 YEARS 9 YEARS 10 YEARS
8.90 6.762.01 2.166.89 4.61
COMPOSITE:2005:BENCHMARK:SPREAD:
4.672.302.37
COMPOSITE:2004:BENCHMARK:SPREAD:
46Annual Report 2005 - Additional Information

Hedge FundsNotes to the Hedge Funds composite :
1. Composite descriptionThis composite was previously named Hedge Fund Partenrship Units and has been renamed Hedge Funds on April 1st 2005. This composite groups the Caisse’s hedge fund activities. The goal of this activity is to derive value added from investments in fund of hedge funds with a low correlation to returns on traditional assets. Since June 1st, 2004, some absolute return strategies were grouped into this composite as overlay activities. They consist of Currencies, arbitrage by Relative value of fixed income, and Global macro type funds.
There is no long-term leverage in the funds of funds. However, to take advantage of opportunities and quickly direct funds to managers, the maximum authorized leverage is 10% of the net assets of the composite, and may not last more than six months.
2. Composite creation dateThis composite was created on October 1st, 2003.
3. BenchmarkThe benchmark for this composite is the S&P Hedge Fund Index. Before January 2005, the benchmark for this composite was the Scotia Capital 91-days T-bill.
It is important to note that the managers have a minimum absolute-return objective of 6% over the Scotia Capital 91-days T-bill over 3 years and after operating expenses. The managers are evaluated according to this objective.
4. Calculation periodPerformance for this composite is calculated since its inception date, April 1st, 2003, to December 31st, 2005.
Deloitte & Touche LLP has audited the schedules since inception date, to December 31st, 2004.
5. Date of conversion to specialized portfolioThe holdings in the Depositors' portfolios were transferred to a specialized portfolio on April 1st, 2003. Since that date, the composite has consisted solely of the specialized portfolio.
6. Operating expensesThe performance results are presented before operating expenses, but after transaction fees.
The operating expenses for this composite were 101 basis points for the year ended December 31st, 2005. Since inception of the composite, from April 1st, 2003, to December 31st, 2004, the fees averaged 78 basis points.
47Annual Report 2005 - Additional Information

CommoditesReturns for years or periods ended December 31st :
Returns for periods ended December 31st, 2005 :
Period Composite Benchmark Spread
Net Assets Under Management (in thousands) for years ended December 31st :
Net Assets Under Management
% of Firm AssetsComposite
Number of Accounts
Std. Dev. of acct. returnsYear
1 month 0.58 %3.28 %3.87 %3 months 0.74 %-3.46 %-2.71 %6 months -0.03 %7.28 %7.26 %Year to date -0.20 %16.96 %16.76 %
2005 1 566 372 $ 121 925 703 $ 1.28 % 1 n/a2004 1 012 133 $ 102 393 353 $ 0.99 % 1 n/a
Simple and Compound Annual Returns as at December 31st (per cent) :
1 YEAR 2 YEARS 3 YEARS 4 YEARS 5 YEARS 6 YEARS 7 YEARS 8 YEARS 9 YEARS 10 YEARS
16.7616.96(0.20)
COMPOSITE:2005:BENCHMARK:SPREAD:
48Annual Report 2005 - Additional Information
CommoditesNotes to the Commodites composite :
1. Composite descriptionThis composite groups the investment activities on financial instruments on commodities. The strategy used can be divided into three components:1) Index management: derivatives are used to reproduce commodity index returns;2) Active management of derivatives: mainly through intra-sectorial relative value strategies based on fundamental and technical analyses;3) Underlying asset management: 80% of the nominal value is invested in US government 1-10 years , and remaining 20% is invested in US money market instruments.
2. Composite creation dateThis composite was created on October 1st, 2004.
3. BenchmarkThe benchmark for this composite is the Derivative Commodity Instruments Index, created by the Caisse. It has two components: the return on cash assets and the return on commodity financial instruments. The total of both returns represents the index return.
The cash assets return has two components: 80% consist of the Barclays US Government Inflation-Linked Bond 1-10 Years Total Return Index, and 20% of the Merrill Lynch 3-month US Treasury Bill index. These proportions are rebalanced on a monthly basis.
The benchmark for the commodity financial instruments is the Dow Jones-AIG Commodity Excess Return Index, unhedged.
4. Calculation periodPerformance for this composite is calculated since its inception date, August 1st, 2004, to December 31st, 2005.
Deloitte & Touche LLP has audited the schedules since inception date, to December 31st, 2004.
5. Operating expensesThe performance results are presented before operating expenses, but after transaction fees.
The operating expenses for this composite were 30 basis points since its inception, from August 1st, 2004, to December 31st, 2005.
6. Investment universeThe benchmark consists of U.S. securities (the underlying assets) and of commodity financial instruments. The composite invests in the same underlying assets as well as in commodity financial instruments.
7. Use of derivativesAs stated in the composite description, management of commodity financial instruments and indexed management are performed by using derivative instruments.
49Annual Report 2005 - Additional Information

Balanced FundReturns for years or periods ended December 31st :
Returns for periods ended December 31st, 2005 :
Period Composite Benchmark Spread
Net Assets Under Management (in thousands) for years ended December 31st :
Net Assets Under Management
% of Firm AssetsComposite
Number of Accounts
Std. Dev. of acct. returnsYear
1 month -0.21 %2.80 %2.59 %3 months 1.22 %3.08 %4.30 %6 months 1.29 %6.94 %8.23 %Year to date 1.78 %12.88 %14.65 %
2005 121 925 703 $ 121 925 703 $ 100.00 % 24 5.27 %2004 102 393 353 $ 102 393 353 $ 100.00 % 22 1.85 %2003 89 336 739 $ 89 336 739 $ 100.00 % 22 2.33 %2002 77 501 607 $ 77 501 607 $ 100.00 % 18 4.34 %2001 85 130 677 $ 85 130 677 $ 100.00 % 16 3.50 %2000 88 164 426 $ 88 164 426 $ 100.00 % 16 1.02 %1999 81 394 472 $ 81 394 472 $ 100.00 % 15 2.16 %1998 68 535 968 $ 68 535 968 $ 100.00 % 16 0.34 %1997 64 421 766 $ 64 421 766 $ 100.00 % 16 0.74 %1996 57 255 747 $ 57 255 747 $ 100.00 % 16 0.83 %
Simple and Compound Annual Returns as at December 31st (per cent) :
1 YEAR 2 YEARS 3 YEARS 4 YEARS 5 YEARS 6 YEARS 7 YEARS 8 YEARS 9 YEARS 10 YEARS
14.65 13.42 14.02 7.60 4.96 5.17 6.71 7.15 7.78 8.5312.88 12.03 13.06 8.05 6.07 6.00 7.12 7.22 7.76 8.571.78 1.39 0.96 (0.45) (1.11) (0.83) (0.41) (0.07) 0.01 (0.04)
COMPOSITE:2005:BENCHMARK:SPREAD:
12.20 13.70 5.35 2.66 3.37 5.44 6.12 6.95 7.8711.20 13.16 6.49 4.43 4.67 6.19 6.44 7.14 8.111.00 0.55 (1.14) (1.77) (1.30) (0.75) (0.32) (0.19) (0.23)
COMPOSITE:2004:BENCHMARK:SPREAD:
15.23 2.08 (0.33) 1.27 4.14 5.14 6.22 7.3415.15 4.21 2.27 3.10 5.22 5.67 6.57 7.730.08 (2.13) (2.60) (1.83) (1.07) (0.53) (0.36) (0.38)
COMPOSITE:2003:BENCHMARK:SPREAD:
(9.57) (7.31) (3.00) 1.54 3.23 4.79 6.26(5.69) (3.62) (0.63) 2.87 3.86 5.21 6.71(3.88) (3.69) (2.37) (1.33) (0.64) (0.42) (0.44)
COMPOSITE:2002:BENCHMARK:SPREAD:
(4.99) 0.46 5.54 6.70 7.92 9.16(1.51) 2.00 5.89 6.40 7.54 8.92(3.49) (1.54) (0.35) 0.30 0.38 0.23
COMPOSITE:2001:BENCHMARK:SPREAD:
6.23 11.24 10.91 11.41 12.235.64 9.79 9.17 9.92 11.140.60 1.44 1.73 1.49 1.09
COMPOSITE:2000:BENCHMARK:SPREAD:
16.48 13.32 13.20 13.7814.12 10.99 11.39 12.562.36 2.33 1.81 1.22
COMPOSITE:1999:BENCHMARK:SPREAD:
10.24 11.59 12.907.95 10.05 12.042.30 1.54 0.85
COMPOSITE:1998:BENCHMARK:SPREAD:
12.95 14.2512.20 14.150.76 0.10
COMPOSITE:1997:BENCHMARK:SPREAD:
15.5616.14(0.58)
COMPOSITE:1996:BENCHMARK:SPREAD:
50Annual Report 2005 - Additional Information

Balanced FundNotes to the Balanced Fund composite :
1. Composite descriptionThis composite groups all Depositors' accounts, including the General Fund. It measures the Caisse's overall asset allocation strategy among the various asset classes available to depositors.
A portion of the composite represents an overlay activity.
2. Composite creation dateThis composite was created on October 1st, 2002.
3. BenchmarkThe benchmark for this composite is an index created by the Caisse. It comprises a weighted average of the depositors' benchmark indexes. These indexes correspond to the weighted average of each investment class, as specified in the reference policy of each depositor. This reference policy is established once a month, in accordance with depositor's preferences and needs, as well as market forecasts.
4. Calculation periodThe performance for this composite is calculated for the periods from January 1st, 1996, to December 31st, 2005.
Deloitte & Touche LLP has not audited the schedules for the periods presented from January 1st, 1996, to December 31st, 1997.
5. Operating expensesThe performance results are presented before operating expenses, but after transaction fees.
The operating expenses for this composite were 27 basis points for the year ended December 31st, 2005. For the four previous years, from January 1st, 2000, to December 31st, 2004, the fees averaged 29 basis points.
51Annual Report 2005 - Additional Information

I I . F inancia l s ta t is t ics and rev iew
1. Returns on Special ized Portfol ios by Market Indexes
or recognized Indexes .. . . . . . . . . . . . . . . . . . . . . . . . . . . . . . . . . . . . . . . . . . . . . . . . . . . . . . . . . . . . . . . . . . . . . . . . . . 55
2. Changes in depositors’ holdings . . . . . . . . . . . . . . . . . . . . . . . . . . . . . . . . . . . . . . . . . . . . . . . . . . . . . . . . . . . . 56
3. Breakdown of depositors’ holdings . . . . . . . . . . . . . . . . . . . . . . . . . . . . . . . . . . . . . . . . . . . . . . . . . . . . . . . . . 60
4. Annual interest or income paid out on average deposits . . . . . . . . . . . . . . . . . . . . . . . . . . . 61
5. Summary of investments .. . . . . . . . . . . . . . . . . . . . . . . . . . . . . . . . . . . . . . . . . . . . . . . . . . . . . . . . . . . . . . . . . . . . . . . 62
6. Breakdown of investments . . . . . . . . . . . . . . . . . . . . . . . . . . . . . . . . . . . . . . . . . . . . . . . . . . . . . . . . . . . . . . . . . . . . 63
7. Real Estate Group – Mortgages of $5 mil l ion and over . . . . . . . . . . . . . . . . . . . . . . . . . . . . . 65
8. Investments in shares and bonds of publ ic ly traded companies .. . . . . . . . . . . . . . . . . 70
9. Investments in shares and bonds of pr ivately held companies .. . . . . . . . . . . . . . . . 172
10. Statement of real estate holdings .. . . . . . . . . . . . . . . . . . . . . . . . . . . . . . . . . . . . . . . . . . . . . . . . . . . . . . . . 188
11. Statement of propert ies held for resale .. . . . . . . . . . . . . . . . . . . . . . . . . . . . . . . . . . . . . . . . . . . . . . . . 190


RETURNS ON SPECIALIZED PORTFOLIOS BY MARKET INDEXES OR RECOGNIZED INDEXES for periods ended December 31, 2005
Specialized Portfolio Net Assets
(in percentage unless otherwise indicated) (in $ Millions)Return Index Spread
b.p.Return Index Spread
b.p.Return Index Spread
b.p.
Fixed Income InvestmentsShort Term investments 4,058 2.9 2.6 37 2.9 2.6 27 3.3 3.0 31 SC 91 - Day Canadian T-BillReal Return Bonds 1,249 15.1 15.2 -13 n.a. n.a. n.a. n.a. n.a. n.a. SC Real Return Bonds IndexBonds 1 36,187 6.5 6.5 3 7.2 6.8 41 8.0 7.4 57 SC Universe BondsLong Term Bonds 1,937 n.a. n.a. n.a. n.a. n.a. n.a. n.a. n.a. n.a. SC Long Term Government Bonds 2
Variable Income InvestmentsCanadian Equity 1 17,464 21.0 24.1 -313 21.1 21.7 -59 3.5 7.6 -412 S&P/TSX capped 3
U.S. Equity (hedged) 1 1,674 5.3 4.1 119 13.9 14.9 -104 -0.1 0.7 -78 S&P 500 hedged 4
U.S. Equity (unhedged) 1 5,199 3.4 2.3 115 2.3 3.4 -114 -5.2 -4.4 -83 S&P 500 unhedged 4
Foreign Equity (hedged) 1 2,463 28.1 28.4 -28 19.3 20.7 -142 0.4 1.4 -95 MSCI – EAFE hedgedForeign Equity (unhedged) 1 5,801 10.4 10.7 -27 10.4 11.8 -147 -1.7 -0.6 -116 MSCI – EAFE unhedgedEmerging Markets Equity 1 1,281 30.5 30.6 -16 25.5 24.7 85 9.5 13.3 -378 MSCI – EM 5
Québec International 10,872 19.4 19.1 27 22.1 22.1 3 5.2 5.1 11 Québec International 6
Other InvestmentsInvestments and Infrastructures 4,713 12.3 18.6 -623 n.a. n.a. n.a. n.a. n.a. n.a. S&P/TSX adjusted 7
Private Equity 6,219 29.8 0.7 2,915 n.a. n.a. n.a. n.a. n.a. n.a. S&P 600 adjusted 8
Real Estate Debt 6,390 10.9 6.5 443 10.8 6.8 403 10.6 7.4 320 Real Estate Debt 9
Real Estate 10,813 38.6 31.0 762 27.5 20.0 747 20.6 15.5 503 Aon - Real Estate 10
Hedge Funds 3,909 8.9 2.0 689 n.a. n.a. n.a. n.a. n.a. n.a. SC 91 - Day Canadian T-BillCommodities 11 1,566 16.8 17.0 -20 n.a. n.a. n.a. n.a. n.a. n.a. Commodity Financial InstrumentsAsset Allocation ($ Millions) 158 9 n.a. n.a. 62 n.a. n.a. -823 n.a. n.a. n.a. 11
Weighted average return on depositors' funds 121,926 13 14.7 12.9 178 14.0 13.1 96 5.0 6.1 -111Overall index (Caisse's Benchmark Portfolio) 12
1
2
3
4
5
6
7
8
9
10
11
12
13
Index created by the Caisse. Weighted average of the depositors’ benchmark indexes.
Between April 2005, when the portfolio was created, and August 2005, the index used by the Caisse consisted of SC long-term federal bonds and SC long-term government bonds. In April, the two indexes were weighted equally. As a result of 10% monthly adjustments, the weighting of SC long-term government bonds was raised to 100% in September.
The S&P/TSX Composite (total return) weighted according to stock market capitalization is used and includes only the following sectors; materials, consumer staples, consumer discretionary, financials, utilities and industrials. The S&P 600 Composite (total return) hedged against foreign exchange risk and adjusted to sectors is used and includes only the following sectors: consumer staples, consumer discretionary, healthcare, information technology, telecommunications and industrials.
Since January 2003, the composite has been formed as follows: [(70% IPD Canada + 30% NCREIF American hedged) * (1 + debt/equity)] – [(debt/equity) * Scotia Short-term All Corporate Index]. The debt/equity ratiof the index is 40/60.
Does not take into account the withholding tax applicable to foreigners not covered by a double taxation agreement.
Index created by the Caisse: 80% SC Provincial Québec, 20% SC 91-Day T-Bills, plus a futures index based on a basket of global equity indexes.
Previously Mortgages. Since October 2005, the Caisse has used an in-house index consisting of 90% SC Universe Bond and 10% Lehman Brothers CMBS B hedged.
The difference between depositors' holdings (net assets) totalling $122,159 million and the net assets of the depositors’ funds totalling $121,926 million represents mainly balances on depositors’ demand deposits and term deposits of about $233 million. Moreover, the difference between the net assets of the depositors’ funds and the sum of the net assets of all the specialized portfolios represents the Caisse's treasury operations.
Portfolio reorganized in 2003 and 2004. The operations were previously included in the Diversified, Strategic and Tactical Investments portfolio. The return is based on those operations, including cash decisions. The objective of the specialized Asset Allocation portfolio is to improve the overall return. Its results are evaluated in absolute and dollar terms. The results are annualized for periods greater than one year.
3 years
Over periods of three and five years, these returns take into account the fact that private equity was included in the specialized Bond portfolio and the specialized variable income portfolios (with the exception of Québec international) in the first half of 2003.
Before January 2000, the index was hedged against the risks of U.S. dollar fluctuations. The hedging was gradually reduced to zero from January 1 to June 30, 2000.
1 year 5 years Market Index or Recognized Index
Before November 2000, the benchmark index was the TSE 300 (uncapped). Between November 2000 and January 2001, that index was replaced by the TSE 300 capped. The index for this period is a combination of both indexes. In May 2002, the S&P/TSX capped replaced the TSE 300 capped.
1
55

CHANGES IN DEPOSITORS' HOLDINGS as at December 31, 2005 (fair value - in millions of dollars)
2005 2004 2003 2002 2001 2000 1999 1998 1997 1996Commission administrative des régimes de
retraite et d'assurances
Government and public employees retirement planNet income allocated1 2,308 1,594 961 1,258 1,844 3,073 1,694 1,577 1,233 1,863 Deposits (withdrawals) (92) (145) (145) (157) (103) (85) 190 469 343 444 Unrealized +/- in value 2,344 1,916 3,013 (3,911) (3,401) (1,069) 2,280 727 1,378 831
Holdings 38,922 34,362 30,997 27,168 29,978 31,638 29,719 25,555 22,782 19,828 Advances - (14) - - (6) - - - - -
Net holdings 38,922 34,348 30,997 27,168 29,972 31,638 29,719 25,555 22,782 19,828 Excess over costs 5,687 3,343 1,427 (1,586) 2,325 5,726 6,795 4,515 3,788 2,410
Pension plan for managementNet income allocated1 374 249 98 189 273 469 322 268 205 315 Deposits (withdrawals) 102 13 85 97 1 47 (195) (37) (14) 42 Unrealized +/- in value 416 328 542 (636) (530) (170) 290 104 222 140
Holdings 6,421 5,529 4,939 4,214 4,564 4,820 4,474 4,057 3,722 3,309 Advances (6) - (13) (11) (9) - - - - -
Net holdings 6,415 5,529 4,926 4,203 4,555 4,820 4,474 4,057 3,722 3,309 Excess over costs 989 573 245 (297) 339 869 1,039 749 645 423
Individual plansNet income allocated1 13 9 5 7 9 20 12 11 8 13 Deposits (withdrawals) (4) (4) (4) (3) (2) (8) (3) (2) (2) (1)Unrealized +/- in value 16 13 18 (25) (19) (5) 12 4 7 5
Net holdings 226 201 183 164 185 197 190 169 156 143 Excess over costs 33 17 4 (14) 11 30 35 23 19 12
Pension plan of elected municipal officersNet income allocated1 8 5 3 4 15 24 12 10 9 13 Deposits (withdrawals) - 3 (5) (85) - - (1) - - 1 Unrealized +/- in value 10 9 11 (15) (28) (10) 16 5 8 6
Net holdings 144 126 109 100 196 209 195 168 153 136 Excess over costs 23 13 4 (7) 8 36 46 30 25 17
TOTALNet income allocated1 2,703 1,857 1,067 1,458 2,141 3,586 2,040 1,866 1,455 2,204 Deposits (withdrawals) 6 (133) (69) (148) (104) (46) (9) 430 327 486 Unrealized +/- in value 2,786 2,266 3,584 (4,587) (3,978) (1,254) 2,598 840 1,615 982
Holdings 45,713 40,218 36,228 31,646 34,923 36,864 34,578 29,949 26,813 23,416 Advances (6) (14) (13) (11) (15) - - - - -
Net holdings 45,707 40,204 36,215 31,635 34,908 36,864 34,578 29,949 26,813 23,416 Excess over costs 6,732 3,946 1,680 (1,904) 2,683 6,661 7,915 5,317 4,477 2,862
2
56

CHANGES IN DEPOSITORS' HOLDINGS (continued) as at December 31, 2005 (fair value - in millions of dollars)
2005 2004 2003 2002 2001 2000 1999 1998 1997 1996Régie des rentes du QuébecFonds du Régime de rentes du Québec
Net income allocated1 1,538 851 483 710 1,001 2,090 1,479 1,294 1,096 1,710 Deposits (withdrawals) 948 1,185 230 372 183 (223) (792) (1,548) (1,680) (1,775)Unrealized +/- in value 2,096 1,657 2,119 (2,603) (1,933) (1,079) 1,093 247 761 364
Holdings 27,436 22,854 19,161 16,329 17,850 18,599 17,811 16,031 16,038 15,861 Advances (463) (433) (407) (570) (510) (525) (332) (200) (200) (200)
Net holdings 26,973 22,421 18,754 15,759 17,340 18,074 17,479 15,831 15,838 15,661 Excess over costs 4,281 2,185 528 (1,591) 1,012 2,945 4,024 2,931 2,684 1,923
Fonds d'amortissement des régimes de retraiteNet income allocated1 810 359 157 338 287 1,074 163 89 66 98 Deposits (withdrawals) 3,597 1,807 800 1,400 2,362 2,080 2,756 - - - Unrealized +/- in value 1,467 1,066 1,286 (1,230) (670) (726) 317 38 78 51
Net holdings 20,859 14,985 11,753 9,510 9,002 7,023 4,595 1,359 1,232 1,088 Excess over costs 1,715 248 (818) (2,104) (874) (204) 522 205 167 89
Commission de la construction du QuébecSupplemental pension plan for employees of the
Québec construction industryNet income allocated1 726 372 176 278 379 752 609 533 382 555 Deposits (withdrawals) 122 16 (181) 10 (142) (66) (117) (127) (133) (144)Unrealized +/- in value 497 520 773 (1,051) (829) (329) 599 102 311 214
Holdings 9,750 8,405 7,497 6,729 7,492 8,084 7,727 6,636 6,128 5,568 Advances (5) - (30) (140) (30) (13) - - - -
Net holdings 9,745 8,405 7,467 6,589 7,462 8,071 7,727 6,636 6,128 5,568 Excess over costs 1,264 767 247 (526) 525 1,354 1,683 1,084 982 671
Commission de la santé et de la sécurité du travailFonds de la santé et de la sécurité du travail
Net income allocated1 555 306 95 237 404 817 523 489 364 527 Deposits (withdrawals) 68 (193) (411) (290) (502) 164 (341) (25) 648 5 Unrealized +/- in value 673 578 844 (1,318) (1,005) (434) 665 207 401 212
Holdings 9,224 7,928 7,237 6,709 8,080 9,183 8,636 7,789 7,118 5,705 Advances (337) (290) (355) (377) (194) (340) (101) (145) (235) -
Net holdings 8,887 7,638 6,882 6,332 7,886 8,843 8,535 7,644 6,883 5,705 Excess over costs 1,235 562 (16) (860) 458 1,463 1,897 1,232 1,025 624
Société de l'assurance automobile du QuébecFonds d'assurance automobile du Québec
Net income allocated1 426 384 186 276 403 733 391 426 356 571 Deposits (withdrawals) (427) (565) (190) (303) (240) (138) (228) (106) (211) (132)Unrealized +/- in value 727 497 663 (1,025) (858) (341) 721 176 341 130
Holdings 7,617 6,891 6,575 5,916 6,968 7,663 7,409 6,525 6,029 5,543 Advances (130) (147) (182) (59) (40) (32) (44) (87) - -
Net holdings 7,487 6,744 6,393 5,857 6,928 7,631 7,365 6,438 6,029 5,543 Excess over costs 1,561 834 337 (326) 699 1,557 1,898 1,177 1,001 660
2
57

CHANGES IN DEPOSITORS' HOLDINGS (continued) as at December 31, 2005 (fair value - in millions of dollars)
2005 2004 2003 2002 2001 2000 1999 1998 1997 1996Régime de rentes de survivants
Net income allocated1 20 9 (4) 13 20 42 30 24 11 - Deposits (withdrawals) (8) (11) (13) (15) (7) (7) (9) (5) 278 - Unrealized +/- in value 32 31 49 (48) (39) (22) 22 6 7 -
Net holdings 406 362 333 301 351 377 364 321 296 - Excess over costs 38 6 (25) (74) (26) 13 35 13 7 -
Autorité des marchés financiers2
Net income allocated1 14 13 11 13 13 12 6 9 4 7 Deposits (withdrawals) 29 12 9 - 34 21 11 24 16 (56)Unrealized +/- in value 2 3 3 2 4 4 (4) 2 1 (2)
Net holdings 388 343 315 292 277 226 189 176 141 120 Excess over costs 17 15 12 9 7 3 (1) 3 1 -
La Financière agricole du Québec3
Net income allocated1 12 6 1 (3) 8 8 7 8 4 2 Deposits (withdrawals) 9 19 10 (71) 84 14 (32) (61) 120 4 Unrealized +/- in value 15 13 12 (4) (7) (1) - 1 - 1
Net holdings 209 173 135 112 190 105 84 109 161 37 Excess over costs 31 16 3 (9) (5) 2 3 3 2 2
Régime complémentaire de rentes des techniciensambulanciers oeuvrant au Québec
Net income allocated1 10 8 5 6 7 10 5 5 4 5 Deposits (withdrawals) 6 7 8 8 7 5 6 7 6 6 Unrealized +/- in value 14 9 12 (13) (10) (1) 6 3 3 4
Net holdings 206 176 152 127 126 122 108 91 76 63 Excess over costs 30 16 7 (5) 8 18 19 13 10 7
Conseil de gestion de l'assurance parentale4
Net income allocated1 4 - - - - - - - - - Deposits (withdrawals) 195 - - - - - - - - - Unrealized +/- in value (1) - - - - - - - - -
Net holdings 198 - - - - - - - - - Excess over costs (1) - - - - - - - - -
Régime de retraite de l'Université du QuébecNet income allocated1 6 3 - - - - - - - - Deposits (withdrawals) 18 73 - - - - - - - - Unrealized +/- in value 22 10 - - - - - - - -
Net holdings 132 86 - - - - - - - - Excess over costs 32 10 - - - - - - - -
Office de la protection du consommateurFonds des cautionnements collectifs des agents de voyages
Net income allocated1 - - - - - 1 1 - 1 1 Deposits (withdrawals) 6 - - (2) - (1) - (1) - (1)Unrealized +/- in value - - 1 (1) (1) - - - - -
Net holdings 10 4 4 3 6 7 7 6 7 6 Excess over costs - - - (1) - 1 1 1 1 1
2
58

CHANGES IN DEPOSITORS' HOLDINGS (continued) as at December 31, 2005 (fair value - in millions of dollars)
2005 2004 2003 2002 2001 2000 1999 1998 1997 1996Régie des marchés agricoles et alimentaires du Québec
Fonds d'assurance-garantieNet income allocated1 - - - - - 1 - 1 - - Deposits (Withdrawals) - - - 1 - - - - - - Unrealized +/- in value - - 1 (1) (1) - - - - -
Net holdings 5 5 5 4 4 5 4 4 3 3 Excess over costs - (1) (1) (2) (1) - - - - -
Magazine Protégez-Vous 5
Net income allocated1 - - - - - - - - - - Deposits (withdrawals) - - (2) - - - - - - - Unrealized +/- in value - - - - - - - - - -
Net holdings - - - 2 2 2 2 2 2 2 Excess over costs - - - - - - - - - -
La Fédération des producteurs de bovins du QuébecNet income allocated1 1 - - - - - 1 - - - Deposits (withdrawals) - - 1 - (1) - - - - - Unrealized +/- in value - - - - - - - - - -
Net holdings 4 3 3 2 2 3 3 2 2 2 Excess Over Costs - - - - - - - - - -
Régime de retraite du personnel des centres de la petiteenfance et des garderies privées conventionnées au Québec4
Net income allocated1 - - - - - - - - - - Deposits (withdrawals) 2 - - - - - - - - - Unrealized +/- in value - - - - - - - - - -
Net holdings 2 - - - - - - - - - Excess over costs - - - - - - - - - -
Société des alcools du Québec6
Net income allocated1 - - - - - - - - - - Deposits (withdrawals) - - - - - (26) 26 - - - Unrealized +/- in value - - - - - - - - - -
Net holdings - - - - - - 26 - - - Excess over costs - - - - - - - - - -
Total DepositorsNet income allocated1 6,825 4,168 2,177 3,326 4,663 9,126 5,255 4,744 3,743 5,680 Deposits (withdrawals) 4,571 2,217 192 962 1,674 1,777 1,271 (1,412) (629) (1,607)Unrealized +/- in value 8,330 6,650 9,347 (11,879) (9,327) (4,183) 6,017 1,622 3,518 1,956
Holdings 122,159 102,433 89,398 77,682 85,273 88,263 81,543 69,000 64,046 57,414 Advances (941) (884) (987) (1,157) (789) (910) (477) (432) (435) (200)
Net holdings 121,218 101,549 88,411 76,525 84,484 87,353 81,066 68,568 63,611 57,214 Excess over costs 16,934 8,604 1,954 (7,393) 4,486 13,813 17,996 11,979 10,357 6,839
1 As of January 1, 1997, gains and losses on the sale of investments in the specialized portfolios are reinvested.2 Includes the Fonds d'assurance-dépôts.3 Fonds d'assurance-prêts agricoles et forestiers and Fonds d'assurance récolte.4 New depositor in 2005.5 As of 2003, this organization is no longer a depositor of the Caisse.6 These depositors only benefit from the Caisse's cash management services.
12
59

BREAKDOWN OF DEPOSITORS' HOLDINGS as at December 31, 2005 (fair value - in percentage)
2005 2004 2003 2002 2001 2000 1999 1998 1997 1996Government and public employees
retirement plan (CARRA - RREGOP) 31.9 33.6 34.7 35.0 35.2 35.8 36.5 37.0 35.6 34.5Fonds du Régime de rentes du Québec (RRQ) 22.5 22.3 21.4 21.0 20.9 21.1 21.8 23.2 25.0 27.6Fonds d'amortissement des régimes de retraite (FARR) 17.1 14.6 13.1 12.2 10.6 8.0 5.6 2.0 1.9 1.9Supplemental pension plan for employees of the 8.0 8.2 8.4 8.7 8.8 9.1 9.5 9.6 9.6 9.7
Québec construction industry (CCQ)Fonds de la santé et de la sécurité du travail (CSST) 7.6 7.7 8.1 8.6 9.5 10.4 10.6 11.3 11.1 10.0Fonds d'assurance automobile du Québec (SAAQ) 6.2 6.7 7.4 7.6 8.2 8.7 9.1 9.5 9.4 9.7Pension Plan for Management
(CARRA - PPM) 5.2 5.4 5.5 5.4 5.3 5.5 5.5 5.9 5.8 5.8Other depositors 1.5 1.5 1.4 1.5 1.5 1.4 1.4 1.5 1.6 0.8
100.0 100.0 100.0 100.0 100.0 100.0 100.0 100.0 100.0 100.0
23
60
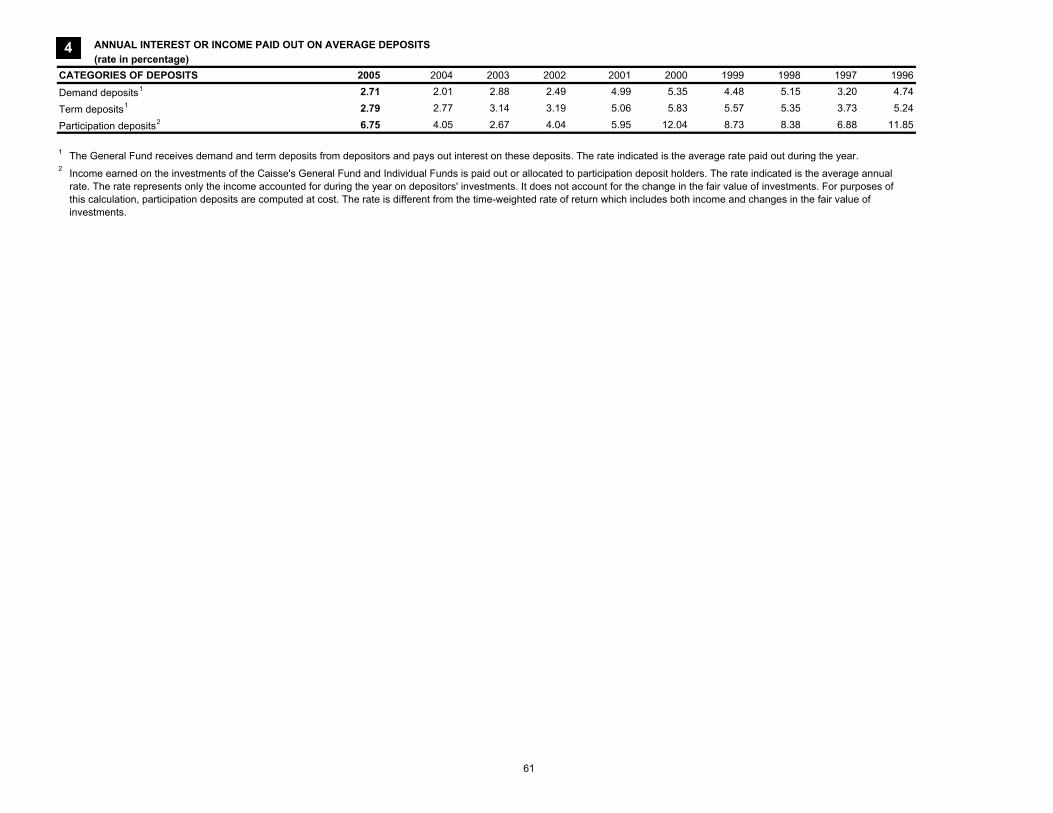
ANNUAL INTEREST OR INCOME PAID OUT ON AVERAGE DEPOSITS (rate in percentage)
CATEGORIES OF DEPOSITS 2005 2004 2003 2002 2001 2000 1999 1998 1997 1996
Demand deposits1 2.71 2.01 2.88 2.49 4.99 5.35 4.48 5.15 3.20 4.74
Term deposits1 2.79 2.77 3.14 3.19 5.06 5.83 5.57 5.35 3.73 5.24
Participation deposits2 6.75 4.05 2.67 4.04 5.95 12.04 8.73 8.38 6.88 11.85
1 The General Fund receives demand and term deposits from depositors and pays out interest on these deposits. The rate indicated is the average rate paid out during the year.2 Income earned on the investments of the Caisse's General Fund and Individual Funds is paid out or allocated to participation deposit holders. The rate indicated is the average annual
rate. The rate represents only the income accounted for during the year on depositors' investments. It does not account for the change in the fair value of investments. For purposes of this calculation, participation deposits are computed at cost. The rate is different from the time-weighted rate of return which includes both income and changes in the fair value of investments.
24
61
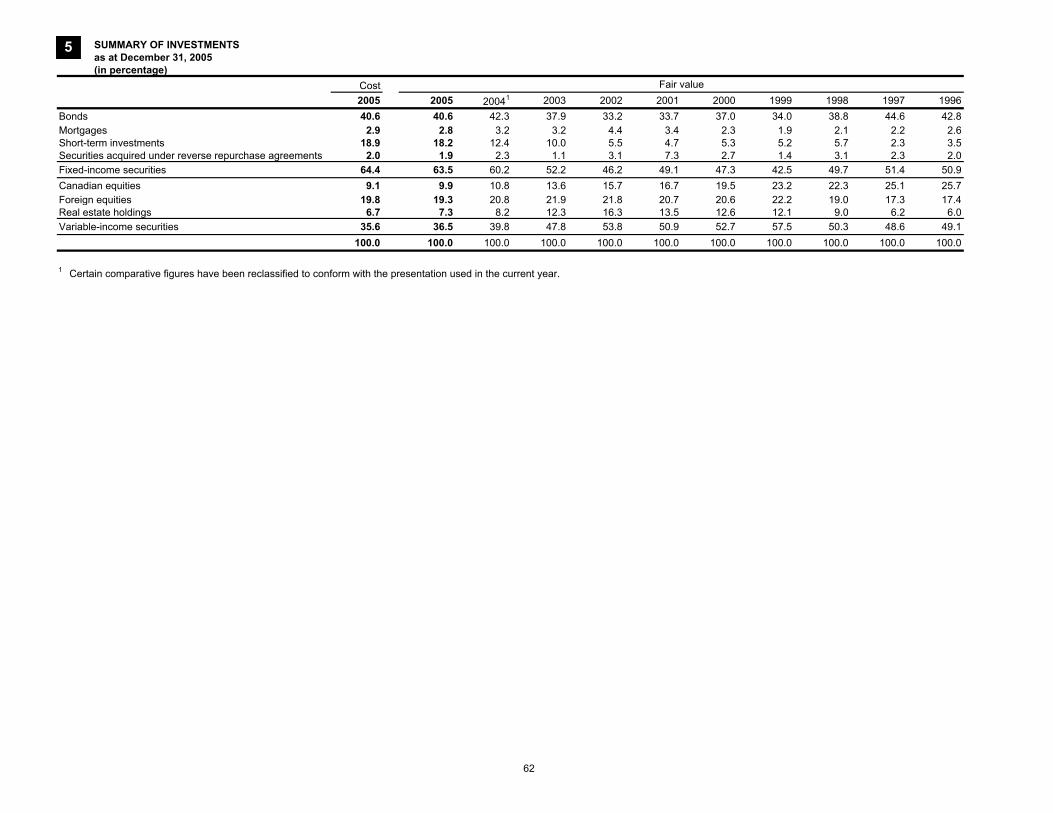
SUMMARY OF INVESTMENTS as at December 31, 2005 (in percentage)
Cost Fair value2005 2005 20041 2003 2002 2001 2000 1999 1998 1997 1996
Bonds 40.6 40.6 42.3 37.9 33.2 33.7 37.0 34.0 38.8 44.6 42.8Mortgages 2.9 2.8 3.2 3.2 4.4 3.4 2.3 1.9 2.1 2.2 2.6Short-term investments 18.9 18.2 12.4 10.0 5.5 4.7 5.3 5.2 5.7 2.3 3.5Securities acquired under reverse repurchase agreements 2.0 1.9 2.3 1.1 3.1 7.3 2.7 1.4 3.1 2.3 2.0Fixed-income securities 64.4 63.5 60.2 52.2 46.2 49.1 47.3 42.5 49.7 51.4 50.9Canadian equities 9.1 9.9 10.8 13.6 15.7 16.7 19.5 23.2 22.3 25.1 25.7Foreign equities 19.8 19.3 20.8 21.9 21.8 20.7 20.6 22.2 19.0 17.3 17.4Real estate holdings 6.7 7.3 8.2 12.3 16.3 13.5 12.6 12.1 9.0 6.2 6.0Variable-income securities 35.6 36.5 39.8 47.8 53.8 50.9 52.7 57.5 50.3 48.6 49.1
100.0 100.0 100.0 100.0 100.0 100.0 100.0 100.0 100.0 100.0 100.0
1 Certain comparative figures have been reclassified to conform with the presentation used in the current year.
55
62

BREAKDOWN OF INVESTMENTS as at December 31, 2005 (in millions of dollars)
Cost % INVESTMENTS1 2005 2005 20042 2003 2002 2001 2000 1999 1998 1997
BondsDomestic securities
Gouvernement du Québec 8,372 4.9 9,651 10,902 12,848 13,083 13,325 13,621 13,122 11,498 10,835 Government of Canada 26,146 15.4 26,999 21,523 14,136 7,650 8,911 12,867 7,386 4,454 9,498 Other governments 1,767 1.0 1,852 1,309 253 271 283 349 493 565 653 Guaranteed by gouvernement du Québec 3,383 2.0 4,177 4,377 4,708 4,563 4,316 4,166 4,489 4,732 5,306 Guaranteed by other governments 5,586 3.3 5,604 3,355 868 469 424 539 783 841 364 Guaranteed by grants 207 0.1 216 236 270 312 332 311 316 554 1,009 Municipalities and school boards 995 0.6 1,032 893 931 1,065 1,138 1,126 1,032 1,410 1,013 Corporate and mortgage bonds 9,741 5.7 9,891 5,627 5,467 4,038 3,772 2,733 2,158 2,014 1,244 Inflation-indexed securities 1,111 0.7 1,277 1,090 179 - - - - - - Hedge funds 430 0.3 447 235 - - - - - - -
57,738 34.0 61,146 49,547 39,660 31,451 32,501 35,712 29,779 26,068 29,922 Foreign securities
U.S. Government 1,886 1.1 1,807 3,675 1,518 633 3,023 1,643 1,349 3,958 715 Corporate and mortgage bonds 3,961 2.3 3,972 2,847 1,197 2,321 2,587 1,824 1,331 829 - Inflation-indexed securities 1,958 1.2 1,858 865 - - - - - - - Hedge funds 1,061 0.6 1,026 241 14 - - - - - - Others 2,268 1.4 1,990 2,157 931 204 1,098 1,398 1,072 942 365
11,134 6.6 10,653 9,785 3,660 3,158 6,708 4,865 3,752 5,729 1,080 68,872 40.6 71,799 59,332 43,320 34,609 39,209 40,577 33,531 31,797 31,002
Equities and convertible securities3
Domestic securitiesEnergy 1,304 0.8 2,194 1,357 1,001 1,510 - - - - - Materials 2,281 1.3 2,544 2,622 3,375 3,003 - - - - - Industrials 727 0.4 1,249 1,319 1,395 1,283 - - - - - Consumer discretionary 4,606 2.7 3,029 2,518 2,275 1,768 - - - - - Consumer staples 718 0.4 886 1,060 820 719 - - - - - Health Care 419 0.2 316 422 430 547 - - - - - Financials 2,720 1.6 4,026 3,572 3,623 4,152 - - - - - Information Technology 990 0.6 942 1,321 1,284 1,187 - - - - - Telecommunication Services 353 0.2 506 529 391 913 - - - - - Utilities 775 0.5 816 101 370 305 - - - - - Mutual Funds 697 0.4 983 750 165 1 - - - - - Index participation units and others - - - - 499 756 - - - - -
15,590 9.1 17,491 15,571 15,628 16,144 19,534 21,400 22,829 18,266 17,476
Fair value
6
63
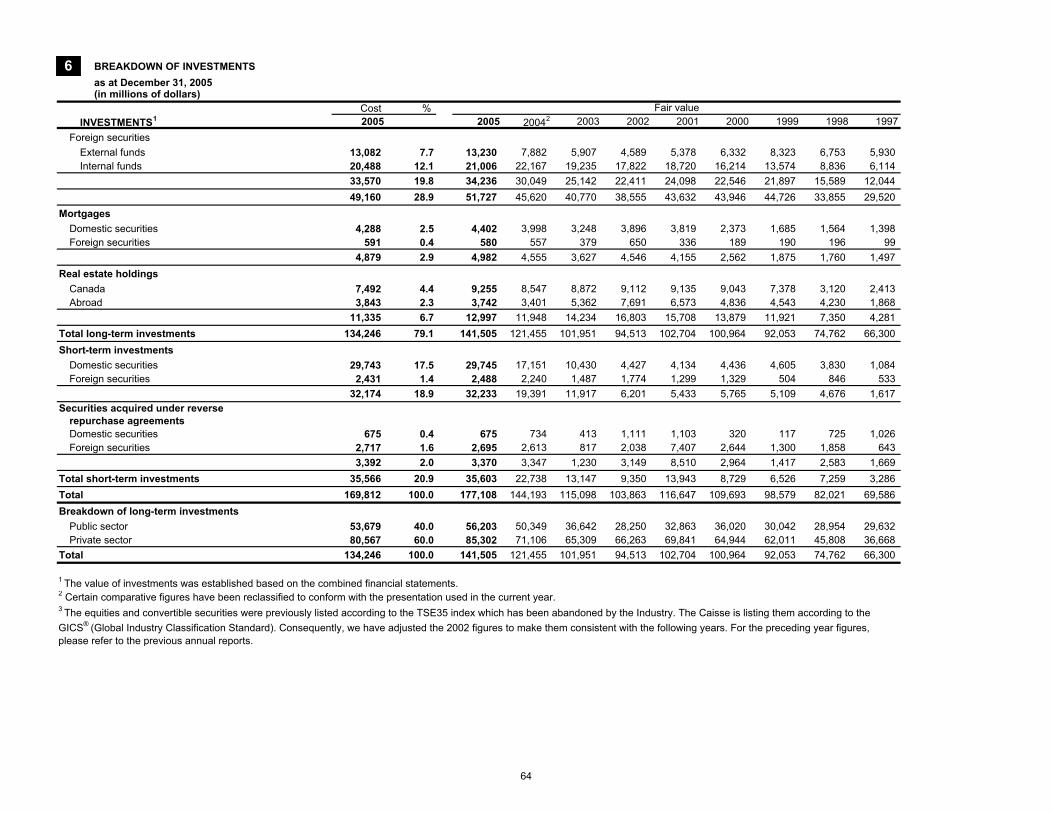
BREAKDOWN OF INVESTMENTS as at December 31, 2005 (in millions of dollars)
Cost % INVESTMENTS1 2005 2005 20042 2003 2002 2001 2000 1999 1998 1997
Fair value
6
Foreign securitiesExternal funds 13,082 7.7 13,230 7,882 5,907 4,589 5,378 6,332 8,323 6,753 5,930 Internal funds 20,488 12.1 21,006 22,167 19,235 17,822 18,720 16,214 13,574 8,836 6,114
33,570 19.8 34,236 30,049 25,142 22,411 24,098 22,546 21,897 15,589 12,044 49,160 28.9 51,727 45,620 40,770 38,555 43,632 43,946 44,726 33,855 29,520
MortgagesDomestic securities 4,288 2.5 4,402 3,998 3,248 3,896 3,819 2,373 1,685 1,564 1,398 Foreign securities 591 0.4 580 557 379 650 336 189 190 196 99
4,879 2.9 4,982 4,555 3,627 4,546 4,155 2,562 1,875 1,760 1,497 Real estate holdings
Canada 7,492 4.4 9,255 8,547 8,872 9,112 9,135 9,043 7,378 3,120 2,413 Abroad 3,843 2.3 3,742 3,401 5,362 7,691 6,573 4,836 4,543 4,230 1,868
11,335 6.7 12,997 11,948 14,234 16,803 15,708 13,879 11,921 7,350 4,281 Total long-term investments 134,246 79.1 141,505 121,455 101,951 94,513 102,704 100,964 92,053 74,762 66,300 Short-term investments
Domestic securities 29,743 17.5 29,745 17,151 10,430 4,427 4,134 4,436 4,605 3,830 1,084 Foreign securities 2,431 1.4 2,488 2,240 1,487 1,774 1,299 1,329 504 846 533
32,174 18.9 32,233 19,391 11,917 6,201 5,433 5,765 5,109 4,676 1,617 Securities acquired under reverse
repurchase agreementsDomestic securities 675 0.4 675 734 413 1,111 1,103 320 117 725 1,026 Foreign securities 2,717 1.6 2,695 2,613 817 2,038 7,407 2,644 1,300 1,858 643
3,392 2.0 3,370 3,347 1,230 3,149 8,510 2,964 1,417 2,583 1,669 Total short-term investments 35,566 20.9 35,603 22,738 13,147 9,350 13,943 8,729 6,526 7,259 3,286 Total 169,812 100.0 177,108 144,193 115,098 103,863 116,647 109,693 98,579 82,021 69,586 Breakdown of long-term investments
Public sector 53,679 40.0 56,203 50,349 36,642 28,250 32,863 36,020 30,042 28,954 29,632 Private sector 80,567 60.0 85,302 71,106 65,309 66,263 69,841 64,944 62,011 45,808 36,668
Total 134,246 100.0 141,505 121,455 101,951 94,513 102,704 100,964 92,053 74,762 66,300
1 The value of investments was established based on the combined financial statements.2 Certain comparative figures have been reclassified to conform with the presentation used in the current year.3 The equities and convertible securities were previously listed according to the TSE35 index which has been abandoned by the Industry. The Caisse is listing them according to the GICS®
(Global Industry Classification Standard). Consequently, we have adjusted the 2002 figures to make them consistent with the following years. For the preceding year figures, please refer to the previous annual reports.
64
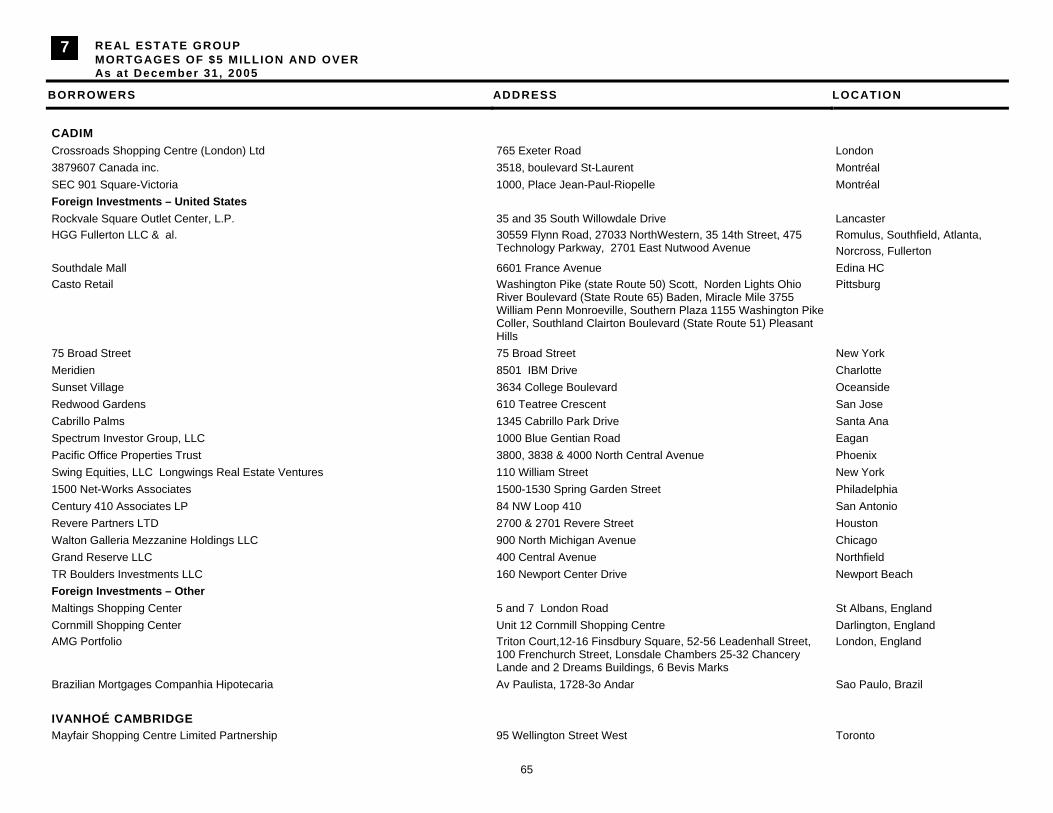
65
REAL ESTATE GROUP MORTGAGES OF $5 MILLION AND OVER As at December 31 , 2005
BORROWERS ADDRESS LOCATION
CADIM Crossroads Shopping Centre (London) Ltd 765 Exeter Road London 3879607 Canada inc. 3518, boulevard St-Laurent Montréal SEC 901 Square-Victoria 1000, Place Jean-Paul-Riopelle Montréal Foreign Investments – United States Rockvale Square Outlet Center, L.P. 35 and 35 South Willowdale Drive Lancaster HGG Fullerton LLC & al.
30559 Flynn Road, 27033 NorthWestern, 35 14th Street, 475 Technology Parkway, 2701 East Nutwood Avenue
Romulus, Southfield, Atlanta, Norcross, Fullerton
Southdale Mall 6601 France Avenue Edina HC Casto Retail Washington Pike (state Route 50) Scott, Norden Lights Ohio
River Boulevard (State Route 65) Baden, Miracle Mile 3755 William Penn Monroeville, Southern Plaza 1155 Washington Pike Coller, Southland Clairton Boulevard (State Route 51) Pleasant Hills
Pittsburg
75 Broad Street 75 Broad Street New York Meridien 8501 IBM Drive Charlotte Sunset Village 3634 College Boulevard Oceanside Redwood Gardens 610 Teatree Crescent San Jose Cabrillo Palms 1345 Cabrillo Park Drive Santa Ana Spectrum Investor Group, LLC 1000 Blue Gentian Road Eagan Pacific Office Properties Trust 3800, 3838 & 4000 North Central Avenue Phoenix Swing Equities, LLC Longwings Real Estate Ventures 110 William Street New York 1500 Net-Works Associates 1500-1530 Spring Garden Street Philadelphia Century 410 Associates LP 84 NW Loop 410 San Antonio Revere Partners LTD 2700 & 2701 Revere Street Houston Walton Galleria Mezzanine Holdings LLC 900 North Michigan Avenue Chicago Grand Reserve LLC 400 Central Avenue Northfield TR Boulders Investments LLC 160 Newport Center Drive Newport Beach Foreign Investments – Other Maltings Shopping Center 5 and 7 London Road St Albans, England Cornmill Shopping Center Unit 12 Cornmill Shopping Centre Darlington, England AMG Portfolio
Triton Court,12-16 Finsdbury Square, 52-56 Leadenhall Street, 100 Frenchurch Street, Lonsdale Chambers 25-32 Chancery Lande and 2 Dreams Buildings, 6 Bevis Marks
London, England
Brazilian Mortgages Companhia Hipotecaria Av Paulista, 1728-3o Andar Sao Paulo, Brazil IVANHOÉ CAMBRIDGE Mayfair Shopping Centre Limited Partnership
95 Wellington Street West
Toronto
87

66
REAL ESTATE GROUP MORTGAGES OF $5 MILLION AND OVER As at December 31 , 2005
BORROWERS ADDRESS LOCATION
Foreign Investments – United States Vaughan Mills Advisory Services, Inc. 1300 Wilson Boulevard Arlington MCAP – Real Estate Financing Group 1122581 Alberta Ltd. 630, boulevard René-Lévesque Ouest Montréal 1200 McGill College Fiducie Commerciale No.1 1200 to 1240, McGill College Montréal 1200 McGill College Inc. 1200 to 1240, McGill College Montréal 1562903 Ontario Limited 2305 McPhillips Street Winnipeg 215 Holdings Ltd. 215 Garry Street Winnipeg 2423-5632 Québec inc. 200, rue Belvédère Nord Sherbrooke 2631-1746 Québec inc. 3310-3550, boulevard Côte-Vertu Saint-Laurent 2631-1746 Québec inc. 7075, Place Robert-Joncas Saint-Laurent 2631-1746 Québec inc. 1111, boulevard Dr. Frédérick-Phillips Saint-Laurent 2631-1746 Québec inc. 3300, boulevard Côte Vertu Saint-Laurent 2965-0454 Québec inc. 205, rue Viger Ouest Montréal 3086142 Nova Scotia Company 1685 & 1705 Tech Avenue Mississauga 3086142 Nova Scotia Company 1660 & 1680 Tech Avenue Mississauga 3333 Sunridge Way Inc. 3333, Sunridge Way NE Calgary 355 Development Inc. 355 King Street West Toronto 400 University Avenue Inc. 400 University Avenue Toronto 555 René GP inc. 555, boulevard René-Lévesque Ouest Montréal 70 York Street Limited 70 York Street Toronto 9074-8765 Québec inc. 515, boulevard Curé Labelle Laval 9078-7003 Québec inc. 5100, rue Sherbrooke Est Montréal 9091-8541 Québec inc. 2400-2620, route Transcanadienne Pointe-Claire 9103-4975 Québec inc. 800-855, boulevard De Maisonneuve Est Montréal 9103-4983 Québec inc. 888, boulevard De Maisonneuve Est Montréal 9109-7550 Québec inc. René-Levesque & Lucien L'Allier Montréal 9111-3621 Québec inc. 510-520-530, boulevard de l'Atrium Charlesbourg 9145-0627 Québec inc. 1221, boulevard Marcotte Roberval 9145-0718 Québec inc. 705, avenue du Pont Nord Alma 9145-0726 Québec inc. 3460, boulevard Saint-François Jonquière 9145-9701 Québec inc. 12655 to 12695, rue Sherbrooke Est Montréal 930439 Alberta Ltd. 3320 Sunridge Way NE Calgary 962860 Alberta inc. 7400, boulevard des Galeries-d'Anjou Anjou Amexon Properties Corporation 1550 Enterprise Road Mississauga Amexon Properties Inc. 480 University Avenue Toronto
87
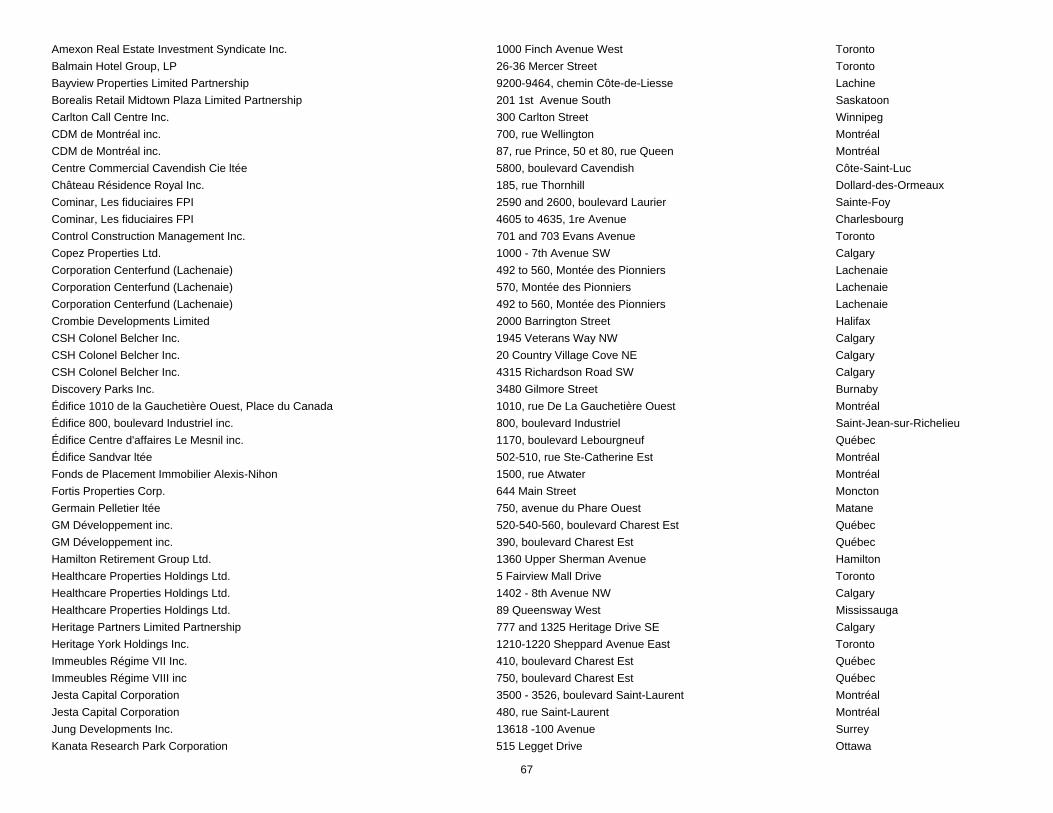
67
Amexon Real Estate Investment Syndicate Inc. 1000 Finch Avenue West Toronto Balmain Hotel Group, LP 26-36 Mercer Street Toronto Bayview Properties Limited Partnership 9200-9464, chemin Côte-de-Liesse Lachine Borealis Retail Midtown Plaza Limited Partnership 201 1st Avenue South Saskatoon Carlton Call Centre Inc. 300 Carlton Street Winnipeg CDM de Montréal inc. 700, rue Wellington Montréal CDM de Montréal inc. 87, rue Prince, 50 et 80, rue Queen Montréal Centre Commercial Cavendish Cie ltée 5800, boulevard Cavendish Côte-Saint-Luc Château Résidence Royal Inc. 185, rue Thornhill Dollard-des-Ormeaux Cominar, Les fiduciaires FPI 2590 and 2600, boulevard Laurier Sainte-Foy Cominar, Les fiduciaires FPI 4605 to 4635, 1re Avenue Charlesbourg Control Construction Management Inc. 701 and 703 Evans Avenue Toronto Copez Properties Ltd. 1000 - 7th Avenue SW Calgary Corporation Centerfund (Lachenaie) 492 to 560, Montée des Pionniers Lachenaie Corporation Centerfund (Lachenaie) 570, Montée des Pionniers Lachenaie Corporation Centerfund (Lachenaie) 492 to 560, Montée des Pionniers Lachenaie Crombie Developments Limited 2000 Barrington Street Halifax CSH Colonel Belcher Inc. 1945 Veterans Way NW Calgary CSH Colonel Belcher Inc. 20 Country Village Cove NE Calgary CSH Colonel Belcher Inc. 4315 Richardson Road SW Calgary Discovery Parks Inc. 3480 Gilmore Street Burnaby Édifice 1010 de la Gauchetière Ouest, Place du Canada 1010, rue De La Gauchetière Ouest Montréal Édifice 800, boulevard Industriel inc. 800, boulevard Industriel Saint-Jean-sur-Richelieu Édifice Centre d'affaires Le Mesnil inc. 1170, boulevard Lebourgneuf Québec Édifice Sandvar ltée 502-510, rue Ste-Catherine Est Montréal Fonds de Placement Immobilier Alexis-Nihon 1500, rue Atwater Montréal Fortis Properties Corp. 644 Main Street Moncton Germain Pelletier ltée 750, avenue du Phare Ouest Matane GM Développement inc. 520-540-560, boulevard Charest Est Québec GM Développement inc. 390, boulevard Charest Est Québec Hamilton Retirement Group Ltd. 1360 Upper Sherman Avenue Hamilton Healthcare Properties Holdings Ltd. 5 Fairview Mall Drive Toronto Healthcare Properties Holdings Ltd. 1402 - 8th Avenue NW Calgary Healthcare Properties Holdings Ltd. 89 Queensway West Mississauga Heritage Partners Limited Partnership 777 and 1325 Heritage Drive SE Calgary Heritage York Holdings Inc. 1210-1220 Sheppard Avenue East Toronto Immeubles Régime VII Inc. 410, boulevard Charest Est Québec Immeubles Régime VIII inc 750, boulevard Charest Est Québec Jesta Capital Corporation 3500 - 3526, boulevard Saint-Laurent Montréal Jesta Capital Corporation 480, rue Saint-Laurent Montréal Jung Developments Inc. 13618 -100 Avenue Surrey Kanata Research Park Corporation 515 Legget Drive Ottawa

68
REAL ESTATE GROUP MORTGAGES OF $5 MILLION AND OVER As at December 31 , 2005
BORROWERS ADDRESS LOCATION
Lasalle Boulevard Investment Inc. 1349 LaSalle Boulevard Sudbury Le 4817 Sherbrooke inc. 4817 to 4833, rue Sherbrooke Ouest Westmount Legacy Hotels Real Estate Investment Trust 100 Front Street West Toronto Legacy Hotels Real Estate Investment Trust 900, boulevard René-Lévesque Ouest Montréal Legacy Hotels Real Estate Investment Trust 900 Canada Place Way Vancouver Legacy Hotels Real Estate Investment Trust 1 Rideau Street Ottawa Legacy Hotels Real Estate Investment Trust 133 - 9th Avenue SW Calgary Legacy Hotels Real Estate Investment Trust 777, rue Université Montréal Legacy Hotels Real Estate Investment Trust 10065 - 100th Street Edmonton Legacy Hotels Real Estate Investment Trust 2035 Kennedy Road Toronto Legacy Hotels Real Estate Investment Trust 1990 Barrington Road Halifax Les Appartements Le Neuville inc. 111, rue de la Barre Longueuil Les Appartements Le Neuville inc. 111, rue de la Barre Longueuil Les Habitations Luc Maurice V inc. 50, Place du Commerce Ile des Soeurs Les Propriétés LPC (2004) inc. 100, rue du Terminus Rouyn-Noranda Manoir et Appartements Héritage Inc. 624 Wilson Street Ottawa Mercille François 1111, rue St-Charles Ouest Longueuil Millennium Madison Properties Ltd. 2345 Madison Avenue Burnaby Montez Retail Fund Inc. 2930 et 2950 to 2960, chemin de Chambly Longueuil Niagara Falls Retirement Group Ltd. 3896-3944 Portage Road Niagara Falls Ocean Pacific Hotels Ltd. 999 Canada Place Vancouver Orlando Corporation 90 Matheson Boulevard West Mississauga Ottawa Retirement Group Ltd. 111 Longfields Drive Ottawa Oxford Properties Group Inc. 3250 - 3300, Bloor Street West Toronto PDV 1 (MCEG) LTD. 320 Queen Street and 112, Kent Street Ottawa Place 400 Inc. 400 Main Street Saint-John Place Donnacona inc. 325, rue de l'Église Donnacona Place du Royaume Inc. 1401, boulevard Talbot Saguenay Prince George Retirement Group Ltd. 4377 Hill Avenue Prince George Pyxis Real Estate Equities inc. 1307, Ste-Catherine Street West Montréal Pyxis Real Estate Equities inc. 310, 386, 400 et 444 avenue Dorval Dorval Pyxis Real Estate Equities inc. 5523 Spring Garden Road Halifax Rideau Gardens Inc. 240 Friel Street Ottawa SCG/CLP Holdings, L.P. 1601 Bayshore Drive Vancouver Scott Hill Investments Inc. 2345 Argentia Road Mississauga Skyline- Les Façades de la Gare inc. 400, boulevard Jean Lesage Québec Société en commandite 407 McGill 401-407, rue McGill Montréal
87
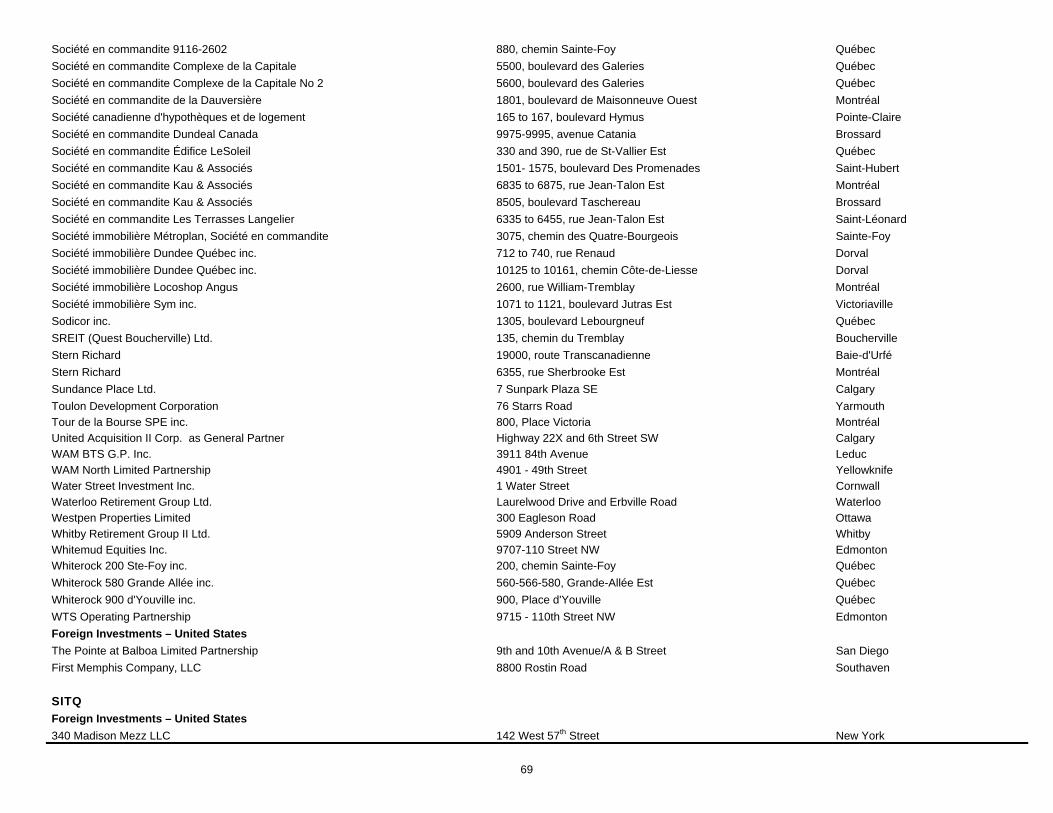
69
Société en commandite 9116-2602 880, chemin Sainte-Foy Québec Société en commandite Complexe de la Capitale 5500, boulevard des Galeries Québec Société en commandite Complexe de la Capitale No 2 5600, boulevard des Galeries Québec Société en commandite de la Dauversière 1801, boulevard de Maisonneuve Ouest Montréal Société canadienne d'hypothèques et de logement 165 to 167, boulevard Hymus Pointe-Claire Société en commandite Dundeal Canada 9975-9995, avenue Catania Brossard Société en commandite Édifice LeSoleil 330 and 390, rue de St-Vallier Est Québec Société en commandite Kau & Associés 1501- 1575, boulevard Des Promenades Saint-Hubert Société en commandite Kau & Associés 6835 to 6875, rue Jean-Talon Est Montréal Société en commandite Kau & Associés 8505, boulevard Taschereau Brossard Société en commandite Les Terrasses Langelier 6335 to 6455, rue Jean-Talon Est Saint-Léonard Société immobilière Métroplan, Société en commandite 3075, chemin des Quatre-Bourgeois Sainte-Foy Société immobilière Dundee Québec inc. 712 to 740, rue Renaud Dorval Société immobilière Dundee Québec inc. 10125 to 10161, chemin Côte-de-Liesse Dorval Société immobilière Locoshop Angus 2600, rue William-Tremblay Montréal Société immobilière Sym inc. 1071 to 1121, boulevard Jutras Est Victoriaville Sodicor inc. 1305, boulevard Lebourgneuf Québec SREIT (Quest Boucherville) Ltd. 135, chemin du Tremblay Boucherville Stern Richard 19000, route Transcanadienne Baie-d'Urfé Stern Richard 6355, rue Sherbrooke Est Montréal Sundance Place Ltd. 7 Sunpark Plaza SE Calgary Toulon Development Corporation 76 Starrs Road Yarmouth Tour de la Bourse SPE inc. 800, Place Victoria Montréal United Acquisition II Corp. as General Partner Highway 22X and 6th Street SW Calgary WAM BTS G.P. Inc. 3911 84th Avenue Leduc WAM North Limited Partnership 4901 - 49th Street Yellowknife Water Street Investment Inc. 1 Water Street Cornwall Waterloo Retirement Group Ltd. Laurelwood Drive and Erbville Road Waterloo Westpen Properties Limited 300 Eagleson Road Ottawa Whitby Retirement Group II Ltd. 5909 Anderson Street Whitby Whitemud Equities Inc. 9707-110 Street NW Edmonton Whiterock 200 Ste-Foy inc. 200, chemin Sainte-Foy Québec Whiterock 580 Grande Allée inc. 560-566-580, Grande-Allée Est Québec Whiterock 900 d'Youville inc. 900, Place d'Youville Québec WTS Operating Partnership 9715 - 110th Street NW Edmonton Foreign Investments – United States The Pointe at Balboa Limited Partnership 9th and 10th Avenue/A & B Street San Diego First Memphis Company, LLC 8800 Rostin Road Southaven SITQ Foreign Investments – United States 340 Madison Mezz LLC 142 West 57th Street New York

INVESTMENTS IN SHARES AND BONDS OF PUBLICLY TRADED COMPANIESas at December 31, 2005(fair value - in millions of dollars)
CORPORATIONS Designation Shares Number Amount
ConvertibleSecurities
Bonds Subtotal Total
8
02 Plc 1,747,268 6.9 6.920-20 Technologies, Inc. 1,159,700 9.3 9.33M Co. 382,856 34.7 34.73i Group Plc 642,774 10.9 10.9407 International Inc. 16.1 16.14Kids Entertainment, Inc. 46,000 0.8 0.877 Bank, Ltd, The 403,000 3.6 3.6ABB, Ltd 433,806 4.9 4.9ABG Sundal Collier ASA 587,000 0.9 0.9ABM Industries Incorporated 51,200 1.2 1.2ABN AMRO Holding N.V. 1,204,620 36.7 36.7ABSA Group Limited 123,411 2.3 2.3ACGS CMBS 31.5 31.5ACL Alternative Fund Ltd fund units 152,165 26.3 26.3ACS, Actividades de Construccion y Servicios, S.A. 264,134 9.9 9.9ACT Depositor Corp. CMBS 89.5 89.5ADC Telecommunications, Inc. 185,296 4.8 4.8ADS, Inc. class A 2,388,563 3.4 3.4ADVO, Inc. 249,200 8.2 8.2AEON Co., Ltd 507,580 15.1 15.1AES Corporation 948,795 17.5 17.5AES Tiete, S.A. preferred 27,520,000 0.7 0.7AFK Sistema 105,800 2.9 2.9AFLAC Incorporated 133,363 7.2 7.2AGCO Corporation 6,880 0.1 0.1AGF Management Limited class B 910,754 20.3 20.3AKBANK T.A.S. 852,444 8.1 8.1ALK Abello, A.S. 2,770 0.3 0.3ALLTEL Corporation 190,677 14.0 14.0AMB Property Corporation fund units 140,100 8.0 8.0AMP Limited 1,354,279 8.9 8.9AMR Corporation 79,100 2.0 2.0ANSYS, Inc. 29,600 1.5 1.5AON Corporation 150,649 6.3 6.3
70

AO Smith Corporation 29,400 1.2 1.2AO VimpelCom 57,300 3.0 3.0A.P. Moller - Maersk, A.S. class A 16 0.2 0.2
class B 382 4.6 4.6 4.8ARA, S.A. de C.V., Consorcio 345,801 1.8 1.8ARC Energy Trust fund units 1,000,000 26.5 26.5ARGON ST, Inc. 70,000 2.5 2.5ARR Corporation 30,500 0.8 0.8ART Recherches et Technologies Avancées, Inc. 2,678,572 1.7 1.7A/S Det Ostasiatiske Kompagni 4,236 0.5 0.5ASM International N.V. 392,100 7.7 7.7ASML Holding N.V. 106,746 2.5 2.5ASM Pacific Technology, Ltd 423,500 2.8 2.8A.S.V., Inc. 22,000 0.6 0.6AT&T, Inc. 1,885,485 53.9 53.9ATCO, Ltd class I 266,000 10.9 10.9ATI Technologies, Inc. 1,369,066 27.1 27.1ATMI, Inc. 28,100 0.9 0.9ATS Automation Tooling Systems, Inc. 1,014,675 14.6 14.6AU Optronics Corp. 4,957,000 8.6 8.6AUR Resources, Inc. 1,486,200 17.5 17.5Aareal Bank AG 19,898 0.9 0.9Aaron Rents, Inc. 164,900 4.1 4.1Abbey National Treasury Services 211.2 211.2Abbott Laboratories 911,015 42.0 42.0Abertis Infraestructuras, S.A. 56,849 1.7 1.7Accenture, Ltd class A 547,342 18.5 18.5Acciona, S.A. 6,308 0.8 0.8Accor, S.A. 398,471 25.5 25.5Ace Limited 295,456 18.4 18.4Acer, Inc. 1,738,000 5.1 5.1Acerinox, S.A. 40,065 0.7 0.7Acibadem Saglik Hizmetleri ve Ticaret, A.S. 49,018 0.5 0.5Acom Co., Ltd 35,450 2.7 2.7Acta Holding ASA 124,000 0.4 0.4Actel Corporation 14,400 0.2 0.2Acuity Brands, Inc. 48,600 1.8 1.8Adana Cimento Sanayii Turk Anonim Sirketi class A 10,310 0.1 0.1Adaptec, Inc. 69,600 0.5 0.5Adastra Minerals, Inc. class A 300,000 0.5 0.5
71
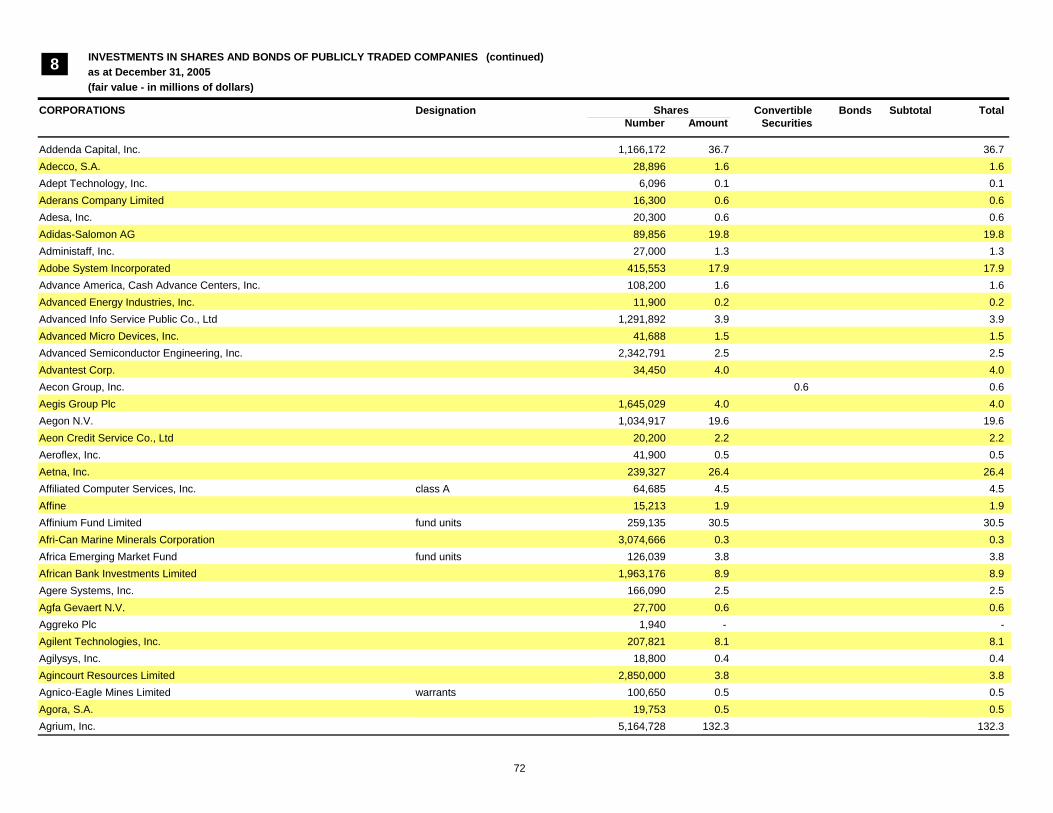
INVESTMENTS IN SHARES AND BONDS OF PUBLICLY TRADED COMPANIES as at December 31, 2005(fair value - in millions of dollars)
Designation ConvertibleSecurities
Bonds Subtotal Total
8
CORPORATIONS Shares Number Amount
(continued ) (continued)
Addenda Capital, Inc. 1,166,172 36.7 36.7Adecco, S.A. 28,896 1.6 1.6Adept Technology, Inc. 6,096 0.1 0.1Aderans Company Limited 16,300 0.6 0.6Adesa, Inc. 20,300 0.6 0.6Adidas-Salomon AG 89,856 19.8 19.8Administaff, Inc. 27,000 1.3 1.3Adobe System Incorporated 415,553 17.9 17.9Advance America, Cash Advance Centers, Inc. 108,200 1.6 1.6Advanced Energy Industries, Inc. 11,900 0.2 0.2Advanced Info Service Public Co., Ltd 1,291,892 3.9 3.9Advanced Micro Devices, Inc. 41,688 1.5 1.5Advanced Semiconductor Engineering, Inc. 2,342,791 2.5 2.5Advantest Corp. 34,450 4.0 4.0Aecon Group, Inc. 0.6 0.6Aegis Group Plc 1,645,029 4.0 4.0Aegon N.V. 1,034,917 19.6 19.6Aeon Credit Service Co., Ltd 20,200 2.2 2.2Aeroflex, Inc. 41,900 0.5 0.5Aetna, Inc. 239,327 26.4 26.4Affiliated Computer Services, Inc. class A 64,685 4.5 4.5Affine 15,213 1.9 1.9Affinium Fund Limited fund units 259,135 30.5 30.5Afri-Can Marine Minerals Corporation 3,074,666 0.3 0.3Africa Emerging Market Fund fund units 126,039 3.8 3.8African Bank Investments Limited 1,963,176 8.9 8.9Agere Systems, Inc. 166,090 2.5 2.5Agfa Gevaert N.V. 27,700 0.6 0.6Aggreko Plc 1,940 - -Agilent Technologies, Inc. 207,821 8.1 8.1Agilysys, Inc. 18,800 0.4 0.4Agincourt Resources Limited 2,850,000 3.8 3.8Agnico-Eagle Mines Limited warrants 100,650 0.5 0.5Agora, S.A. 19,753 0.5 0.5Agrium, Inc. 5,164,728 132.3 132.3
72

Aiful Corporation 56,810 5.5 5.5Air France-KLM 114,262 2.8 2.8Air Liquide, S.A. 93,219 20.9 20.9Air Products and Chemicals, Inc. 38,550 2.7 2.7Airport of Montreal 50.1 50.1Airports of Thailand Public Company Limited 516,900 0.8 0.8Aisin Seiki Co., Ltd 198,400 8.5 8.5Ajinomoto Co., Inc. 342,900 4.1 4.1Akzo Nobel N.V. 153,041 8.3 8.3Alamos Gold, Inc. warrants 500,000 0.7 0.7 1.4Alamosa Holdings, Inc. 600,400 13.0 13.0Alarko Holding A.S. 10,225 0.5 0.5Albany International Corp. class A 36,700 1.6 1.6Alberto-Culver Company 25,754 1.4 1.4Albertson's, Inc. 78,078 2.0 2.0Alcan, Inc. 8,039,441 384.0 11.4 395.4Alcatel, S.A. 647,322 9.3 9.3Alcoa, Inc. 303,214 10.5 10.5Alcon, Inc. 23,021 3.5 3.5Aldea Vision, Inc. 240,436 - - -Alexander & Baldwin, Inc. 2,118 0.1 0.1Alexander Forbes Limited 566,400 1.5 1.5Alexandria Real Estate, Inc. 14,100 1.3 1.3Alexis Minerals Corp. 2,259,834 1.0 1.0
warrants 500,000 0.1 0.1 1.1Alfa Laval AB 20,953 0.5 0.5Alfa, S.A. de C.V. class A 316,841 2.0 2.0Alfresa Holdings Corporation 11,600 0.6 0.6Alimentation Couche-Tard, Inc. class B 6,188,792 144.8 144.8All America Latina Logistica 90,300 4.5 4.5All Nippon Airways Co., Ltd 258,000 1.2 1.2Alleanza Assicurazioni 93,336 1.3 1.3Allegheny Energy, Inc. 79,219 2.9 2.9Allegheny Technologies, Inc. 45,506 1.9 1.9Allergan, Inc. 135,099 17.0 17.0Alliance Capital Management Holding, L.P. 104,221 6.9 6.9Alliance One International, Inc. 484,400 2.2 2.2Alliance Pipeline, L.P. 65.7 65.7Alliance Unichem Plc 814,390 13.1 13.1Alliant Energy Corporation 30,086 1.0 1.0
73
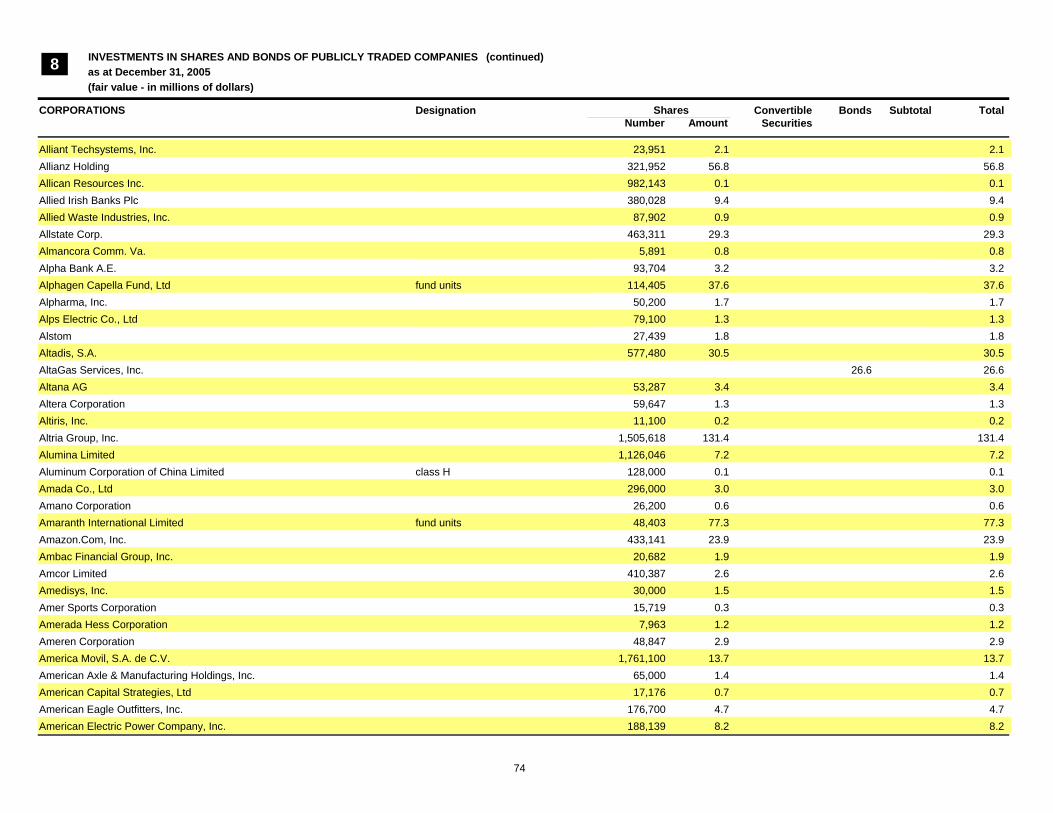
INVESTMENTS IN SHARES AND BONDS OF PUBLICLY TRADED COMPANIES as at December 31, 2005(fair value - in millions of dollars)
Designation ConvertibleSecurities
Bonds Subtotal Total
8
CORPORATIONS Shares Number Amount
(continued ) (continued)
Alliant Techsystems, Inc. 23,951 2.1 2.1Allianz Holding 321,952 56.8 56.8Allican Resources Inc. 982,143 0.1 0.1Allied Irish Banks Plc 380,028 9.4 9.4Allied Waste Industries, Inc. 87,902 0.9 0.9Allstate Corp. 463,311 29.3 29.3Almancora Comm. Va. 5,891 0.8 0.8Alpha Bank A.E. 93,704 3.2 3.2Alphagen Capella Fund, Ltd fund units 114,405 37.6 37.6Alpharma, Inc. 50,200 1.7 1.7Alps Electric Co., Ltd 79,100 1.3 1.3Alstom 27,439 1.8 1.8Altadis, S.A. 577,480 30.5 30.5AltaGas Services, Inc. 26.6 26.6Altana AG 53,287 3.4 3.4Altera Corporation 59,647 1.3 1.3Altiris, Inc. 11,100 0.2 0.2Altria Group, Inc. 1,505,618 131.4 131.4Alumina Limited 1,126,046 7.2 7.2Aluminum Corporation of China Limited class H 128,000 0.1 0.1Amada Co., Ltd 296,000 3.0 3.0Amano Corporation 26,200 0.6 0.6Amaranth International Limited fund units 48,403 77.3 77.3Amazon.Com, Inc. 433,141 23.9 23.9Ambac Financial Group, Inc. 20,682 1.9 1.9Amcor Limited 410,387 2.6 2.6Amedisys, Inc. 30,000 1.5 1.5Amer Sports Corporation 15,719 0.3 0.3Amerada Hess Corporation 7,963 1.2 1.2Ameren Corporation 48,847 2.9 2.9America Movil, S.A. de C.V. 1,761,100 13.7 13.7American Axle & Manufacturing Holdings, Inc. 65,000 1.4 1.4American Capital Strategies, Ltd 17,176 0.7 0.7American Eagle Outfitters, Inc. 176,700 4.7 4.7American Electric Power Company, Inc. 188,139 8.2 8.2
74
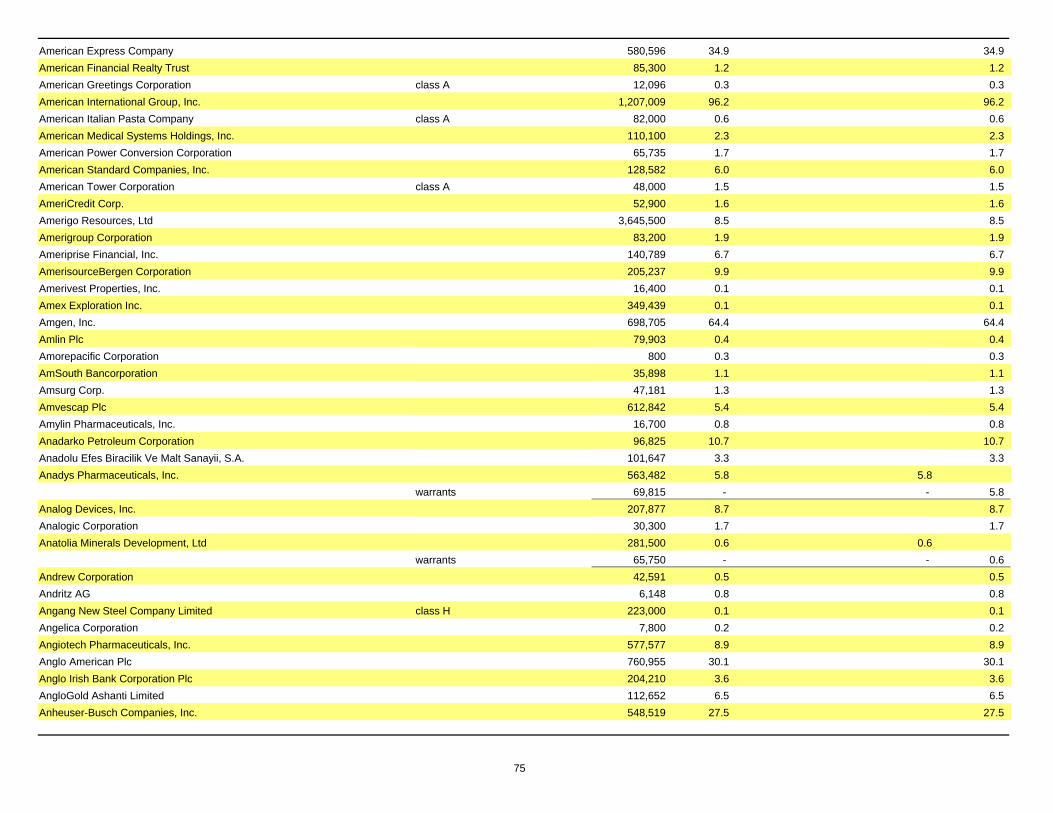
American Express Company 580,596 34.9 34.9American Financial Realty Trust 85,300 1.2 1.2American Greetings Corporation class A 12,096 0.3 0.3American International Group, Inc. 1,207,009 96.2 96.2American Italian Pasta Company class A 82,000 0.6 0.6American Medical Systems Holdings, Inc. 110,100 2.3 2.3American Power Conversion Corporation 65,735 1.7 1.7American Standard Companies, Inc. 128,582 6.0 6.0American Tower Corporation class A 48,000 1.5 1.5AmeriCredit Corp. 52,900 1.6 1.6Amerigo Resources, Ltd 3,645,500 8.5 8.5Amerigroup Corporation 83,200 1.9 1.9Ameriprise Financial, Inc. 140,789 6.7 6.7AmerisourceBergen Corporation 205,237 9.9 9.9Amerivest Properties, Inc. 16,400 0.1 0.1Amex Exploration Inc. 349,439 0.1 0.1Amgen, Inc. 698,705 64.4 64.4Amlin Plc 79,903 0.4 0.4Amorepacific Corporation 800 0.3 0.3AmSouth Bancorporation 35,898 1.1 1.1Amsurg Corp. 47,181 1.3 1.3Amvescap Plc 612,842 5.4 5.4Amylin Pharmaceuticals, Inc. 16,700 0.8 0.8Anadarko Petroleum Corporation 96,825 10.7 10.7Anadolu Efes Biracilik Ve Malt Sanayii, S.A. 101,647 3.3 3.3Anadys Pharmaceuticals, Inc. 563,482 5.8 5.8
warrants 69,815 - - 5.8Analog Devices, Inc. 207,877 8.7 8.7Analogic Corporation 30,300 1.7 1.7Anatolia Minerals Development, Ltd 281,500 0.6 0.6
warrants 65,750 - - 0.6Andrew Corporation 42,591 0.5 0.5Andritz AG 6,148 0.8 0.8Angang New Steel Company Limited class H 223,000 0.1 0.1Angelica Corporation 7,800 0.2 0.2Angiotech Pharmaceuticals, Inc. 577,577 8.9 8.9Anglo American Plc 760,955 30.1 30.1Anglo Irish Bank Corporation Plc 204,210 3.6 3.6AngloGold Ashanti Limited 112,652 6.5 6.5Anheuser-Busch Companies, Inc. 548,519 27.5 27.5
75
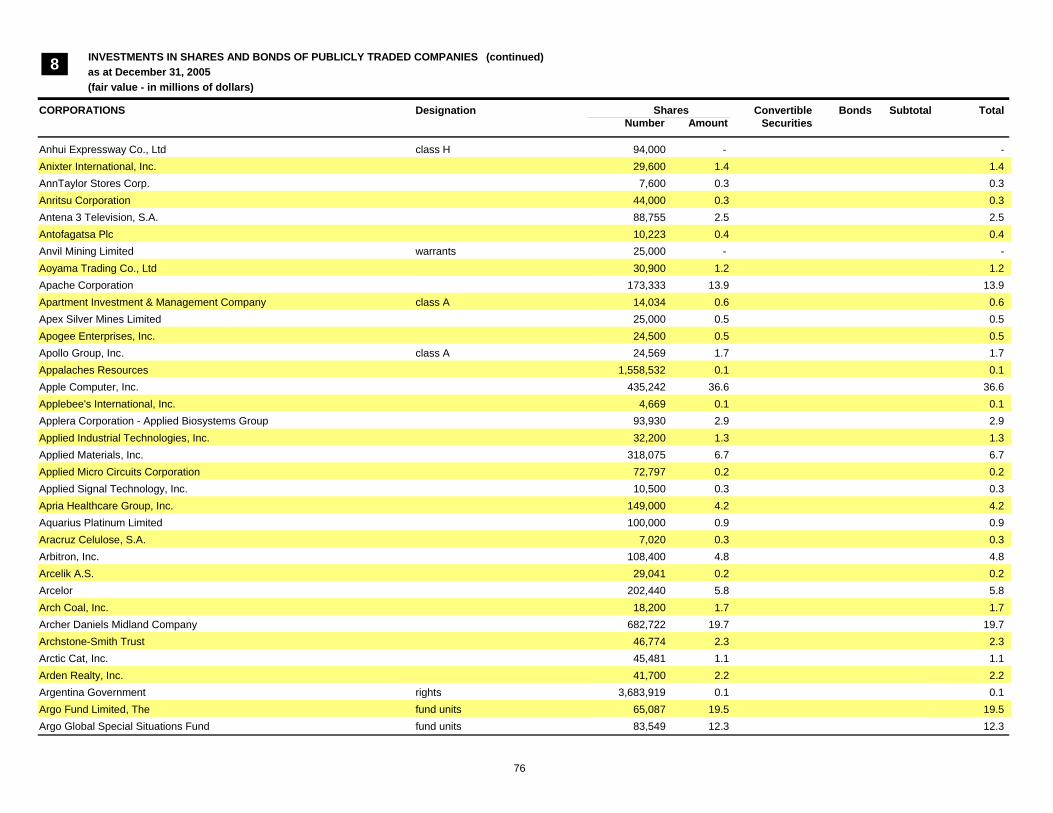
INVESTMENTS IN SHARES AND BONDS OF PUBLICLY TRADED COMPANIES as at December 31, 2005(fair value - in millions of dollars)
Designation ConvertibleSecurities
Bonds Subtotal Total
8
CORPORATIONS Shares Number Amount
(continued ) (continued)
Anhui Expressway Co., Ltd class H 94,000 - -Anixter International, Inc. 29,600 1.4 1.4AnnTaylor Stores Corp. 7,600 0.3 0.3Anritsu Corporation 44,000 0.3 0.3Antena 3 Television, S.A. 88,755 2.5 2.5Antofagatsa Plc 10,223 0.4 0.4Anvil Mining Limited warrants 25,000 - -Aoyama Trading Co., Ltd 30,900 1.2 1.2Apache Corporation 173,333 13.9 13.9Apartment Investment & Management Company class A 14,034 0.6 0.6Apex Silver Mines Limited 25,000 0.5 0.5Apogee Enterprises, Inc. 24,500 0.5 0.5Apollo Group, Inc. class A 24,569 1.7 1.7Appalaches Resources 1,558,532 0.1 0.1Apple Computer, Inc. 435,242 36.6 36.6Applebee's International, Inc. 4,669 0.1 0.1Applera Corporation - Applied Biosystems Group 93,930 2.9 2.9Applied Industrial Technologies, Inc. 32,200 1.3 1.3Applied Materials, Inc. 318,075 6.7 6.7Applied Micro Circuits Corporation 72,797 0.2 0.2Applied Signal Technology, Inc. 10,500 0.3 0.3Apria Healthcare Group, Inc. 149,000 4.2 4.2Aquarius Platinum Limited 100,000 0.9 0.9Aracruz Celulose, S.A. 7,020 0.3 0.3Arbitron, Inc. 108,400 4.8 4.8Arcelik A.S. 29,041 0.2 0.2Arcelor 202,440 5.8 5.8Arch Coal, Inc. 18,200 1.7 1.7Archer Daniels Midland Company 682,722 19.7 19.7Archstone-Smith Trust 46,774 2.3 2.3Arctic Cat, Inc. 45,481 1.1 1.1Arden Realty, Inc. 41,700 2.2 2.2Argentina Government rights 3,683,919 0.1 0.1Argo Fund Limited, The fund units 65,087 19.5 19.5Argo Global Special Situations Fund fund units 83,549 12.3 12.3
76

Aria Trust 56.7 56.7Ariake Japan Co., Ltd 9,100 0.3 0.3Aristocrat Leisure Limited 328,200 3.5 3.5Ariva Plc 30,934 0.4 0.4Arkansas Best Corporation 20,900 1.1 1.1Armor Holdings, Inc. 90,000 4.5 4.5ArQule, Inc. 29,900 0.2 0.2Arrow Electronics, Inc. 47,900 1.8 1.8Artesyn Technologies, Inc. 26,843 0.3 0.3ArthroCare Corp. 40,700 2.0 2.0Artradis Barracuda Fund fund units 1,901,143 26.9 26.9Asahi Breweries, Ltd 345,756 4.9 4.9Asahi Glass Company Limited 691,100 10.4 10.4Asahi Kasei Corporation 1,018,000 8.0 8.0Asatsu-DK, Inc. 15,400 0.6 0.6Asbestos Corporation Limited 259,065 2.7 2.7Ascendas Real Estate Investment Trust 99,750 0.1 0.1Ashland, Inc. 12,300 0.8 0.8Ashton Mining of Canada Inc. 778,850 1.0 1.0Ashworth, Inc. 29,300 0.3 0.3Asia Aluminum Holdings Limited 3,608,000 0.4 0.4Asia Debt Recovery Company Limited, The fund units 1,641,881 51.4 51.4Asia Optical Co., Ltd 236,467 1.9 1.9Asian Credit Hedge Fund fund units 2,456,803 40.7 40.7Aspen Pharmacare Holdings Limited 95,700 0.6 0.6Aspreva Pharmaceuticals 190,000 3.5 3.5Assa Abloy AB class B 65,083 1.2 1.2Assicurazioni Generali 343,884 14.0 14.0Associated British Foods Plc 120,800 2.0 2.0Associated British Ports Holdings Plc 56,229 0.7 0.7Associated Cement Compagnies, Ltd 858,400 11.9 11.9Assurances Générales de France 17,489 2.0 2.0Assurant, Inc. 26,500 1.4 1.4Astec Industries, Inc. 27,200 1.0 1.0Astellas Pharma, Inc. 362,746 16.5 16.5Astral Media, Inc. class A 1,304,700 40.0 40.0AstraZeneca Plc 1,165,811 66.2 66.2Asustek Computer Inc. 2,716,000 9.8 9.8Atlantic Power Corporation 7,500,000 78.0 38.3 116.3
77
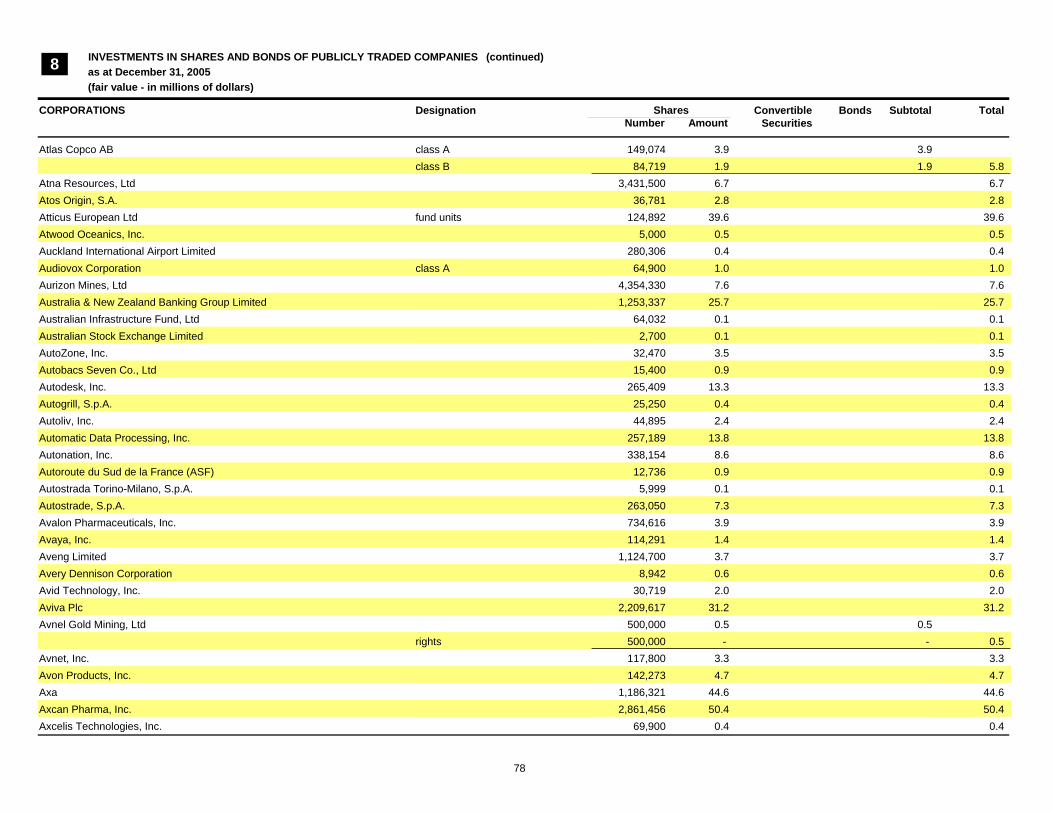
INVESTMENTS IN SHARES AND BONDS OF PUBLICLY TRADED COMPANIES as at December 31, 2005(fair value - in millions of dollars)
Designation ConvertibleSecurities
Bonds Subtotal Total
8
CORPORATIONS Shares Number Amount
(continued ) (continued)
Atlas Copco AB class A 149,074 3.9 3.9class B 84,719 1.9 1.9 5.8
Atna Resources, Ltd 3,431,500 6.7 6.7Atos Origin, S.A. 36,781 2.8 2.8Atticus European Ltd fund units 124,892 39.6 39.6Atwood Oceanics, Inc. 5,000 0.5 0.5Auckland International Airport Limited 280,306 0.4 0.4Audiovox Corporation class A 64,900 1.0 1.0Aurizon Mines, Ltd 4,354,330 7.6 7.6Australia & New Zealand Banking Group Limited 1,253,337 25.7 25.7Australian Infrastructure Fund, Ltd 64,032 0.1 0.1Australian Stock Exchange Limited 2,700 0.1 0.1AutoZone, Inc. 32,470 3.5 3.5Autobacs Seven Co., Ltd 15,400 0.9 0.9Autodesk, Inc. 265,409 13.3 13.3Autogrill, S.p.A. 25,250 0.4 0.4Autoliv, Inc. 44,895 2.4 2.4Automatic Data Processing, Inc. 257,189 13.8 13.8Autonation, Inc. 338,154 8.6 8.6Autoroute du Sud de la France (ASF) 12,736 0.9 0.9Autostrada Torino-Milano, S.p.A. 5,999 0.1 0.1Autostrade, S.p.A. 263,050 7.3 7.3Avalon Pharmaceuticals, Inc. 734,616 3.9 3.9Avaya, Inc. 114,291 1.4 1.4Aveng Limited 1,124,700 3.7 3.7Avery Dennison Corporation 8,942 0.6 0.6Avid Technology, Inc. 30,719 2.0 2.0Aviva Plc 2,209,617 31.2 31.2Avnel Gold Mining, Ltd 500,000 0.5 0.5
rights 500,000 - - 0.5Avnet, Inc. 117,800 3.3 3.3Avon Products, Inc. 142,273 4.7 4.7Axa 1,186,321 44.6 44.6Axcan Pharma, Inc. 2,861,456 50.4 50.4Axcelis Technologies, Inc. 69,900 0.4 0.4
78
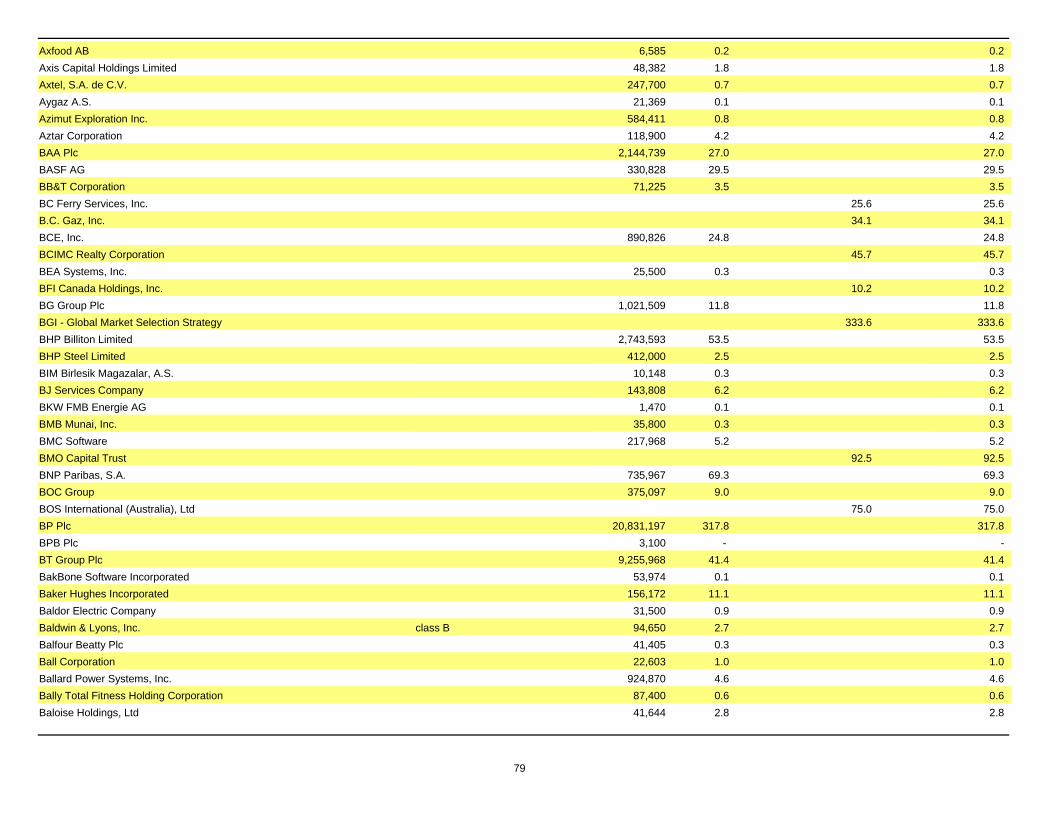
Axfood AB 6,585 0.2 0.2Axis Capital Holdings Limited 48,382 1.8 1.8Axtel, S.A. de C.V. 247,700 0.7 0.7Aygaz A.S. 21,369 0.1 0.1Azimut Exploration Inc. 584,411 0.8 0.8Aztar Corporation 118,900 4.2 4.2BAA Plc 2,144,739 27.0 27.0BASF AG 330,828 29.5 29.5BB&T Corporation 71,225 3.5 3.5BC Ferry Services, Inc. 25.6 25.6B.C. Gaz, Inc. 34.1 34.1BCE, Inc. 890,826 24.8 24.8BCIMC Realty Corporation 45.7 45.7BEA Systems, Inc. 25,500 0.3 0.3BFI Canada Holdings, Inc. 10.2 10.2BG Group Plc 1,021,509 11.8 11.8BGI - Global Market Selection Strategy 333.6 333.6BHP Billiton Limited 2,743,593 53.5 53.5BHP Steel Limited 412,000 2.5 2.5BIM Birlesik Magazalar, A.S. 10,148 0.3 0.3BJ Services Company 143,808 6.2 6.2BKW FMB Energie AG 1,470 0.1 0.1BMB Munai, Inc. 35,800 0.3 0.3BMC Software 217,968 5.2 5.2BMO Capital Trust 92.5 92.5BNP Paribas, S.A. 735,967 69.3 69.3BOC Group 375,097 9.0 9.0BOS International (Australia), Ltd 75.0 75.0BP Plc 20,831,197 317.8 317.8BPB Plc 3,100 - -BT Group Plc 9,255,968 41.4 41.4BakBone Software Incorporated 53,974 0.1 0.1Baker Hughes Incorporated 156,172 11.1 11.1Baldor Electric Company 31,500 0.9 0.9Baldwin & Lyons, Inc. class B 94,650 2.7 2.7Balfour Beatty Plc 41,405 0.3 0.3Ball Corporation 22,603 1.0 1.0Ballard Power Systems, Inc. 924,870 4.6 4.6Bally Total Fitness Holding Corporation 87,400 0.6 0.6Baloise Holdings, Ltd 41,644 2.8 2.8
79

INVESTMENTS IN SHARES AND BONDS OF PUBLICLY TRADED COMPANIES as at December 31, 2005(fair value - in millions of dollars)
Designation ConvertibleSecurities
Bonds Subtotal Total
8
CORPORATIONS Shares Number Amount
(continued ) (continued)
Banca Antonveneta, S.p.A. 25,544 0.9 0.9Banca CR Firenze, S.p.A. 284,397 1.0 1.0Banca Fideuram, S.p.A. 64,865 0.4 0.4Banca Intesa, S.p.A. 4,718,276 28.0 28.0Banca Monte dei Paschi di Siena, S.p.A. 262,722 1.4 1.4Banca Nazionale del Lavoro, S.p.A. (BNL) 295,257 1.1 1.1Banca Piccolo Credito Valtellinese, S.c.r.l. 17,572 0.3 0.3Banca Popolare dell'Emilia Romagna, S.c.r.l. 4,573 0.3 0.3Banca Popolare dell'Eturia e del Lazio, S.c.r.l. 5,282 0.1 0.1Banca Popolare di Intra, S.c.r.l. 8,597 0.1 0.1Banca Popolare di Milano (BPM) 490,909 6.3 6.3Banca Popolare di Sondrio, S.c.r.l. 7,179 0.1 0.1Banche Popolari Unite, S.c.r.l. 106,891 2.7 2.7Banco Bilbao Vizcaya, S.A. 2,672,739 55.5 55.5Banco BPI, S.A. 75,722 0.4 0.4Banco Bradesco, S.A. 30,400 1.0 1.0
preferred 360,200 12.2 12.2 13.2Banco Comercial Portugues, S.A. (BCP) 1,326,290 4.3 4.3Banco Espirito Santo, S.A. 25,059 0.5 0.5Banco Itau Holding Financeira, S.A. 72,300 2.0 2.0
preferred 53,000 1.5 1.5 3.5Banco Latinoamericano de Exportaciones, S.A. class E 42,100 0.9 0.9Banco Nossa Caixa, S.A. 57,065 1.0 1.0Banco Pastor, S.A. 6,340 0.4 0.4Banco Popolare di Verona e Novara, S.c.r.l. 702,337 16.5 16.5Banco Popular Espanol, S.A. 203,557 2.9 2.9Banco Sabadell, S.A. 43,700 1.3 1.3Banco Santander Central Hispano, S.A. 2,190,499 33.6 33.6Banco Santander Chile, S.A. 33,049,600 2.5 2.5Bancolombia, S.A. 87,500 3.0 3.0Bang & Olufsen A/S class B 2,482 0.3 0.3Bangkok Bank 318,200 1.0 1.0Bangkok Bank Public Company Limited 480,000 1.4 1.4Bank Handlowy w Warszawie, S.A. 12,369 0.3 0.3Bank Hapoalim, Ltd 1,310,404 7.1 7.1
80
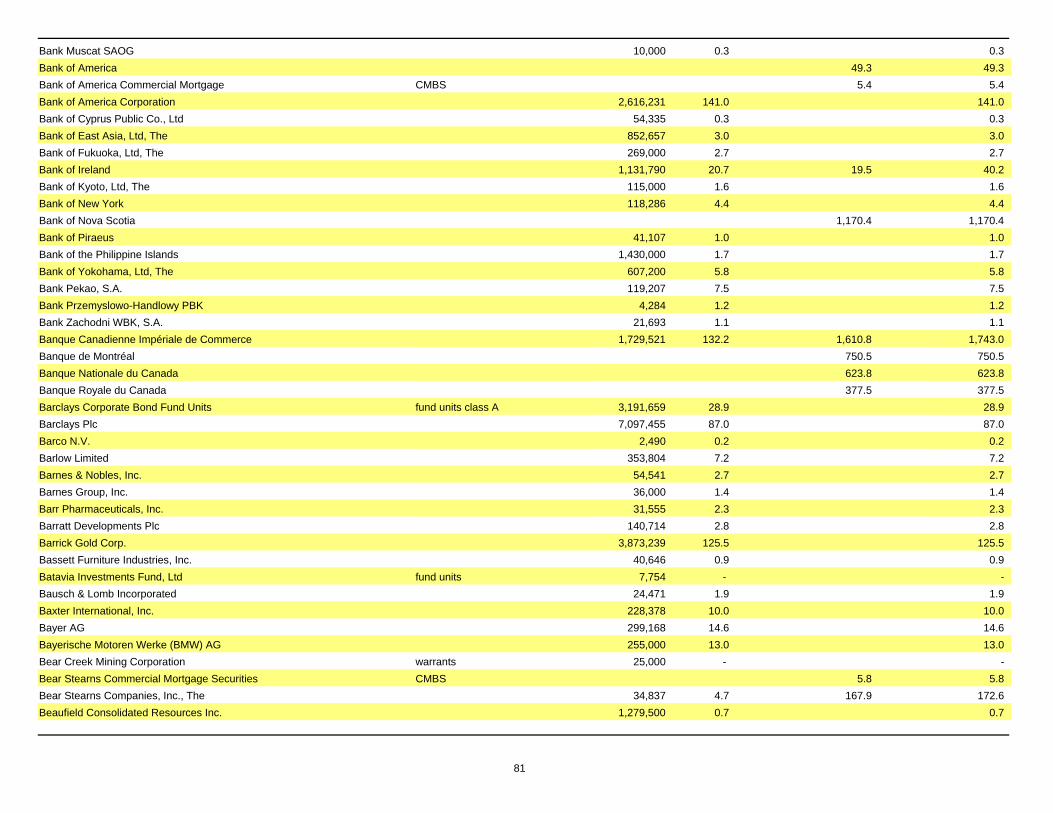
Bank Muscat SAOG 10,000 0.3 0.3Bank of America 49.3 49.3Bank of America Commercial Mortgage CMBS 5.4 5.4Bank of America Corporation 2,616,231 141.0 141.0Bank of Cyprus Public Co., Ltd 54,335 0.3 0.3Bank of East Asia, Ltd, The 852,657 3.0 3.0Bank of Fukuoka, Ltd, The 269,000 2.7 2.7Bank of Ireland 1,131,790 20.7 19.5 40.2Bank of Kyoto, Ltd, The 115,000 1.6 1.6Bank of New York 118,286 4.4 4.4Bank of Nova Scotia 1,170.4 1,170.4Bank of Piraeus 41,107 1.0 1.0Bank of the Philippine Islands 1,430,000 1.7 1.7Bank of Yokohama, Ltd, The 607,200 5.8 5.8Bank Pekao, S.A. 119,207 7.5 7.5Bank Przemyslowo-Handlowy PBK 4,284 1.2 1.2Bank Zachodni WBK, S.A. 21,693 1.1 1.1Banque Canadienne Impériale de Commerce 1,729,521 132.2 1,610.8 1,743.0Banque de Montréal 750.5 750.5Banque Nationale du Canada 623.8 623.8Banque Royale du Canada 377.5 377.5Barclays Corporate Bond Fund Units fund units class A 3,191,659 28.9 28.9Barclays Plc 7,097,455 87.0 87.0Barco N.V. 2,490 0.2 0.2Barlow Limited 353,804 7.2 7.2Barnes & Nobles, Inc. 54,541 2.7 2.7Barnes Group, Inc. 36,000 1.4 1.4Barr Pharmaceuticals, Inc. 31,555 2.3 2.3Barratt Developments Plc 140,714 2.8 2.8Barrick Gold Corp. 3,873,239 125.5 125.5Bassett Furniture Industries, Inc. 40,646 0.9 0.9Batavia Investments Fund, Ltd fund units 7,754 - -Bausch & Lomb Incorporated 24,471 1.9 1.9Baxter International, Inc. 228,378 10.0 10.0Bayer AG 299,168 14.6 14.6Bayerische Motoren Werke (BMW) AG 255,000 13.0 13.0Bear Creek Mining Corporation warrants 25,000 - -Bear Stearns Commercial Mortgage Securities CMBS 5.8 5.8Bear Stearns Companies, Inc., The 34,837 4.7 167.9 172.6Beaufield Consolidated Resources Inc. 1,279,500 0.7 0.7
81

INVESTMENTS IN SHARES AND BONDS OF PUBLICLY TRADED COMPANIES as at December 31, 2005(fair value - in millions of dollars)
Designation ConvertibleSecurities
Bonds Subtotal Total
8
CORPORATIONS Shares Number Amount
(continued ) (continued)
Beazer Homes USA, Inc. 31,400 2.7 2.7Beckman Coulter, Inc. 1,200 0.1 0.1Becton Dickinson & Company 272,502 19.1 19.1Bed Bath & Beyond, Inc. 61,968 2.6 2.6Beiersdorf AG 3,705 0.5 0.5Beijing Capital International Airport Company Ltd class H 1,031,612 0.6 0.6Beijing Datang Power Generation Company Limited 298,000 0.3 0.3Beijing Enterprises Holdings Limited 49,000 0.1 0.1Bekaert NV 3,878 0.4 0.4Bel Fuse, Inc. class B 6,500 0.2 0.2Belden CDT, Inc. 38,800 1.1 1.1Belgacom 45,508 1.7 1.7Bell Canada 155.7 155.7Bell Canada International, Inc. 277,055 1.7 1.7Bell Microproducts, Inc. 15,700 0.1 0.1Bell Mobility, Inc. 10.5 10.5BellSouth Corporation 744,761 23.6 23.6Belluna Co., Ltd rights 45 - -Belo Corp. class A 12,300 0.3 0.3Bema Gold Corporation 3,988,709 13.4 13.4Bemis Company, Inc. 14,889 0.5 0.5Benchmark Electronics, Inc. 36,200 1.4 1.4Bendigo Mining Limited 1,011,292 1.4 1.4Benesse Corporation 47,700 2.0 2.0Benetton Group, S.p.A. 114,623 1.5 1.5Beni Stabili, S.p.A. 129,677 0.2 0.2Berjaya Sports Toto Berhad 782,400 1.1 1.1Berkeley Group Holdings Plc, The 80,027 1.8 1.8Best Buy Co., Inc. 119,006 6.0 6.0Bezeq Israel Telecom 935,386 1.4 1.4Bharat Petroleum Corporation Limited participating notes 108,000 1.2 1.2Bharti Tele-Ventures Limited participating notes 220,000 2.0 2.0Bidvest Group Limited 218,600 3.7 3.7Big Lots, Inc. 7,779 0.1 0.1Bilfinger Berger AG 9,070 0.5 0.5
82

Bill Barrett Corporation 5,000 0.2 0.2Billabong International Limited 64,100 0.8 0.8Billerud Aktiebolag 11,763 0.2 0.2Billiton Plc 1,417,034 27.0 27.0Biogen Idec, Inc. 40,473 2.1 2.1Biolase Technology, Inc. 21,300 0.2 0.2Biomed Realty Trust, Inc. 30,200 0.9 0.9Biomet, Inc. 30,206 1.3 1.3Biosite, Inc. 25,700 1.7 1.7Biovail Corporation 2,640,045 72.7 72.7Birim Goldfields Inc. 3,026,012 1.3 1.3Black & Decker Corporation, The 42,976 4.4 4.4Black Box Corporation 18,000 1.0 1.0Block H & R, Inc. 143,838 4.1 4.1Blue Mountain Credit Alternatives Fund Ltd fund units 357,073 43.2 43.2Blue Sky Japan, L.P. fund units 14,580 37.6 37.6Bluecrest Capital International Limited fund units 341,574 53.5 53.5Bluecrest Emerging Markets Limited fund units 250,000 30.7 30.7Bluecrest Strategic Fund Limited fund units 84,511 12.7 12.7Bluetrend Fund Limited fund units 321,747 46.7 46.7Blyth, Inc. 8,745 0.2 0.2Boardwalk Real Estate Investment Trust fund units 18,500 0.4 0.4Body Shop International Plc 14,003 0.1 0.1Bodycote International Plc 1,631,933 7.3 7.3Boehler-Uddeholm AG 2,250 0.4 0.4Boeing Company, The 447,939 36.8 36.8Bolivar Gold Corp. 78,000 0.2 0.2Bolu Cimento Sanayi, A.S. 37,151 0.1 0.1Bombardier, Inc. class A 6,019,400 16.5 16.5
class B 7,550,000 20.8 20.8 37.3Boots Group Plc 270,215 3.3 3.3BorgWarner, Inc. 50,400 3.6 3.6Bosch Corporation 43,999 0.2 0.2Boston Properties, Inc. fund units 170,900 14.8 14.8Boston Scientific Corporation 474,133 13.6 13.6Bouygues, S.A. 291,133 16.6 16.6Bowater, Inc. 66,100 2.4 2.4Bowne & Co., Inc. 40,100 0.7 0.7Bradespar, S.A. preferred 100,000 3.0 3.0Bradken Limited 223,995 0.8 0.8
83

INVESTMENTS IN SHARES AND BONDS OF PUBLICLY TRADED COMPANIES as at December 31, 2005(fair value - in millions of dollars)
Designation ConvertibleSecurities
Bonds Subtotal Total
8
CORPORATIONS Shares Number Amount
(continued ) (continued)
Bradley Pharmaceuticals, Inc. 14,000 0.2 0.2Brady Corporation class A 62,600 2.6 2.6Brambles Industries Limited 770,575 6.7 6.7Brandywine Realty Trust 35,200 1.2 1.2Brascan Power Corporation 41.9 41.9Brasil Telecom Participacoes, S.A. 27,500 1.2 1.2Braskem, S.A. preferred A 140,457 1.3 1.3Brazilian Diamonds Limited 1,500,000 0.5 0.5Breakwater Resources, Ltd 16,625,700 11.3 11.3Brevan Howard Fund Limited fund units 435,193 61.8 61.8Bridgestone Corp. 382,800 9.3 9.3Bridgewater Pure Alpha Funds Ltd 27,685 53.6 188.0 241.6Briggs & Stratton Corporation 103,200 4.7 4.7Brightpoint, Inc. 55,000 1.8 1.8Brinker International, Inc. 10,978 0.5 0.5Brisa-Auto Estradas de Portugal, S.A. preferred 72,786 0.7 0.7Bristol-Myers Squibb Company 617,533 16.6 16.6British Aerospace Plc 2,705,516 20.7 20.7British Airways Plc 192,390 1.3 1.3British American Tobacco (Malaysia) Berhad 75,000 0.9 0.9British American Tobacco Plc 1,842,612 48.0 48.0British Energy Group Plc 89,952 0.9 0.9British Land Company Plc 220,080 4.7 4.7British Sky Broadcasting Group Plc 2,023,987 20.2 20.2Bro-X Minerals, Ltd 7,920 - -Broadcom Corporation class A 185,133 10.2 10.2Brookfield Asset Management, Inc. class A 742,007 43.5 43.5Brookfield Properties Corporation 216,600 7.4 7.4Brooks Automation, Inc. 61,617 0.9 0.9Brown & Brown 119,100 4.2 4.2Brown Shoe Company, Inc. 68,900 3.4 3.4Brown-Forman Corporation class B 42,072 3.4 3.4Brunswick Corporation 72,477 3.4 3.4Buhrmann N.V. 25,703 0.4 0.4Building Material Holding Corporation 44,100 3.5 3.5
84
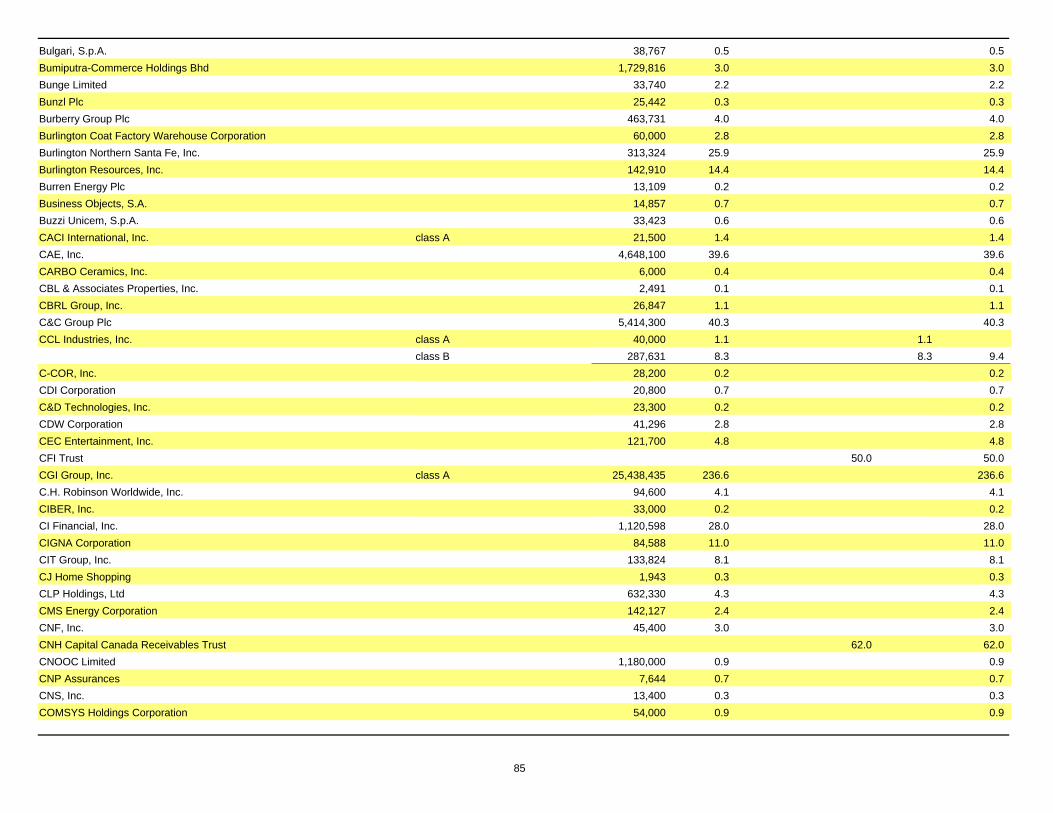
Bulgari, S.p.A. 38,767 0.5 0.5Bumiputra-Commerce Holdings Bhd 1,729,816 3.0 3.0Bunge Limited 33,740 2.2 2.2Bunzl Plc 25,442 0.3 0.3Burberry Group Plc 463,731 4.0 4.0Burlington Coat Factory Warehouse Corporation 60,000 2.8 2.8Burlington Northern Santa Fe, Inc. 313,324 25.9 25.9Burlington Resources, Inc. 142,910 14.4 14.4Burren Energy Plc 13,109 0.2 0.2Business Objects, S.A. 14,857 0.7 0.7Buzzi Unicem, S.p.A. 33,423 0.6 0.6CACI International, Inc. class A 21,500 1.4 1.4CAE, Inc. 4,648,100 39.6 39.6CARBO Ceramics, Inc. 6,000 0.4 0.4CBL & Associates Properties, Inc. 2,491 0.1 0.1CBRL Group, Inc. 26,847 1.1 1.1C&C Group Plc 5,414,300 40.3 40.3CCL Industries, Inc. class A 40,000 1.1 1.1
class B 287,631 8.3 8.3 9.4C-COR, Inc. 28,200 0.2 0.2CDI Corporation 20,800 0.7 0.7C&D Technologies, Inc. 23,300 0.2 0.2CDW Corporation 41,296 2.8 2.8CEC Entertainment, Inc. 121,700 4.8 4.8CFI Trust 50.0 50.0CGI Group, Inc. class A 25,438,435 236.6 236.6C.H. Robinson Worldwide, Inc. 94,600 4.1 4.1CIBER, Inc. 33,000 0.2 0.2CI Financial, Inc. 1,120,598 28.0 28.0CIGNA Corporation 84,588 11.0 11.0CIT Group, Inc. 133,824 8.1 8.1CJ Home Shopping 1,943 0.3 0.3CLP Holdings, Ltd 632,330 4.3 4.3CMS Energy Corporation 142,127 2.4 2.4CNF, Inc. 45,400 3.0 3.0CNH Capital Canada Receivables Trust 62.0 62.0CNOOC Limited 1,180,000 0.9 0.9CNP Assurances 7,644 0.7 0.7CNS, Inc. 13,400 0.3 0.3COMSYS Holdings Corporation 54,000 0.9 0.9
85

INVESTMENTS IN SHARES AND BONDS OF PUBLICLY TRADED COMPANIES as at December 31, 2005(fair value - in millions of dollars)
Designation ConvertibleSecurities
Bonds Subtotal Total
8
CORPORATIONS Shares Number Amount
(continued ) (continued)
CPI Corporation 17,500 0.4 0.4CQS Capital Structure Arbitrage Feeder Fund Limited fund units 30,101 43.0 43.0CQS Convertible and Quantitative Strategies Feeder Fund Limited fund units 27,497 35.4 35.4C. R. Bard, Inc. 49,960 3.8 3.8CRH Plc 1,142,548 39.1 39.1CS First Boston Mortgage Securities Corp. CMBS 136.7 136.7CSG Systems International, Inc. 135,500 3.5 3.5CSK Holdings Corporation 30,000 1.8 1.8CSL Limited 261,318 9.5 9.5CSR Plc 729 - -CSX Corporation 201,112 11.9 11.9CTB Financial Holding Company 2,573,000 2.0 2.0CTS Corporation 89,300 1.2 1.2CU, Inc. 11.2 11.2CVF Technologies Corporation 139,723 - -CVS Corporation 323,689 10.0 10.0CW Capital Cobalt 1 Ltd CMBS 39.1 39.1Cable & Wireless Plc 1,170,776 2.8 2.8Câble Satisfaction International, Inc. class A 29,038,064 0.2 0.2Cablevision Systems New York Group class A 25,200 0.7 0.7Cadbury Schweppes Plc 2,425,865 26.7 26.7Caemi Mineracao e Metalurgia, S.A. preferred 2,293,000 3.9 3.9Caisse Centrale Desjardins 247.0 247.0California Pizza Kitchen, Inc. 25,000 0.9 0.9Callaway Golf Company 38,500 0.6 0.6Calloway Real Estate Investment Trust fund units 43,100 1.0 1.0Caltex Australia Limited 127,500 2.1 2.1Cambior, Inc. 16,315,567 53.0 53.0
warrants series C 931,300 0.8 0.8warrants series D 796,000 0.2 0.2 54.0
Cambrex Corporation 48,800 1.1 1.1Camden Property Trust fund units 143,700 9.7 9.7Cameco Corporation 98.8 98.8Campbell Resources Inc. 2,573,524 0.4 0.4Campbell Soup Company 139,607 4.8 4.8
86

Can Cap Auto Rec Asset 39.5 39.5CanWest Global Communications Corp. 948,917 9.2 9.2Canada Housing Trust 4,409.1 4,409.1Canada Life Capital Trust 14.6 14.6Canada Mortgage Acceptance Corporation 103.2 103.2Canada Mortgage and Housing Corporation 746.6 746.6Canadian Apartment Properties (REIT) fund units 64,800 1.0 1.0Canadian Hotel Income Properties REIT fund units 35,300 0.4 0.4Canadian Hydro Developers, Inc. 9,369,369 54.6 54.6Canadian National Railway Co of Canada 2,701,526 251.6 251.6Canadian Natural Resources Limited 1,514,068 87.3 41.8 129.1Canadian Pacific Railway Co. 2,007,805 97.8 97.8Canadian Real Estate Investment Trust fund units 65,400 1.5 1.5Canadian Royalties Inc. 717,200 0.9 0.9Canbras Communications Corp. 526,600 - -Cancor Mines Inc. 1,529,084 0.3 0.3Canfor Corporation 950,000 12.8 12.8Canon Sales Co., Inc. 89,000 2.2 2.2Canon, Inc. 535,400 36.6 36.6Canspar Resources Inc. 234,666 - -Cap Gemini, S.A. 32,864 1.5 1.5Capio AB 56,669 1.2 1.2Capita Group Plc 250,000 2.1 2.1Capital Desjardins, Inc. 86.0 86.0Capital Gold Corporation 2,710,800 0.8 0.8
warrants 2,400,000 0.3 0.3 1.1Capital One Financial Corporation 210,649 21.3 21.3Capital Pro-Egaux, Inc. 2,338,753 0.2 0.2
warrants 611,111 - - 0.2Capitaland Limited 8,392,000 20.3 20.3Capitalia, S.p.A. 702,712 4.7 4.7CapitaMall Trust 980,000 1.5 1.5Captaris, Inc. 18,200 0.1 0.1Cardinal Health, Inc. 240,537 19.3 19.3Career Education Corporation 30,910 1.2 1.2Caremark Rx, Inc. 111,708 6.8 6.8Cargotec Corporation class B 8,378 0.3 0.3Carlsberg A/S class B 7,056 0.4 0.4Carnival Corporation 264,879 16.5 16.5Carnival Plc 174,221 11.5 11.5
87
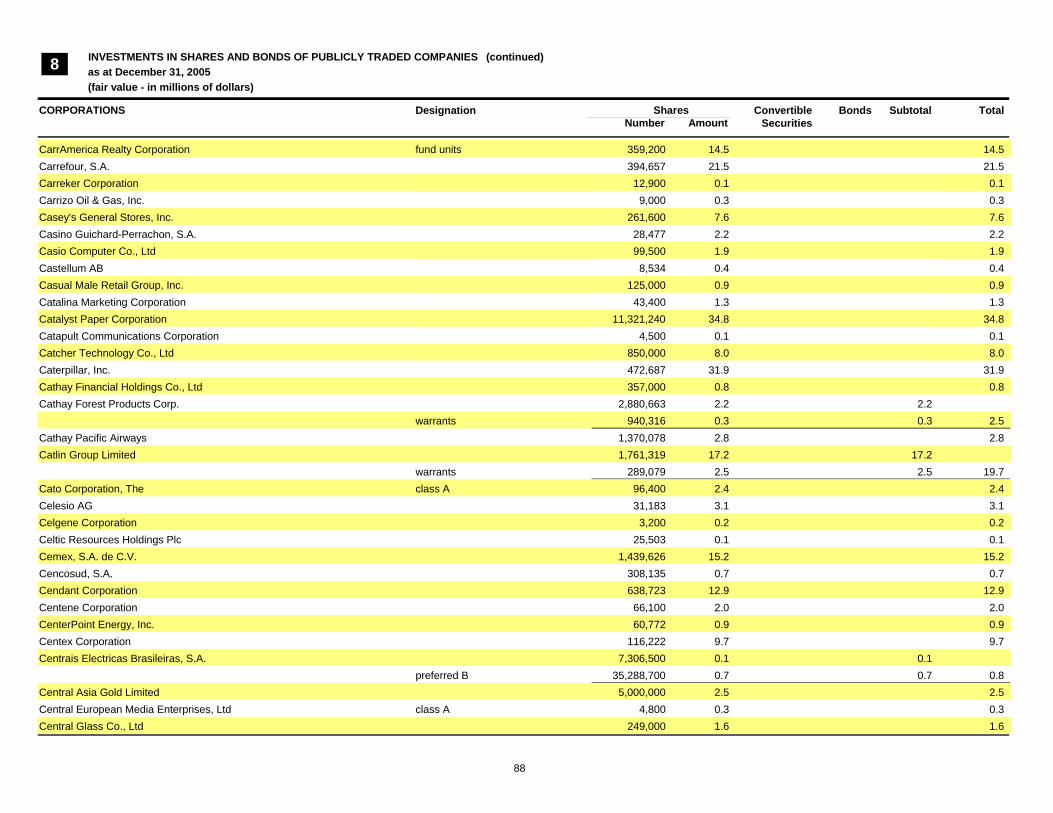
INVESTMENTS IN SHARES AND BONDS OF PUBLICLY TRADED COMPANIES as at December 31, 2005(fair value - in millions of dollars)
Designation ConvertibleSecurities
Bonds Subtotal Total
8
CORPORATIONS Shares Number Amount
(continued ) (continued)
CarrAmerica Realty Corporation fund units 359,200 14.5 14.5Carrefour, S.A. 394,657 21.5 21.5Carreker Corporation 12,900 0.1 0.1Carrizo Oil & Gas, Inc. 9,000 0.3 0.3Casey's General Stores, Inc. 261,600 7.6 7.6Casino Guichard-Perrachon, S.A. 28,477 2.2 2.2Casio Computer Co., Ltd 99,500 1.9 1.9Castellum AB 8,534 0.4 0.4Casual Male Retail Group, Inc. 125,000 0.9 0.9Catalina Marketing Corporation 43,400 1.3 1.3Catalyst Paper Corporation 11,321,240 34.8 34.8Catapult Communications Corporation 4,500 0.1 0.1Catcher Technology Co., Ltd 850,000 8.0 8.0Caterpillar, Inc. 472,687 31.9 31.9Cathay Financial Holdings Co., Ltd 357,000 0.8 0.8Cathay Forest Products Corp. 2,880,663 2.2 2.2
warrants 940,316 0.3 0.3 2.5Cathay Pacific Airways 1,370,078 2.8 2.8Catlin Group Limited 1,761,319 17.2 17.2
warrants 289,079 2.5 2.5 19.7Cato Corporation, The class A 96,400 2.4 2.4Celesio AG 31,183 3.1 3.1Celgene Corporation 3,200 0.2 0.2Celtic Resources Holdings Plc 25,503 0.1 0.1Cemex, S.A. de C.V. 1,439,626 15.2 15.2Cencosud, S.A. 308,135 0.7 0.7Cendant Corporation 638,723 12.9 12.9Centene Corporation 66,100 2.0 2.0CenterPoint Energy, Inc. 60,772 0.9 0.9Centex Corporation 116,222 9.7 9.7Centrais Electricas Brasileiras, S.A. 7,306,500 0.1 0.1
preferred B 35,288,700 0.7 0.7 0.8Central Asia Gold Limited 5,000,000 2.5 2.5Central European Media Enterprises, Ltd class A 4,800 0.3 0.3Central Glass Co., Ltd 249,000 1.6 1.6
88

Central Japan Railway Company 1,072 12.0 12.0Central Parking Corp. 33,200 0.5 0.5Centrica Plc 2,194,311 11.2 11.2Century Aluminum Company 300,000 9.2 9.2CenturyTel, Inc. 304,287 11.8 11.8Ceradyne, Inc. 28,900 1.5 1.5Cermaq ASA 5,800 - -Cerner Corporation 50,200 5.3 5.3Cesky Telecom, A.S. 13,289 0.3 0.3Challenger Financial Services Group Limited 450,000 1.6 1.6Chambers Street CDO, Ltd 0.2 0.2Champion Enterprises, Inc. 275,600 4.4 4.4Chariot Resources, Ltd 13,170,000 4.9 4.9
warrants 6,585,000 0.8 0.8 5.7Charles River Laboratories International, Inc. 46,200 2.3 2.3Charles Schwab Corporation, The 279,030 4.8 4.8Charter Plc 16,002 0.2 0.2Chartered Semiconductor Manufacturing Limited 943,000 0.9 0.9Chartwell Seniors Housing (REIT) fund units 58,300 0.9 0.9Chase Commercial Mortgage Securities Corp. CMBS 5.1 5.1Check Point Software Technologies, Ltd 91,100 2.1 2.1Checkfree Corp. 12,600 0.7 0.7Checkpoint Systems, Inc. 40,700 1.2 1.2Cheil Industries Inc. 4,630 0.2 0.2Chemed Corporation 49,400 2.9 2.9Chesapeake Energy Corporation 42,000 1.6 1.6Cheung Kong 1,569,935 18.8 18.8ChevronTexaco Corporation 3,688,661 244.6 244.6Chiba Bank, Ltd, The 459,000 4.5 4.5Chicago Bridge & Iron Company N.V. 55,000 1.6 1.6Children's Place Retail Stores, Inc., The 65,900 3.8 3.8China Construction Bank class H 370,000 0.2 0.2China Life Insurance Company Limited 197,000 0.2 0.2China Mengniu Dairy Company Limited 4,013,000 4.0 4.0China Merchants Holdings International Company Limited 410,962 1.0 1.0China Mobile (Hong Kong) Limited 5,412,800 29.9 29.9China National Aviation Company Limited 409,000 0.1 0.1China Overseas Land & Investment Limited 252,000 0.1 0.1China Petroleum and Chemical Corporation class H 36,057,387 20.9 20.9China Resources Power Holdings Company Limited 1,148,000 0.8 0.8
89

INVESTMENTS IN SHARES AND BONDS OF PUBLICLY TRADED COMPANIES as at December 31, 2005(fair value - in millions of dollars)
Designation ConvertibleSecurities
Bonds Subtotal Total
8
CORPORATIONS Shares Number Amount
(continued ) (continued)
China Shenhua Energy Company, Limited class H 3,136,000 4.0 4.0China Shipping Development Co., Ltd 2,416,367 2.1 2.1China Steel Corporation 352,000 0.3 0.3China Telecom Corporation Limited 23,387,262 10.0 10.0Chinatrust Financial Holdings Company, Ltd 5,592,858 5.2 5.2Chiron Corporation 37,368 1.9 1.9Chiyoda Corporation 66,000 1.8 1.8Choice Hotels International, Inc 14,088 0.7 0.7Christian Dior, S.A. 2,819 0.3 0.3Christopher & Banks Corporation 111,000 2.4 2.4Chromos Molecular Systems, Inc. 791,934 0.1 0.1Chubb Corporation, The 231,640 26.4 26.4Chubu Electric Power Company, Incorporated 271,200 7.5 7.5Chugai Pharmaceutical Co., Ltd 217,669 5.4 5.4Chunghwa Telecom Co., Ltd 2,958,500 6.7 6.7Ciba Specialty Chemicals AG 68,291 5.1 5.1Ciena Corporation 59,060 0.2 0.2Cimarex Energy Company 6,000 0.3 0.3Ciments Francais, S.A. 2,071 0.3 0.3Cimpor-Cimentos de Portugal SGPS, S.A. 60,966 0.4 0.4Cincinnati Bell, Inc. 2,238,900 9.2 9.2Cincinnati Financial Corporation 31,188 1.6 1.6Cinergy Corp. 20,914 1.0 1.0Cinram International, Inc. 555,000 15.2 15.2Cintas Corporation 22,203 1.1 1.1Cintra Concesiones de Infraestructuras de transporte, S.A. 43,329 0.6 0.6Circle K Sunkus Co., Ltd 19,800 0.6 0.6Circuit City Stores, Inc. 35,393 0.9 0.9Cisco Systems, Inc. 4,500,434 90.0 90.0Citadel Kensington Global Strategies Fund, Ltd fund units 31,251 82.0 82.0Citic International Financial Holdings, Ltd 138,000 0.1 0.1Citic Pacific, Ltd 322,000 1.0 1.0Citigroup Commercial Mortgage Securities CMBS 38.6 38.6Citigroup Finance Canada, Inc. 618.3 618.3Citigroup, Inc. 3,321,507 188.3 188.3
90
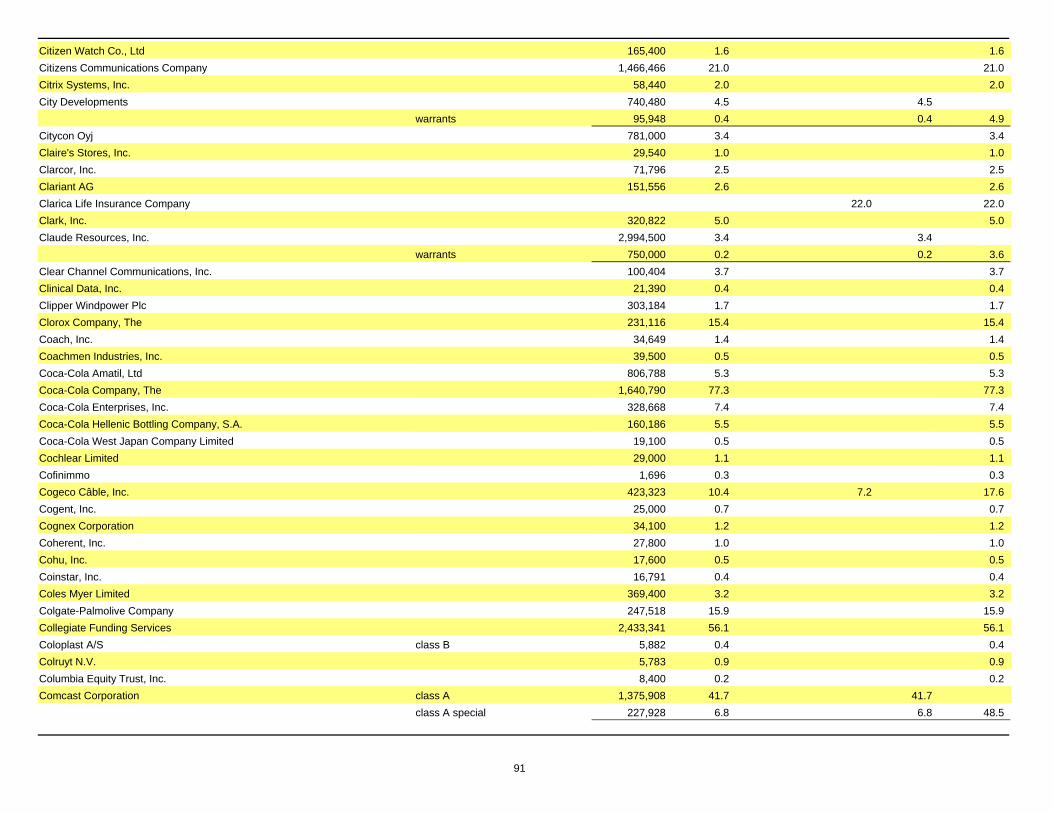
Citizen Watch Co., Ltd 165,400 1.6 1.6Citizens Communications Company 1,466,466 21.0 21.0Citrix Systems, Inc. 58,440 2.0 2.0City Developments 740,480 4.5 4.5
warrants 95,948 0.4 0.4 4.9Citycon Oyj 781,000 3.4 3.4Claire's Stores, Inc. 29,540 1.0 1.0Clarcor, Inc. 71,796 2.5 2.5Clariant AG 151,556 2.6 2.6Clarica Life Insurance Company 22.0 22.0Clark, Inc. 320,822 5.0 5.0Claude Resources, Inc. 2,994,500 3.4 3.4
warrants 750,000 0.2 0.2 3.6Clear Channel Communications, Inc. 100,404 3.7 3.7Clinical Data, Inc. 21,390 0.4 0.4Clipper Windpower Plc 303,184 1.7 1.7Clorox Company, The 231,116 15.4 15.4Coach, Inc. 34,649 1.4 1.4Coachmen Industries, Inc. 39,500 0.5 0.5Coca-Cola Amatil, Ltd 806,788 5.3 5.3Coca-Cola Company, The 1,640,790 77.3 77.3Coca-Cola Enterprises, Inc. 328,668 7.4 7.4Coca-Cola Hellenic Bottling Company, S.A. 160,186 5.5 5.5Coca-Cola West Japan Company Limited 19,100 0.5 0.5Cochlear Limited 29,000 1.1 1.1Cofinimmo 1,696 0.3 0.3Cogeco Câble, Inc. 423,323 10.4 7.2 17.6Cogent, Inc. 25,000 0.7 0.7Cognex Corporation 34,100 1.2 1.2Coherent, Inc. 27,800 1.0 1.0Cohu, Inc. 17,600 0.5 0.5Coinstar, Inc. 16,791 0.4 0.4Coles Myer Limited 369,400 3.2 3.2Colgate-Palmolive Company 247,518 15.9 15.9Collegiate Funding Services 2,433,341 56.1 56.1Coloplast A/S class B 5,882 0.4 0.4Colruyt N.V. 5,783 0.9 0.9Columbia Equity Trust, Inc. 8,400 0.2 0.2Comcast Corporation class A 1,375,908 41.7 41.7
class A special 227,928 6.8 6.8 48.5
91
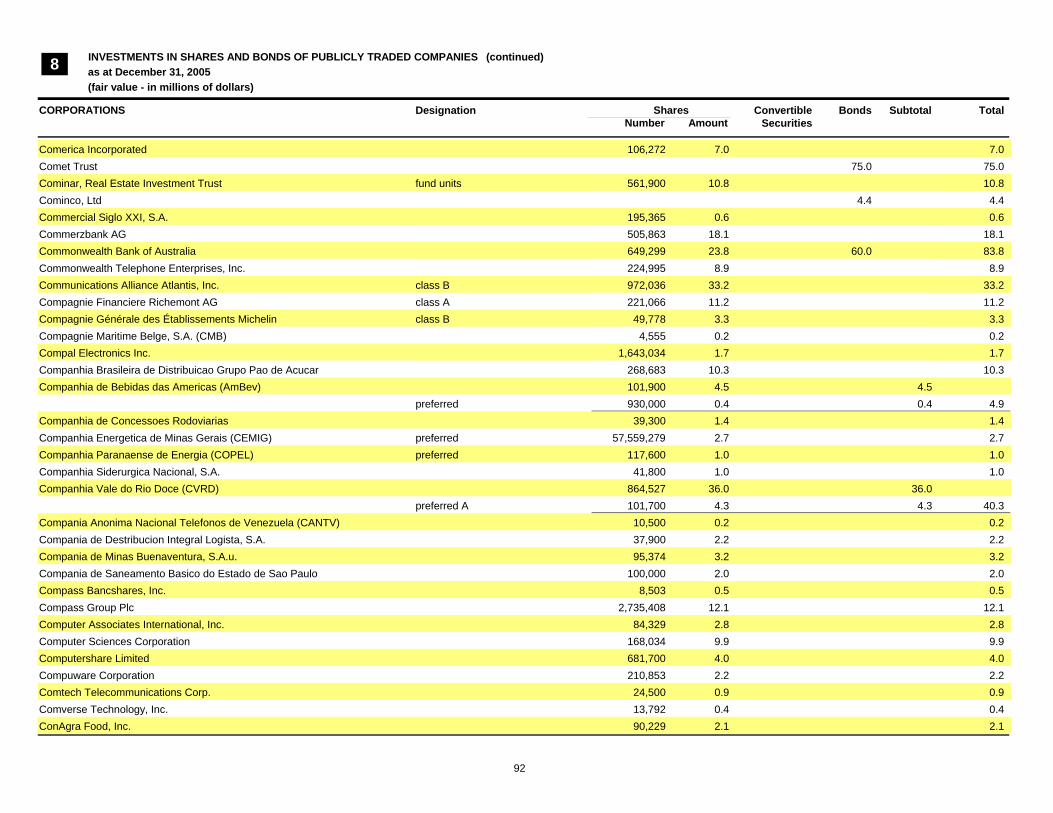
INVESTMENTS IN SHARES AND BONDS OF PUBLICLY TRADED COMPANIES as at December 31, 2005(fair value - in millions of dollars)
Designation ConvertibleSecurities
Bonds Subtotal Total
8
CORPORATIONS Shares Number Amount
(continued ) (continued)
Comerica Incorporated 106,272 7.0 7.0Comet Trust 75.0 75.0Cominar, Real Estate Investment Trust fund units 561,900 10.8 10.8Cominco, Ltd 4.4 4.4Commercial Siglo XXI, S.A. 195,365 0.6 0.6Commerzbank AG 505,863 18.1 18.1Commonwealth Bank of Australia 649,299 23.8 60.0 83.8Commonwealth Telephone Enterprises, Inc. 224,995 8.9 8.9Communications Alliance Atlantis, Inc. class B 972,036 33.2 33.2Compagnie Financiere Richemont AG class A 221,066 11.2 11.2Compagnie Générale des Établissements Michelin class B 49,778 3.3 3.3Compagnie Maritime Belge, S.A. (CMB) 4,555 0.2 0.2Compal Electronics Inc. 1,643,034 1.7 1.7Companhia Brasileira de Distribuicao Grupo Pao de Acucar 268,683 10.3 10.3Companhia de Bebidas das Americas (AmBev) 101,900 4.5 4.5
preferred 930,000 0.4 0.4 4.9Companhia de Concessoes Rodoviarias 39,300 1.4 1.4Companhia Energetica de Minas Gerais (CEMIG) preferred 57,559,279 2.7 2.7Companhia Paranaense de Energia (COPEL) preferred 117,600 1.0 1.0Companhia Siderurgica Nacional, S.A. 41,800 1.0 1.0Companhia Vale do Rio Doce (CVRD) 864,527 36.0 36.0
preferred A 101,700 4.3 4.3 40.3Compania Anonima Nacional Telefonos de Venezuela (CANTV) 10,500 0.2 0.2Compania de Destribucion Integral Logista, S.A. 37,900 2.2 2.2Compania de Minas Buenaventura, S.A.u. 95,374 3.2 3.2Compania de Saneamento Basico do Estado de Sao Paulo 100,000 2.0 2.0Compass Bancshares, Inc. 8,503 0.5 0.5Compass Group Plc 2,735,408 12.1 12.1Computer Associates International, Inc. 84,329 2.8 2.8Computer Sciences Corporation 168,034 9.9 9.9Computershare Limited 681,700 4.0 4.0Compuware Corporation 210,853 2.2 2.2Comtech Telecommunications Corp. 24,500 0.9 0.9Comverse Technology, Inc. 13,792 0.4 0.4ConAgra Food, Inc. 90,229 2.1 2.1
92
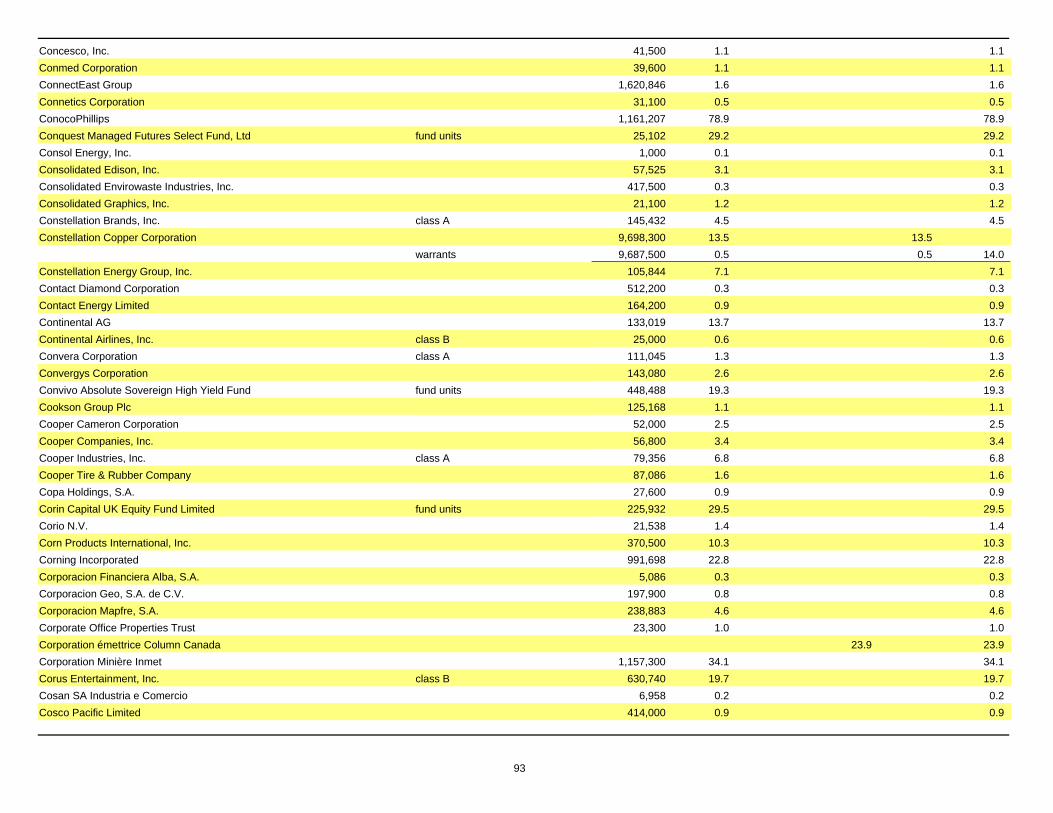
Concesco, Inc. 41,500 1.1 1.1Conmed Corporation 39,600 1.1 1.1ConnectEast Group 1,620,846 1.6 1.6Connetics Corporation 31,100 0.5 0.5ConocoPhillips 1,161,207 78.9 78.9Conquest Managed Futures Select Fund, Ltd fund units 25,102 29.2 29.2Consol Energy, Inc. 1,000 0.1 0.1Consolidated Edison, Inc. 57,525 3.1 3.1Consolidated Envirowaste Industries, Inc. 417,500 0.3 0.3Consolidated Graphics, Inc. 21,100 1.2 1.2Constellation Brands, Inc. class A 145,432 4.5 4.5Constellation Copper Corporation 9,698,300 13.5 13.5
warrants 9,687,500 0.5 0.5 14.0Constellation Energy Group, Inc. 105,844 7.1 7.1Contact Diamond Corporation 512,200 0.3 0.3Contact Energy Limited 164,200 0.9 0.9Continental AG 133,019 13.7 13.7Continental Airlines, Inc. class B 25,000 0.6 0.6Convera Corporation class A 111,045 1.3 1.3Convergys Corporation 143,080 2.6 2.6Convivo Absolute Sovereign High Yield Fund fund units 448,488 19.3 19.3Cookson Group Plc 125,168 1.1 1.1Cooper Cameron Corporation 52,000 2.5 2.5Cooper Companies, Inc. 56,800 3.4 3.4Cooper Industries, Inc. class A 79,356 6.8 6.8Cooper Tire & Rubber Company 87,086 1.6 1.6Copa Holdings, S.A. 27,600 0.9 0.9Corin Capital UK Equity Fund Limited fund units 225,932 29.5 29.5Corio N.V. 21,538 1.4 1.4Corn Products International, Inc. 370,500 10.3 10.3Corning Incorporated 991,698 22.8 22.8Corporacion Financiera Alba, S.A. 5,086 0.3 0.3Corporacion Geo, S.A. de C.V. 197,900 0.8 0.8Corporacion Mapfre, S.A. 238,883 4.6 4.6Corporate Office Properties Trust 23,300 1.0 1.0Corporation émettrice Column Canada 23.9 23.9Corporation Minière Inmet 1,157,300 34.1 34.1Corus Entertainment, Inc. class B 630,740 19.7 19.7Cosan SA Industria e Comercio 6,958 0.2 0.2Cosco Pacific Limited 414,000 0.9 0.9
93

INVESTMENTS IN SHARES AND BONDS OF PUBLICLY TRADED COMPANIES as at December 31, 2005(fair value - in millions of dollars)
Designation ConvertibleSecurities
Bonds Subtotal Total
8
CORPORATIONS Shares Number Amount
(continued ) (continued)
Cosette Communication Group, Inc. 1,019,200 10.2 10.2Cosmote Mobile Communications, S.A. 512,956 13.3 13.3Cost Plus, Inc. 148,500 3.0 3.0Costco Wholesale Corporation 300,280 17.4 17.4Countrywide Financial Corporation 737,864 29.5 29.5Coventry Health Care, Inc. 55,392 3.7 3.7Crane Co. 54,400 2.2 2.2Credicorp Limited 31,565 0.8 0.8Credit Agricole, S.A. 240,381 8.8 8.8Crédit Ford du Canada Limitée 155.2 155.2Credit John Deere, Inc. 6.9 6.9Credit Saison Co., Ltd 263,400 15.4 15.4Credit Suisse Group 1,215,920 72.2 72.2Credito Emiliano, S.p.A. 75,024 1.0 1.0Crest, Ltd CMBS 332.2 332.2Crest Clarendon Street CMBS 1.1 1.1Crest Exeter Street Solar CMBS 1.9 1.9Crestline Offshore Fund, Ltd fund units 410,648 59.5 59.5Cross Country Healthcare, Inc. 39,711 0.8 0.8Crown Castle International Corp. 112,300 3.5 3.5Crown Holdings, Inc. 3,700 0.1 0.1CryoCath Technologies, Inc. 2,260,400 9.7 9.7CryoLife, Inc. 20,400 0.1 0.1Cubic Corporation 15,500 0.4 0.4Cubist Pharmaceuticals, Inc. 24,686 0.6 0.6Cumerio, S.A. 16,000 - -Cummins, Inc. 76,490 8.0 8.0Curtiss-Wright Corp. 31,360 2.0 2.0Cyberonics, Inc. 20,300 0.8 0.8Cymer, Inc. 33,100 1.4 1.4Cypress Bioscience, Inc. 505,599 3.4 3.4DAXEX indexed fund units 48,851 3.5 3.5DBS Group Holdings Limited 980,423 11.4 11.4D-Box Technologies, Inc. 1 - -DCA Group Limited 1,130,000 3.8 3.8
94

DCC Plc 19,506 0.5 0.5D. Carnegie & Co AB 9,576 0.2 0.2D.E. Shaw Composite International Fund fund units 5,960 97.3 97.3D.E. Shaw Oculus International Fund fund units 3,521 61.2 61.2DIRECTV Group, Inc., The 456,700 7.5 7.5DJ Orthopedics, Inc. 19,400 0.6 0.6DKR Quantitative Strategies Fund II Ltd fund units 10,000 12.6 12.6DKR Quantitative Strategies Fund Ltd fund units 12,288 27.8 27.8DKR Soundshore Oasis Fund, Ltd fund units 29,940 54.4 54.4DLJ Commercial Mortgage Corp. CMBS 5.2 5.2DNB NOR, ASA 509,989 6.3 6.3D.R. Horton, Inc. 28,685 1.2 1.2DRS Technologies, Inc. 31,700 1.9 1.9DSG International Plc 2,419,216 7.9 7.9DSL.net, Inc. 5,924,604 0.3 0.3DSP Group, Inc. 13,399 0.4 0.4DSV, De Sammensluttede Vognmaend 4,614 0.7 0.7DTE Energy Company 83,741 4.2 4.2DTS, Inc. 145,600 2.5 2.5DX Services Plc 48,877 0.3 0.3Daegu Bank 179,400 3.2 3.2Daelim Industrial Co., Ltd 25,100 2.1 2.1Daewoo Shipbuilding & Marine Engineering Co., Ltd 318,530 10.1 10.1Dah Sing Banking Group, Ltd 1,367,000 2.9 2.9Dai Nippon Printing Co., Ltd 393,500 8.2 8.2Daicel Chemical Industries, Ltd 227,000 1.9 1.9Daido Steel Co., Ltd 420,000 4.7 4.7Daiichi Sankyo Company, Limited 350,985 7.9 7.9Daikin Industries, Ltd 210,900 7.2 7.2Daimaru, Inc., The 100,000 1.7 1.7DaimlerChrysler AG 351,272 20.9 20.9DaimlerChrysler Canada Finance, Inc. 319.9 319.9Dainippon INK & Chemical Incorporated 292,000 1.5 1.5Dainippon Screen Mfg Co., Ltd 124,000 1.2 1.2Dairy Crest Group Plc 6,332 0.1 0.1Dairy Farm International Holdings Limited 330,000 1.4 1.4Daishin Securities Company 100,000 2.6 2.6Daito Trust Construction Co., Ltd 35,700 2.2 2.2Daiwa House Industry Co., Ltd 318,500 5.8 5.8Daiwa Securities Group, Inc. 582,000 7.7 7.7
95
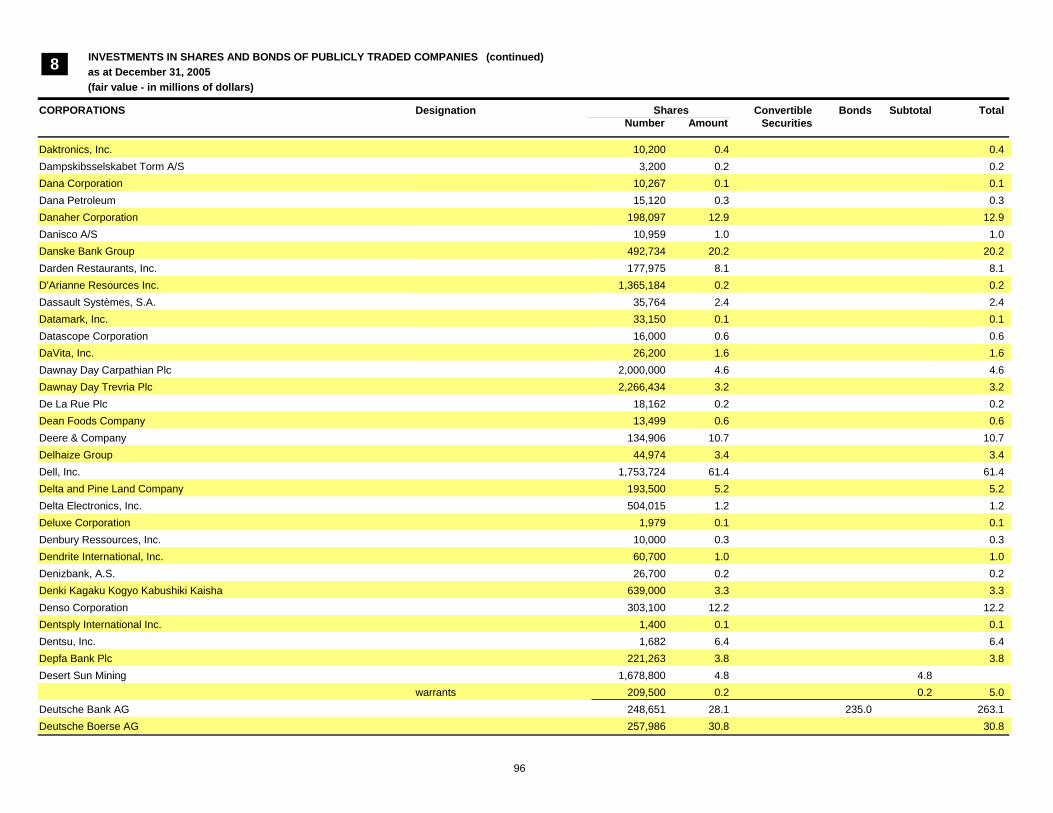
INVESTMENTS IN SHARES AND BONDS OF PUBLICLY TRADED COMPANIES as at December 31, 2005(fair value - in millions of dollars)
Designation ConvertibleSecurities
Bonds Subtotal Total
8
CORPORATIONS Shares Number Amount
(continued ) (continued)
Daktronics, Inc. 10,200 0.4 0.4Dampskibsselskabet Torm A/S 3,200 0.2 0.2Dana Corporation 10,267 0.1 0.1Dana Petroleum 15,120 0.3 0.3Danaher Corporation 198,097 12.9 12.9Danisco A/S 10,959 1.0 1.0Danske Bank Group 492,734 20.2 20.2Darden Restaurants, Inc. 177,975 8.1 8.1D'Arianne Resources Inc. 1,365,184 0.2 0.2Dassault Systèmes, S.A. 35,764 2.4 2.4Datamark, Inc. 33,150 0.1 0.1Datascope Corporation 16,000 0.6 0.6DaVita, Inc. 26,200 1.6 1.6Dawnay Day Carpathian Plc 2,000,000 4.6 4.6Dawnay Day Trevria Plc 2,266,434 3.2 3.2De La Rue Plc 18,162 0.2 0.2Dean Foods Company 13,499 0.6 0.6Deere & Company 134,906 10.7 10.7Delhaize Group 44,974 3.4 3.4Dell, Inc. 1,753,724 61.4 61.4Delta and Pine Land Company 193,500 5.2 5.2Delta Electronics, Inc. 504,015 1.2 1.2Deluxe Corporation 1,979 0.1 0.1Denbury Ressources, Inc. 10,000 0.3 0.3Dendrite International, Inc. 60,700 1.0 1.0Denizbank, A.S. 26,700 0.2 0.2Denki Kagaku Kogyo Kabushiki Kaisha 639,000 3.3 3.3Denso Corporation 303,100 12.2 12.2Dentsply International Inc. 1,400 0.1 0.1Dentsu, Inc. 1,682 6.4 6.4Depfa Bank Plc 221,263 3.8 3.8Desert Sun Mining 1,678,800 4.8 4.8
warrants 209,500 0.2 0.2 5.0Deutsche Bank AG 248,651 28.1 235.0 263.1Deutsche Boerse AG 257,986 30.8 30.8
96

Deutsche Lufthansa AG 216,350 3.7 3.7Deutsche Mortgage & Asset Receiving Corporation CMBS 31.5 31.5Deutsche Post AG 535,108 15.1 15.1Deutsche Postbank AG 41,863 2.8 2.8Deutsche Telekom AG 2,005,113 38.9 38.9Deutsche Wohnen AG 2,160 0.6 0.6Developers Diversified Realty Corporation fund units 211,700 11.6 11.6Devon Energy Corporation 188,017 13.7 13.7DeVry, Inc. 167,300 3.9 3.9Dexia 151,246 4.1 4.1Diageo Plc 2,671,542 45.1 45.1Diagnostic Products Corporation 35,800 2.0 2.0Diagnosticos da America, S.A. 298,017 6.5 6.5Dialog Telekom Limited 2,538,900 0.5 0.5Diamond Offshore Drilling, Inc. 70,000 5.7 5.7Diamonds North Resources, Ltd 250,000 0.2 0.2
warrants 125,000 - - 0.2Diana Shipping, Inc. 109,400 1.6 1.6Digi International, Inc. 12,100 0.2 0.2Digital Insight Corporation 35,500 1.3 1.3Dillard's, Inc. class A 16,806 0.5 0.5Dionex Corporation 29,500 1.7 1.7Dios Exploration Inc. 748,969 0.2 0.2Distressed Opportunities International, Inc. 100 - -Ditech Communications Corporation 39,629 0.4 0.4Ditem Inc. 407,800 - -Dofasco, Inc. 43.4 43.4Dogan Sirketler Grubu Holding, A.S. 552,531 2.1 2.1Dogus Otomotiv Servis ve Ticaret, A.S. 18,350 0.1 0.1Dollar General Corporation 75,618 1.7 1.7Dollar Tree Stores, Inc. 143,800 4.0 4.0Dominion Resources, Inc. 174,221 15.7 15.7Domtar, Inc. 36,550,224 245.3 245.3Dongbu Insurance Co., Ltd 23,500 0.6 0.6Dongwon Financial Holding Co., Ltd 8,700 0.4 0.4Donnelley (R.R.) & Sons Company 31,736 1.3 1.3Dorel Industries, Ltd class B 2,237,350 61.8 61.8Doric Focus Fund fund units 159,413 24.4 24.4Douglas Holding AG 7,325 0.3 0.3Dover Corporation 13,837 0.6 0.6
97

INVESTMENTS IN SHARES AND BONDS OF PUBLICLY TRADED COMPANIES as at December 31, 2005(fair value - in millions of dollars)
Designation ConvertibleSecurities
Bonds Subtotal Total
8
CORPORATIONS Shares Number Amount
(continued ) (continued)
Dow Chemical Company 543,444 27.8 27.8Dow Jones & Company, Inc. 4,028 0.2 0.2Dowa Mining Co., Ltd 473,000 6.0 6.0Dragon Oil Plc 600,057 2.4 2.4Draxis Health, Inc. 545,000 2.8 2.8
warrants 34,500 - - 2.8Dress Barn, Inc. 59,100 2.7 2.7Drew Industries Incorporated 48,200 1.6 1.6Dufry Group AG 3,657 0.3 0.3Duke Energy Corporation 138,230 4.4 4.4Dun & Bradstreet Corporation 12,223 1.0 1.0Dundee Bancorp, Inc. 15.1 15.1Dundee Real Estate Investment Trust fund units 20,100 0.5 0.5Dundee Wealth Management, Inc. 1,130,370 11.4 11.4Durect Corporation 650,000 3.8 3.8Dynacor Inc. 5,388,941 1.3 1.3Dynatec Corporation 2,250,000 2.7 2.7Dynavax Technologies Corporation 62,023 0.3 0.3Dynegy, Inc. class A 20,570 0.1 0.1eAccess, Ltd 565 0.5 0.5eBay, Inc. 421,891 21.3 21.3EDO Corporation 44,000 1.4 1.4EDP-Energias de Portugal, S.A. 1,834,971 6.6 6.6EDP-Energias do Brasil, S.A. 31,300 0.4 0.4EFG Eurobank Ergasias, S.A. 108,044 4.0 4.0EGL, Inc. 42,300 1.9 1.9EMAP Plc 18,219 0.3 0.3EMC Corporation 1,774,436 28.2 28.2EMCOR Group, Inc. 19,900 1.6 1.6EMI Group Plc 888,443 4.3 4.3EMSAF Mauritius fund units 657,938 18.0 18.0ENSCO International Incorporated 1,700 0.1 0.1EOG Resources, Inc. 83,994 7.2 7.2EPIQ Systems, Inc. 8,900 0.2 0.2EPIX Medical, Inc. 40,000 0.2 0.2
98

ESS Technology 19,400 0.1 0.1E.Sun Financial Holding Company, Ltd 249,000 0.2 0.2E*Trade Financial Corporation 54,129 1.3 1.3E*Trade Securities Co., Ltd 167 1.5 1.5EVA Airways Corp. 3,381,030 1.9 1.9E.I. du Pont de Nemours and Company 364,356 18.1 18.1E.W. Scripps Company, The class A 63,708 3.6 3.6Eagle Bulk Shipping, Inc. 25,000 0.5 0.5Eagle Yield Enhancement Fund, Ltd fund units 196,284 26.4 26.4East Japan Railway Company 2,216 17.8 17.8Eastmain Resources Inc. 767,500 0.5 0.5Eastman Chemical Company 55,659 3.4 3.4Eastman Kodak Company 396,309 10.8 10.8Eaton Corporation 98,805 7.7 7.7Ebara Corporation 131,000 0.8 0.8Ebro Puleva, S.A. 33,192 0.6 0.6EchoStar Communications Corporation class A 45,941 1.5 1.5Ecolab, Inc. 23,186 1.0 1.0Ecopia BioSciences, Inc. warrants 25,000 - -Eczacibasi Ilac Sanayi ve Ticaret A.S. 143,400 0.5 0.5Edgars Consolidated Stores Limited 916,310 5.9 5.9Edison International 303,361 15.4 15.4Education Management Corporation 14,820 0.6 0.6Edwards Lifesciences Corporation 500 - -eFunds Corporation 23,100 0.6 0.6Egerton European Dollar Fund Limited, The fund units 126,690 12.1 12.1Egis Rt. 8,162 1.0 1.0Egyptian Company Mobile Services 31,400 1.3 1.3Eircom Group Plc 237,411 0.6 0.6Eisai Co., Ltd 122,000 6.0 6.0El Paso Corporation 52,516 0.8 0.8Elan Corporation Plc 93,387 1.5 1.5Eldorado Gold Corporation 515,539 2.9 2.9Electric Power Development Co., Ltd 63,900 2.6 2.6Electricite de France 7,584 0.3 0.3Electro Scientific Industries, Inc. 29,700 0.8 0.8Electrolux AB class B 65,199 2.0 2.0Electronic Arts, Inc. 215,422 13.2 13.2Electronic Data Systems Corporation 216,608 6.1 6.1Electrovaya, Inc. 1,699,936 0.6 0.6
99

INVESTMENTS IN SHARES AND BONDS OF PUBLICLY TRADED COMPANIES as at December 31, 2005(fair value - in millions of dollars)
Designation ConvertibleSecurities
Bonds Subtotal Total
8
CORPORATIONS Shares Number Amount
(continued ) (continued)
Elekta AB class B 30,903 0.5 0.5Elior 300,000 4.6 4.6Elisa Oyj class A 150,198 3.2 3.2ElkCorp 28,200 1.1 1.1Ellerine Holdings Limited 250,000 2.9 2.9Elpida Memory, Inc. 81,900 2.8 2.8Embotelladora Andina, S.A. class B 31,000 0.5 0.5
preferred B 164,100 0.5 0.5 1.0Emerging Markets Global Small Capitalization Fund fund units 579,656 10.3 10.3Emerging Markets Middle East Fund fund units 66,393 1.3 1.3Emergis, Inc. 1,022,772 4.2 4.2Emerson Electric Co. 224,159 19.6 19.6Emporiki Bank of Greece, S.A. 19,011 0.8 0.8Empresa Nacional de Electricidad, S.A. 1,572,322 4.0 4.0Empresas ICA, S.A. de C.V. 1,018,899 3.3 3.3Enagas 224,990 4.9 4.9Enbridge Gas Distribution, Inc. 32.3 32.3Enbridge Pipelines 14.0 14.0EnCana Corporation 10,162,010 534.1 55.3 589.4Endesa, S.A. 361,536 11.1 11.1Endo Pharmaceuticals Holdings, Inc. 19,600 0.7 0.7Enel, S.p.A. 1,578,263 14.4 14.4Enerflex Systems, Ltd 1,946,800 52.2 52.2Energia Del Sur, S.A. 38,014 0.1 0.1Energizer Holdings, Inc. 1,700 0.1 0.1Energy East Corporation 4,668 0.1 0.1Energy Resources Of Australia Limited 30,000 0.2 0.2Energy Savings Income Fund fund units 912,300 17.3 17.3Enersis, S.A. 34,400 0.4 0.4Engelhard Corporation 36,787 1.3 1.3Enghouse Systems Limited 2,034,200 16.3 16.3Engineered Support Systems, Inc. 55,550 2.7 2.7Enhanced Mortgage-Backed Securities 2.9 2.9Eniro AB 230,402 3.4 3.4EnPro Industries, Inc. 26,200 0.8 0.8
100

Ensign Energy Services, Inc. 434,660 20.4 20.4Ente Nazionale Idrocarburi 2,397,906 77.4 77.4Entergy Corporation 161,805 13.0 13.0Enterprise Inns Plc 218,089 4.1 4.1Enzo Biochem, Inc. 46,100 0.7 0.7E.on AG 527,661 63.5 63.5Epcor Utilities, Inc. 83.7 83.7Epcos AG 10,754 0.2 0.2Epoch Overseas, Ltd fund units 1,645 1.7 1.7Equifax, Inc. 93,731 4.2 4.2Equity Office Properties Trust fund units 363,531 12.9 12.9Equity Residential 31,775 1.4 1.4Eregli Demir Ve Celik Fabrikalari T.A.S 20,278 0.2 0.2eResearch Technology, Inc. 30,000 0.5 0.5Erste Bank der oesterreichischen Sparkassen AG 89,529 5.8 5.8Esprit Holdings Limited 1,286,967 10.7 10.7Essex Property Trust, Inc. fund units 149,660 16.1 16.1Essilor International, S.A. 66,625 6.3 6.3Estee Lauder Companies, Inc., The class A 3,500 0.1 0.1Esterline Technologies Corporation 31,100 1.4 1.4Ethan Allen Interiors, Inc. 232,336 9.9 9.9Eurazeo, S.A. 1,242 0.2 0.2Eureka (Euro) Fund Limited, The fund units 49,836 6.9 6.9Eureka (US$) Fund Limited, The fund units 19,185 8.3 8.3Eureka Interactive Fund Limited, The fund units 198,472 27.8 27.8Euronav, S.A. 4,041 0.1 0.1Euronext N.V. 81,313 4.9 4.9European Aeronautic Defense and Space Company 180,705 7.9 7.9European Minerals Corporation 2,126,150 2.1 2.1
warrants 3,606,075 1.3 1.3 3.4Everest Re Group, Ltd 31,757 3.7 3.7Evergreen Solar, Inc. 315,410 3.9 3.9Everton Resources Inc. 351,214 0.2 0.2Evraz Group, S.A. 65,819 1.4 1.4Exar Corporation 23,682 0.4 0.4Exedy Corporation 5,900 0.2 0.2Exelixis, Inc. 206,056 2.3 2.3Exelon Corporation 427,455 26.5 26.5Expedia, Inc. 317,299 8.9 8.9Express Scripts, Inc. 117,943 11.6 11.6
101

INVESTMENTS IN SHARES AND BONDS OF PUBLICLY TRADED COMPANIES as at December 31, 2005(fair value - in millions of dollars)
Designation ConvertibleSecurities
Bonds Subtotal Total
8
CORPORATIONS Shares Number Amount
(continued ) (continued)
Exxon Mobil Corporation 9,087,570 596.3 596.3FEI Co. 18,400 0.4 0.4FHB Land Credit and Mortgage Bank Rt 14,400 0.1 0.1FLIR Systems, Inc 85,500 2.2 2.2FLSmidth & Co A/S class B 6,069 0.2 0.2FMF Capital Group, Ltd 1.6 1.6FNX Mining Company, Inc. 1,474,300 20.0 20.0FPL Group, Inc. 277,291 13.5 13.5FRM Tail Hedge, Ltd fund units 93,296 10.0 10.0FRV Media, Inc. warrants 866,242 - -
class A 6,041,390 1.5 1.5 1.5Fabege AB 16,900 0.4 0.4Factset Research Systems, Inc. 29,100 1.4 1.4Fadesa Inmobiliaria, S.A. 440,207 16.9 16.9Fair Isaac Corporation 24,200 1.2 1.2Fairfield Paradigm Fund, Ltd fund units 26,802 34.7 34.7Fairfield Street Solar CMBS 6.8 6.8Fairmont Hotels & Resorts, Inc. 966,209 47.5 47.5FairPoint Communications, Inc. 188,367 2.3 2.3Fairwest Energy Corporation 168,655 0.1 0.1Faith, Inc. 313 0.2 0.2Falcon Trust Commercial Mortgage 12.5 12.5Falconbridge Limited 7,617,198 262.8 262.8Family Dollar Stores, Inc. 21,801 0.6 0.6FamilyMart Co., Ltd 88,400 3.5 3.5Fannie Mae 559,719 31.9 332.7 364.6Fanuc, Ltd 115,000 11.4 11.4Far Eastern Textile, Ltd 393,000 0.3 0.3Far EasTone Telecommunications Co., Ltd 124,000 0.2 0.2Farallon Capital Offshore Investors, Inc. fund units 5,199,516 97.8 97.8Farm Credit Canada 90.7 90.7Fast Retailing Co., Ltd 31,000 3.5 3.5Fauji Fertilizer Company, Ltd 20,350 - -Federated Department Stores 150,186 11.6 11.6Federated Investors, Inc. class B 37,481 1.6 1.6
102
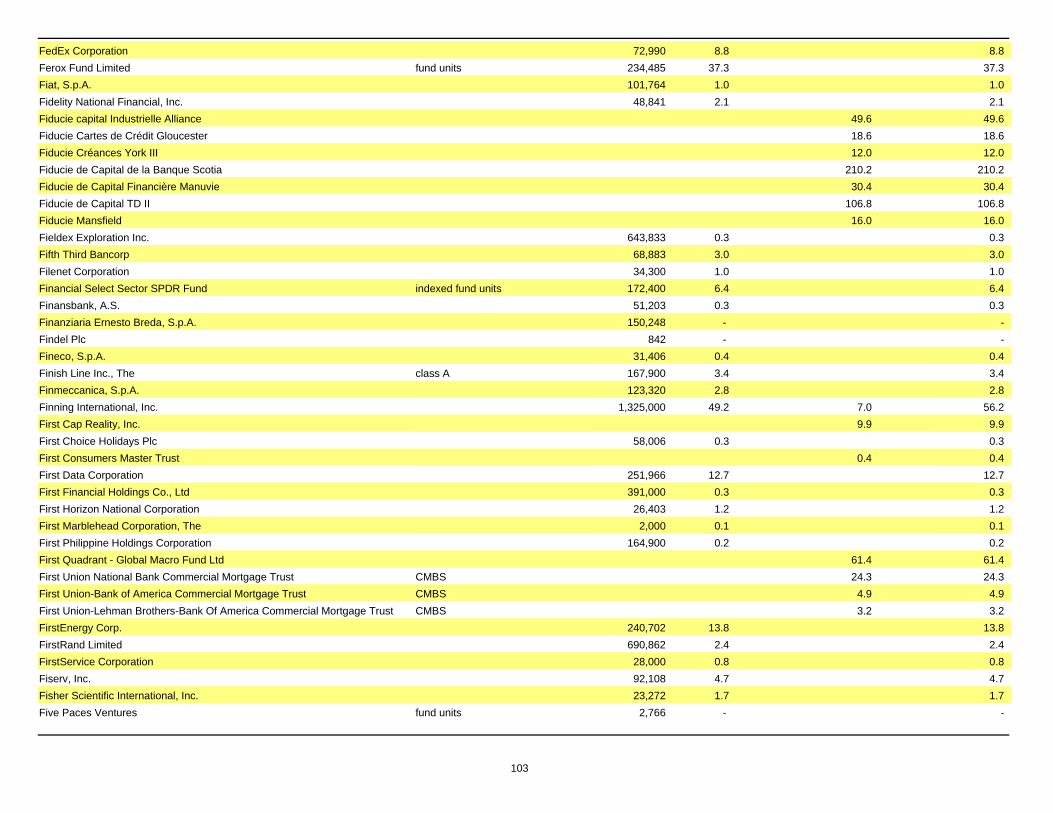
FedEx Corporation 72,990 8.8 8.8Ferox Fund Limited fund units 234,485 37.3 37.3Fiat, S.p.A. 101,764 1.0 1.0Fidelity National Financial, Inc. 48,841 2.1 2.1Fiducie capital Industrielle Alliance 49.6 49.6Fiducie Cartes de Crédit Gloucester 18.6 18.6Fiducie Créances York III 12.0 12.0Fiducie de Capital de la Banque Scotia 210.2 210.2Fiducie de Capital Financière Manuvie 30.4 30.4Fiducie de Capital TD II 106.8 106.8Fiducie Mansfield 16.0 16.0Fieldex Exploration Inc. 643,833 0.3 0.3Fifth Third Bancorp 68,883 3.0 3.0Filenet Corporation 34,300 1.0 1.0Financial Select Sector SPDR Fund indexed fund units 172,400 6.4 6.4Finansbank, A.S. 51,203 0.3 0.3Finanziaria Ernesto Breda, S.p.A. 150,248 - -Findel Plc 842 - -Fineco, S.p.A. 31,406 0.4 0.4Finish Line Inc., The class A 167,900 3.4 3.4Finmeccanica, S.p.A. 123,320 2.8 2.8Finning International, Inc. 1,325,000 49.2 7.0 56.2First Cap Reality, Inc. 9.9 9.9First Choice Holidays Plc 58,006 0.3 0.3First Consumers Master Trust 0.4 0.4First Data Corporation 251,966 12.7 12.7First Financial Holdings Co., Ltd 391,000 0.3 0.3First Horizon National Corporation 26,403 1.2 1.2First Marblehead Corporation, The 2,000 0.1 0.1First Philippine Holdings Corporation 164,900 0.2 0.2First Quadrant - Global Macro Fund Ltd 61.4 61.4First Union National Bank Commercial Mortgage Trust CMBS 24.3 24.3First Union-Bank of America Commercial Mortgage Trust CMBS 4.9 4.9First Union-Lehman Brothers-Bank Of America Commercial Mortgage Trust CMBS 3.2 3.2FirstEnergy Corp. 240,702 13.8 13.8FirstRand Limited 690,862 2.4 2.4FirstService Corporation 28,000 0.8 0.8Fiserv, Inc. 92,108 4.7 4.7Fisher Scientific International, Inc. 23,272 1.7 1.7Five Paces Ventures fund units 2,766 - -
103

INVESTMENTS IN SHARES AND BONDS OF PUBLICLY TRADED COMPANIES as at December 31, 2005(fair value - in millions of dollars)
Designation ConvertibleSecurities
Bonds Subtotal Total
8
CORPORATIONS Shares Number Amount
(continued ) (continued)
Fleetwood Enterprises, Inc. 193,100 2.8 2.8Fletcher Building Limited 256,730 1.5 1.5Flextronics International, Ltd 148,100 1.8 1.8Florida East Coast Industries, Inc. 27,000 1.3 1.3Florida Rock Industries, Inc. 30,000 1.7 1.7Flowers Foods, Inc. 267,550 8.6 8.6Flughafen Wien AG 11,904 1.0 1.0Fluor Corporation 28,928 2.6 2.6Folli - Follie 3,616 0.1 0.1Fomento de Construcciones y Contratas, S.A. 15,304 1.0 1.0Fomento Economico Mexicano, S.A. de C.V. 195,022 11.1 11.1Fondiaria - Sai, S.p.A. 31,185 1.2 1.2Fonds Arbitrage de Revenu Fixe Cura 25.2 25.2Fonds d'Arbitrage Améthyste fund units 1,954,015 19.0 19.0Fonds de Placement Immobilier InnVest fund units 53,800 0.7 0.7Fonds Hexavest de répartition tactique d'actifs 4.6 4.6Fonds MBS, Caspian 42.1 42.1Fonds Mistral 6.0 6.0Fonds Momentum Landry Morin 5.7 5.7Ford Motor Company 547,951 4.9 4.9Ford OtomotivSanayi, A.S. 462,800 4.7 4.7ForeningsSparbanken AB (Swedbank) 79,003 2.5 2.5Forest Laboratories, Inc. 431,309 20.5 20.5Formosa Chemicals & Fibre Corporation 248,000 0.5 0.5Formosa Plastic Corporation 632,402 1.1 1.1Fort Global Offshore Fund, spc fund units 25,285 34.3 34.3Fortis 579,878 21.5 21.5Fortis, Inc. 1,246,000 30.2 11.2 41.4FortisAlberta, Inc. 16.7 16.7Fortum Oyj 682,246 14.9 14.9Fortune Brands, Inc. 23,876 2.2 2.2Forward Air Corporation 62,600 2.7 2.7Forzani Group, Ltd, The class A 500,000 6.5 6.5Foschini Limited 25,716 0.2 0.2Fossil, Inc. 167,300 4.2 4.2
104
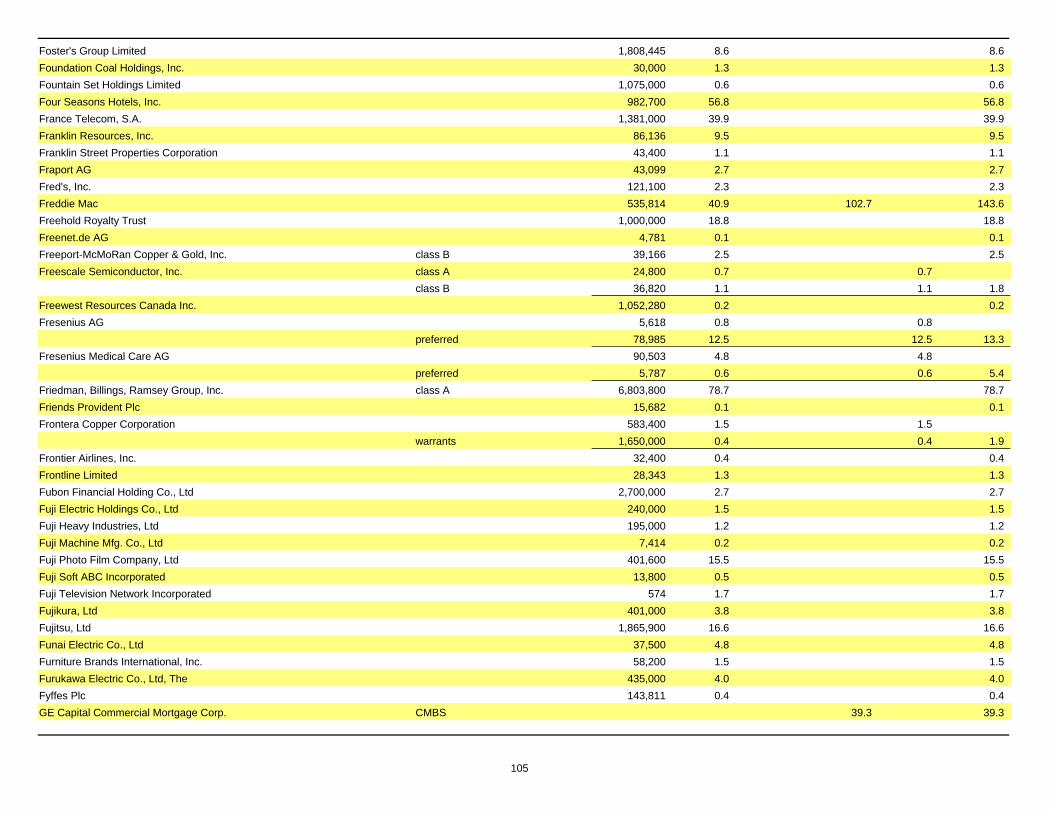
Foster's Group Limited 1,808,445 8.6 8.6Foundation Coal Holdings, Inc. 30,000 1.3 1.3Fountain Set Holdings Limited 1,075,000 0.6 0.6Four Seasons Hotels, Inc. 982,700 56.8 56.8France Telecom, S.A. 1,381,000 39.9 39.9Franklin Resources, Inc. 86,136 9.5 9.5Franklin Street Properties Corporation 43,400 1.1 1.1Fraport AG 43,099 2.7 2.7Fred's, Inc. 121,100 2.3 2.3Freddie Mac 535,814 40.9 102.7 143.6Freehold Royalty Trust 1,000,000 18.8 18.8Freenet.de AG 4,781 0.1 0.1Freeport-McMoRan Copper & Gold, Inc. class B 39,166 2.5 2.5Freescale Semiconductor, Inc. class A 24,800 0.7 0.7
class B 36,820 1.1 1.1 1.8Freewest Resources Canada Inc. 1,052,280 0.2 0.2Fresenius AG 5,618 0.8 0.8
preferred 78,985 12.5 12.5 13.3Fresenius Medical Care AG 90,503 4.8 4.8
preferred 5,787 0.6 0.6 5.4Friedman, Billings, Ramsey Group, Inc. class A 6,803,800 78.7 78.7Friends Provident Plc 15,682 0.1 0.1Frontera Copper Corporation 583,400 1.5 1.5
warrants 1,650,000 0.4 0.4 1.9Frontier Airlines, Inc. 32,400 0.4 0.4Frontline Limited 28,343 1.3 1.3Fubon Financial Holding Co., Ltd 2,700,000 2.7 2.7Fuji Electric Holdings Co., Ltd 240,000 1.5 1.5Fuji Heavy Industries, Ltd 195,000 1.2 1.2Fuji Machine Mfg. Co., Ltd 7,414 0.2 0.2Fuji Photo Film Company, Ltd 401,600 15.5 15.5Fuji Soft ABC Incorporated 13,800 0.5 0.5Fuji Television Network Incorporated 574 1.7 1.7Fujikura, Ltd 401,000 3.8 3.8Fujitsu, Ltd 1,865,900 16.6 16.6Funai Electric Co., Ltd 37,500 4.8 4.8Furniture Brands International, Inc. 58,200 1.5 1.5Furukawa Electric Co., Ltd, The 435,000 4.0 4.0Fyffes Plc 143,811 0.4 0.4GE Capital Commercial Mortgage Corp. CMBS 39.3 39.3
105
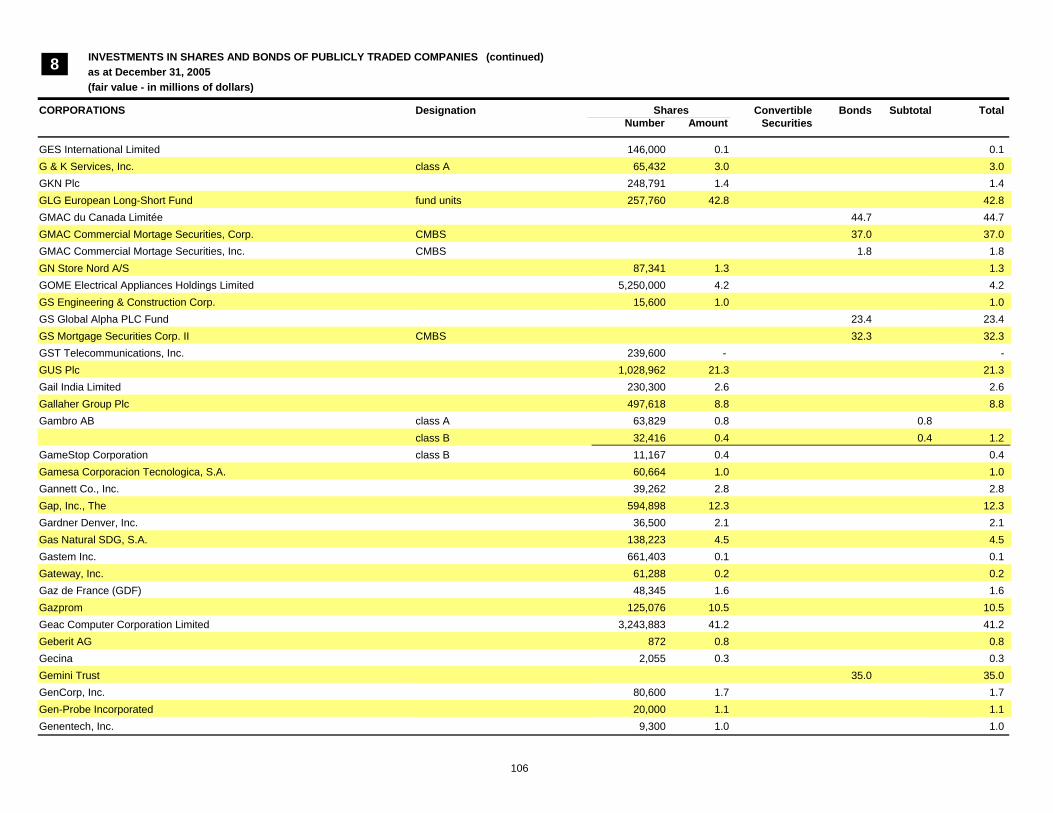
INVESTMENTS IN SHARES AND BONDS OF PUBLICLY TRADED COMPANIES as at December 31, 2005(fair value - in millions of dollars)
Designation ConvertibleSecurities
Bonds Subtotal Total
8
CORPORATIONS Shares Number Amount
(continued ) (continued)
GES International Limited 146,000 0.1 0.1G & K Services, Inc. class A 65,432 3.0 3.0GKN Plc 248,791 1.4 1.4GLG European Long-Short Fund fund units 257,760 42.8 42.8GMAC du Canada Limitée 44.7 44.7GMAC Commercial Mortage Securities, Corp. CMBS 37.0 37.0GMAC Commercial Mortage Securities, Inc. CMBS 1.8 1.8GN Store Nord A/S 87,341 1.3 1.3GOME Electrical Appliances Holdings Limited 5,250,000 4.2 4.2GS Engineering & Construction Corp. 15,600 1.0 1.0GS Global Alpha PLC Fund 23.4 23.4GS Mortgage Securities Corp. II CMBS 32.3 32.3GST Telecommunications, Inc. 239,600 - -GUS Plc 1,028,962 21.3 21.3Gail India Limited 230,300 2.6 2.6Gallaher Group Plc 497,618 8.8 8.8Gambro AB class A 63,829 0.8 0.8
class B 32,416 0.4 0.4 1.2GameStop Corporation class B 11,167 0.4 0.4Gamesa Corporacion Tecnologica, S.A. 60,664 1.0 1.0Gannett Co., Inc. 39,262 2.8 2.8Gap, Inc., The 594,898 12.3 12.3Gardner Denver, Inc. 36,500 2.1 2.1Gas Natural SDG, S.A. 138,223 4.5 4.5Gastem Inc. 661,403 0.1 0.1Gateway, Inc. 61,288 0.2 0.2Gaz de France (GDF) 48,345 1.6 1.6Gazprom 125,076 10.5 10.5Geac Computer Corporation Limited 3,243,883 41.2 41.2Geberit AG 872 0.8 0.8Gecina 2,055 0.3 0.3Gemini Trust 35.0 35.0GenCorp, Inc. 80,600 1.7 1.7Gen-Probe Incorporated 20,000 1.1 1.1Genentech, Inc. 9,300 1.0 1.0
106

General Communication class A 769,861 9.3 9.3General Dynamics Corporation 98,448 13.1 13.1General Electric Company 5,756,655 235.7 235.7General Growth Properties, Inc. 19,800 1.1 1.1General Mills, Inc. 252,256 14.5 14.5General Motors Corporation 61,510 1.4 1.4Générale de Santé 1,148,439 46.0 46.0Genesco, Inc. 83,400 3.8 3.8Genesee & Wyoming, Inc. class A 75,000 3.3 3.3Genesis Indian Investment Company Limited 312,500 10.2 10.2Genesis Smaller Companies 109,800 6.0 6.0Gennum Corporation 1,161,782 20.2 20.2Genting International Plc 500 - -Genting Berhad 417,860 2.8 2.8Gentiva Health Services, Inc. 29,558 0.5 0.5Genuine Parts Company 77,947 4.0 4.0Genworth Financial, Inc. class A 455,739 18.4 18.4Genzyme Corporation 83,730 6.9 6.9George Weston Limitée 894,369 77.2 21.5 98.7Georges Wimpey Plc 33,620 0.3 0.3Geox, S.p.A. 29,645 0.4 0.4Gerber Scientific, Inc. 12,200 0.1 0.1Gerdau, S.A. 136,000 2.6 2.6Germanos, S.A. 12,502 0.2 0.2Gestevision Telecino, S.A. 300,970 8.8 8.8Getinge AB class B 73,520 1.2 1.2Getronics N.V. 27,187 0.4 0.4Gevity HR, Inc. 25,000 0.8 0.8Gildan Activewear, Inc 1,916,162 95.8 5.8 101.6Gilead Sciences, Inc. 283,461 17.4 17.4Giordano International Limited 5,488,000 3.6 3.6Givaudan, S.A. 14,469 11.4 11.4Glacier Bancorp, Inc. 43,750 1.5 1.5Glamis Gold, Ltd 1,930,000 61.7 61.7GlaxoSmithKline Pharmaceuticals, Ltd 62,500 1.8 1.8GlaxoSmithKline Plc 6,443,144 190.8 190.8Glenborough Realty Trust Incorporated 27,700 0.6 0.6Glencairn Gold Corporation 6,540,025 2.8 2.8
warrants 1,734,750 0.2 0.2 3.0Global Alumina Corporation 964,600 1.9 1.9
107

INVESTMENTS IN SHARES AND BONDS OF PUBLICLY TRADED COMPANIES as at December 31, 2005(fair value - in millions of dollars)
Designation ConvertibleSecurities
Bonds Subtotal Total
8
CORPORATIONS Shares Number Amount
(continued ) (continued)
Global Imaging Systems, Inc. 18,700 0.8 0.8Global Payments, Inc. 81,600 4.4 4.4GlobalSantaFe Corporation 2,800 0.2 0.2Globe Telecom, Inc. 22,700 0.4 0.4GlobeeCom International, Inc. 1,309,416 0.2 0.2Globestar Mining Corp. 634,500 0.3 0.3Glory, Ltd 27,300 0.5 0.5Go-Ahead Group Plc, The 1,621 - -Gol - Linhas Aereas Inteligentes, S.A. 12,000 0.4 0.4Gold Fields Limited 121,489 2.5 2.5Goldcorp, Inc. warrants 2,802,800 10.1 10.1Golden China Resources Corporation 9,600,000 3.0 3.0
warrants 2,000,000 0.1 0.1 3.1Golden Credit Card Trust 25.0 25.0Golden Star Resources, Ltd 3,413,500 10.6 10.6Golden Tag Resources Ltd 315,500 - -Golden Valley Mines Ltd 1,482,500 0.4 0.4Golden West Financial Corp. 282,499 21.8 21.8Goldman Sachs Global Equity Opportunities Fund PLC fund units 350,000 41.1 41.1Goldman Sachs Global Tactical Asset Allocation 132.2 132.2Goldman Sachs Group, Inc., The 314,972 47.0 47.0Goodman Fielder Limited 704,775 1.3 1.3Goodpack Limited 198,000 0.2 0.2Goodrich Corporation 144,592 6.9 6.9Goodwill Group, Inc., The 190 0.4 0.4Goodyear Tire & Rubber Company 170,644 3.5 3.5Google, Inc. class A 58,019 28.1 28.1Government Properties Trust, Inc. 15,900 0.2 0.2Graco, Inc. 32,647 1.4 1.4Grafton Group Plc 47,053 0.6 0.6Graham Global Investment Fund II Ltd fund units 374,939 78.1 78.1Grasim Industries Limited 76,000 2.7 2.7Great Atlantic & Pacific Tea Company, Inc., The 102,400 3.8 3.8Great Basin Gold, Ltd 500,000 0.9 0.9Great Eagle Holdings Limited 700,000 2.3 2.3
108

Greatbatch, Inc. 28,100 0.8 0.8Greater Toronto Airports Authority 163.9 163.9Great-West Life Capital Trust 43.5 43.5Great-West Lifeco, Inc. 4,258,098 130.7 16.6 147.3Greek Org of Football Pronostics 76,357 3.1 3.1Greencore Group Plc 44,320 0.2 0.2Greene King Plc 3,750 0.1 0.1Greenlight Capital Offshore Ltd fund units 66 6.1 6.1Greenlight Masters Offshore Ltd fund units 1,256 23.0 23.0Greenwich Capital Commercial Funding CMBS 83.5 83.5Greggs Plc 1,015 0.1 0.1Griffon Corporation 42,500 1.2 1.2Grinham Diversified Fund Limited fund units 22,212 34.5 34.5Grossman Global Macro Hedge Fund 137.2 137.2Group 1 Automotive, Inc. 84,000 3.1 3.1Group 4 Securicor Plc 2,584,042 8.3 8.3Groupe Bruxelles Lambert, S.A. 15,252 1.7 1.7Groupe Danone, Le 135,713 16.5 16.5Groupe Jean Coutu (PJC) Inc., Le class A 12,716,660 178.0 178.0Groupe Laperrière & Verreault, Inc. class A 1,850,000 34.1 34.1Groupe TVA, Inc. class B 2,080,933 33.3 33.3Gruma, S.A. class B 1,094,600 4.2 4.2Grupo Aeroportuario del Sureste, S.A. de C.V. 83,808 1.4 1.4Grupo Bimbo, S.A. de C.V. class A 164,500 0.7 0.7Grupo Empresarial Ence, S.A. 11,102 0.4 0.4Grupo Ferrovial, S.A. 8,384 0.7 0.7Grupo Financiero Banorte, S.A. de C.V. 1,483,684 3.6 3.6Grupo Financiero Galicia, S.A. 12,000 0.1 0.1Grupo Financiero Inbursa, S.A. de C.V. 200,582 0.4 0.4Grupo Mexico, S.A. de C.V. class B 1,020,600 2.8 2.8Grupo Modelo, S.A. de C.V. class C 125,300 0.5 0.5Grupo Televisa, S.A. 311,859 9.5 9.5Gruppo Editoriale L'Espresso, S.p.A. 38,233 0.2 0.2Guangshen Railway Company Limited 1,122,000 0.4 0.4Guidant Corporation 121,972 9.2 9.2Guitar Center, Inc. 76,100 4.4 4.4Gulf Island Fabrication, Inc. 10,000 0.3 0.3Gunma Bank Ltd, The 181,000 1.6 1.6Gunze Limited 89,000 0.7 0.7Gymboree Corporation, The 104,700 2.9 2.9
109

INVESTMENTS IN SHARES AND BONDS OF PUBLICLY TRADED COMPANIES as at December 31, 2005(fair value - in millions of dollars)
Designation ConvertibleSecurities
Bonds Subtotal Total
8
CORPORATIONS Shares Number Amount
(continued ) (continued)
HBK Offshore Benefit Plan Fund Ltd fund units 805,043 95.7 95.7HBOS Plc 4,391,660 87.4 87.4HCA, Inc. 371,922 21.9 33.8 55.7HEICO Corporation 187,700 5.7 5.7Hilb, Rogal and Hamilton Company 79,600 3.6 3.6H. Lundbeck A/S 12,571 0.3 0.3HMV Group Plc 70,258 0.2 0.2HOT Topic, Inc. 172,900 2.9 2.9HRPT Properties Trust 182,318 2.2 2.2H&R Real Estate Investment Trust 119,000 2.5 2.5HRS Holding Ltd fund units 102,400 21.6 21.6HSBC Bank Canada 150.1 150.1HSBC Canada Asset Trust Sec 8.2 8.2HSBC Financial Corporation, Ltd 70.3 70.3HSBC Holdings Plc 9,339,355 174.8 174.8Haci Omer Sabanci Holding, A.S. 1,144,802 7.6 7.6Haemonetics Corporation 38,100 2.2 2.2Hafnia Holding Group, Ltd class A 399,000 - -
class B 225,500 - - -Hagemeyer N.V. 113,853 0.4 0.4Hain Celestial Group, Inc. 151,800 3.8 3.8Hakuhodo DY Holdings, Inc. 10,700 0.9 0.9Halfords Group Plc 887,273 6.3 6.3Halliburton Company 239,014 17.3 17.3Halma Plc 3,993,713 15.1 15.1Hammerson Plc 779,585 16.0 16.0Hana Finacial Holdings 110,999 5.9 5.9Hana Microelectronics Public Compagny Limited 280,700 0.2 0.2Hancock Fabrics, Inc. 44,900 0.2 0.2Hang Lung Group Limited 920,000 2.3 2.3Hang Lung Properties Limited 610,000 1.1 1.1Hang Seng Bank Limited 508,186 7.8 7.8Hanjin Heavy Industries Co., Ltd 6,900 0.2 0.2Hanjin Shipping Co., Ltd 9,400 0.2 0.2Hankook Tire Co. Ltd 346,590 5.7 5.7
110
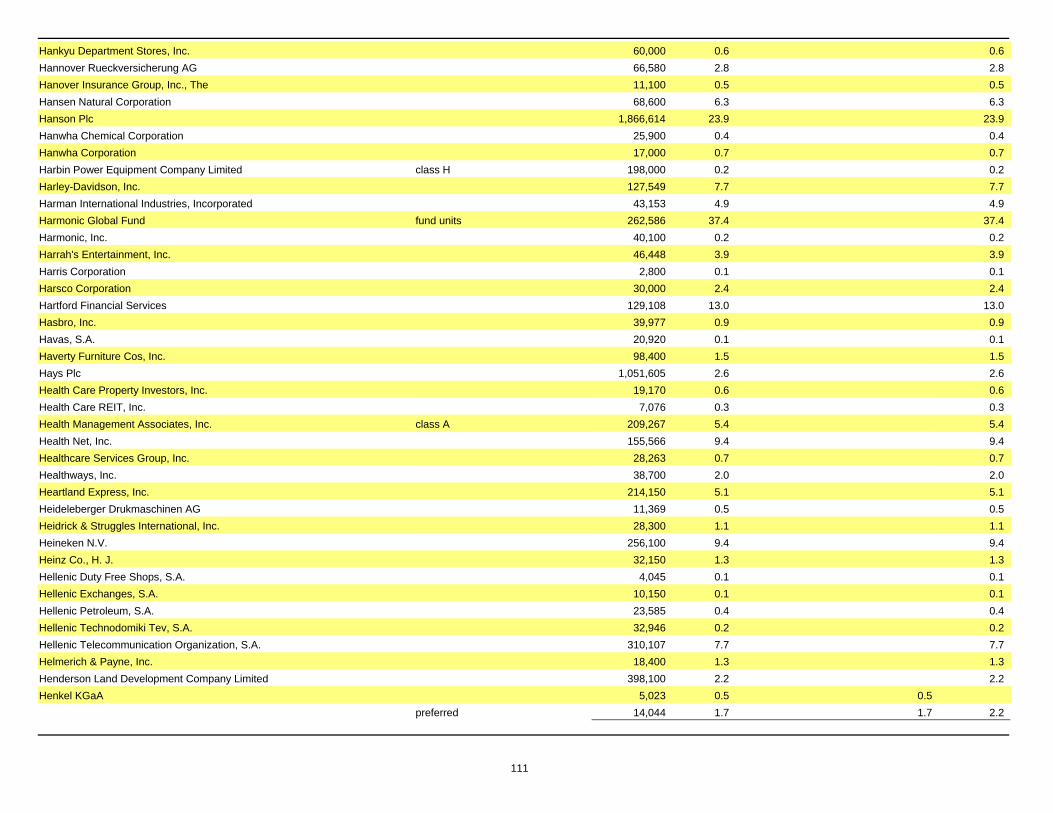
Hankyu Department Stores, Inc. 60,000 0.6 0.6Hannover Rueckversicherung AG 66,580 2.8 2.8Hanover Insurance Group, Inc., The 11,100 0.5 0.5Hansen Natural Corporation 68,600 6.3 6.3Hanson Plc 1,866,614 23.9 23.9Hanwha Chemical Corporation 25,900 0.4 0.4Hanwha Corporation 17,000 0.7 0.7Harbin Power Equipment Company Limited class H 198,000 0.2 0.2Harley-Davidson, Inc. 127,549 7.7 7.7Harman International Industries, Incorporated 43,153 4.9 4.9Harmonic Global Fund fund units 262,586 37.4 37.4Harmonic, Inc. 40,100 0.2 0.2Harrah's Entertainment, Inc. 46,448 3.9 3.9Harris Corporation 2,800 0.1 0.1Harsco Corporation 30,000 2.4 2.4Hartford Financial Services 129,108 13.0 13.0Hasbro, Inc. 39,977 0.9 0.9Havas, S.A. 20,920 0.1 0.1Haverty Furniture Cos, Inc. 98,400 1.5 1.5Hays Plc 1,051,605 2.6 2.6Health Care Property Investors, Inc. 19,170 0.6 0.6Health Care REIT, Inc. 7,076 0.3 0.3Health Management Associates, Inc. class A 209,267 5.4 5.4Health Net, Inc. 155,566 9.4 9.4Healthcare Services Group, Inc. 28,263 0.7 0.7Healthways, Inc. 38,700 2.0 2.0Heartland Express, Inc. 214,150 5.1 5.1Heideleberger Drukmaschinen AG 11,369 0.5 0.5Heidrick & Struggles International, Inc. 28,300 1.1 1.1Heineken N.V. 256,100 9.4 9.4Heinz Co., H. J. 32,150 1.3 1.3Hellenic Duty Free Shops, S.A. 4,045 0.1 0.1Hellenic Exchanges, S.A. 10,150 0.1 0.1Hellenic Petroleum, S.A. 23,585 0.4 0.4Hellenic Technodomiki Tev, S.A. 32,946 0.2 0.2Hellenic Telecommunication Organization, S.A. 310,107 7.7 7.7Helmerich & Payne, Inc. 18,400 1.3 1.3Henderson Land Development Company Limited 398,100 2.2 2.2Henkel KGaA 5,023 0.5 0.5
preferred 14,044 1.7 1.7 2.2
111

INVESTMENTS IN SHARES AND BONDS OF PUBLICLY TRADED COMPANIES as at December 31, 2005(fair value - in millions of dollars)
Designation ConvertibleSecurities
Bonds Subtotal Total
8
CORPORATIONS Shares Number Amount
(continued ) (continued)
Hennes & Mauritz AB (H&M) class B 142,586 5.6 5.6Henry Schein, Inc. 13,700 0.7 0.7Hercules Incorporated 7,699 0.1 0.1Hermes International 56,094 16.3 16.3Hermitage Fund, The fund units 24,707 34.2 34.2Hero Honda Motors Ltd participating notes 87,782 1.9 1.9Héroux-Devtek, Inc. 4,237,183 14.8 14.8Hershey Company, The 84,864 5.5 5.5Hewlett-Packard Company 1,036,981 34.7 34.7Hibbett Sporting Goods, Inc. 136,250 4.5 4.5High River Gold Mines, Ltd 4,003,100 5.9 5.9
warrants 890,000 0.2 0.2 6.1High Tech Computer Corp. 377,000 8.3 8.3Highbridge Capital Corporation fund units 1,109 75.9 75.9Highbridge Overlook Performance Fund fund units 6,682 54.2 54.2Highland Gold Mining, Limited 47,058 0.2 0.2Highland Opportunity Fund, Ltd fund units 257 38.6 38.6Highwoods Properties, Inc. 34,500 1.2 1.2Hikari Tsushin, Inc. 10,600 1.2 1.2Hillenbrand Industries, Inc. 3,877 0.2 0.2Hilton Group Plc 1,751,680 12.8 12.8Hilton Hotels Corporation 556,098 15.7 15.7Hindalco Industries Limited 77,125 0.2 0.2Hino Motors, Ltd 119,000 0.9 0.9Hirose Electric Co., Ltd 13,800 2.2 2.2Hisamitsu Pharmaceutical Co., Inc. 16,200 0.5 0.5Hiscox Plc 16,342 0.1 0.1Hitachi Cable, Ltd 77,000 0.4 0.4Hitachi Capital Corporation 48,600 1.1 1.1Hitachi Chemical Company, Ltd 66,700 2.1 2.1Hitachi Construction Machinery Co., Ltd 45,100 1.2 1.2Hitachi High-Technologies Corporation 40,100 1.2 1.2Hitachi Information Systems, Ltd 9,900 0.3 0.3Hitachi Metals, Ltd 181,000 2.3 2.3Hitachi Software Engineering Co., Ltd 14,800 0.4 0.4
112

Hitachi, Ltd 1,507,900 11.9 11.9Hochtief AG 13,124 0.7 0.7Hoganas AB class B 6,041 0.2 0.2Hokkaido Electric Power Company Incorporated 79,200 1.9 1.9Hokuhoku Financial Group, Inc. 503,000 2.7 2.7Holcim, Ltd 73,498 5.8 5.8Hollinger, Inc. 628,200 1.6 1.6Holly Corporation 40,000 2.8 2.8Holmen AB class B 11,634 0.4 0.4Hologic, Inc. 121,800 5.4 5.4Home Capital Group, Inc. 220,100 7.6 7.6Home Depot, Inc., The 1,947,668 92.1 92.1Hon Hai Precision Industry Co., Ltd 1,132,890 7.6 7.6Honda Canada Finance, Inc. 40.0 40.0Honda Motor Co. 541,600 36.1 36.1Honeywell International, Inc. 250,086 10.9 10.9Hong Kong and China Gas Company, Ltd 2,769,908 6.9 6.9Hong Kong Electric Holdings, Ltd 391,000 2.3 2.3Hong Kong Exchanges & Clearing Limited 248,000 1.2 1.2Hong Leong Bank Berhad 757,000 1.2 1.2Hooper Holmes, Inc. 64,700 0.2 0.2Hopewell Holdings Limited 1,159,000 3.4 3.4Horizon Fund 25.9 25.9Hormel Foods Corporation 5,796 0.2 0.2Hospira, Inc. 76,882 3.8 3.8Hospitality Properties Trust 17,655 0.8 0.8House Foods Corporation 33,200 0.6 0.6Household Financial Corporation Limited 76.8 76.8Housing Development Finance Corporation Limited participating notes 469,500 14.7 14.7Hoya Corporation 264,900 11.1 11.1Huan Hsin Holdings Limited 110,000 - -Huaneng Power International, Inc. 96,000 0.1 0.1Hub Group, Inc. class A 30,900 1.3 1.3HudBay Minerals, Inc. 3,250,999 19.1 19.1
warrants 28,835,000 2.9 2.9 22.0Hudson's Bay Company 6,523,200 96.2 96.2Hudson City Bancorp, Inc. 30,600 0.4 0.4Hughes Supplys, Inc. 98,800 4.1 4.1Humana, Inc. 184,604 11.7 11.7Humax Co., Ltd 8,614 0.3 0.3
113

INVESTMENTS IN SHARES AND BONDS OF PUBLICLY TRADED COMPANIES as at December 31, 2005(fair value - in millions of dollars)
Designation ConvertibleSecurities
Bonds Subtotal Total
8
CORPORATIONS Shares Number Amount
(continued ) (continued)
Huntington Bancshares Incorporated 134,380 3.7 3.7Huntsman Corporation 19,465 0.4 0.4Hurriyet Gazetecilik ve Matbaacilik A.S 34,857 0.2 0.2Hutchinson Technology, Inc. 15,800 0.5 0.5Hutchison Whampoa Limited 1,466,305 16.3 16.3Hyatt Regency Hotels and Tourism, S.A. 9,226 0.1 0.1Hydro One, Inc. 13.2 13.2Hydro Ottawa Holding, Inc. 12.4 12.4Hydro-Ontario 159.2 159.2Hynix Semiconductor, Inc. 195,000 7.8 7.8Hyperion Solutions Corporation 45,100 1.9 1.9Hypo Real Estate Holding AG 120,888 7.3 7.3Hysan Development 4,065,700 11.8 11.8Hyundai Department Store Co., Ltd 4,800 0.5 0.5Hyundai Developement Company 26,490 1.4 1.4Hyundai Engineering & Construction Co., Ltd 5,100 0.3 0.3Hyundai Marine & Fire Insurance Co., Ltd 13,560 0.2 0.2Hyundai Mipo Dockyard Co., Ltd 6,800 0.5 0.5Hyundai Mobis 160,600 17.2 17.2Hyundai Motor Company, Ltd 193,170 21.7 21.7
preferred 135,290 10.6 10.6 32.3IAC/InterActiveCorp 303,698 10.0 10.0IAMGOLD Corporation 350,000 3.2 3.2IAWS Group Plc 23,427 0.4 0.4ICICI Bank Limited 100,000 3.4 3.4
participating notes 126,000 1.9 1.9 5.3ICU Medical, Inc. 17,600 0.8 0.8IDEX Corporation 76,800 3.7 3.7IDX Systems Corporation 35,000 1.8 1.8IFIL - Investments, S.p.A. 22,395 0.1 0.1IGM Financial, Inc. 5,297,120 244.3 244.3IHOP, Corp. 64,700 3.6 3.6III Fund fund units 3,766 15.1 19.5 34.6III Relative Value Credit Strategies Fund 11.7 11.7III Relative Value/Macro International Plan Asset Fund 60.0 60.0
114

IMMOEAST Immobilien Anlagen AG 806,435 9.2 9.2IMS Health Incorporated 48,619 1.4 1.4INSCAPE Corporation class B 911,500 4.0 4.0IOI Corporation Berhad 680,100 2.6 2.6iPayment Holdings, Inc. 17,405 0.8 0.8IPC US Real Estate Investment Trust 156,200 1.8 1.8IPL, Inc. class A 1,185,800 4.5 4.5IPSCO, Inc. 113,780 11.0 11.0IRSA Inversiones y Representaciones, S.A. 16,000 0.2 0.2iShares MSCI Brazil 264,300 10.3 10.3iShares MSCI EAFE Index Fund indexed fund units 352,200 24.5 24.5iShares MSCI Emerging Markets Index Fund indexed fund units 26,900 2.8 2.8iShares MSCI EMU Index Fund indexed fund units 1,750 0.2 0.2iShares MSCI Switzerland Index Fund indexed fund units 8,100 0.2 0.2iShares MSCI United Kingdom Index Fund indexed fund units 17,150 0.4 0.4iShares S&P SmallCap Index Fund indexed fund units 5,709,918 385.5 385.5ITC Limited 404,818 1.5 1.5ITO EN, Ltd 13,600 1.0 1.0ITT Industries, Inc. 31,305 3.8 3.8ITV Plc 5,624,897 12.5 12.5IVG Immobilien AG 33,940 0.8 0.8IWKA AG 56,400 1.4 1.4Iberdrola, S.A. 212,571 6.8 6.8Iberia Lineas Aeras de Espana, S.A. 150,098 0.5 0.5Ibiden Co., Ltd 112,000 7.0 7.0Idexx Laboratories, Inc. 42,100 3.5 3.5Illinois Tool Works, Inc. 129,417 13.3 13.3ImClone Systems Incorporated 11,500 0.5 0.5Imerys, S.A. 7,028 0.6 0.6Immofinanz Immobilien Anlagen AG 86,956 1.0 1.0Immucor, Inc. 49,500 1.4 1.4Impala Platinum Holdings Limited 42,544 7.3 7.3Imperial Chemical Industries Plc 1,531,646 10.2 10.2Imperial Holdings Limited 99,607 2.6 2.6Imperial Tobacco Group Plc 357,203 12.4 12.4Impulsora Del Desarrollo Enconomico de America Latina, S.A. de C.V. 134,782 0.2 0.2InBev 510,850 25.9 25.9Inchcape Plc 280 - -Inco, Ltd 772,322 39.0 39.0
warrants 30,900 0.6 0.6 39.6
115

INVESTMENTS IN SHARES AND BONDS OF PUBLICLY TRADED COMPANIES as at December 31, 2005(fair value - in millions of dollars)
Designation ConvertibleSecurities
Bonds Subtotal Total
8
CORPORATIONS Shares Number Amount
(continued ) (continued)
Indea Absolute Return Fund fund units 284,091 6.1 6.1Independent News & Media Plc 211,804 0.7 0.7Index Corporation 1,037 2.2 2.2Index participation units - TSX 60 (CANCAP) preferred 202,711,210 515.5 515.5India Cements, Limited 23,500 0.1 0.1Indofood Sukses Makmur 2,621,500 0.3 0.3Indra Sistemas, S.A. 251,707 5.7 5.7Industria de Diseno Textil, S.A. (Inditex) 83,805 3.2 3.2Industrial Alliance Insurance and Financial Services, Inc. 7,033,886 204.5 204.5IndyMac Bancorp, Inc. 29,737 1.4 1.4Infineon Technologies AG 615,597 6.6 6.6Inflazyme Pharmaceuticals, Ltd 2,211,700 0.3 0.3InfoSpace, Inc. 28,000 0.8 0.8Infosys Technologies Limited participating notes 136,755 10.6 10.6Ingersoll-Rand Company 570,066 26.9 26.9Ingram Micro, Inc. class A 24,674 0.6 0.6Inhibitex, Inc. 792,743 7.8 7.8
warrants 173,292 0.3 0.3 8.1Inmobiliaria Colonial, S.A. 6,583 0.4 0.4Innergex Power Income Fund fund units 1,500,000 19.8 19.8Inpex Corporation 177 1.8 1.8Insight Enterprises, Inc. 174,900 4.0 4.0Insituform Technologies, Inc. class A 14,100 0.3 0.3Insurance Australia Group Limited 890,000 4.1 4.1Integra Investors Ltd fund units 22,500 27.7 27.7Integra LifeSciences Holdings Corporation 23,400 1.0 1.0Intel Corporation 4,072,675 118.8 118.8Interactive Data Corporation 152,300 4.0 4.0Interconexion Electrica, S.A. 206,882 0.6 0.6InterContinental Hotels Group Plc 326,867 5.5 5.5Interface, Inc. 148,700 1.4 1.4Intermagnetics General Corporation 38,767 1.4 1.4International Business Machines Corp. 925,320 88.8 88.8International Finance Participation Trust fund units 725 8.5 8.5International Flavors & Fragrances, Inc. 5,517 0.2 0.2
116

International Forest Products Limited class A 1,751,300 12.6 12.6International Game Technology 35,705 1.3 1.3International Minerals Corporation warrants 197,500 0.2 0.2International Paper Company 86,189 3.4 3.4International Rectifier Corporation 19,300 0.7 0.7International Royalty Corporation 5,367,200 18.8 18.8International Speedway Corporation class A 88,300 4.9 4.9Internationale Nederlanden Groep N.V. 1,950,503 78.8 78.8Internet Security Systems, Inc. 14,000 0.3 0.3Interpublic Group of Companies, Inc. 352,494 4.0 4.0Intertape Polymer Group, Inc., The 2,494,900 25.9 25.9Inter-Tel, Inc. 11,800 0.3 0.3Intracom, S.A. 23,714 0.2 0.2Intrado, Inc. 10,400 0.3 0.3Intralase Corp 51,368 1.1 1.1Intrawest Corporation 1,942,097 64.7 64.7Intuit, Inc. 146,076 9.1 9.1Invacare Corporation 39,000 1.4 1.4Inversiones Aguas Metropolitanas, S.A. 143,500 3.0 3.0Inversiones Argos, S.A. 32,318 0.2 0.2Inversiones Nacionales de Chocolates, S.A. 84,451 0.6 0.6Inversions Aguas Metro, S.A. 13,040 0.3 0.3Investec Plc 5,567 0.3 0.3Investors Group, Inc. 92.7 92.7Invitrogen Corporation 15,400 1.2 1.2Irish Life & Permanent Plc 59,631 1.4 1.4Iron Mountain Incorporated 44,600 2.2 2.2IsacSoft, Inc. class A 3,750,185 0.4 0.4Isetan Company Limited 82,000 2.0 2.0Ishihara Sangyo Kaisha, Ltd 133,000 0.3 0.3Ishikawajima-Harima Heavy Industries Co., Ltd 508,000 1.9 1.9Israel Chemicals Limited 208,227 1.0 1.0Ista Pharmaceuticals, Inc. 6,451 - -Italcementi, S.p.A. 38,324 0.8 0.8Itausa - Investimentos Itau, S.A. preferred 576,200 2.1 2.1Itochu Corporation 1,235,000 12.0 12.0Itochu Techno-Science Corporation 24,900 1.4 1.4Itron, Inc. 20,700 1.0 1.0Ivanhoe Mines, Ltd 9,422,430 78.7 78.7Ivax Corporation 123,563 4.5 4.5
117

INVESTMENTS IN SHARES AND BONDS OF PUBLICLY TRADED COMPANIES as at December 31, 2005(fair value - in millions of dollars)
Designation ConvertibleSecurities
Bonds Subtotal Total
8
CORPORATIONS Shares Number Amount
(continued ) (continued)
j2 Global Communications, Inc. 15,200 0.8 0.8J.B. Hunt Transport Services, Inc. 117,978 3.1 3.1J. C. Penney Company, Inc. 136,556 8.9 8.9JC Decaux, S.A. 4,190 0.1 0.1JDA Software Group, Inc. 17,000 0.3 0.3JD Group Limited 116,120 1.6 1.6JD Wetherspoon 1,685,672 11.2 11.2JDS Uniphase Corporation 330,418 0.9 0.9JFE Holdings, Inc. 510,800 20.0 20.0JGC Corporation 95,000 2.1 2.1J & J Snack Foods Corp. 38,378 2.7 2.7J Jill Group, Inc., The 51,500 1.1 1.1JLG Industries, Inc. 67,600 3.6 3.6J.P. Morgan Chase & Co. 5,844,322 263.8 263.8JP Morgan Chase Commercial Mortgage Securities Corp. CMBS 83.9 83.9JSC Mining & Smelting Company Norilsk Nickel 120,392 13.4 13.4JSC Severstal-Avto 9,626 0.2 0.2JS Group Corporation 344,976 8.1 8.1JSR Corporation 219,400 6.7 6.7J Sainsbury Plc 745,794 4.7 4.7JTEKT Corporation 87,000 1.9 1.9Jabil Circuit, Inc. 95,079 4.1 4.1Jack in the Box, Inc. 121,400 5.0 5.0Jackson Hewitt Tax Service 110,400 3.6 3.6Jafco Co., Ltd 16,600 1.7 1.7Jakks Pacific, Inc. 89,700 2.2 2.2Janus Capital Group, Inc. 14,727 0.3 0.3Japan Airlines Corporation 301,000 1.0 1.0Japan Prime Realty Investment Corporation 195 0.6 0.6Japan Real Estate Investment Corporation 143 1.4 1.4Japan Retail Funds Investments 260 2.4 2.4Japan Tobacco, Inc. 657 11.2 11.2Jardine Strategic Holdings Limited 111,449 1.4 1.4Java Incorporated Berhad 88 - -Jefferies Real Asset Fund 26.1 26.1
118

Jefferson-Pilot Corporation 16,851 1.1 1.1Jeronimo Martins, SGPS, S.A. 8,291 0.2 0.2Jetblue Airways Corporation 112,500 2.0 2.0Jiangsu Expressway company Ltd 794,000 0.5 0.5Jo-Ann Stores, Inc. 96,500 1.3 1.3John Fairfax Holdings, Ltd 484,282 1.7 1.7John H Harland Company 33,900 1.5 1.5John Hancock Canadian Corporation 18.3 18.3John Wiley & Sons, Inc. class A 56,400 2.6 2.6Johnson & Johnson 1,778,791 124.9 124.9Johnson Controls, Inc. 70,475 6.0 6.0Johnson Electric Holdings Limited 1,512,500 1.7 1.7Johnson Matthey Plc 596,019 16.9 16.9Jones Apparel Group, Inc. 128,576 4.6 4.6Jos A. Bank Clothiers, Inc. 46,200 2.3 2.3Joyo Bank, Ltd, The 318,000 2.2 2.2Julius Baer Holding, Ltd class B 86,096 7.1 7.1Junex Inc. 1,286,235 1.3 1.3Juniper Networks, Inc. 53,700 1.4 1.4Jyske Bank, A/S 2,066 0.1 0.1K2, Inc. 174,900 2.1 2.1KBC Groupe 266,414 28.9 28.9KBC Pacific Fund of Funds fund units 14,520 19.7 19.7KBC Return Enhance Fund fund units 25,786 26.4 26.4KB HOME 48,245 4.1 4.1KCI Konecranes Oyj 25,216 1.4 1.4KDDI Corporation 2,014 13.6 13.6K&F Industries Holdings, Inc. 825,930 14.8 14.8KLA-Tencor Corporation 26,778 1.5 1.5K+S AG 36,200 2.6 2.6K-Swiss, Inc. class A 96,700 3.7 3.7KT Corporation 73,760 3.5 3.5KT&G Corporation 87,600 4.6 4.6Kaiser Trading Fund spc fund units 2,757,174 36.7 36.7Kajima Corporation 671,000 4.5 4.5Kaken Pharmaceutical Co., Ltd 100,000 0.9 0.9Kalina 7,454 0.3 0.3Kaman Corporation 19,300 0.4 0.4Kamigumi Co., Ltd 427,000 4.4 4.4Kana Software, Inc. 2,839 - -
119

INVESTMENTS IN SHARES AND BONDS OF PUBLICLY TRADED COMPANIES as at December 31, 2005(fair value - in millions of dollars)
Designation ConvertibleSecurities
Bonds Subtotal Total
8
CORPORATIONS Shares Number Amount
(continued ) (continued)
Kaneka Corporation 132,000 1.9 1.9Kangourou Media, Inc. 7,446,809 8.9 8.9
warrants 7,446,809 6.6 6.6 15.5Kangwon Land Inc. 12,820 0.3 0.3Kansai Electric Power Company Incorporated, The 354,300 8.9 8.9Kansai Paint Co., Ltd 139,000 1.4 1.4Kansas City Southern 111,700 3.2 3.2Kao Corp. 394,600 12.3 12.3KarstadtQuelle AG 120,707 2.1 2.1Kasikornbank Public Company Limited 2,851,300 6.0 6.0Katokichi Co., Ltd 56,600 0.4 0.4Kawasaki Heavy Industries, Ltd 564,000 2.4 2.4Kawasaki Kisen Kaisha, Ltd 219,000 1.6 1.6Kaydon Corporation 39,900 1.5 1.5Kazakhmys Plc 9,635 0.2 0.2Keane, Inc. 52,300 0.7 0.7Keihin Corporation 65,200 2.0 2.0Keihin Electric Express Railway Co., Ltd 204,000 1.9 1.9Keio Corporation 251,000 1.8 1.8Keisei Electric Railway Co., Ltd 119,000 1.0 1.0Keithley Instruments, Inc. 8,100 0.1 0.1Kelda Group Plc 113,869 1.8 1.8Kellogg Company 74,735 3.8 3.8Kellwood Company 85,800 2.4 2.4Kensey Nash Corporation 11,300 0.3 0.3Keppel Corporation Limited 1,019,600 7.9 7.9Keppel Land Limited 1,000,000 2.6 2.6Kerr-McGee Corporation 83,342 8.8 8.8Kerry Group Plc class A 98,533 2.5 2.5Kerry Properties Limited 4,167,500 12.9 12.9Kesa Electricals Plc 953,364 5.0 5.0Kesko Oyj class B 14,219 0.5 0.5KeyCorp 155,642 6.0 6.0Keyence Corporation 20,200 6.7 6.7KeySpan Corporation 26,604 1.1 1.1
120

Kikkoman Corporation 68,000 0.8 0.8Kilroy Realty Corporation 18,000 1.3 1.3Kimberley Diamond Company NL 625,000 0.8 0.8
rights 52,083 - - 0.8Kimberly-Clark Corporation 221,907 15.5 15.5Kimberly-Clark de Mexico, S.A. de C.V. class A 355,200 1.5 1.5Kimco North Trust II 9.9 9.9Kinden Corporation 61,000 0.6 0.6Kinder Morgan Management, LLC. 32,213 1.7 1.7Kinder Morgan, Inc. 64,885 7.0 7.0King Pharmaceuticals, Inc. 247,407 4.9 4.9Kingboard Chemical Holdings Limited 885,000 2.8 2.8Kingfisher Plc 2,964,458 14.1 14.1Kingspan Group Plc 25,967 0.4 0.4Kingway Brewery Holdings Limited 256,000 0.1 0.1Kinross Gold Corporation 12,010,151 129.0 129.0Kintetsu Corp. 705,000 3.3 3.3Kirby Corporation 39,700 2.4 2.4Kirin Brewery Company Limited 362,000 4.9 4.9Klepierre 5,091 0.6 0.6Knight Resources Ltd 15,500 - -Knight Transportation, Inc. 70,200 1.7 1.7Knight-Ridder, Inc. 12,138 0.9 0.9Kobayashi Pharmaceutical Co., Ltd 9,500 0.3 0.3Kobe Steel, Ltd 1,232,000 4.7 4.7Koc Holding, A.S. 772,147 4.2 4.2Kohl's Corporation 299,858 17.0 17.0Koito Manufacturing Co., Ltd 23,000 0.4 0.4Kokuyo Co., Ltd 35,500 0.6 0.6Komag Incorporated 12,800 0.5 0.5Komatsu, Ltd 413,200 8.0 8.0Komercni Banka, A.S. 31,881 5.2 5.2Komori Corporation 26,000 0.6 0.6Konami Corporation 41,700 1.1 1.1Kone Oyj class B 16,716 0.8 0.8Konica Minolta Holdings, Inc. 208,000 2.5 2.5Koninklijke (Royal) Philips Electronics N.V. 1,425,415 51.6 51.6Koninklijke Ahold N.V. 724,181 6.3 6.3Koninklijke DSM N.V. 105,658 5.0 5.0Koninklijke KPN N.V. 2,017,350 23.5 23.5
121
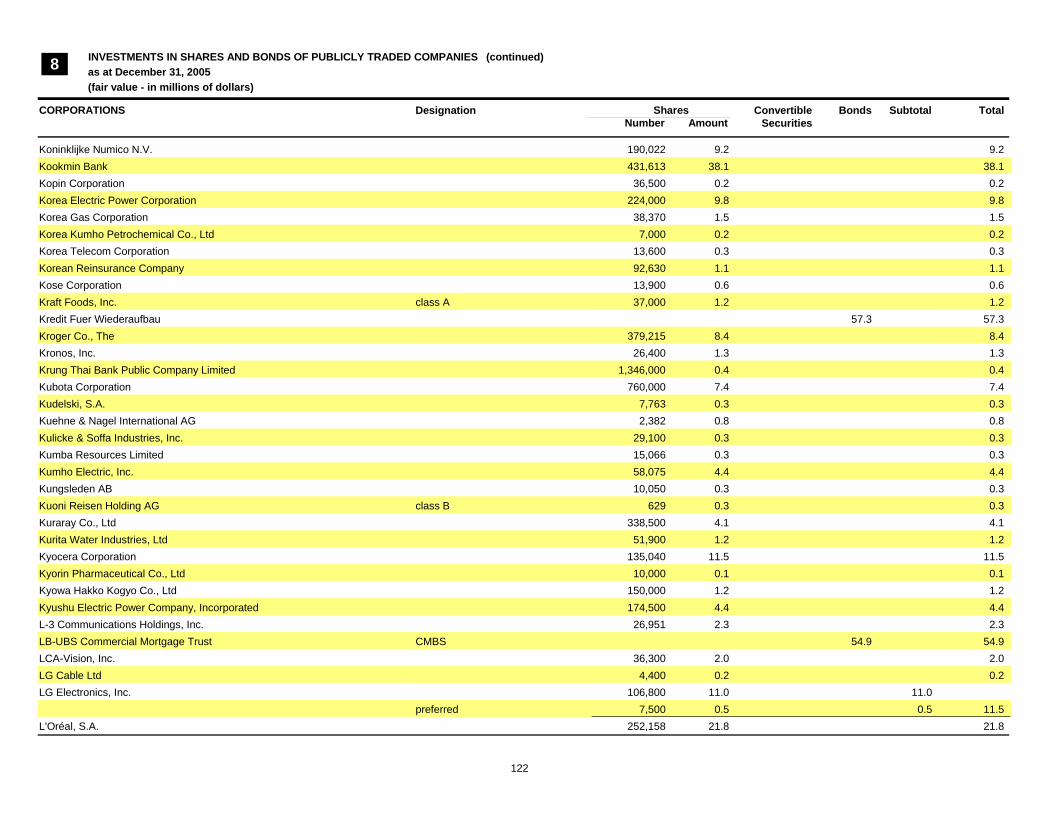
INVESTMENTS IN SHARES AND BONDS OF PUBLICLY TRADED COMPANIES as at December 31, 2005(fair value - in millions of dollars)
Designation ConvertibleSecurities
Bonds Subtotal Total
8
CORPORATIONS Shares Number Amount
(continued ) (continued)
Koninklijke Numico N.V. 190,022 9.2 9.2Kookmin Bank 431,613 38.1 38.1Kopin Corporation 36,500 0.2 0.2Korea Electric Power Corporation 224,000 9.8 9.8Korea Gas Corporation 38,370 1.5 1.5Korea Kumho Petrochemical Co., Ltd 7,000 0.2 0.2Korea Telecom Corporation 13,600 0.3 0.3Korean Reinsurance Company 92,630 1.1 1.1Kose Corporation 13,900 0.6 0.6Kraft Foods, Inc. class A 37,000 1.2 1.2Kredit Fuer Wiederaufbau 57.3 57.3Kroger Co., The 379,215 8.4 8.4Kronos, Inc. 26,400 1.3 1.3Krung Thai Bank Public Company Limited 1,346,000 0.4 0.4Kubota Corporation 760,000 7.4 7.4Kudelski, S.A. 7,763 0.3 0.3Kuehne & Nagel International AG 2,382 0.8 0.8Kulicke & Soffa Industries, Inc. 29,100 0.3 0.3Kumba Resources Limited 15,066 0.3 0.3Kumho Electric, Inc. 58,075 4.4 4.4Kungsleden AB 10,050 0.3 0.3Kuoni Reisen Holding AG class B 629 0.3 0.3Kuraray Co., Ltd 338,500 4.1 4.1Kurita Water Industries, Ltd 51,900 1.2 1.2Kyocera Corporation 135,040 11.5 11.5Kyorin Pharmaceutical Co., Ltd 10,000 0.1 0.1Kyowa Hakko Kogyo Co., Ltd 150,000 1.2 1.2Kyushu Electric Power Company, Incorporated 174,500 4.4 4.4L-3 Communications Holdings, Inc. 26,951 2.3 2.3LB-UBS Commercial Mortgage Trust CMBS 54.9 54.9LCA-Vision, Inc. 36,300 2.0 2.0LG Cable Ltd 4,400 0.2 0.2LG Electronics, Inc. 106,800 11.0 11.0
preferred 7,500 0.5 0.5 11.5L'Oréal, S.A. 252,158 21.8 21.8
122
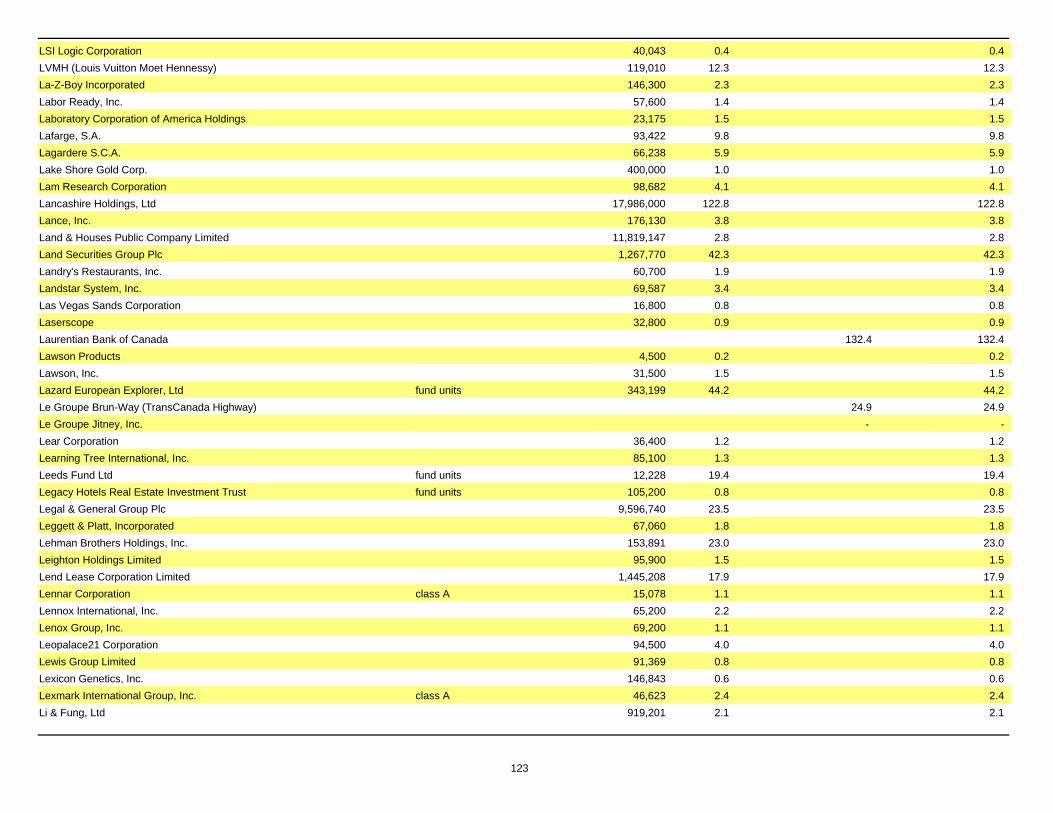
LSI Logic Corporation 40,043 0.4 0.4LVMH (Louis Vuitton Moet Hennessy) 119,010 12.3 12.3La-Z-Boy Incorporated 146,300 2.3 2.3Labor Ready, Inc. 57,600 1.4 1.4Laboratory Corporation of America Holdings 23,175 1.5 1.5Lafarge, S.A. 93,422 9.8 9.8Lagardere S.C.A. 66,238 5.9 5.9Lake Shore Gold Corp. 400,000 1.0 1.0Lam Research Corporation 98,682 4.1 4.1Lancashire Holdings, Ltd 17,986,000 122.8 122.8Lance, Inc. 176,130 3.8 3.8Land & Houses Public Company Limited 11,819,147 2.8 2.8Land Securities Group Plc 1,267,770 42.3 42.3Landry's Restaurants, Inc. 60,700 1.9 1.9Landstar System, Inc. 69,587 3.4 3.4Las Vegas Sands Corporation 16,800 0.8 0.8Laserscope 32,800 0.9 0.9Laurentian Bank of Canada 132.4 132.4Lawson Products 4,500 0.2 0.2Lawson, Inc. 31,500 1.5 1.5Lazard European Explorer, Ltd fund units 343,199 44.2 44.2Le Groupe Brun-Way (TransCanada Highway) 24.9 24.9Le Groupe Jitney, Inc. - -Lear Corporation 36,400 1.2 1.2Learning Tree International, Inc. 85,100 1.3 1.3Leeds Fund Ltd fund units 12,228 19.4 19.4Legacy Hotels Real Estate Investment Trust fund units 105,200 0.8 0.8Legal & General Group Plc 9,596,740 23.5 23.5Leggett & Platt, Incorporated 67,060 1.8 1.8Lehman Brothers Holdings, Inc. 153,891 23.0 23.0Leighton Holdings Limited 95,900 1.5 1.5Lend Lease Corporation Limited 1,445,208 17.9 17.9Lennar Corporation class A 15,078 1.1 1.1Lennox International, Inc. 65,200 2.2 2.2Lenox Group, Inc. 69,200 1.1 1.1Leopalace21 Corporation 94,500 4.0 4.0Lewis Group Limited 91,369 0.8 0.8Lexicon Genetics, Inc. 146,843 0.6 0.6Lexmark International Group, Inc. class A 46,623 2.4 2.4Li & Fung, Ltd 919,201 2.1 2.1
123
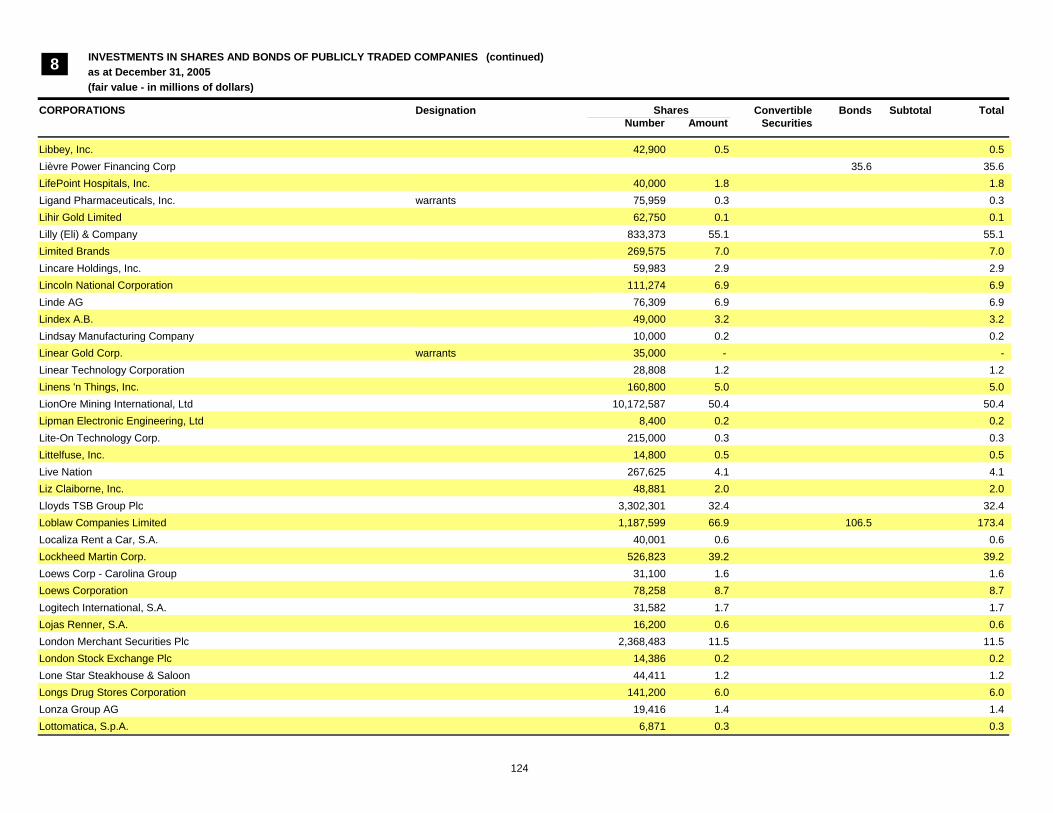
INVESTMENTS IN SHARES AND BONDS OF PUBLICLY TRADED COMPANIES as at December 31, 2005(fair value - in millions of dollars)
Designation ConvertibleSecurities
Bonds Subtotal Total
8
CORPORATIONS Shares Number Amount
(continued ) (continued)
Libbey, Inc. 42,900 0.5 0.5Lièvre Power Financing Corp 35.6 35.6LifePoint Hospitals, Inc. 40,000 1.8 1.8Ligand Pharmaceuticals, Inc. warrants 75,959 0.3 0.3Lihir Gold Limited 62,750 0.1 0.1Lilly (Eli) & Company 833,373 55.1 55.1Limited Brands 269,575 7.0 7.0Lincare Holdings, Inc. 59,983 2.9 2.9Lincoln National Corporation 111,274 6.9 6.9Linde AG 76,309 6.9 6.9Lindex A.B. 49,000 3.2 3.2Lindsay Manufacturing Company 10,000 0.2 0.2Linear Gold Corp. warrants 35,000 - -Linear Technology Corporation 28,808 1.2 1.2Linens 'n Things, Inc. 160,800 5.0 5.0LionOre Mining International, Ltd 10,172,587 50.4 50.4Lipman Electronic Engineering, Ltd 8,400 0.2 0.2Lite-On Technology Corp. 215,000 0.3 0.3Littelfuse, Inc. 14,800 0.5 0.5Live Nation 267,625 4.1 4.1Liz Claiborne, Inc. 48,881 2.0 2.0Lloyds TSB Group Plc 3,302,301 32.4 32.4Loblaw Companies Limited 1,187,599 66.9 106.5 173.4Localiza Rent a Car, S.A. 40,001 0.6 0.6Lockheed Martin Corp. 526,823 39.2 39.2Loews Corp - Carolina Group 31,100 1.6 1.6Loews Corporation 78,258 8.7 8.7Logitech International, S.A. 31,582 1.7 1.7Lojas Renner, S.A. 16,200 0.6 0.6London Merchant Securities Plc 2,368,483 11.5 11.5London Stock Exchange Plc 14,386 0.2 0.2Lone Star Steakhouse & Saloon 44,411 1.2 1.2Longs Drug Stores Corporation 141,200 6.0 6.0Lonza Group AG 19,416 1.4 1.4Lottomatica, S.p.A. 6,871 0.3 0.3
124
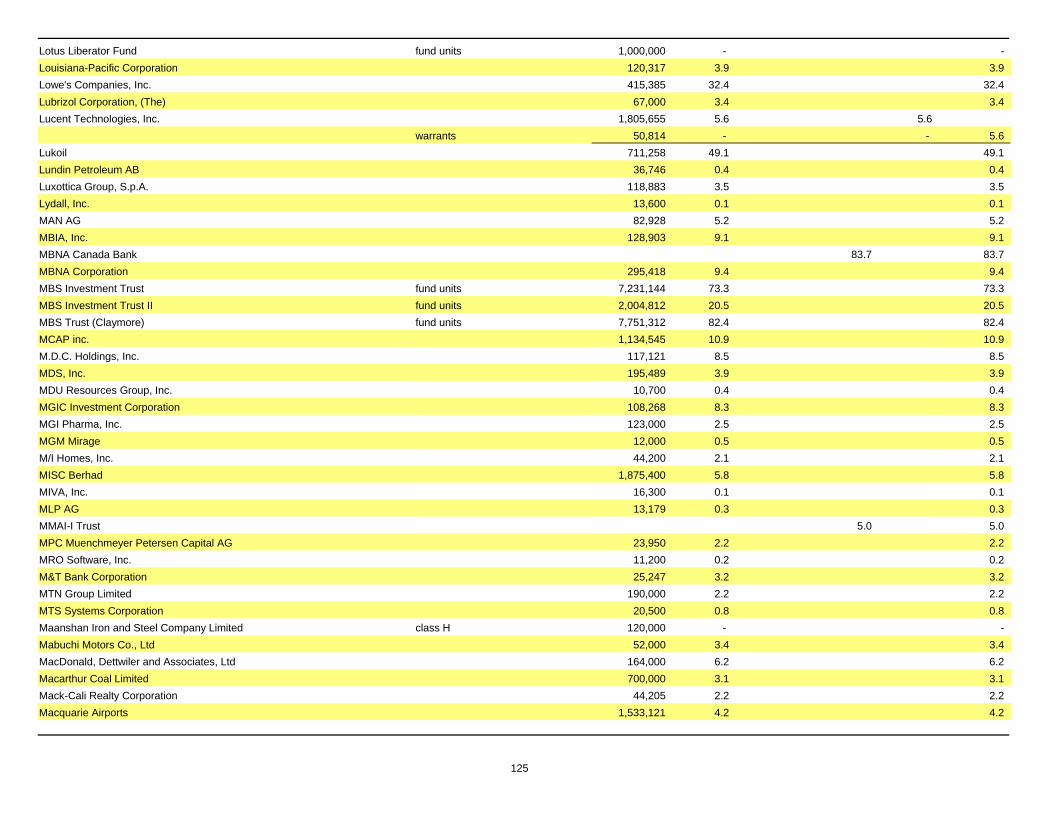
Lotus Liberator Fund fund units 1,000,000 - -Louisiana-Pacific Corporation 120,317 3.9 3.9Lowe's Companies, Inc. 415,385 32.4 32.4Lubrizol Corporation, (The) 67,000 3.4 3.4Lucent Technologies, Inc. 1,805,655 5.6 5.6
warrants 50,814 - - 5.6Lukoil 711,258 49.1 49.1Lundin Petroleum AB 36,746 0.4 0.4Luxottica Group, S.p.A. 118,883 3.5 3.5Lydall, Inc. 13,600 0.1 0.1MAN AG 82,928 5.2 5.2MBIA, Inc. 128,903 9.1 9.1MBNA Canada Bank 83.7 83.7MBNA Corporation 295,418 9.4 9.4MBS Investment Trust fund units 7,231,144 73.3 73.3MBS Investment Trust II fund units 2,004,812 20.5 20.5MBS Trust (Claymore) fund units 7,751,312 82.4 82.4MCAP inc. 1,134,545 10.9 10.9M.D.C. Holdings, Inc. 117,121 8.5 8.5MDS, Inc. 195,489 3.9 3.9MDU Resources Group, Inc. 10,700 0.4 0.4MGIC Investment Corporation 108,268 8.3 8.3MGI Pharma, Inc. 123,000 2.5 2.5MGM Mirage 12,000 0.5 0.5M/I Homes, Inc. 44,200 2.1 2.1MISC Berhad 1,875,400 5.8 5.8MIVA, Inc. 16,300 0.1 0.1MLP AG 13,179 0.3 0.3MMAI-I Trust 5.0 5.0MPC Muenchmeyer Petersen Capital AG 23,950 2.2 2.2MRO Software, Inc. 11,200 0.2 0.2M&T Bank Corporation 25,247 3.2 3.2MTN Group Limited 190,000 2.2 2.2MTS Systems Corporation 20,500 0.8 0.8Maanshan Iron and Steel Company Limited class H 120,000 - -Mabuchi Motors Co., Ltd 52,000 3.4 3.4MacDonald, Dettwiler and Associates, Ltd 164,000 6.2 6.2Macarthur Coal Limited 700,000 3.1 3.1Mack-Cali Realty Corporation 44,205 2.2 2.2Macquarie Airports 1,533,121 4.2 4.2
125

INVESTMENTS IN SHARES AND BONDS OF PUBLICLY TRADED COMPANIES as at December 31, 2005(fair value - in millions of dollars)
Designation ConvertibleSecurities
Bonds Subtotal Total
8
CORPORATIONS Shares Number Amount
(continued ) (continued)
Macquarie Bank Limited 209,409 12.2 12.2Macquarie Infrastructure Group 1,823,994 5.6 5.6Mag Silver Corporation 646,400 0.9 0.9
warrants 250,000 0.2 0.2 1.1Magenta Fund Limited, The fund units 140,197 18.7 18.7Magna International, Inc. 24.0 24.0
class A 3,323,192 279.1 279.1 303.1Magnetek, Inc. 32,200 0.1 0.1Magnum Corporation Berhad 1,092,900 0.6 0.6Maguire Properties, Inc. 28,800 1.0 1.0Magyar Olaj-es Gazipari Rt. 33,900 3.7 3.7Magyar Telekom Rt 344,732 1.8 1.8Makalot Industrial Co., Ltd 242,000 0.4 0.4Makhteshim-Agan Industries, Ltd 117,861 0.8 0.8Makita Corporation 51,100 1.5 1.5Malakoff Berhad 709,500 1.8 1.8Man Group 119,702 4.6 4.6Manaris Corporation 66,047 - -Manhattan Associates, Inc. 19,200 0.5 0.5Manicouagan Minerals Inc. 414,500 0.1 0.1Manulife Financial Corporation 7,902,408 539.5 539.5Manitoba Telecom Services, Inc. 56.6 56.6Manitowoc Company 30,700 1.8 1.8Manor Care, Inc. 44,402 2.1 2.1Manpower, Inc. 17,517 1.0 1.0Mansfield Trust CMBS 4.4 4.4Mantech International Corporation class A 10,600 0.3 0.3Manulife Bank of Canada 15.1 15.1Mapinfo Corporation 11,600 0.2 0.2Maple Leaf Foods, Inc. 1,000,000 15.2 15.2Maple NHA Mortgage Trust 175.1 175.1Mapleridge Fund Limited fund units 117,657 15.0 15.0Marakand Minerals, Ltd 4,645,000 1.9 1.9Marathon Oil Corp. 351,360 25.0 25.0Marathon Overseas Fund Ltd fund units 83,098 24.8 24.8
126

Marathon PGM Corporation 200,000 0.8 0.8March Networks Corporation 194,236 6.3 6.3Marcus Corporation 57,841 1.6 1.6MarineMax, Inc. 51,500 1.9 1.9Maritimes & Northeast Pipeline, Ltd Partnership 10.4 10.4Marks & Spencer Group Plc 1,055,222 10.7 10.7Maroc Telecom 52,200 0.6 0.6Marriott International, Inc. class A 83,827 6.6 6.6Marsh & McLennan Companies, Inc. 115,789 4.3 4.3Marshall & Ilsley Corporation 28,980 1.5 1.5Marshall Wace Americas Fund Ltd fund units 270,000 33.5 33.5Marshall Wace European Tops Fund Limited fund units 207,009 28.7 28.7Martin Marietta Materials, Inc. 47,500 4.3 4.3Marubeni Corporation 619,000 3.9 3.9Marui Co., Ltd 219,800 5.0 5.0Masco Corp. 225,489 8.0 8.0Massey Energy Company 10,900 0.5 0.5Massmart Holdings Limited 500,718 4.8 4.8Matamec Explorations Inc. 1,213,300 0.1 0.1Matria Healthcare, Inc. 10,000 0.4 0.4Matsui Securities Co., Ltd. 49,200 0.8 0.8Matsumotokiyoshi Co., Ltd 42,500 1.6 1.6Matsushita Electric Industrial Co, Ltd 1,386,200 31.2 31.2Matsushita Electric Works, Ltd 152,000 1.7 1.7Mattel, Inc. 455,586 8.4 8.4Matthews International Corporation class A 44,700 1.9 1.9Maudore Minerals Ltd 266,662 0.1 0.1Maxim Integrated Products, Inc. 90,682 3.8 3.8Maximus, Inc. 7,400 0.3 0.3Maxis Comminications BHD 1,248,700 3.2 3.2Mayr-Melnhof Karton AG 923 0.2 0.2Maytag Corp. 5,473 0.1 0.1Mazarin, Inc. 5,503,955 0.3 0.3McCormick & Company Incorporated 20,339 0.7 0.7McDonald's Corporation 694,605 27.4 27.4McGraw-Hill Companies, Inc. 46,196 2.8 2.8McKesson Corporation 447,906 27.0 27.0McWatters Mining Inc. 84,804 - -MeadWestvaco Corporation 12,389 0.4 0.4Meade Instruments Corporation 32,100 0.1 0.1
127
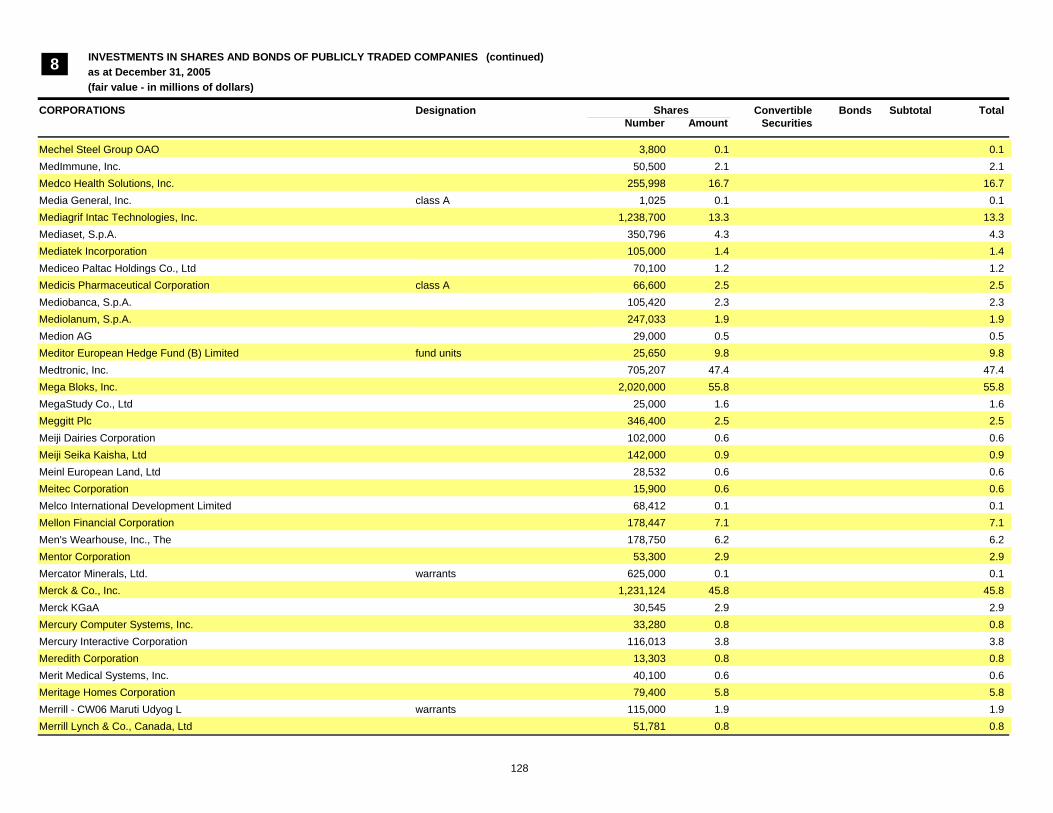
INVESTMENTS IN SHARES AND BONDS OF PUBLICLY TRADED COMPANIES as at December 31, 2005(fair value - in millions of dollars)
Designation ConvertibleSecurities
Bonds Subtotal Total
8
CORPORATIONS Shares Number Amount
(continued ) (continued)
Mechel Steel Group OAO 3,800 0.1 0.1MedImmune, Inc. 50,500 2.1 2.1Medco Health Solutions, Inc. 255,998 16.7 16.7Media General, Inc. class A 1,025 0.1 0.1Mediagrif Intac Technologies, Inc. 1,238,700 13.3 13.3Mediaset, S.p.A. 350,796 4.3 4.3Mediatek Incorporation 105,000 1.4 1.4Mediceo Paltac Holdings Co., Ltd 70,100 1.2 1.2Medicis Pharmaceutical Corporation class A 66,600 2.5 2.5Mediobanca, S.p.A. 105,420 2.3 2.3Mediolanum, S.p.A. 247,033 1.9 1.9Medion AG 29,000 0.5 0.5Meditor European Hedge Fund (B) Limited fund units 25,650 9.8 9.8Medtronic, Inc. 705,207 47.4 47.4Mega Bloks, Inc. 2,020,000 55.8 55.8MegaStudy Co., Ltd 25,000 1.6 1.6Meggitt Plc 346,400 2.5 2.5Meiji Dairies Corporation 102,000 0.6 0.6Meiji Seika Kaisha, Ltd 142,000 0.9 0.9Meinl European Land, Ltd 28,532 0.6 0.6Meitec Corporation 15,900 0.6 0.6Melco International Development Limited 68,412 0.1 0.1Mellon Financial Corporation 178,447 7.1 7.1Men's Wearhouse, Inc., The 178,750 6.2 6.2Mentor Corporation 53,300 2.9 2.9Mercator Minerals, Ltd. warrants 625,000 0.1 0.1Merck & Co., Inc. 1,231,124 45.8 45.8Merck KGaA 30,545 2.9 2.9Mercury Computer Systems, Inc. 33,280 0.8 0.8Mercury Interactive Corporation 116,013 3.8 3.8Meredith Corporation 13,303 0.8 0.8Merit Medical Systems, Inc. 40,100 0.6 0.6Meritage Homes Corporation 79,400 5.8 5.8Merrill - CW06 Maruti Udyog L warrants 115,000 1.9 1.9Merrill Lynch & Co., Canada, Ltd 51,781 0.8 0.8
128

Merrill Lynch & Company, Inc. 1,937,145 154.3 154.3Merrill Lynch Canada Finance Company 49.7 49.7Merrill Lynch Financial Assets, Inc. 187.7 187.7
CMBS 8.4 8.4 196.1Merrill Lynch Mortgage Investors CMBS 6.1 6.1Merrill Lynch Mortgage Loans 50.9 50.9
CMBS 2.7 2.7 53.6Merrill Lynch Mortgage Trust CMBS 27.4 27.4Mesa Air Group, Inc. 27,800 0.3 0.3MetLife, Inc. 555,021 31.8 31.8Metallic Ventures Gold, Inc. warrants 75,000 - -Metallica Resources, Inc. warrants 106,000 0.1 0.1Metanor Resources Inc. 729,734 0.4 0.4Metco Resources Inc. 2,766,641 0.2 0.2Methanex Corporation 37,000 0.8 0.8Methode Electronics, Inc. 20,300 0.2 0.2MethylGene, Inc. 1,836,945 3.7 3.7Metro AG 129,071 7.3 7.3Métro, Inc. 80.2 80.2
class A 4,183,700 127.6 127.6 207.8Metrovacesa, S.A. 12,347 0.9 0.9Metso Corporation 127,324 4.1 4.1Mezz Cap Securities Funding CMBS 0.9 0.9Michaels Stores, Inc. 700 - -Micron Technology, Inc. 112,793 1.8 1.8Micronas Semiconductor Holding AG 15,114 0.6 0.6Micros Systems, Inc. 29,100 1.6 1.6Microsemi Corporation 44,200 1.4 1.4Microsoft Corporation 5,881,003 179.6 179.6Midas, Inc. 44,600 1.0 1.0Migros Turk Ticaret 96,900 1.1 1.1Millea Holdings, Inc. 691 13.9 13.9Millennium Pharmaceuticals, Inc. 97,600 1.1 1.1Millipore Corporation 25,055 1.9 1.9Mills Corporation, The 7,016 0.3 0.3Minebea Co., Ltd 383,000 2.4 2.4Mines Lyon Lake Ltée 4,809,822 - -Mirabel Resources Inc. 400,000 0.1 0.1Miranda Technologies, Inc. 350,000 4.8 4.8Misumi Group, Inc. 19,900 1.0 1.0
129

INVESTMENTS IN SHARES AND BONDS OF PUBLICLY TRADED COMPANIES as at December 31, 2005(fair value - in millions of dollars)
Designation ConvertibleSecurities
Bonds Subtotal Total
8
CORPORATIONS Shares Number Amount
(continued ) (continued)
Misys Plc 1,795,446 8.6 8.6Mitac International Corporation 1,586,000 2.7 2.7Mitchells & Butlers Plc 294,533 2.5 2.5Mitsubishi Chemical Holdings Corporation 540,250 4.0 4.0Mitsubishi Corporation 689,400 17.8 17.8Mitsubishi Electric Corporation 1,176,500 9.7 9.7Mitsubishi Estate Co., Ltd 1,485,800 36.0 36.0Mitsubishi Gas Chemical Company, Inc. 178,000 2.0 2.0Mitsubishi Heavy Industries, Ltd 1,396,800 7.2 7.2Mitsubishi Logistics Corporation 50,000 1.0 1.0Mitsubishi Materials Corporation 443,000 2.6 2.6Mitsubishi Rayon Company, Ltd 248,000 1.9 1.9Mitsubishi Securities Co., Ltd 134,000 2.0 2.0Mitsubishi Tokyo Financial Group, Inc. 4,868 77.1 77.1Mitsui & Co., Ltd 1,051,500 15.8 15.8Mitsui Chemicals, Inc. 290,900 2.3 2.3Mitsui Engineering & Shipbuilding Co., Ltd 325,000 1.2 1.2Mitsui Fudosan Co., Ltd 682,393 16.2 16.2Mitsui Mining & Smelting Company Limited 368,000 2.7 2.7Mitsui O.S.K. Lines, Ltd 799,000 8.1 8.1Mitsui Sumitomo Insurance Company Limited 732,000 10.4 10.4Mitsui Trust Holdings, Inc. 365,000 5.1 5.1Mitsukoshi, Ltd 190,000 1.4 1.4Mitsumi Electric Company, Ltd 30,100 0.4 0.4Mittal Steel South Africa, Ltd 45,900 0.5 0.5Mizuho Financial Group, Inc. 5,662 52.4 52.4Mobile Mini, Inc. 14,800 0.8 0.8Mobile Telesystems 132,100 5.4 5.4Mobistar, S.A. 9,721 0.9 0.9Modern Times Group MTG AB class B 33,427 1.6 1.6Molex Incorporated 50,801 1.5 1.5Molson Coors Brewing Company class B 3,855 0.3 0.3Molson Coors Canada, Inc. class A 108,990 8.4 8.4
class B 144,843 11.2 11.2 19.6Monaco Coach Corporation 82,100 1.3 1.3
130
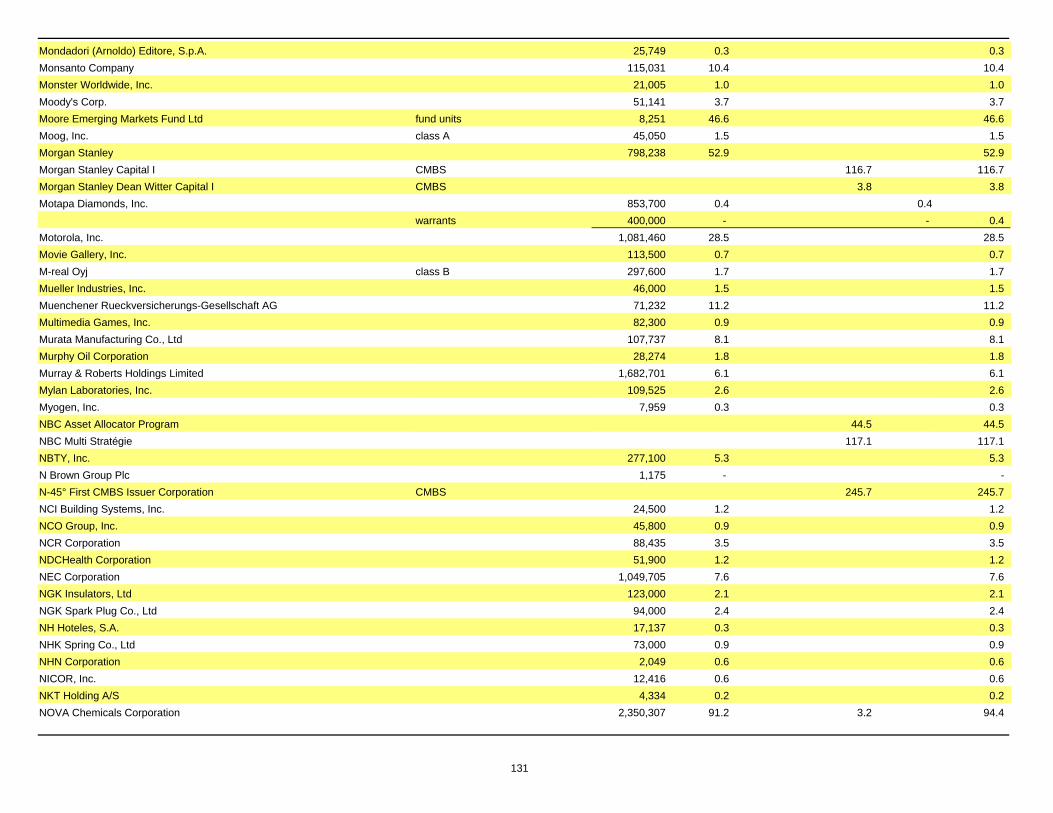
Mondadori (Arnoldo) Editore, S.p.A. 25,749 0.3 0.3Monsanto Company 115,031 10.4 10.4Monster Worldwide, Inc. 21,005 1.0 1.0Moody's Corp. 51,141 3.7 3.7Moore Emerging Markets Fund Ltd fund units 8,251 46.6 46.6Moog, Inc. class A 45,050 1.5 1.5Morgan Stanley 798,238 52.9 52.9Morgan Stanley Capital I CMBS 116.7 116.7Morgan Stanley Dean Witter Capital I CMBS 3.8 3.8Motapa Diamonds, Inc. 853,700 0.4 0.4
warrants 400,000 - - 0.4Motorola, Inc. 1,081,460 28.5 28.5Movie Gallery, Inc. 113,500 0.7 0.7M-real Oyj class B 297,600 1.7 1.7Mueller Industries, Inc. 46,000 1.5 1.5Muenchener Rueckversicherungs-Gesellschaft AG 71,232 11.2 11.2Multimedia Games, Inc. 82,300 0.9 0.9Murata Manufacturing Co., Ltd 107,737 8.1 8.1Murphy Oil Corporation 28,274 1.8 1.8Murray & Roberts Holdings Limited 1,682,701 6.1 6.1Mylan Laboratories, Inc. 109,525 2.6 2.6Myogen, Inc. 7,959 0.3 0.3NBC Asset Allocator Program 44.5 44.5NBC Multi Stratégie 117.1 117.1NBTY, Inc. 277,100 5.3 5.3N Brown Group Plc 1,175 - -N-45° First CMBS Issuer Corporation CMBS 245.7 245.7NCI Building Systems, Inc. 24,500 1.2 1.2NCO Group, Inc. 45,800 0.9 0.9NCR Corporation 88,435 3.5 3.5NDCHealth Corporation 51,900 1.2 1.2NEC Corporation 1,049,705 7.6 7.6NGK Insulators, Ltd 123,000 2.1 2.1NGK Spark Plug Co., Ltd 94,000 2.4 2.4NH Hoteles, S.A. 17,137 0.3 0.3NHK Spring Co., Ltd 73,000 0.9 0.9NHN Corporation 2,049 0.6 0.6NICOR, Inc. 12,416 0.6 0.6NKT Holding A/S 4,334 0.2 0.2NOVA Chemicals Corporation 2,350,307 91.2 3.2 94.4
131

INVESTMENTS IN SHARES AND BONDS OF PUBLICLY TRADED COMPANIES as at December 31, 2005(fair value - in millions of dollars)
Designation ConvertibleSecurities
Bonds Subtotal Total
8
CORPORATIONS Shares Number Amount
(continued ) (continued)
NOVA Gas Transmission, Ltd 20.2 20.2NSK, Ltd 225,000 1.8 1.8NSTAR 4,962 0.2 0.2NTN Corporation 307,700 2.8 2.8NTT Data Corporation 581 3.4 3.4NTT DoCoMo, Inc. 8,070 14.4 14.4NTT Urban Development Corporation 106 0.8 0.8NVIDIA Corporation 47,620 2.0 2.0NVR, Inc. 24,682 20.2 20.2Nabors Industries, Inc. 42,646 3.8 3.8Namco Bandai Holdings, Inc. 185,250 3.2 3.2Nampak Limited 193,410 0.6 0.6Nan Ya Plastic Corporation 2,420,290 3.9 3.9Nanophae Technologies Corporation 50,000 0.3 0.3Napster, Inc. 27,100 0.1 0.1Nash Finch Co. 70,900 2.1 2.1Naspers Limited class N 24,000 0.5 0.5National Australia Bank Limited 877,199 26.2 26.2National Bank of Greece, S.A. 123,442 6.1 6.1National Bank of Pakistan 30,000 0.1 0.1National City Corporation 216,993 8.5 8.5National Express Group Plc 13,085 0.2 0.2National Grid Transco Plc 3,096,227 35.3 35.3National Presto Industries, Inc. 11,800 0.6 0.6National Semiconductor Corporation 225,564 6.8 6.8National-Oilwell Varco, Inc. 43,900 3.2 3.2Nationwide Financial Services, Inc. class A 19,944 1.0 1.0Natures Sunshine Products, Inc. 62,195 1.3 1.3Nautilus Group, Inc. 99,700 2.2 2.2Navistar International Corporation 66,912 2.2 2.2Nec Electronics Corporation 17,000 0.6 0.6Neopost, S.A. 31,347 3.7 3.7Neptune Orient Lines Limited 29,000 0.1 0.1Ness Technologies, Inc. 30,300 0.4 0.4Neste Oil OYJ 79,559 2.6 2.6
132

Nestlé, S.A. 317,105 110.5 110.5Net One Systems Co., Ltd 928 2.6 2.6Netgear, Inc. 9,800 0.2 0.2Network Appliance, Inc. 39,706 1.2 1.2Network Equipment Technologies, Inc. 14,000 0.1 0.1Neurochem, Inc. 450,000 7.5 7.5Neurocrine Biosciences, Inc. 6,025 0.4 0.4Neuroscience Pharma (NPT), Inc. warrants 59 10.6 10.6Nevsun Resources, Ltd warrants 200,000 0.1 0.1New Century Fund Ped III fund units 195 - -New Century Holding V fund units 402 - -New York Times Company class A 9,906 0.3 0.3Newcrest Mining Limited 392,110 8.2 8.2Newell Rubbermaid, Inc. 216,610 6.0 6.0Newfield Exploration Company 1,400 0.1 0.1Newmont Mining Corporation Holdings Company 87,604 5.5 5.5News Corporation class A 1,089,232 19.8 19.8
class B 95,000 1.8 1.8 21.6Nexen, Inc. 80,604 4.5 15.0 19.5Next Plc 562,251 17.3 17.3Nextar, The Global Fund fund units 62,939 21.0 21.0Nextel Partners, Inc. class A 50,000 1.6 1.6Nichicon Corporation 7,500 0.1 0.1Nichii Gakkan Company 10,100 0.3 0.3Nichirei Corporation 114,000 0.6 0.6Nidec Corporation 89,200 8.8 8.8Nien Made Enterprise Co., Ltd 625,000 0.9 0.9Nihon Unisys, Ltd 55,700 0.9 0.9Nike, Inc. class B 33,079 3.4 3.4Nikko Cordial Corporation 562,512 10.4 10.4Nikon Corporation 128,000 2.4 2.4Nintendo Company, Ltd 65,920 9.3 9.3Niogold Mining Corp. 400,000 0.1 0.1Nippon Building Fund, Inc. fund units 165 1.6 1.6Nippon Electric Glass Co., Ltd 157,000 4.0 4.0Nippon Express Co., Ltd 1,026,000 7.3 7.3Nippon Kayaku Co., Ltd 71,000 0.7 0.7Nippon Light Metal Company, Ltd 212,000 0.7 0.7Nippon Meat Packers, Inc. 79,000 1.0 1.0Nippon Mining Holdings, Inc. 599,500 5.0 5.0
133
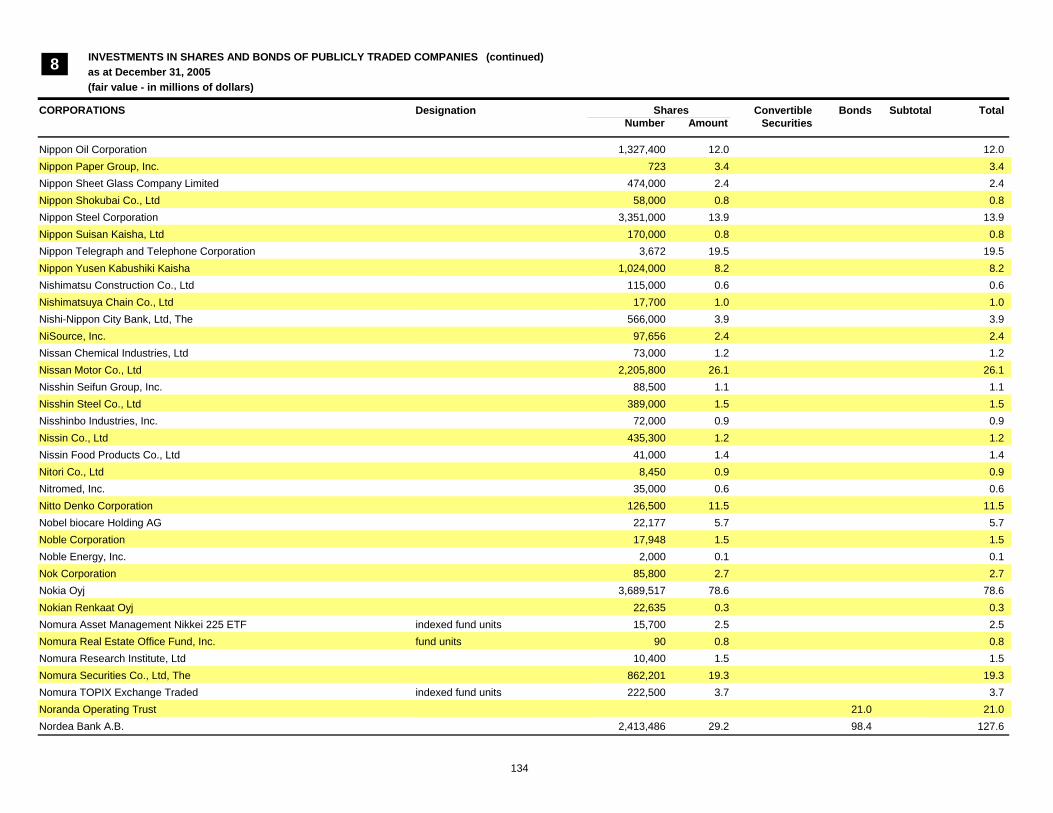
INVESTMENTS IN SHARES AND BONDS OF PUBLICLY TRADED COMPANIES as at December 31, 2005(fair value - in millions of dollars)
Designation ConvertibleSecurities
Bonds Subtotal Total
8
CORPORATIONS Shares Number Amount
(continued ) (continued)
Nippon Oil Corporation 1,327,400 12.0 12.0Nippon Paper Group, Inc. 723 3.4 3.4Nippon Sheet Glass Company Limited 474,000 2.4 2.4Nippon Shokubai Co., Ltd 58,000 0.8 0.8Nippon Steel Corporation 3,351,000 13.9 13.9Nippon Suisan Kaisha, Ltd 170,000 0.8 0.8Nippon Telegraph and Telephone Corporation 3,672 19.5 19.5Nippon Yusen Kabushiki Kaisha 1,024,000 8.2 8.2Nishimatsu Construction Co., Ltd 115,000 0.6 0.6Nishimatsuya Chain Co., Ltd 17,700 1.0 1.0Nishi-Nippon City Bank, Ltd, The 566,000 3.9 3.9NiSource, Inc. 97,656 2.4 2.4Nissan Chemical Industries, Ltd 73,000 1.2 1.2Nissan Motor Co., Ltd 2,205,800 26.1 26.1Nisshin Seifun Group, Inc. 88,500 1.1 1.1Nisshin Steel Co., Ltd 389,000 1.5 1.5Nisshinbo Industries, Inc. 72,000 0.9 0.9Nissin Co., Ltd 435,300 1.2 1.2Nissin Food Products Co., Ltd 41,000 1.4 1.4Nitori Co., Ltd 8,450 0.9 0.9Nitromed, Inc. 35,000 0.6 0.6Nitto Denko Corporation 126,500 11.5 11.5Nobel biocare Holding AG 22,177 5.7 5.7Noble Corporation 17,948 1.5 1.5Noble Energy, Inc. 2,000 0.1 0.1Nok Corporation 85,800 2.7 2.7Nokia Oyj 3,689,517 78.6 78.6Nokian Renkaat Oyj 22,635 0.3 0.3Nomura Asset Management Nikkei 225 ETF indexed fund units 15,700 2.5 2.5Nomura Real Estate Office Fund, Inc. fund units 90 0.8 0.8Nomura Research Institute, Ltd 10,400 1.5 1.5Nomura Securities Co., Ltd, The 862,201 19.3 19.3Nomura TOPIX Exchange Traded indexed fund units 222,500 3.7 3.7Noranda Operating Trust 21.0 21.0Nordea Bank A.B. 2,413,486 29.2 98.4 127.6
134
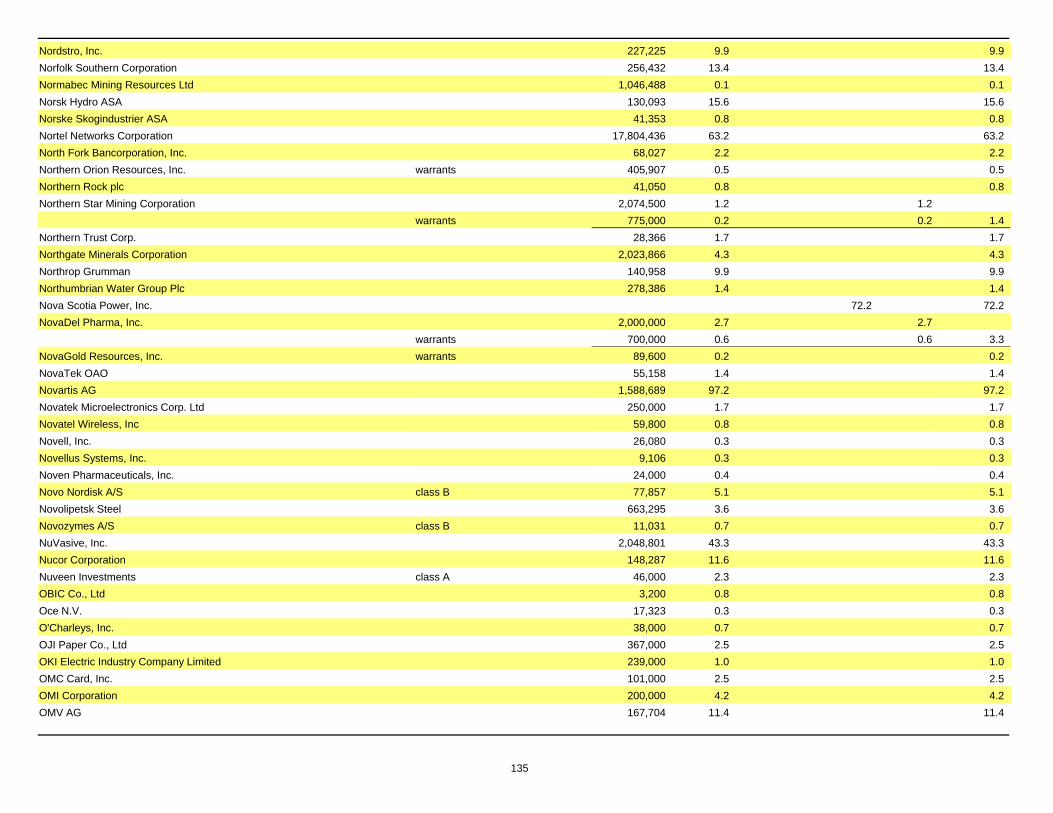
Nordstro, Inc. 227,225 9.9 9.9Norfolk Southern Corporation 256,432 13.4 13.4Normabec Mining Resources Ltd 1,046,488 0.1 0.1Norsk Hydro ASA 130,093 15.6 15.6Norske Skogindustrier ASA 41,353 0.8 0.8Nortel Networks Corporation 17,804,436 63.2 63.2North Fork Bancorporation, Inc. 68,027 2.2 2.2Northern Orion Resources, Inc. warrants 405,907 0.5 0.5Northern Rock plc 41,050 0.8 0.8Northern Star Mining Corporation 2,074,500 1.2 1.2
warrants 775,000 0.2 0.2 1.4Northern Trust Corp. 28,366 1.7 1.7Northgate Minerals Corporation 2,023,866 4.3 4.3Northrop Grumman 140,958 9.9 9.9Northumbrian Water Group Plc 278,386 1.4 1.4Nova Scotia Power, Inc. 72.2 72.2NovaDel Pharma, Inc. 2,000,000 2.7 2.7
warrants 700,000 0.6 0.6 3.3NovaGold Resources, Inc. warrants 89,600 0.2 0.2NovaTek OAO 55,158 1.4 1.4Novartis AG 1,588,689 97.2 97.2Novatek Microelectronics Corp. Ltd 250,000 1.7 1.7Novatel Wireless, Inc 59,800 0.8 0.8Novell, Inc. 26,080 0.3 0.3Novellus Systems, Inc. 9,106 0.3 0.3Noven Pharmaceuticals, Inc. 24,000 0.4 0.4Novo Nordisk A/S class B 77,857 5.1 5.1Novolipetsk Steel 663,295 3.6 3.6Novozymes A/S class B 11,031 0.7 0.7NuVasive, Inc. 2,048,801 43.3 43.3Nucor Corporation 148,287 11.6 11.6Nuveen Investments class A 46,000 2.3 2.3OBIC Co., Ltd 3,200 0.8 0.8Oce N.V. 17,323 0.3 0.3O'Charleys, Inc. 38,000 0.7 0.7OJI Paper Co., Ltd 367,000 2.5 2.5OKI Electric Industry Company Limited 239,000 1.0 1.0OMC Card, Inc. 101,000 2.5 2.5OMI Corporation 200,000 4.2 4.2OMV AG 167,704 11.4 11.4
135
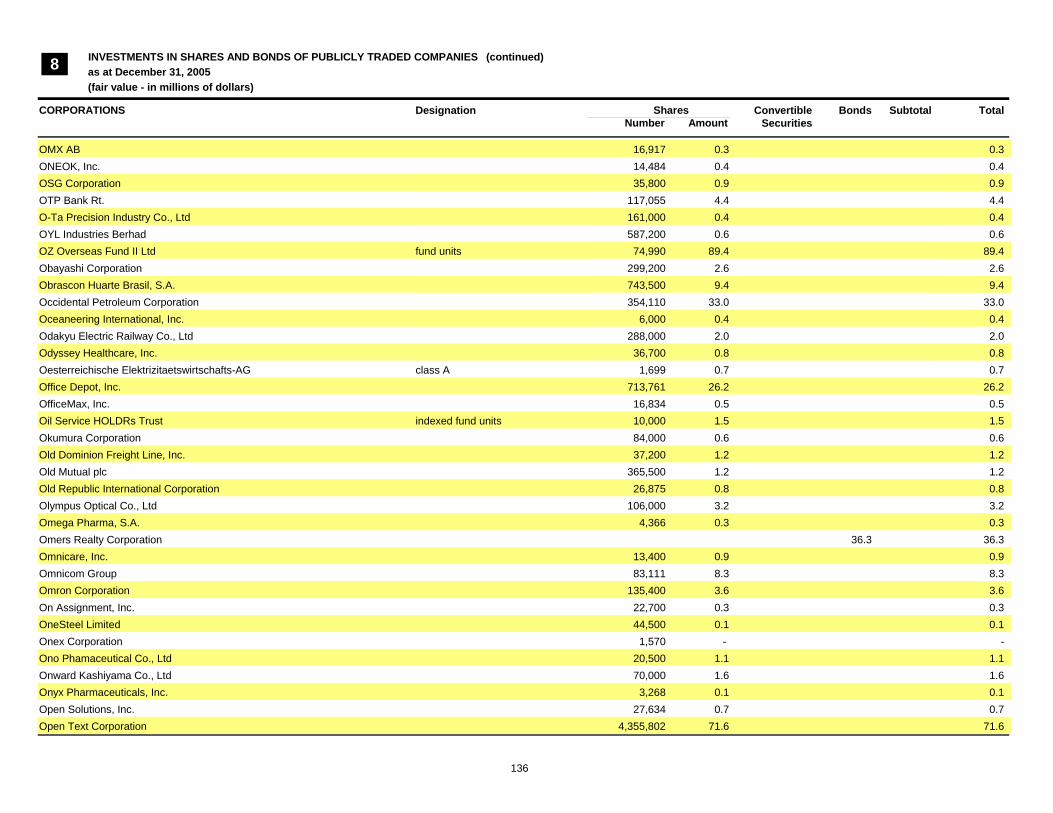
INVESTMENTS IN SHARES AND BONDS OF PUBLICLY TRADED COMPANIES as at December 31, 2005(fair value - in millions of dollars)
Designation ConvertibleSecurities
Bonds Subtotal Total
8
CORPORATIONS Shares Number Amount
(continued ) (continued)
OMX AB 16,917 0.3 0.3ONEOK, Inc. 14,484 0.4 0.4OSG Corporation 35,800 0.9 0.9OTP Bank Rt. 117,055 4.4 4.4O-Ta Precision Industry Co., Ltd 161,000 0.4 0.4OYL Industries Berhad 587,200 0.6 0.6OZ Overseas Fund II Ltd fund units 74,990 89.4 89.4Obayashi Corporation 299,200 2.6 2.6Obrascon Huarte Brasil, S.A. 743,500 9.4 9.4Occidental Petroleum Corporation 354,110 33.0 33.0Oceaneering International, Inc. 6,000 0.4 0.4Odakyu Electric Railway Co., Ltd 288,000 2.0 2.0Odyssey Healthcare, Inc. 36,700 0.8 0.8Oesterreichische Elektrizitaetswirtschafts-AG class A 1,699 0.7 0.7Office Depot, Inc. 713,761 26.2 26.2OfficeMax, Inc. 16,834 0.5 0.5Oil Service HOLDRs Trust indexed fund units 10,000 1.5 1.5Okumura Corporation 84,000 0.6 0.6Old Dominion Freight Line, Inc. 37,200 1.2 1.2Old Mutual plc 365,500 1.2 1.2Old Republic International Corporation 26,875 0.8 0.8Olympus Optical Co., Ltd 106,000 3.2 3.2Omega Pharma, S.A. 4,366 0.3 0.3Omers Realty Corporation 36.3 36.3Omnicare, Inc. 13,400 0.9 0.9Omnicom Group 83,111 8.3 8.3Omron Corporation 135,400 3.6 3.6On Assignment, Inc. 22,700 0.3 0.3OneSteel Limited 44,500 0.1 0.1Onex Corporation 1,570 - -Ono Phamaceutical Co., Ltd 20,500 1.1 1.1Onward Kashiyama Co., Ltd 70,000 1.6 1.6Onyx Pharmaceuticals, Inc. 3,268 0.1 0.1Open Solutions, Inc. 27,634 0.7 0.7Open Text Corporation 4,355,802 71.6 71.6
136
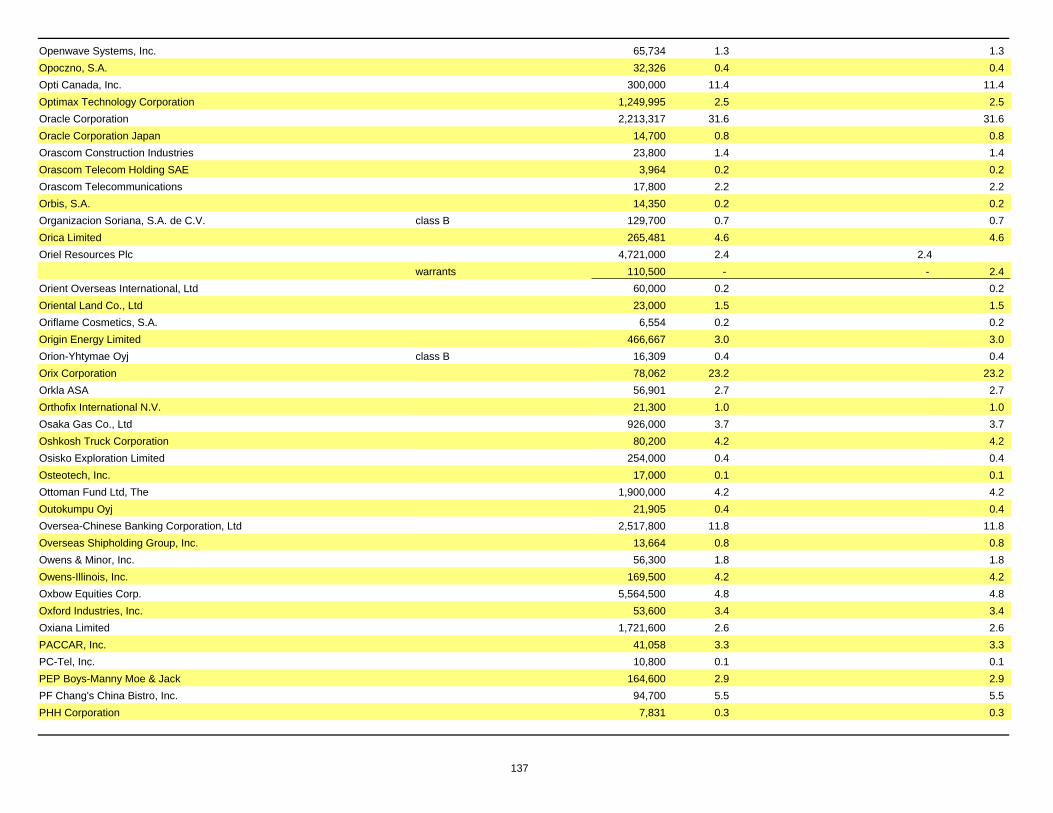
Openwave Systems, Inc. 65,734 1.3 1.3Opoczno, S.A. 32,326 0.4 0.4Opti Canada, Inc. 300,000 11.4 11.4Optimax Technology Corporation 1,249,995 2.5 2.5Oracle Corporation 2,213,317 31.6 31.6Oracle Corporation Japan 14,700 0.8 0.8Orascom Construction Industries 23,800 1.4 1.4Orascom Telecom Holding SAE 3,964 0.2 0.2Orascom Telecommunications 17,800 2.2 2.2Orbis, S.A. 14,350 0.2 0.2Organizacion Soriana, S.A. de C.V. class B 129,700 0.7 0.7Orica Limited 265,481 4.6 4.6Oriel Resources Plc 4,721,000 2.4 2.4
warrants 110,500 - - 2.4Orient Overseas International, Ltd 60,000 0.2 0.2Oriental Land Co., Ltd 23,000 1.5 1.5Oriflame Cosmetics, S.A. 6,554 0.2 0.2Origin Energy Limited 466,667 3.0 3.0Orion-Yhtymae Oyj class B 16,309 0.4 0.4Orix Corporation 78,062 23.2 23.2Orkla ASA 56,901 2.7 2.7Orthofix International N.V. 21,300 1.0 1.0Osaka Gas Co., Ltd 926,000 3.7 3.7Oshkosh Truck Corporation 80,200 4.2 4.2Osisko Exploration Limited 254,000 0.4 0.4Osteotech, Inc. 17,000 0.1 0.1Ottoman Fund Ltd, The 1,900,000 4.2 4.2Outokumpu Oyj 21,905 0.4 0.4Oversea-Chinese Banking Corporation, Ltd 2,517,800 11.8 11.8Overseas Shipholding Group, Inc. 13,664 0.8 0.8Owens & Minor, Inc. 56,300 1.8 1.8Owens-Illinois, Inc. 169,500 4.2 4.2Oxbow Equities Corp. 5,564,500 4.8 4.8Oxford Industries, Inc. 53,600 3.4 3.4Oxiana Limited 1,721,600 2.6 2.6PACCAR, Inc. 41,058 3.3 3.3PC-Tel, Inc. 10,800 0.1 0.1PEP Boys-Manny Moe & Jack 164,600 2.9 2.9PF Chang's China Bistro, Inc. 94,700 5.5 5.5PHH Corporation 7,831 0.3 0.3
137

INVESTMENTS IN SHARES AND BONDS OF PUBLICLY TRADED COMPANIES as at December 31, 2005(fair value - in millions of dollars)
Designation ConvertibleSecurities
Bonds Subtotal Total
8
CORPORATIONS Shares Number Amount
(continued ) (continued)
PMC-Sierra, Inc. 12,511 0.1 0.1PNC Financial Services Group 46,252 3.3 3.3POBT Strategy Fund, Ltd fund units 169,056 28.7 28.7POBT Symmetry Fund, Ltd fund units 139,159 33.8 33.8PPG Industries, Inc. 85,704 5.8 5.8PPL Corp. 79,854 2.7 2.7PPR, S.A. 111,861 14.7 14.7PRA International 587,895 19.3 19.3PS Business Parks, Inc. fund units 184,400 10.6 10.6PSP Swiss Property AG 8,276 0.4 0.4PT Aneka Tambang Tbk 607,000 0.3 0.3PT Astra International 2,185,000 2.6 2.6PT Bank Central Asia Tbk 2,489,500 1.0 1.0PT Bank Mandiri 16,328,658 3.2 3.2PT Bank Rakyat Indonesia 9,239,500 3.3 3.3PT Berlian Laju Tanker Tbk 1,053,000 0.1 0.1PT Bumi Resources Tbk 3,627,000 0.3 0.3PT Indocement Tunggal Prakarsa Tbk 7,199,000 3.0 3.0PT Indosat (Persero) Tbk 1,210,000 0.8 0.8PT Medco Energi International TBK 1,425,700 0.6 0.6PT Multimedia - Serviços de Telecomuniccacões e Multimedia, SGPS, S.A. 17,224 0.2 0.2PT Ramayana Lestari Sentosa Tbk 1,090,000 0.1 0.1PT Telekomunikasi Indonesia 24,795,936 17.9 17.9PTT Chemical Pcl 87,594 0.2 0.2PTT Exploration and Production Public Company Limited 689,100 9.3 9.3PTT Public Company Limited 1,225,500 7.9 7.9Pacific Gas & Electric Company 211,425 9.2 9.2Pactiv Corporation 34,383 0.9 0.9Pactual Internet Fund, Ltd fund units 559 - -Paddy Power Plc 9,883 0.2 0.2PagesJaunes, S.A. 27,671 0.8 0.8Pakistan State Oil Co., Ltd 30,800 0.2 0.2Pakistan Telecommunications Company, Ltd 80,000 0.1 0.1Paladin Resources Limited 17,967,204 31.6 31.6Pall Corporation 18,306 0.6 0.6
138

Paloma Fund Limited fund units 33,132 44.2 44.2Pan American Silver Corporation 40,000 0.9 0.9Pan Pacific Retail Properties, Inc. fund units 98,800 7.7 7.7Panera Bread Company class A 99,800 7.7 7.7Papa John's International, Inc. 49,800 3.4 3.4PaperlinX Limited 22,300 0.1 0.1Paragon Group Companies Plc 27,398 0.4 0.4Parametric Technology Corporation 76,192 0.5 0.5Parexel International Corporation 29,300 0.7 0.7Paris Miki, Inc. 39,000 0.9 0.9Park Electrochemical Corporation 10,200 0.3 0.3Parker Hannifin Corp. 45,357 3.5 3.5Parkson Retail Group, Ltd 17,500 - -Parkway Properties, Inc. 10,400 0.5 0.5Parmalat, S.p.A. 80,715 0.2 0.2PartyGaming Plc 8,518 - -Pason Systems, Inc. 474,600 13.7 13.7Patheon, Inc. 1,204,591 6.8 6.8Patrick Corporation Limited 72,981 0.5 0.5Patterson Companies, Inc. 14,741 0.6 0.6Patterson-UTI Energy, Inc. 114,537 4.4 4.4Paulson Advantage Ltd fund units 218,436 28.9 28.9Paxar Corporation 20,500 0.5 0.5Paychex, Inc. 48,770 2.2 2.2Peabody Energy Corporation 1,500 0.1 0.1Pearson Plc 31,363 0.4 0.4Pediatrix Medical Group, Inc. 37,700 3.9 3.9Peet's Coffee & Tea, Inc. 62,279 2.2 2.2Pegasus Fund Limited, The fund units 1,915,303 37.2 37.2Pegasus Solutions, Inc. 10,500 0.1 0.1Peninsular & Orie 869,177 8.1 8.1Penn Virginia Corporation 4,000 0.3 0.3Penn West Energy Trust 1,246,900 47.4 47.4Pennon Group Plc 57,622 1.4 1.4People's Choice Financial Corporation 2,950,000 34.8 34.8Peoples Energy Corporation 9,004 0.4 0.4Peoples Trust 36.6 36.6Pepco Holdings, Inc. 3,779 0.1 0.1Pepsi Bottling Group, Inc., The 581,887 19.4 19.4PepsiAmericas, Inc. 17,107 0.5 0.5
139

INVESTMENTS IN SHARES AND BONDS OF PUBLICLY TRADED COMPANIES as at December 31, 2005(fair value - in millions of dollars)
Designation ConvertibleSecurities
Bonds Subtotal Total
8
CORPORATIONS Shares Number Amount
(continued ) (continued)
Pepsico, Inc. 1,049,157 72.4 72.4Perdigao, S.A. preferred 151,500 6.0 6.0Peregrine Diamonds, Ltd special warrants 170,000 0.8 0.8Performance Food Group Company 191,769 6.4 6.4Pericom Semiconductor Corporation 14,900 0.1 0.1PerkinElmer, Inc. 67,230 1.8 1.8Pernod-Ricard, S.A. 52,537 10.7 10.7Perpetual Limited 22,000 1.3 1.3Persimmon Plc 2,813 0.1 0.1Petco Animal Supplies, Inc. 11,048 0.3 0.3Peter Hambro Mining Plc 25,527 0.5 0.5Petkim Petrokimya Holdings, A.S. 27,268 0.2 0.2Petro-Canada 10,013,490 467.1 467.1Petrochina Company Limited 9,150,000 8.7 8.7Petroleo Brasileiro, S.A. - Petrobras 20,018 1.7 1.7
class A 452,203 34.0 34.0preferred 1,579,800 29.4 29.4 65.1
Petroleum Geo-Services ASA 14,820 0.5 0.5Petrolia Inc. 992,787 0.4 0.4Peugeot Citroen, PSA 39,510 2.6 2.6Pfizer, Inc. 6,460,432 176.0 176.0Pharmaceutical Product Development, Inc 76,900 5.6 5.6Pharo Arbitrage Fund Ltd fund units 35,026 79.3 79.3Phase Forward, Inc. 71,513 0.8 0.8Phelps Dodge Corporation 76,787 12.9 12.9Philippine Long Distance Telephone Company 22,300 0.9 0.9Phillips-Van Heusen 117,200 4.4 4.4Phoenix Technologies, Ltd 11,600 0.1 0.1Phonak Holding AG 11,469 0.6 0.6Photon Dynamics, Inc. 9,000 0.2 0.2Photronics, Inc. 9,800 0.2 0.2Pick'n Pay Stores Limited 19,600 0.1 0.1Pilgrim's Pride Corporation 16,369 0.6 0.6Pine Valley Mining Corporation 325,000 0.8 0.8
warrants 162,500 0.1 0.1 0.9
140

Ping An Insurance (Group) Company of China Limited class H 229,000 0.5 0.5Pinnacle Entertainment, Inc. 146,100 4.2 4.2Pinnacle West Capital Corporation 6,759 0.3 0.3Pioneer Corporation 70,400 1.1 1.1Pioneer Natural Resources Company 1,600 0.1 0.1Pirelli & C. Real Estate, S.p.A. 11,500 0.7 0.7Pirelli & C., S.p.A. 1,193,385 1.3 1.3Pitney Bowes, Inc. 15,575 0.8 0.8Placer Dome, Inc. 5,983,798 159.3 159.3Plains Exploration & Production Company 16,100 0.8 0.8Planar Systems, Inc. 8,800 0.1 0.1Planet Trust 35.0 35.0Platinum Group Metals Limited warrants 400,000 0.2 0.2Plato Learning, Inc. 195,000 1.8 1.8Playtex Products, Inc. 215,400 3.4 3.4Plenus Co., Ltd 8,000 0.3 0.3Plexmar Resources Inc. 3,130,166 0.2 0.2Plug Power, Inc. 695,556 4.2 4.2Plum Creek Timber Company, Inc. 12,566 0.5 0.5Plus Expressways Berhad 1,234,200 1.2 1.2Pogo Producing Company 35,973 2.1 2.1Polaris Industries, Inc. 163,267 9.6 9.6Polaris Securities Co., Ltd 293,000 0.2 0.2Polski Koncern Naftowy Orlen, S.A. 70,826 1.6 1.6PolyMedica Corporation 36,047 1.4 1.4Porsche AG preferred 4,637 3.9 3.9Porto Seguro, S.A. 23,175 0.3 0.3Portofolio Recovery Associates, Inc. 6,900 0.4 0.4Portugal Telecom SGPS, S.A. 475,688 5.6 5.6Posco 35,544 8.3 8.3Possis Medical, Inc. 17,600 0.2 0.2Potash Corporation of Saskatchewan 336,825 31.4 31.4Power Corporation of Canada 4,750,921 150.4 150.4Power Financial Corporation 10,253,188 342.5 42.2 384.7Power Integrations, Inc. 30,300 0.8 0.8Powerchip Semiconductor Corp. 3,192,000 2.5 2.5Powertech Technology, Inc. 750,000 2.9 2.9Powszechna Kasa Oszczednosci Bank Polski, S.A. 496,906 5.2 5.2Praktiker Bau-und Heimwerkermaerkte Holdings AG class A 12,830 0.3 0.3Praxair, Inc. 224,983 13.9 13.9
141

INVESTMENTS IN SHARES AND BONDS OF PUBLICLY TRADED COMPANIES as at December 31, 2005(fair value - in millions of dollars)
Designation ConvertibleSecurities
Bonds Subtotal Total
8
CORPORATIONS Shares Number Amount
(continued ) (continued)
Pre-Paid Legal Services, Inc. 40,700 1.8 1.8Precision Drilling Trust 2,000,022 76.8 76.8Premier Farnell Plc 961,527 3.3 3.3Premiere AG 14,469 0.3 0.3Prentiss Properties Trust 29,100 1.4 1.4Prescient NeuroPharma, Inc. 1,127,128 - -President Chain Store Corp. 690,000 1.7 1.7Priargunsky Plant 363 0.1 0.1Primaris Retail Real Estate Investment Trust 46,900 0.8 0.8Principal Financial Group, The 67,527 3.7 3.7Procter & Gamble Company, The 1,825,596 123.4 123.4Procyon BioPharma, Inc. 2,796,287 0.9 0.9
warrants 1,905,556 0.1 0.4 0.5 1.4Progress Energy, Inc. 40,882 2.1 2.1Progress Software Corporation 32,400 1.1 1.1Progressive Corporation, The 72,267 9.9 9.9ProLogis fund units 147,825 8.1 8.1Promet Berhad 127,000 - -Prometic Life Sciences, Inc. 3,000,000 1.1 1.1Promise Co., Ltd 40,350 3.1 3.1Promotora Ambiental, S.A. de C.V. (BMU: PASA) 1,951,400 4.2 4.2Promotora de Informaciones, S.A. (Prisa) 33,503 0.7 0.7Prosafe ASA 8,860 0.4 0.4ProSiebenSat.1 Media AG preferred 47,806 1.1 1.1Pro-Spect-Or Resources Inc. 17,959 - -Prosperity REIT 42,809 - -Protective Life Corporation 9,267 0.5 0.5Prudential Financial, Inc. 207,179 17.7 17.7Prudential Mortgage Capital Funding, LLC CMBS 2.5 2.5Prudential Plc 3,234,922 35.7 35.7Public Bank Berhad 394,000 0.8 0.8
class E 943,000 1.9 1.9 2.7Public Power Corporation 84,956 2.2 2.2Public Service Enterprise Goup 139,216 10.6 10.6Public Storage, Inc. 14,745 1.2 1.2
142

Publicis 187,551 7.6 7.6Publishing & Broadcasting Limited 312,100 4.4 4.4Puget Energy, Inc. 61,619 1.5 1.5Pulte Homes, Inc. 182,947 8.4 8.4Puma AG 5,338 1.8 1.8Puma Exploration Inc 1,051,000 0.2 0.2Pusan Bank 176,020 2.7 2.7Pyaterochka Holding N.V. 25,000 0.4 0.4QBE Insurance Group Limited 1,101,924 18.5 18.5Q-Cells AG 254 - -QLT, Inc. 1,183,955 8.8 8.8QLogic Corporation 61,024 2.3 2.3Q.P. Corporation 46,500 0.5 0.5Qiagen N.V. 30,960 0.4 0.4Qualcomm Incorporated 1,112,075 56.0 56.0Quality Systems, Inc. 9,500 0.8 0.8Quantitative Enhanced Decisions Fund, L.P. 44.3 44.3Quay Magnesium Limited 77,200 - -Quebecor World, Inc. 75,843 1.2 41.6 42.8Quebecor, Inc. class A 310,565 7.9 7.9
class B 3,606,611 92.5 92.5 100.4Quest Diagnostics Incorporated 92,838 5.6 5.6Quicksilver Resources, Inc. 5,000 0.2 0.2Quiksilver, Inc. 409,400 6.6 6.6Qwest Communications International, Inc. 3,536,303 23.3 23.3RAO Unified Energy Systems 10,924 0.5 0.5RBC Capital Trust 326.2 326.2RHI AG 4,545 0.1 0.1RHJ International SA 864,183 13.4 13.4RLI Corp. 96,200 5.6 5.6RWE AG 145,515 12.5 12.5
preferred 11,924 0.9 0.9 13.4Rabobank Nederland 323.2 323.2Radian Group, Inc. 70,984 4.9 4.9Radiant Systems, Inc. 11,800 0.2 0.2RadioShack Corporation 131,392 3.2 3.2Radisson Mining Resources Inc. 635,125 0.2 0.2Radisys Corporation 12,600 0.3 0.3Raiffeisen International Bank Holding AG 21,069 1.6 1.6Rakuten, Inc. 1,902 2.2 2.2
143
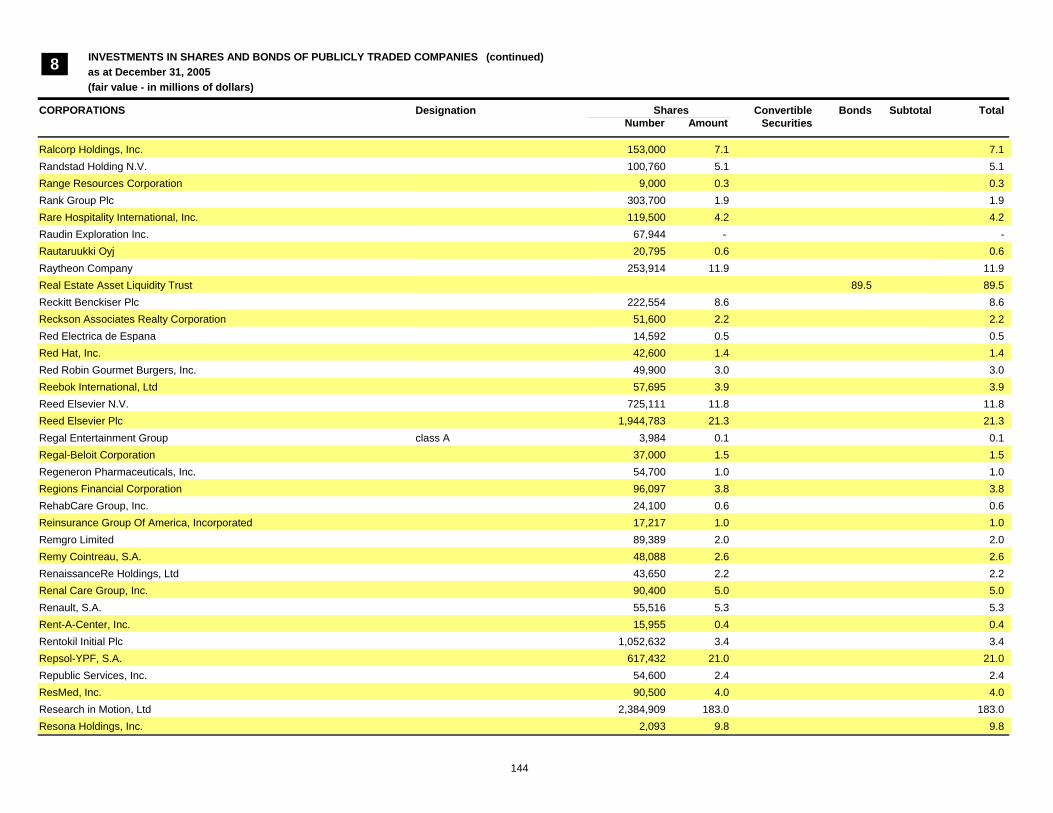
INVESTMENTS IN SHARES AND BONDS OF PUBLICLY TRADED COMPANIES as at December 31, 2005(fair value - in millions of dollars)
Designation ConvertibleSecurities
Bonds Subtotal Total
8
CORPORATIONS Shares Number Amount
(continued ) (continued)
Ralcorp Holdings, Inc. 153,000 7.1 7.1Randstad Holding N.V. 100,760 5.1 5.1Range Resources Corporation 9,000 0.3 0.3Rank Group Plc 303,700 1.9 1.9Rare Hospitality International, Inc. 119,500 4.2 4.2Raudin Exploration Inc. 67,944 - -Rautaruukki Oyj 20,795 0.6 0.6Raytheon Company 253,914 11.9 11.9Real Estate Asset Liquidity Trust 89.5 89.5Reckitt Benckiser Plc 222,554 8.6 8.6Reckson Associates Realty Corporation 51,600 2.2 2.2Red Electrica de Espana 14,592 0.5 0.5Red Hat, Inc. 42,600 1.4 1.4Red Robin Gourmet Burgers, Inc. 49,900 3.0 3.0Reebok International, Ltd 57,695 3.9 3.9Reed Elsevier N.V. 725,111 11.8 11.8Reed Elsevier Plc 1,944,783 21.3 21.3Regal Entertainment Group class A 3,984 0.1 0.1Regal-Beloit Corporation 37,000 1.5 1.5Regeneron Pharmaceuticals, Inc. 54,700 1.0 1.0Regions Financial Corporation 96,097 3.8 3.8RehabCare Group, Inc. 24,100 0.6 0.6Reinsurance Group Of America, Incorporated 17,217 1.0 1.0Remgro Limited 89,389 2.0 2.0Remy Cointreau, S.A. 48,088 2.6 2.6RenaissanceRe Holdings, Ltd 43,650 2.2 2.2Renal Care Group, Inc. 90,400 5.0 5.0Renault, S.A. 55,516 5.3 5.3Rent-A-Center, Inc. 15,955 0.4 0.4Rentokil Initial Plc 1,052,632 3.4 3.4Repsol-YPF, S.A. 617,432 21.0 21.0Republic Services, Inc. 54,600 2.4 2.4ResMed, Inc. 90,500 4.0 4.0Research in Motion, Ltd 2,384,909 183.0 183.0Resona Holdings, Inc. 2,093 9.8 9.8
144
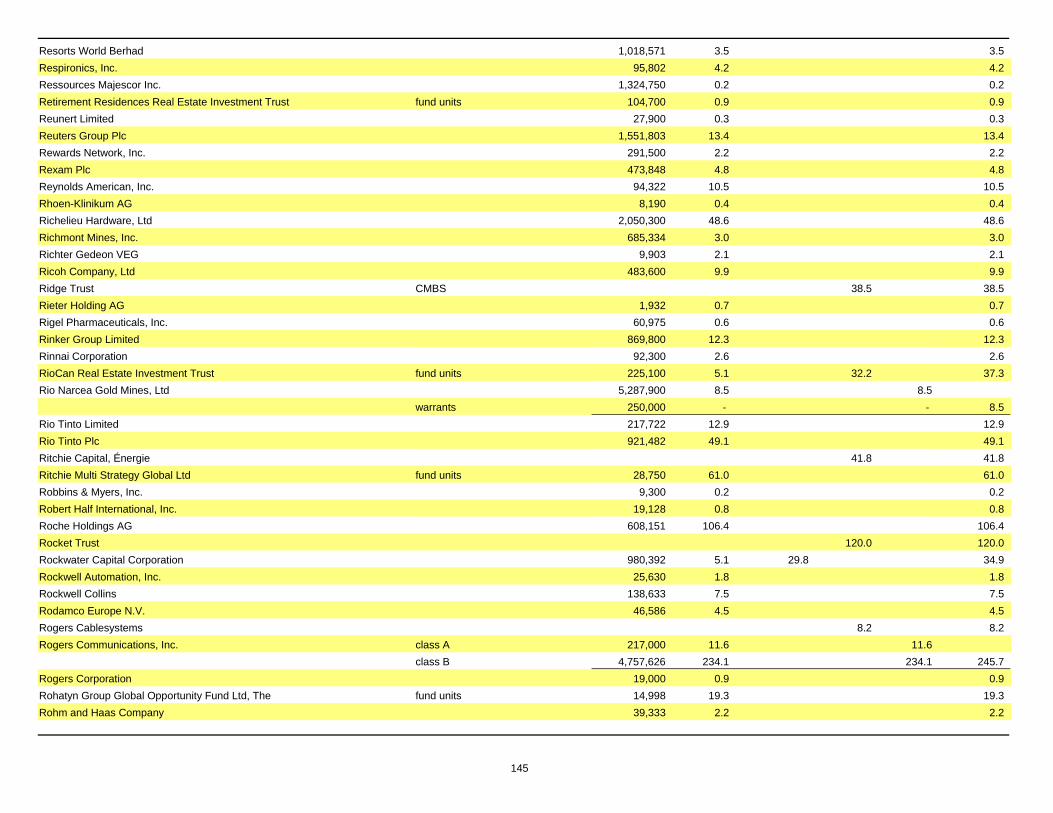
Resorts World Berhad 1,018,571 3.5 3.5Respironics, Inc. 95,802 4.2 4.2Ressources Majescor Inc. 1,324,750 0.2 0.2Retirement Residences Real Estate Investment Trust fund units 104,700 0.9 0.9Reunert Limited 27,900 0.3 0.3Reuters Group Plc 1,551,803 13.4 13.4Rewards Network, Inc. 291,500 2.2 2.2Rexam Plc 473,848 4.8 4.8Reynolds American, Inc. 94,322 10.5 10.5Rhoen-Klinikum AG 8,190 0.4 0.4Richelieu Hardware, Ltd 2,050,300 48.6 48.6Richmont Mines, Inc. 685,334 3.0 3.0Richter Gedeon VEG 9,903 2.1 2.1Ricoh Company, Ltd 483,600 9.9 9.9Ridge Trust CMBS 38.5 38.5Rieter Holding AG 1,932 0.7 0.7Rigel Pharmaceuticals, Inc. 60,975 0.6 0.6Rinker Group Limited 869,800 12.3 12.3Rinnai Corporation 92,300 2.6 2.6RioCan Real Estate Investment Trust fund units 225,100 5.1 32.2 37.3Rio Narcea Gold Mines, Ltd 5,287,900 8.5 8.5
warrants 250,000 - - 8.5Rio Tinto Limited 217,722 12.9 12.9Rio Tinto Plc 921,482 49.1 49.1Ritchie Capital, Énergie 41.8 41.8Ritchie Multi Strategy Global Ltd fund units 28,750 61.0 61.0Robbins & Myers, Inc. 9,300 0.2 0.2Robert Half International, Inc. 19,128 0.8 0.8Roche Holdings AG 608,151 106.4 106.4Rocket Trust 120.0 120.0Rockwater Capital Corporation 980,392 5.1 29.8 34.9Rockwell Automation, Inc. 25,630 1.8 1.8Rockwell Collins 138,633 7.5 7.5Rodamco Europe N.V. 46,586 4.5 4.5Rogers Cablesystems 8.2 8.2Rogers Communications, Inc. class A 217,000 11.6 11.6
class B 4,757,626 234.1 234.1 245.7Rogers Corporation 19,000 0.9 0.9Rohatyn Group Global Opportunity Fund Ltd, The fund units 14,998 19.3 19.3Rohm and Haas Company 39,333 2.2 2.2
145
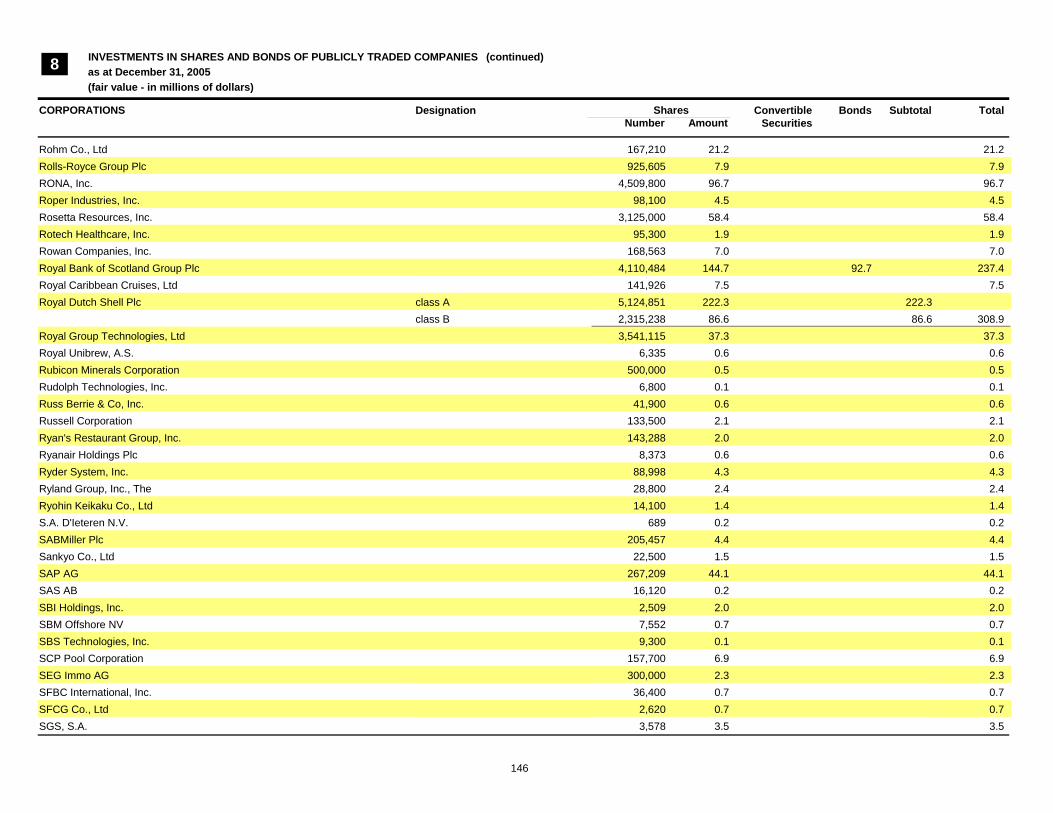
INVESTMENTS IN SHARES AND BONDS OF PUBLICLY TRADED COMPANIES as at December 31, 2005(fair value - in millions of dollars)
Designation ConvertibleSecurities
Bonds Subtotal Total
8
CORPORATIONS Shares Number Amount
(continued ) (continued)
Rohm Co., Ltd 167,210 21.2 21.2Rolls-Royce Group Plc 925,605 7.9 7.9RONA, Inc. 4,509,800 96.7 96.7Roper Industries, Inc. 98,100 4.5 4.5Rosetta Resources, Inc. 3,125,000 58.4 58.4Rotech Healthcare, Inc. 95,300 1.9 1.9Rowan Companies, Inc. 168,563 7.0 7.0Royal Bank of Scotland Group Plc 4,110,484 144.7 92.7 237.4Royal Caribbean Cruises, Ltd 141,926 7.5 7.5Royal Dutch Shell Plc class A 5,124,851 222.3 222.3
class B 2,315,238 86.6 86.6 308.9Royal Group Technologies, Ltd 3,541,115 37.3 37.3Royal Unibrew, A.S. 6,335 0.6 0.6Rubicon Minerals Corporation 500,000 0.5 0.5Rudolph Technologies, Inc. 6,800 0.1 0.1Russ Berrie & Co, Inc. 41,900 0.6 0.6Russell Corporation 133,500 2.1 2.1Ryan's Restaurant Group, Inc. 143,288 2.0 2.0Ryanair Holdings Plc 8,373 0.6 0.6Ryder System, Inc. 88,998 4.3 4.3Ryland Group, Inc., The 28,800 2.4 2.4Ryohin Keikaku Co., Ltd 14,100 1.4 1.4S.A. D'Ieteren N.V. 689 0.2 0.2SABMiller Plc 205,457 4.4 4.4Sankyo Co., Ltd 22,500 1.5 1.5SAP AG 267,209 44.1 44.1SAS AB 16,120 0.2 0.2SBI Holdings, Inc. 2,509 2.0 2.0SBM Offshore NV 7,552 0.7 0.7SBS Technologies, Inc. 9,300 0.1 0.1SCP Pool Corporation 157,700 6.9 6.9SEG Immo AG 300,000 2.3 2.3SFBC International, Inc. 36,400 0.7 0.7SFCG Co., Ltd 2,620 0.7 0.7SGS, S.A. 3,578 3.5 3.5
146

SIG Holding AG 1,362 0.4 0.4SIG Plc 18,708 0.3 0.3SK Corporation 60,600 3.6 3.6SKF AB class B 87,304 1.4 1.4SK Telecom Co., Ltd 10,600 2.2 2.2SL Green Realty Corp. 25,400 2.3 2.3SLM Corporation 277,792 17.9 128.6 146.5SMC Corporation 26,600 4.4 4.4SM Investments Corporation 78,330 0.4 0.4SM Prime Holdings Inc. 943,500 0.2 0.2SMTC Corporation 1,700,000 2.8 2.8
warrants 4,250,000 0.3 0.3 3.1SNC-Lavalin Group, Inc. 3,093,100 236.0 22.5 258.5SPSS, Inc. 8,400 0.3 0.3SP Setia Berhard 1,200,000 1.2 1.2SPT Telecom, A.S. 61,166 1.5 1.5SPX Corporation 67,900 3.6 3.6SSAB Svenskt Stal AB class A 11,199 0.5 0.5
class B 5,322 0.2 0.2 0.7SSGA Japan Equity Market Neutral Fund Ltd fund units 180,681 20.9 20.9STMicroelectronics N.V. 165,172 3.4 3.4SXR Uranium One, Inc. 1,772,941 10.5 10.5Sabre Holdings Corporation 131,173 3.7 3.7Sacyr Vallehermoso, S.A. 24,215 0.7 0.7Safeco Corporation 82,234 5.4 5.4Safeway, Inc. 415,476 11.5 11.5Safilo, S.p.A. 57,644 0.4 0.4Safran, S.A. 36,793 1.0 1.0Saga Communications, Inc. class A 199,925 2.5 2.5Sage Group Plc, The 477,673 2.5 2.5Saint-Gobain 134,918 9.3 9.3Salomon Brothers Mortgage Securities VII CMBS 13.6 13.6Sampo Oyj class A 753,671 15.3 15.3Samson Holding, Ltd 895,000 0.5 0.5Samsung Electronics Co., Ltd 94,719 72.1 72.1
preferred 38,700 22.0 22.0 94.1Samsung Fire & Marine Insurance 80,884 12.0 12.0Samsung SDI Co., Ltd 128,500 17.3 17.3Samsung Securities Company Ltd 28,200 2.0 2.0Sanden Corporation 52,000 0.3 0.3
147

INVESTMENTS IN SHARES AND BONDS OF PUBLICLY TRADED COMPANIES as at December 31, 2005(fair value - in millions of dollars)
Designation ConvertibleSecurities
Bonds Subtotal Total
8
CORPORATIONS Shares Number Amount
(continued ) (continued)
Sanderson Farms, Inc. 69,400 2.5 2.5Sandvik AB 219,756 11.9 11.9Sanken Electric Co., Ltd 144,000 2.7 2.7Sanlam Limited 2,229,065 6.2 6.2Sanmina-SCI Corp. 605,887 3.0 3.0Sanofi-Aventis, S.A. 1,059,524 108.0 108.0Sanpaolo IMI, S.p.A. 366,220 6.7 6.7Santen Pharmaceutical Co., Ltd 89,900 2.9 2.9Sanwa Shutter Corporation 95,000 0.7 0.7Sanyo Electric Co., Ltd 732,000 2.3 2.3Sanyo Shokai, Ltd 106,000 1.3 1.3Sanyo-Tateyama Holdings, Inc. 200,000 0.6 0.6Sappi Limited 122,944 1.6 1.6Sapporo Hokuyo Holdings, Inc. 55 0.6 0.6Sapporo Holdings Limited 131,000 0.9 0.9Saputo, Inc. 5,338,600 181.5 181.5Sara Lee Corporation 263,657 5.8 5.8Sare Holding, S.A de C.V. class B 672,100 0.8 0.8Sark Fund Limited fund units 358,791 51.0 51.0Sasol Limited 742,870 31.0 31.0Satyam Computer Services Limited 468,100 10.0 10.0Savient Pharmaceuticals, Inc. 65,200 0.3 0.3Savills Plc 9,027 0.2 0.2Sberbank RF 27,054 22.2 22.2Scania AB class B 20,959 0.9 0.9Scansource, Inc. 4,220 0.3 0.3Schering AG 110,583 8.6 8.6Schering-Plough Corporation 990,603 24.1 24.1Schibsted ASA 10,667 0.4 0.4Schindler Holding AG 1,134 0.5 0.5Schlumberger Limited 712,888 80.9 80.9Schneider Electric, S.A. 232,195 24.1 24.1School Specialty, Inc. 28,900 1.2 1.2Schooner Trust 115.6 115.6Scientific-Atlanta, Inc. 84,079 4.2 4.2
148

Scor 181,624 0.5 0.5Scottish & NewCastle Breweries Plc 240,635 2.4 2.4Scottish and Southern Energy Plc 133,967 2.7 2.7ScottishPower Plc 2,303,957 25.1 25.1Seagate Technology 288,891 6.8 6.8Seahawk Minerals, Ltd 47,500 - -
special warrants 2,307,692 - - -Sealed Air Corporation 6,457 0.4 0.4Seamico Securities Pcl 320,800 - -Searchgold Resources Inc. 122,833 - -Sears Canada, Inc. 28.1 28.1Sears Holdings Corporation 83,331 11.2 11.2Seasons Core Fund, Ltd fund units 100,000 11.7 11.7Seasons Technology Fund, Ltd fund units 200,000 24.6 24.6Seat Pagine Gialle, S.p.A. 894,963 0.5 0.5Secom Co., Ltd 102,500 6.3 6.3Secure Computing Corporation 30,000 0.4 0.4Securitas AB class B 65,173 1.3 1.3Sega Sammy Holdings, Inc. 71,960 2.8 2.8Seiko Corporation 69,000 0.4 0.4Seiko Epson Corporation 49,700 1.5 1.5Seino Holdings Co., Ltd 72,000 0.9 0.9Seiyu, Ltd, The 66,000 0.2 0.2Sekisui Chemical Co., Ltd 524,000 4.1 4.1Sekisui House, Ltd 418,000 6.1 6.1Seksun Corporation Limited 411,000 0.1 0.1Select Comfort Corporation 160,800 5.1 5.1Semafo, Inc. 201,300 0.4 0.4
warrants 250,000 0.2 0.2 0.6Sembcorp Industries Limited 25,380 - -Semen Gresik 109,000 0.2 0.2Semirara Mining Corporation 224,400 0.1 0.1Sempra Energy 126,022 6.6 6.6Sepracor, Inc. 14,500 0.9 0.9Serena Software, Inc. 14,700 0.4 0.4Serono, S.A. class B 20,188 18.7 18.7Seven & I Holdings Co., Ltd 474,456 23.7 23.7Severn Trent 239,629 5.2 5.2Shanghai Forte Land Company Limited class H 1,570,000 0.6 0.6Sharp Corporation 542,600 9.6 9.6
149

INVESTMENTS IN SHARES AND BONDS OF PUBLICLY TRADED COMPANIES as at December 31, 2005(fair value - in millions of dollars)
Designation ConvertibleSecurities
Bonds Subtotal Total
8
CORPORATIONS Shares Number Amount
(continued ) (continued)
Shaw Communications, Inc. 5.2 5.2Shaw Group Inc., The 100,500 3.4 3.4Shell Canada Limited 870,000 36.6 36.6Shenzhen Chiwan Wharf Holdings, Ltd. class B 149,800 0.2 0.2Shermag, Inc. 1,545,800 5.9 5.9Sherwin-Williams Company, The 48,965 2.6 2.6Shimachu Co., Ltd 57,000 2.0 2.0Shimadzu Corporation 178,000 1.5 1.5Shimamura Co., Ltd 9,300 1.5 1.5Shimano, Inc. 48,000 1.5 1.5Shimizu Corporation 289,000 2.5 2.5Shin Corporation Public Company Limited 2,051,600 2.4 2.4Shin-Etsu Chemical Co., Ltd 253,500 15.7 15.7Shinhan Financial Group Co., Ltd. 348,260 16.5 16.5Shinko Securities Co., Ltd 224,000 1.3 1.3Shinsegae Department Store Company 27,158 13.9 13.9Shinsei Bank, Ltd 772,000 5.2 5.2Shionogi & Co., Ltd 313,700 5.2 5.2Shire Plc 1,028,003 15.3 15.3Shiseido Company Limited 166,000 3.6 3.6Shizuoka Bank, Ltd, The 265,000 3.1 3.1Shore Gold, Inc. 200,000 1.5 1.5Showa Denko K.K. 1,226,000 5.6 5.6Showa Shell Sekiyu K.K. 78,000 1.1 1.1Shuffle Master, Inc. 126,800 3.7 3.7Shun Tak Holdings Limited 1,640,161 1.8 1.8Siam Cement Public Company Limited 1,436,373 10.6 10.6Siam City Bank Public Company Limited 920,100 0.6 0.6Siam City Cement Public Company Limited 20,600 0.2 0.2Siam Investment Fund fund units 15,900 0.1 0.1Sibirtelecom 4,841 0.3 0.3Siebel Systems, Inc. 170,224 2.1 2.1Siemens AG 616,614 61.5 61.5Sierra Health Services 53,881 5.0 5.0Sigma-Aldrich Corporation 7,891 0.6 0.6
150
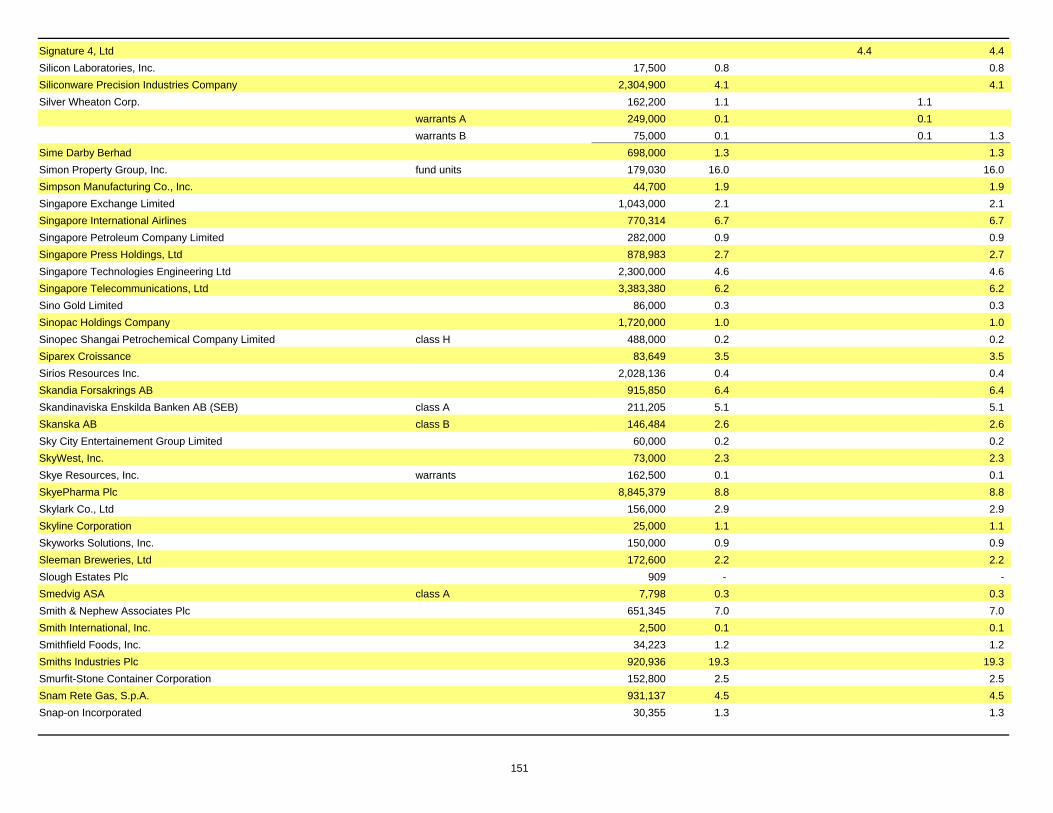
Signature 4, Ltd 4.4 4.4Silicon Laboratories, Inc. 17,500 0.8 0.8Siliconware Precision Industries Company 2,304,900 4.1 4.1Silver Wheaton Corp. 162,200 1.1 1.1
warrants A 249,000 0.1 0.1warrants B 75,000 0.1 0.1 1.3
Sime Darby Berhad 698,000 1.3 1.3Simon Property Group, Inc. fund units 179,030 16.0 16.0Simpson Manufacturing Co., Inc. 44,700 1.9 1.9Singapore Exchange Limited 1,043,000 2.1 2.1Singapore International Airlines 770,314 6.7 6.7Singapore Petroleum Company Limited 282,000 0.9 0.9Singapore Press Holdings, Ltd 878,983 2.7 2.7Singapore Technologies Engineering Ltd 2,300,000 4.6 4.6Singapore Telecommunications, Ltd 3,383,380 6.2 6.2Sino Gold Limited 86,000 0.3 0.3Sinopac Holdings Company 1,720,000 1.0 1.0Sinopec Shangai Petrochemical Company Limited class H 488,000 0.2 0.2Siparex Croissance 83,649 3.5 3.5Sirios Resources Inc. 2,028,136 0.4 0.4Skandia Forsakrings AB 915,850 6.4 6.4Skandinaviska Enskilda Banken AB (SEB) class A 211,205 5.1 5.1Skanska AB class B 146,484 2.6 2.6Sky City Entertainement Group Limited 60,000 0.2 0.2SkyWest, Inc. 73,000 2.3 2.3Skye Resources, Inc. warrants 162,500 0.1 0.1SkyePharma Plc 8,845,379 8.8 8.8Skylark Co., Ltd 156,000 2.9 2.9Skyline Corporation 25,000 1.1 1.1Skyworks Solutions, Inc. 150,000 0.9 0.9Sleeman Breweries, Ltd 172,600 2.2 2.2Slough Estates Plc 909 - -Smedvig ASA class A 7,798 0.3 0.3Smith & Nephew Associates Plc 651,345 7.0 7.0Smith International, Inc. 2,500 0.1 0.1Smithfield Foods, Inc. 34,223 1.2 1.2Smiths Industries Plc 920,936 19.3 19.3Smurfit-Stone Container Corporation 152,800 2.5 2.5Snam Rete Gas, S.p.A. 931,137 4.5 4.5Snap-on Incorporated 30,355 1.3 1.3
151

INVESTMENTS IN SHARES AND BONDS OF PUBLICLY TRADED COMPANIES as at December 31, 2005(fair value - in millions of dollars)
Designation ConvertibleSecurities
Bonds Subtotal Total
8
CORPORATIONS Shares Number Amount
(continued ) (continued)
Sobeys Canada, Inc. 25.6 25.6Sociedad General de Aguas de Barcelona, S.A. class A 12,850 0.3 0.3Societa Iniziative Autostradalie e Servizi SpA 8,400 0.1 0.1Societe BIC, S.A. 13,731 1.0 1.0Société Canadian Tire Limitée, La 50.0 50.0Société de finan. GE Capital du Canada 70.8 70.8Societe de la Tour Eiffel 40,000 4.1 4.1Societe des Autoroutes du Nord et de l'Est de la France 5,062 0.4 0.4Societe des Autoroutes Paris-Rhin-Rhone 7,480 0.6 0.6Société d'Exploration Aurifère Jilbey, Ltée warrants 450,000 0.2 0.2Société en commandite Gaz Métro 16.0 16.0Société Expansion des Exportations 55.0 55.0Société Générale 207,911 29.8 29.8Societe Television Francaise 1 123,239 4.0 4.0Sodexho Alliance, S.A. 25,642 1.2 1.2Softbank Corp. 339,600 16.7 16.7Software AG 24,850 1.4 1.4Sogecable, S.A. 8,838 0.4 0.4Sohgo Securities Services Co., Ltd 41,500 0.7 0.7Sojitz Corporation 152,200 1.0 1.0Solar Trust 33.2 33.2
CMBS 4.4 4.4 37.6Solarworld AG 1,803 0.3 0.3Solectron Corporation 851,876 3.6 3.6Solomon Systech International Limited 1,100,000 0.5 0.5Solvay, S.A. 13,999 1.8 1.8Sompo Japan Assurance, Inc. 636,000 10.0 10.0Sonae Industria-SGPS, S.A. 13,458 0.1 0.1Sonae Investimentos-SGPS, S.A. 272,529 0.4 0.4Sonae SGPS, S.A. rights 74,021 - -Sonic Automotive, Inc. 87,400 2.3 2.3Sonic Corp. 210,060 7.2 7.2Sonic Healthcare Limited 133,100 1.7 1.7Sonic Solutions, Inc. 13,900 0.2 0.2Sony Corporation 626,300 29.9 29.9
152
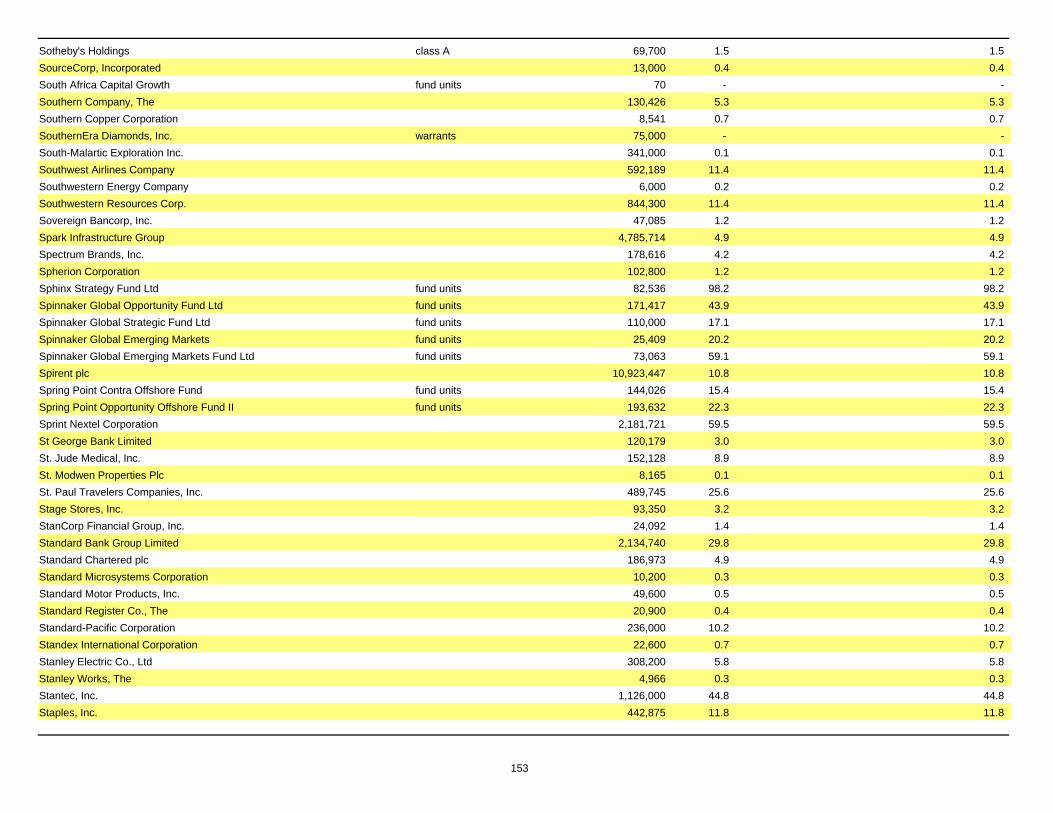
Sotheby's Holdings class A 69,700 1.5 1.5SourceCorp, Incorporated 13,000 0.4 0.4South Africa Capital Growth fund units 70 - -Southern Company, The 130,426 5.3 5.3Southern Copper Corporation 8,541 0.7 0.7SouthernEra Diamonds, Inc. warrants 75,000 - -South-Malartic Exploration Inc. 341,000 0.1 0.1Southwest Airlines Company 592,189 11.4 11.4Southwestern Energy Company 6,000 0.2 0.2Southwestern Resources Corp. 844,300 11.4 11.4Sovereign Bancorp, Inc. 47,085 1.2 1.2Spark Infrastructure Group 4,785,714 4.9 4.9Spectrum Brands, Inc. 178,616 4.2 4.2Spherion Corporation 102,800 1.2 1.2Sphinx Strategy Fund Ltd fund units 82,536 98.2 98.2Spinnaker Global Opportunity Fund Ltd fund units 171,417 43.9 43.9Spinnaker Global Strategic Fund Ltd fund units 110,000 17.1 17.1Spinnaker Global Emerging Markets fund units 25,409 20.2 20.2Spinnaker Global Emerging Markets Fund Ltd fund units 73,063 59.1 59.1Spirent plc 10,923,447 10.8 10.8Spring Point Contra Offshore Fund fund units 144,026 15.4 15.4Spring Point Opportunity Offshore Fund II fund units 193,632 22.3 22.3Sprint Nextel Corporation 2,181,721 59.5 59.5St George Bank Limited 120,179 3.0 3.0St. Jude Medical, Inc. 152,128 8.9 8.9St. Modwen Properties Plc 8,165 0.1 0.1St. Paul Travelers Companies, Inc. 489,745 25.6 25.6Stage Stores, Inc. 93,350 3.2 3.2StanCorp Financial Group, Inc. 24,092 1.4 1.4Standard Bank Group Limited 2,134,740 29.8 29.8Standard Chartered plc 186,973 4.9 4.9Standard Microsystems Corporation 10,200 0.3 0.3Standard Motor Products, Inc. 49,600 0.5 0.5Standard Register Co., The 20,900 0.4 0.4Standard-Pacific Corporation 236,000 10.2 10.2Standex International Corporation 22,600 0.7 0.7Stanley Electric Co., Ltd 308,200 5.8 5.8Stanley Works, The 4,966 0.3 0.3Stantec, Inc. 1,126,000 44.8 44.8Staples, Inc. 442,875 11.8 11.8
153

INVESTMENTS IN SHARES AND BONDS OF PUBLICLY TRADED COMPANIES as at December 31, 2005(fair value - in millions of dollars)
Designation ConvertibleSecurities
Bonds Subtotal Total
8
CORPORATIONS Shares Number Amount
(continued ) (continued)
Starbucks Corporation 116,667 4.1 4.1Starhub Limited 260,000 0.4 0.4Startek, Inc. 6,100 0.1 0.1Starwood Hotels & Resorts Worldwide, Inc. 257,868 19.2 19.2State Bank of India participating notes 14,561 0.3 0.3State Street Corporation 140,288 9.1 9.1Statoil ASA 370,244 9.9 9.9Steak N Shake Co., The 96,000 1.9 1.9Steel Dynamics, Inc. 55,555 2.3 2.3Stein Mart, Inc. 87,100 1.8 1.8Steinhoff International Holding Limited 748,311 2.6 2.6Stewart & Stevenson Services 39,400 1.0 1.0Stockland 266,477 1.5 1.5Stockmann Oyj AB class B 7,750 0.4 0.4Stolt Offshore, S.A. 42,310 0.6 0.6Stolt-Nielsen, S.A. 90,900 3.5 3.5Stora Enso Oyj 167,239 2.6 2.6Storebrand ASA 52,071 0.5 0.5Stornoway Diamond Corporation 1,038,000 1.1 1.1
warrants 100,000 - - 1.1Strait Crossing Development, Inc. 10.7 10.7Strateco Resources Inc. 3,435,445 0.6 0.6Stratos Global Corporation 123,500 1.2 1.2Straumann AG 1,711 0.5 0.5Stride Rite Corporation 124,400 2.0 2.0Stryker Corporation 105,808 5.5 5.5Student Load Corporation, The 547 0.1 0.1Student Transportation of America ULC 10.3 10.3Sturm Ruger & Co., Inc. 80,300 0.7 0.7Sub Rocket Trust CMBS 11.2 11.2Submarino, S.A. 16,757 0.4 0.4Suedzucker AG 14,618 0.4 0.4Suez, S.A. 953,698 32.9 32.9Sulzer AG 3,426 2.1 2.1Sumco Corporation 27,200 1.7 1.7
154
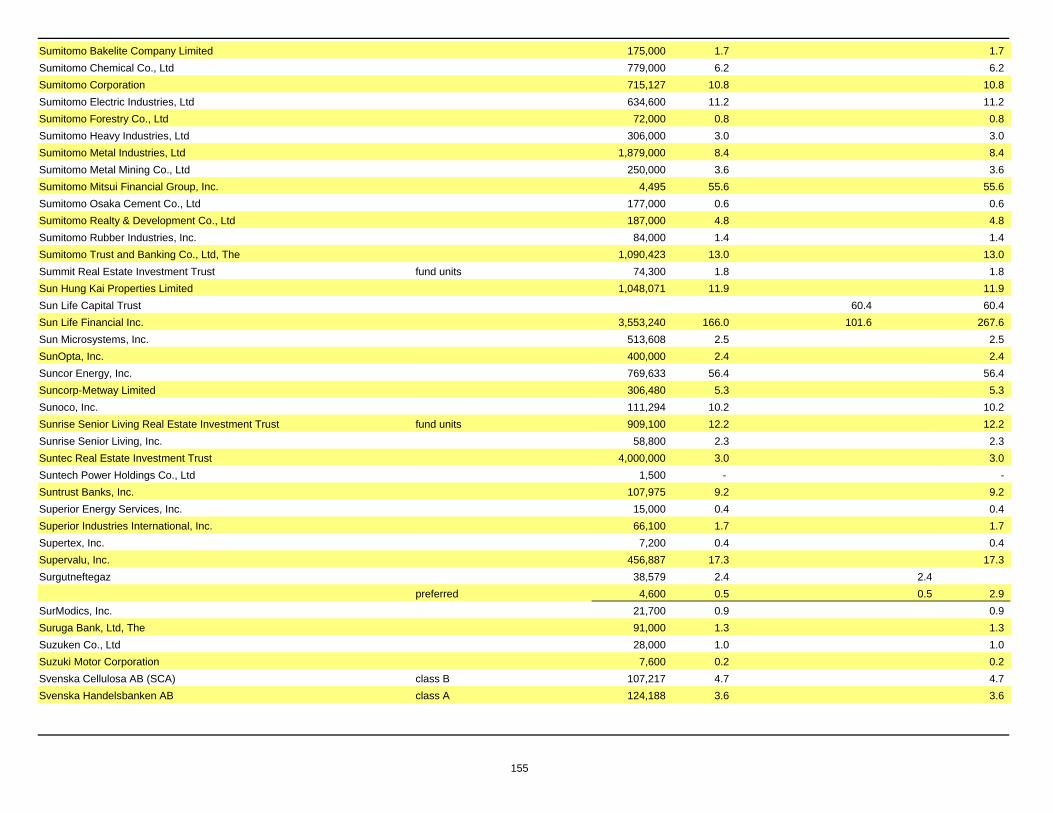
Sumitomo Bakelite Company Limited 175,000 1.7 1.7Sumitomo Chemical Co., Ltd 779,000 6.2 6.2Sumitomo Corporation 715,127 10.8 10.8Sumitomo Electric Industries, Ltd 634,600 11.2 11.2Sumitomo Forestry Co., Ltd 72,000 0.8 0.8Sumitomo Heavy Industries, Ltd 306,000 3.0 3.0Sumitomo Metal Industries, Ltd 1,879,000 8.4 8.4Sumitomo Metal Mining Co., Ltd 250,000 3.6 3.6Sumitomo Mitsui Financial Group, Inc. 4,495 55.6 55.6Sumitomo Osaka Cement Co., Ltd 177,000 0.6 0.6Sumitomo Realty & Development Co., Ltd 187,000 4.8 4.8Sumitomo Rubber Industries, Inc. 84,000 1.4 1.4Sumitomo Trust and Banking Co., Ltd, The 1,090,423 13.0 13.0Summit Real Estate Investment Trust fund units 74,300 1.8 1.8Sun Hung Kai Properties Limited 1,048,071 11.9 11.9Sun Life Capital Trust 60.4 60.4Sun Life Financial Inc. 3,553,240 166.0 101.6 267.6Sun Microsystems, Inc. 513,608 2.5 2.5SunOpta, Inc. 400,000 2.4 2.4Suncor Energy, Inc. 769,633 56.4 56.4Suncorp-Metway Limited 306,480 5.3 5.3Sunoco, Inc. 111,294 10.2 10.2Sunrise Senior Living Real Estate Investment Trust fund units 909,100 12.2 12.2Sunrise Senior Living, Inc. 58,800 2.3 2.3Suntec Real Estate Investment Trust 4,000,000 3.0 3.0Suntech Power Holdings Co., Ltd 1,500 - -Suntrust Banks, Inc. 107,975 9.2 9.2Superior Energy Services, Inc. 15,000 0.4 0.4Superior Industries International, Inc. 66,100 1.7 1.7Supertex, Inc. 7,200 0.4 0.4Supervalu, Inc. 456,887 17.3 17.3Surgutneftegaz 38,579 2.4 2.4
preferred 4,600 0.5 0.5 2.9SurModics, Inc. 21,700 0.9 0.9Suruga Bank, Ltd, The 91,000 1.3 1.3Suzuken Co., Ltd 28,000 1.0 1.0Suzuki Motor Corporation 7,600 0.2 0.2Svenska Cellulosa AB (SCA) class B 107,217 4.7 4.7Svenska Handelsbanken AB class A 124,188 3.6 3.6
155

INVESTMENTS IN SHARES AND BONDS OF PUBLICLY TRADED COMPANIES as at December 31, 2005(fair value - in millions of dollars)
Designation ConvertibleSecurities
Bonds Subtotal Total
8
CORPORATIONS Shares Number Amount
(continued ) (continued)
Swatch Group AG, The 11,903 0.4 0.4class B 49,034 8.5 8.5 8.9
Swedish Match AB 71,603 1.0 1.0Swire Pacific Limited class A 1,864,128 19.5 19.5
class B 1,120,000 2.3 2.3 21.8Swiss Life Holding 3,644 0.8 0.8Swiss RE 306,792 26.2 26.2Swisscom AG 10,679 3.9 3.9Sybron Dental Specialties, Inc. 50,500 2.4 2.4Sydney Airport Finance 838.9 838.9Symantec Corporation 1,091,442 22.3 22.3Symbol Technologies, Inc. 17,135 0.3 0.3Symmetricom, Inc. 25,400 0.2 0.2Synaptics, Inc. 15,300 0.4 0.4Synenco Energy, Inc. class A 450,000 7.7 7.7Syngenta AG 104,303 15.1 15.1Synnex Technology International Corporation 652,000 0.9 0.9Synovus Financial Corp. 50,723 1.6 1.6Synthes, Inc. 44,434 5.8 5.8Sysco Corp. 361,992 13.1 13.1TABCORP Holdings Limited 382,189 5.1 5.1TCF Financial Corporation 1,745 0.1 0.1TD Ameritrade Holding Corp. 105,800 3.0 3.0TD Banknorth, Inc. 11,900 0.4 74.8 75.2TDC A/S 94,309 6.6 6.6T&D Holdings, Inc. 178,400 13.8 13.8TDK Corp. 80,070 6.4 6.4TD North America, L.P. 35.0 35.0TEAL Exploration & Mining, Inc. 375,300 0.9 0.9TECO Energy, Inc. 83,908 1.7 1.7TELUS Corporation 2,916,722 137.8 137.8THK Co., Ltd 109,300 3.3 3.3THQ, Inc. 30,900 0.9 0.9TI Automotive Limited class A 409,200 - -TIAA Real Estate Corp. CMBS 1.1 1.1
156

TIS, Inc. 53,000 1.9 1.9TJX Companies, Inc., The 147,354 4.0 4.0TLC Vision Corporation 688,879 5.2 5.2TNK-BP Holding 207,200 0.7 0.7TNT N.V. 513,679 18.7 18.7TPV Technology Limited 496,000 0.6 0.6TRW Automative Holdings Corp. 49,500 1.5 1.5T. Rowe Price Group, Inc. 10,723 0.9 0.9TUI AG 71,717 1.7 1.7TXU Corp. 276,191 16.2 16.2Tabak A.S. 381 0.3 0.3Taberna Realty Finance Trust 2,750,000 36.2 36.2Taiheiyo Cement Corporation 393,000 1.9 1.9Taisei Corporation 443,500 2.4 2.4Taishin Financial Holdings Co., Ltd 466,000 0.3 0.3Taisho Pharmaceutical Co., Ltd 66,000 1.4 1.4Taiwan Cement Corporation 2,453,000 2.0 2.0Taiwan Fertilizer Co., Ltd 3,000,000 4.1 4.1Taiwan Mobile Co., Ltd 1,346,000 1.4 1.4Taiwan Semiconductor Manufacturing Company, Ltd 21,379,586 54.8 54.8Taiyo Nippon Sanso Corporation 121,000 0.9 0.9Taiyo Yuden Co., Ltd 175,000 2.8 2.8Takara Holdings, Inc. 80,000 0.6 0.6Takashimaya Company Limited 121,000 2.3 2.3Take-Two Interactive Software, Inc. 51,150 1.1 1.1Takeda Pharmaceutical Company Limited 527,000 33.3 33.3Takefuji Corporation 101,150 8.0 8.0Takuma Co., Ltd 30,000 0.2 0.2Talisman Energy, Inc. 6,480,462 399.2 25.4 424.6Talx Corporation 15,850 0.8 0.8Tam, S.A. 305,500 6.8 6.8Tanabe Seiyaku Co., Ltd 105,000 1.2 1.2Tandberg ASA 29,672 0.2 0.2Tandberg Television ASA 73,526 1.1 1.1Tanger Factory Outlet Centers, Inc. fund units 189,900 6.4 6.4Tanjong Public Limited Company 283,100 1.3 1.3Target Corporation 752,078 48.3 48.3Targeted Genetics Corporation 401,667 0.2 0.2Tate & Lyle Plc 611,207 6.9 6.9Tatneft 7,800 0.6 0.6
157
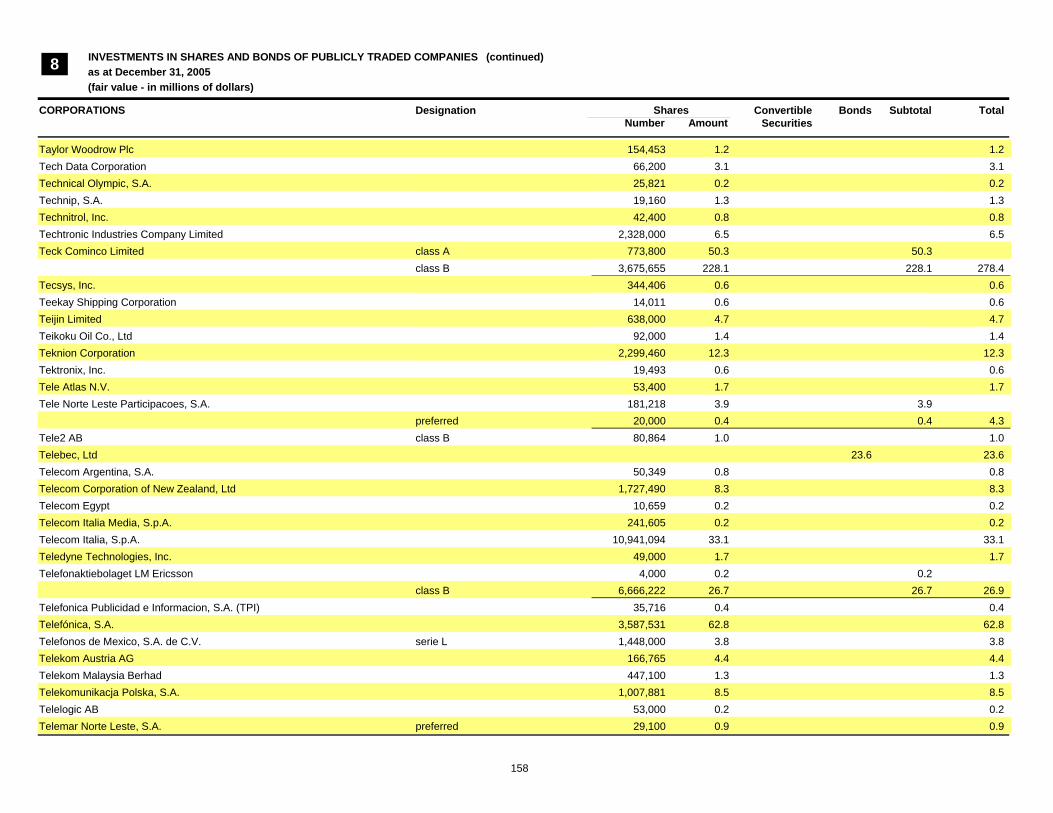
INVESTMENTS IN SHARES AND BONDS OF PUBLICLY TRADED COMPANIES as at December 31, 2005(fair value - in millions of dollars)
Designation ConvertibleSecurities
Bonds Subtotal Total
8
CORPORATIONS Shares Number Amount
(continued ) (continued)
Taylor Woodrow Plc 154,453 1.2 1.2Tech Data Corporation 66,200 3.1 3.1Technical Olympic, S.A. 25,821 0.2 0.2Technip, S.A. 19,160 1.3 1.3Technitrol, Inc. 42,400 0.8 0.8Techtronic Industries Company Limited 2,328,000 6.5 6.5Teck Cominco Limited class A 773,800 50.3 50.3
class B 3,675,655 228.1 228.1 278.4Tecsys, Inc. 344,406 0.6 0.6Teekay Shipping Corporation 14,011 0.6 0.6Teijin Limited 638,000 4.7 4.7Teikoku Oil Co., Ltd 92,000 1.4 1.4Teknion Corporation 2,299,460 12.3 12.3Tektronix, Inc. 19,493 0.6 0.6Tele Atlas N.V. 53,400 1.7 1.7Tele Norte Leste Participacoes, S.A. 181,218 3.9 3.9
preferred 20,000 0.4 0.4 4.3Tele2 AB class B 80,864 1.0 1.0Telebec, Ltd 23.6 23.6Telecom Argentina, S.A. 50,349 0.8 0.8Telecom Corporation of New Zealand, Ltd 1,727,490 8.3 8.3Telecom Egypt 10,659 0.2 0.2Telecom Italia Media, S.p.A. 241,605 0.2 0.2Telecom Italia, S.p.A. 10,941,094 33.1 33.1Teledyne Technologies, Inc. 49,000 1.7 1.7Telefonaktiebolaget LM Ericsson 4,000 0.2 0.2
class B 6,666,222 26.7 26.7 26.9Telefonica Publicidad e Informacion, S.A. (TPI) 35,716 0.4 0.4Telefónica, S.A. 3,587,531 62.8 62.8Telefonos de Mexico, S.A. de C.V. serie L 1,448,000 3.8 3.8Telekom Austria AG 166,765 4.4 4.4Telekom Malaysia Berhad 447,100 1.3 1.3Telekomunikacja Polska, S.A. 1,007,881 8.5 8.5Telelogic AB 53,000 0.2 0.2Telemar Norte Leste, S.A. preferred 29,100 0.9 0.9
158
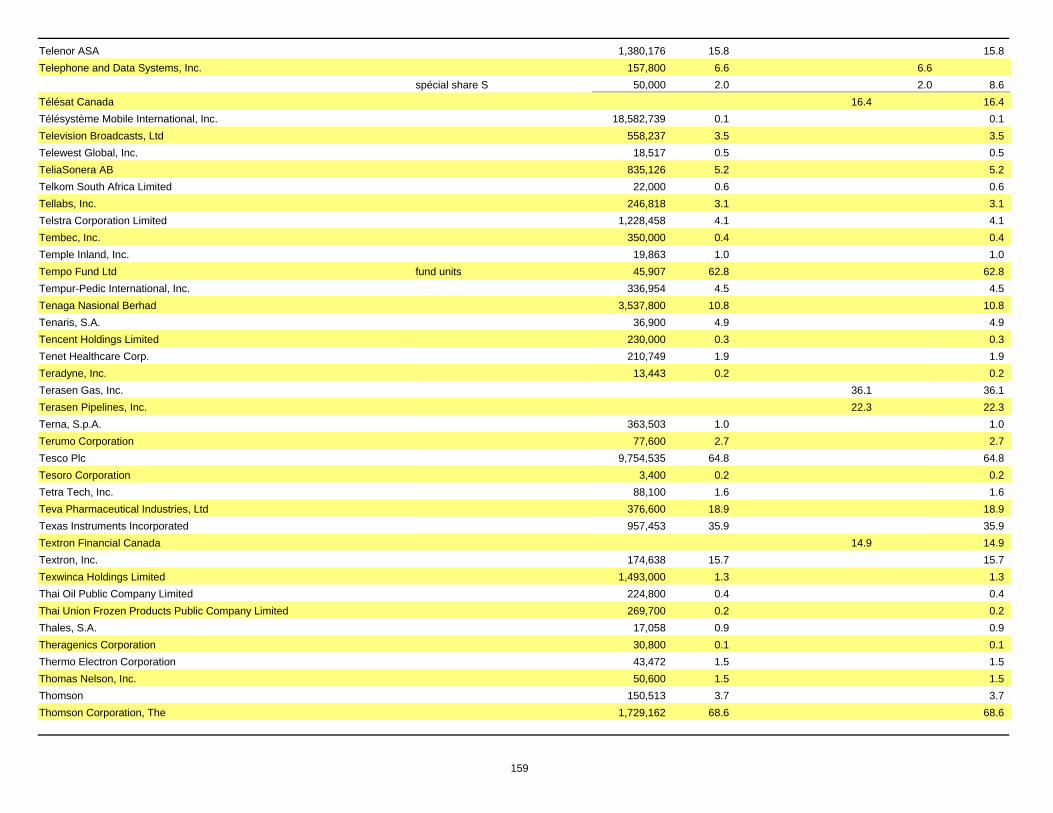
Telenor ASA 1,380,176 15.8 15.8Telephone and Data Systems, Inc. 157,800 6.6 6.6
spécial share S 50,000 2.0 2.0 8.6Télésat Canada 16.4 16.4Télésystème Mobile International, Inc. 18,582,739 0.1 0.1Television Broadcasts, Ltd 558,237 3.5 3.5Telewest Global, Inc. 18,517 0.5 0.5TeliaSonera AB 835,126 5.2 5.2Telkom South Africa Limited 22,000 0.6 0.6Tellabs, Inc. 246,818 3.1 3.1Telstra Corporation Limited 1,228,458 4.1 4.1Tembec, Inc. 350,000 0.4 0.4Temple Inland, Inc. 19,863 1.0 1.0Tempo Fund Ltd fund units 45,907 62.8 62.8Tempur-Pedic International, Inc. 336,954 4.5 4.5Tenaga Nasional Berhad 3,537,800 10.8 10.8Tenaris, S.A. 36,900 4.9 4.9Tencent Holdings Limited 230,000 0.3 0.3Tenet Healthcare Corp. 210,749 1.9 1.9Teradyne, Inc. 13,443 0.2 0.2Terasen Gas, Inc. 36.1 36.1Terasen Pipelines, Inc. 22.3 22.3Terna, S.p.A. 363,503 1.0 1.0Terumo Corporation 77,600 2.7 2.7Tesco Plc 9,754,535 64.8 64.8Tesoro Corporation 3,400 0.2 0.2Tetra Tech, Inc. 88,100 1.6 1.6Teva Pharmaceutical Industries, Ltd 376,600 18.9 18.9Texas Instruments Incorporated 957,453 35.9 35.9Textron Financial Canada 14.9 14.9Textron, Inc. 174,638 15.7 15.7Texwinca Holdings Limited 1,493,000 1.3 1.3Thai Oil Public Company Limited 224,800 0.4 0.4Thai Union Frozen Products Public Company Limited 269,700 0.2 0.2Thales, S.A. 17,058 0.9 0.9Theragenics Corporation 30,800 0.1 0.1Thermo Electron Corporation 43,472 1.5 1.5Thomas Nelson, Inc. 50,600 1.5 1.5Thomson 150,513 3.7 3.7Thomson Corporation, The 1,729,162 68.6 68.6
159

INVESTMENTS IN SHARES AND BONDS OF PUBLICLY TRADED COMPANIES as at December 31, 2005(fair value - in millions of dollars)
Designation ConvertibleSecurities
Bonds Subtotal Total
8
CORPORATIONS Shares Number Amount
(continued ) (continued)
ThyssenKrupp AG 82,985 2.0 2.0Tietoenator Oyj 17,370 0.7 0.7Tiffany & Co. 64,312 2.9 2.9Tiger Brands Limited 33,293 0.9 0.9Tim Participacoes, S.A. 10,000 0.3 0.3Timberland Company, The class A 170 - -Time Warner, Inc. 2,933,339 59.8 59.8Tiscali, S.p.A. 52,504 0.2 0.2Titan Cement Company, S.A. 12,667 0.6 0.6Tobu Railway Co., Ltd 356,000 2.2 2.2Toda Corporation 89,000 0.6 0.6Toho Co., Ltd 65,200 1.7 1.7Tohoku Electric Power Co., Inc. 196,600 4.7 4.7Tokai Rubber Industries, Inc. 25,800 0.4 0.4Tokuyama Corporation 107,000 1.6 1.6Tokyo Broadcasting System, Inc. 17,500 0.6 0.6Tokyo Electric Power Co., Inc., The 715,000 20.3 20.3Tokyo Electron, Ltd 102,692 7.5 7.5Tokyo Gas Co., Ltd 1,103,100 5.7 5.7Tokyo Seimitsu Co., Ltd 53,700 3.7 3.7Tokyo Steel Manufacturing Co., Ltd 49,900 0.8 0.8Tokyo Style Co., Ltd 28,000 0.4 0.4Tokyo Tatemono Co., Ltd 111,000 1.3 1.3Tokyu Corporation 408,000 3.4 3.4Tokyu Land Corporation 1,975,000 23.0 23.0Toll Holdings Limited 236,074 3.0 3.0Tollgrade Communications, Inc. 8,300 0.1 0.1Tomra Systems ASA 60,084 0.5 0.5TonenGeneral Sekiyu K.K. 136,000 1.7 1.7Too, Inc. 103,900 3.4 3.4Topdanmark A/S 4,105 0.4 0.4Toppan Printing Co., Ltd 266,000 3.6 3.6Toray Industries, Inc. 812,300 7.7 7.7Torchmark Corporation 93,985 6.1 6.1Toro Company 46,900 2.4 2.4
160

Toronto Dominion Bank, The 9,274,411 566.9 711.0 1,277.9Toronto Hydro Corporation 7.7 7.7Torstar Corporation 73.0 73.0Toshiba Group Companies, The 2,081,051 14.5 14.5Tosoh Corporation 221,000 1.1 1.1Total Access Communication Plc 38,900 0.2 0.2Total System Services, Inc. 26,588 0.6 0.6Total, S.A. 481,856 137.1 137.1Toto, Ltd 128,000 1.3 1.3TouchTunes Music Corporation preferred A 9,235,774 4.2 4.2
preferred B 8,888,889 4.1 4.1preferred C 25,000,000 14.6 14.6 22.9
Toyo Seikan Kaisha, Ltd 74,700 1.4 1.4Toyo Suisan Kaisha, Ltd 80,000 1.5 1.5Toyobo Co., Ltd 289,000 1.1 1.1Toyoda Gosei Co., Ltd 137,600 3.1 3.1Toyota Industries Corporation 89,900 3.8 3.8Toyota Motor Corporation 1,722,000 105.7 105.7Toyota Motor Credit Corp. 18.9 18.9Toyota Motor Finance BV 27.6 27.6Toyota Tsusho Corporation 72,000 1.9 1.9Tractebel Energia, S.A. 37,700 0.3 0.3Tractor Supply Company 109,900 6.8 6.8Trakya Cam Sanayii A.S. 110,487 0.5 0.5Transalta Corporation 10.7 10.7Transalta Utilities Corporation 70.5 70.5Transat A.T., Inc. warrants 350,000 4.4 4.4
class B 662,983 12.5 12.5 16.9TransCanada Corporation 1,198,054 43.9 56.4 100.3TransCanada PipeLines Limited 46.7 46.7Transcontinental, Inc. 30.2 30.2
class A 3,149,200 59.9 59.9class B 417,334 8.1 8.1 98.2
TransForce Income Fund fund units 3,957,349 67.5 67.5Transmile Group Berahd 81,600 0.3 0.3Transneft preferred 153 0.4 0.4TransNorthern PipeLines 25.1 25.1Transocean, Inc. 120,236 9.8 9.8Trans-Québec Maritimes Pipelines 11.1 11.1Transurban Group 689,000 3.9 3.9
161
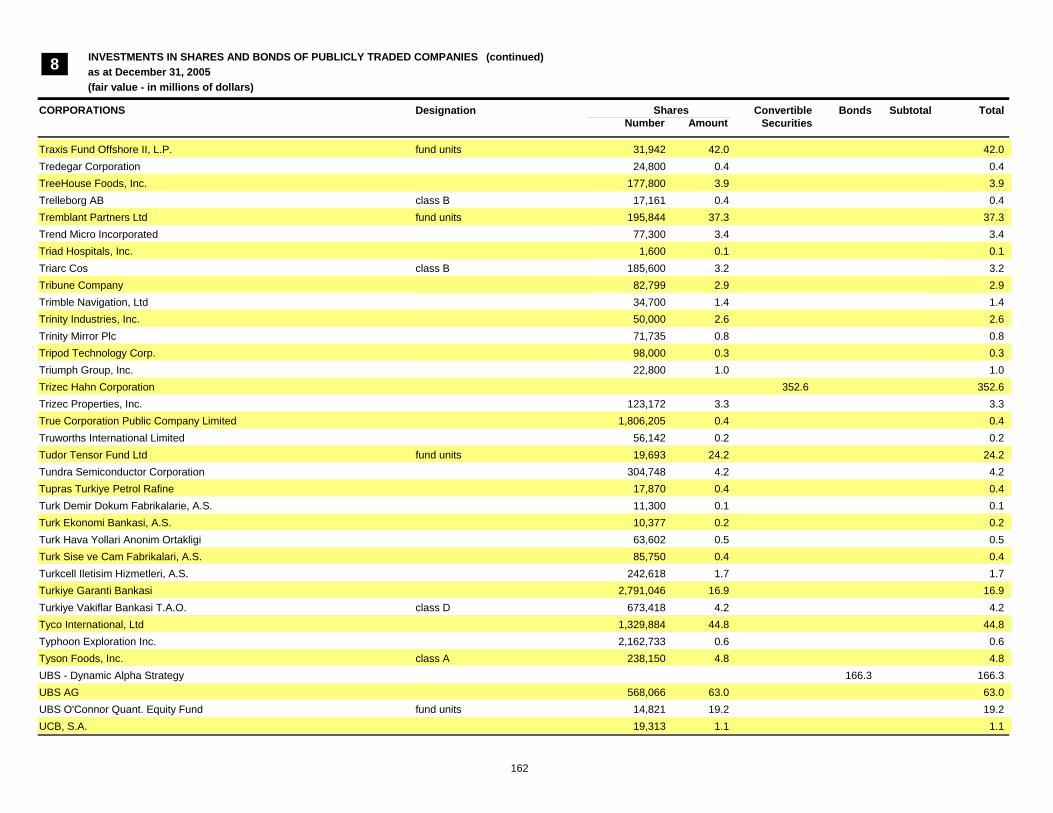
INVESTMENTS IN SHARES AND BONDS OF PUBLICLY TRADED COMPANIES as at December 31, 2005(fair value - in millions of dollars)
Designation ConvertibleSecurities
Bonds Subtotal Total
8
CORPORATIONS Shares Number Amount
(continued ) (continued)
Traxis Fund Offshore II, L.P. fund units 31,942 42.0 42.0Tredegar Corporation 24,800 0.4 0.4TreeHouse Foods, Inc. 177,800 3.9 3.9Trelleborg AB class B 17,161 0.4 0.4Tremblant Partners Ltd fund units 195,844 37.3 37.3Trend Micro Incorporated 77,300 3.4 3.4Triad Hospitals, Inc. 1,600 0.1 0.1Triarc Cos class B 185,600 3.2 3.2Tribune Company 82,799 2.9 2.9Trimble Navigation, Ltd 34,700 1.4 1.4Trinity Industries, Inc. 50,000 2.6 2.6Trinity Mirror Plc 71,735 0.8 0.8Tripod Technology Corp. 98,000 0.3 0.3Triumph Group, Inc. 22,800 1.0 1.0Trizec Hahn Corporation 352.6 352.6Trizec Properties, Inc. 123,172 3.3 3.3True Corporation Public Company Limited 1,806,205 0.4 0.4Truworths International Limited 56,142 0.2 0.2Tudor Tensor Fund Ltd fund units 19,693 24.2 24.2Tundra Semiconductor Corporation 304,748 4.2 4.2Tupras Turkiye Petrol Rafine 17,870 0.4 0.4Turk Demir Dokum Fabrikalarie, A.S. 11,300 0.1 0.1Turk Ekonomi Bankasi, A.S. 10,377 0.2 0.2Turk Hava Yollari Anonim Ortakligi 63,602 0.5 0.5Turk Sise ve Cam Fabrikalari, A.S. 85,750 0.4 0.4Turkcell Iletisim Hizmetleri, A.S. 242,618 1.7 1.7Turkiye Garanti Bankasi 2,791,046 16.9 16.9Turkiye Vakiflar Bankasi T.A.O. class D 673,418 4.2 4.2Tyco International, Ltd 1,329,884 44.8 44.8Typhoon Exploration Inc. 2,162,733 0.6 0.6Tyson Foods, Inc. class A 238,150 4.8 4.8UBS - Dynamic Alpha Strategy 166.3 166.3UBS AG 568,066 63.0 63.0UBS O'Connor Quant. Equity Fund fund units 14,821 19.2 19.2UCB, S.A. 19,313 1.1 1.1
162

UCBH Holdings, Inc. 20,000 0.4 0.4UEX Corporation 1,000,000 4.5 4.5UFJ Nicos Co., Ltd 81,000 1.2 1.2UGI Corporation 5,457 0.1 0.1UPM - Kymmene Oyj 235,662 5.4 5.4URS Corporation 42,600 1.9 1.9U.S. Bancorp 763,649 26.7 26.7USANA Health Sciences, Inc. 59,800 2.7 2.7US Bank N.A. 69.6 69.6USS Co., Ltd 26,840 2.0 2.0UST, Inc. 195,941 9.4 9.4UTI Worldwide, Inc. 21,623 2.4 2.4UTS Energy Corporation 11,486,500 49.2 49.2Ube Industries, Ltd 390,000 1.2 1.2UbiSoft Entertainment, S.A. 432,725 24.0 24.0Ultima Investments Ltd fund units 27 - -Ultra Electronics Holdings Plc 7,352 0.2 0.2Ultra Petroleum Corporation 1,700 0.1 0.1Ultrapar Participacoes, S.A. preferred 41,100 0.7 0.7Ultratech, Inc. 13,200 0.2 0.2Ulvac, Inc. 16,300 0.6 0.6Umicore 51,334 4.8 4.8Unaxis Holding AG 1,242 0.2 0.2Uni-Charm Corporation 19,000 1.0 1.0UniCredito Italiano, S.p.A. 8,647,674 69.3 69.3Uni-Sélect, Inc. 2,569,900 77.0 77.0Uniao de Bancos Brasileiros, S.A. 133,314 9.9 9.9Unibail 10,043 1.6 1.6Uniden Corporation 28,000 0.6 0.6Unilever N.V. 181,462 14.5 14.5Unilever Plc 3,113,921 36.0 36.0Union Fenosa, S.A. 54,561 2.4 2.4Union gas, Ltd 2.0 2.0Union Pacific Corp. 55,689 5.2 5.2UnionBanCal Corporation 47,215 3.8 3.8Unipol, S.p.A. 199,980 0.6 0.6Unique Zurich Airport 380 0.1 0.1Unisys Corporation 75,700 0.5 0.5Unite Group 1,536,251 11.7 11.7United Dominion Realty Trust, Inc. fund units 461,500 12.6 12.6
163

INVESTMENTS IN SHARES AND BONDS OF PUBLICLY TRADED COMPANIES as at December 31, 2005(fair value - in millions of dollars)
Designation ConvertibleSecurities
Bonds Subtotal Total
8
CORPORATIONS Shares Number Amount
(continued ) (continued)
United Internet AG 34,800 1.6 1.6United Microelectronics Corporation 21,447,508 14.2 14.2United Natural Foods, Inc. 196,843 6.1 6.1United Overseas Bank Limited 1,330,990 13.6 13.6United Overseas Land Limited 87,499 0.2 0.2United Parcel Service, Inc. class B 260,945 22.9 22.9United States Steel Corporation 27,141 1.5 1.5United Stationers, Inc. 39,333 2.2 2.2United Surgical Partners International, Inc. 71,000 2.7 2.7United Technologies Corporation 895,755 58.5 58.5United Utilities 1,205,047 16.2 16.2UnitedHealth Group Incorporated 1,198,287 87.0 87.0Universal Forest Products, Inc. 12,900 0.8 0.8Universal Health Services, Inc. class B 65,300 3.6 3.6Universo Online, S.A. preferred 24,400 0.2 0.2Univision Communications, Inc. class A 26,765 0.9 0.9UnumProvident Corporation 161,647 4.3 4.3Uny Co., Ltd 74,000 1.4 1.4Uponor Oyj 13,091 0.3 0.3Uralsvyazinform 44,012 0.4 0.4
preferred 50,000,000 1.7 1.7 2.1Urasia Energy, Ltd 2,139,000 4.6 4.6Urbi, Desarrollos Urbanos, S.A. de C.V. 60,700 0.5 0.5Ursus International Limited fund units 2,869 8.1 8.1Ushio, Inc. 90,400 2.5 2.5Usinas Siderurgicas de Minas Gerais, S.A. preferred A 398,000 11.1 11.1VF Corporation 82,072 5.3 5.3VNU N.V. 450,002 17.4 17.4Valeo, S.A. 91,214 4.0 4.0Valero Energy Corporation 869,460 52.4 52.4Valmont Industries, Inc. 13,400 0.5 0.5Valora Holding AG 728 0.2 0.2Valu-Trac Strategic Fund 49.2 49.2Van Der Moolen Holding N.V. 8,839 0.1 0.1Van Houtte, Inc. 1,393,800 29.3 29.3
164

Vanguard International Semiconductor Corporation 749,000 0.7 0.7Varian Medical Systems, Inc. 2,500 0.2 0.2Varian Semiconductor Equipment Associates, Inc. 24,100 1.2 1.2Vastned Offices/Industrial N.V. 262,897 8.2 8.2Vedan International Holdings Limited 1,632,000 0.2 0.2Vedanta Ressources Plc 17,581 0.3 0.3Vedior N.V. 37,234 0.6 0.6Veeco Instruments, Inc. 16,000 0.3 0.3Vega Liquidity Non US Feeder Fund Ltd fund units 472,218 58.7 58.7Vega Select Opportunities Fund Ltd fund units 1,581 45.6 45.6Venfin Limited 27,600 0.2 0.2Ventas, Inc. 14,500 0.5 0.5Ventiv Health, Inc. 10,000 0.3 0.3Venture Corporation Limited 391,247 3.8 3.8Venture Production Plc 21,609 0.2 0.2Ventus Fund Limited fund units 13,821 21.2 21.2Veolia Environnement 133,096 7.0 7.0Verisign, Inc. 7,700 0.2 0.2Verizon Communications 1,999,819 70.4 70.4Vertex Pharmaceuticals Incorporated 70,356 2.3 2.3Vertrue, Inc. 28,300 1.2 1.2Vestas Wind Systems A/S 177,985 3.4 3.4Vestel Elektronik Sanayi ve Ticaret, A.S. 98,400 0.4 0.4Viacom, Inc. class B 799,651 30.4 30.4Viad, Corp. 32,000 1.1 1.1Viasat, Inc. 33,100 1.0 1.0Viasys Healthcare, Inc. 53,900 1.6 1.6Viceroy Exploration, Ltd 1,141,573 5.8 5.8
warrants 113,636 0.1 0.1 5.9Vicor Corporation 20,400 0.4 0.4Victhom Human Bionics, Inc. 0.4 0.4
warrants 185,185 - - 0.4Victor Co of Japan, Limited 251,000 1.7 1.7Viking Global Equities III Ltd fund units 12,091 39.6 39.6Vinci, S.A. 77,966 7.8 7.8Vincor International, Inc. 1,042,000 32.3 32.3Viohalco, Hellenic Copper and Aluminum Industry, S.A. 24,086 0.2 0.2Vior Inc. 2,471,166 0.5 0.5Virginia Gold Mines, Inc. 2,417,426 28.1 28.1
warrants 87,500 0.6 0.6 28.7
165

INVESTMENTS IN SHARES AND BONDS OF PUBLICLY TRADED COMPANIES as at December 31, 2005(fair value - in millions of dollars)
Designation ConvertibleSecurities
Bonds Subtotal Total
8
CORPORATIONS Shares Number Amount
(continued ) (continued)
Vital Signs, Inc. 6,000 0.3 0.3Vivendi Universal, S.A. 1,286,805 46.9 46.9Vodafone Group Plc 69,478,750 177.1 177.1Voestalpine AG 11,063 1.3 1.3VolgaTelecom 58,200 0.5 0.5Volkswagen AG 123,084 7.6 7.6
preferred 24,426 1.1 1.1 8.7Volt Information Sciences, Inc. 7,800 0.2 0.2Volvo AB class A 23,352 1.2 1.2
class B 209,277 11.5 11.5 12.7Vornado Realty Trust 8,060 0.8 0.8Votorantim Celulose e Papel, S.A. 1,122,700 16.1 16.1Vsmpo-Avisma Corporation 9,500 1.7 1.7Vulcan Materials Company 22,453 1.8 1.8WD-40 Company 90,092 2.8 2.8WMS Industries, Inc. 85,700 2.5 2.5WPP Group Plc 444,807 10.2 10.2W.W Grainger, Inc. 40,799 3.4 3.4Wabash National Corporation 40,800 0.9 0.9Wachovia Bank Commercial Mortgage Trust CMBS 284.2 284.2Wachovia Corporation 3,236,822 199.9 199.9
preferred 7,600 - - 199.9Wacoal Holdings Corporation 50,000 0.8 0.8Waddell & Reed Financial, Inc. class A 160,100 3.9 3.9Wal-Mart de Mexico, S.A. de C.V. serie V 615,425 4.0 4.0Wal-Mart Stores, Inc. 1,896,756 103.7 103.7Walgreen Co. 590,777 30.5 30.5Wallbridge Mining Company Limited 1,000,000 0.4 0.4
warrants 500,000 - - special warrants 250,000 0.1 0.1 0.5
Walt Disney Company, The 816,210 22.8 22.8Wan Hai Lines Ltd. 289,000 0.2 0.2Wartsila Corporation class B 13,043 0.4 0.4Washington Mutual, Inc. 556,871 28.3 28.3Waste Connections, Inc. 75,100 3.0 3.0
166

Waste Management, Inc. 374,477 13.3 13.3Waste Managment NZ Limited 12,800 0.1 0.1Waters Corporation 12,756 0.6 0.6Watsco, Inc. 25,200 1.8 1.8Watson Pharmaceuticals, Inc. 149,324 5.7 5.7Watson Wyatt Worldwide, Inc. class A 63,700 2.1 2.1Watts Water Technologies, Inc. 31,800 1.1 1.1Weatherford International, Ltd 59,345 2.5 2.5WebEx Communications, Inc. 30,300 0.8 0.8Websense, Inc. 19,800 1.5 1.5Weichai Power Co., Ltd class H 69,000 0.1 0.1Weight Watchers International, Inc. 8,800 0.5 0.5Weiqiao Textile Company Limited class H 291,500 0.5 0.5Wellpoint Health Networks, Inc. 176,858 16.5 16.5Wells Fargo Company 2,866,042 210.4 210.4Wells Fargo Financial Canada Corp. 2.7 2.7Wendy's International, Inc. 38,936 2.5 2.5Wereldhave N.V. 4,584 0.5 0.5Wesfarmers Limited 210,000 6.6 6.6West Corporation 66,600 3.3 3.3West Fraser Timber Co., Ltd 125,000 5.2 20.7 25.9West Japan Railway Company 782 3.8 3.8Westcoast Energy, Inc. 31.5 31.5Western Oil Sands, Inc. class A 615,600 17.1 17.1Western Prospector Group, Ltd 75,000 0.4 0.4Western Silver Corporation 417,200 5.5 5.5Westfield Group 2,351,870 36.6 36.6Westpac Banking Corporation 1,234,488 24.1 24.1Weyerhaeuser Company Limited 138,080 10.7 10.7Wharf (Holdings) Limited, The 1,649,127 6.8 6.8Whirlpool Corporation 14,306 1.4 1.4Whitbread Plc 122,202 2.3 2.3Whitehall Trust 350.0 350.0Whiterock Real Estate Investment Trust 1,200,000 3.2 3.2Whole Foods Market, Inc. 13,000 1.2 1.2Wiener Staedtische Allgemeine Versicherung AG 9,579 0.7 0.7Wienerberger AG 25,448 1.2 1.2Wihlborgs Fastigheter AB 3,388 0.1 0.1William Demant Holdings A/S 16,588 1.1 1.1William Hill Plc 256,374 2.8 2.8
167

INVESTMENTS IN SHARES AND BONDS OF PUBLICLY TRADED COMPANIES as at December 31, 2005(fair value - in millions of dollars)
Designation ConvertibleSecurities
Bonds Subtotal Total
8
CORPORATIONS Shares Number Amount
(continued ) (continued)
William Morrison Supermarkets Plc 678,114 2.6 2.6Williams Companies, Inc. (The) 190,223 5.2 5.2Williams-Sonoma, Inc. 31,000 1.6 1.6Wincor Nixdorf AG 17,266 2.1 2.1Windsor Trust 30.6 30.6Wing Hang Bank Limited 109,500 0.9 0.9Winnebago Industries 101,900 4.0 4.0Wintek Corp. 93,000 0.2 0.2Winton Futures Fund Ltd 145,275 34.6 53.9 88.5Wisconsin Energy Corp. 664,600 30.3 30.3Wistron Corporation 121,000 0.2 0.2Wm-Data AB class B 68,920 0.3 0.3Wm. Wrigley Jr. Company 67,350 5.2 5.2Wolfden Resources, Inc. 2,028,000 7.5 7.5Wolseley Plc 2,061,933 50.6 50.6Wolters Kluwer N.V. 294,603 6.9 6.9Wolverhampton & Dudley Breweries Plc 310,545 7.9 7.9Wolverine Tube, Inc. 12,600 0.1 0.1Wolverine World Wide, Inc. 171,300 4.5 4.5Woodruff Capital Management Inc. 440,500 0.3 0.3Woodside Petroleum Limited 305,900 10.3 10.3Woodward Governor Co. 13,100 1.3 1.3Woolworths Group Plc 1,284,944 1.0 1.0Woolworths Limited 809,674 11.7 11.7Woori Finance Holdings Co., Ltd 280,460 6.5 6.5World Wrestling Entertainment, Inc. 269,300 4.6 4.6Wyeth 526,257 28.3 28.3XL Capital, Ltd class A 43,705 3.4 3.4XM Satellite Radio Holdings, Inc. class A 95,000 3.0 3.0X-Rite, Inc. 48,500 0.6 0.6XTO Energy, Inc. 74,997 3.8 3.8Xcel Energy, Inc. 103,107 2.2 2.2Xerox Corporation 615,471 10.5 10.5Xilinx, Inc. 100,823 3.0 3.0Xinao Gas Holdings Limited 201,000 0.2 0.2
168
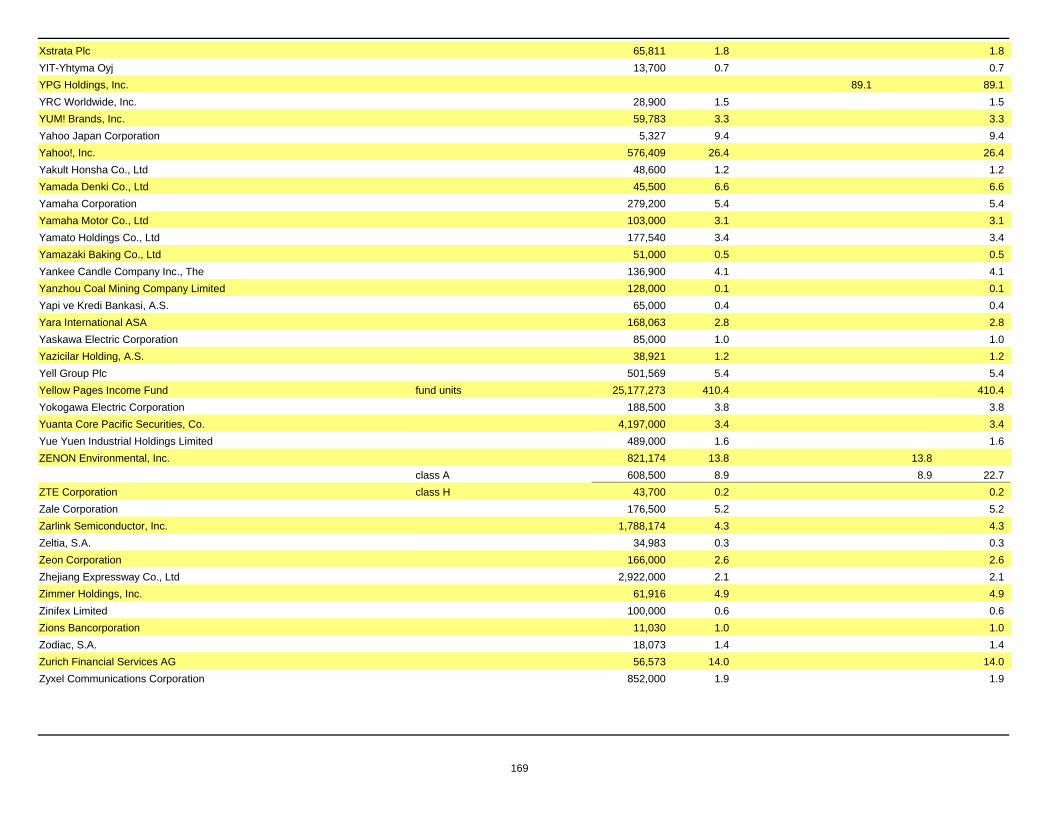
Xstrata Plc 65,811 1.8 1.8YIT-Yhtyma Oyj 13,700 0.7 0.7YPG Holdings, Inc. 89.1 89.1YRC Worldwide, Inc. 28,900 1.5 1.5YUM! Brands, Inc. 59,783 3.3 3.3Yahoo Japan Corporation 5,327 9.4 9.4Yahoo!, Inc. 576,409 26.4 26.4Yakult Honsha Co., Ltd 48,600 1.2 1.2Yamada Denki Co., Ltd 45,500 6.6 6.6Yamaha Corporation 279,200 5.4 5.4Yamaha Motor Co., Ltd 103,000 3.1 3.1Yamato Holdings Co., Ltd 177,540 3.4 3.4Yamazaki Baking Co., Ltd 51,000 0.5 0.5Yankee Candle Company Inc., The 136,900 4.1 4.1Yanzhou Coal Mining Company Limited 128,000 0.1 0.1Yapi ve Kredi Bankasi, A.S. 65,000 0.4 0.4Yara International ASA 168,063 2.8 2.8Yaskawa Electric Corporation 85,000 1.0 1.0Yazicilar Holding, A.S. 38,921 1.2 1.2Yell Group Plc 501,569 5.4 5.4Yellow Pages Income Fund fund units 25,177,273 410.4 410.4Yokogawa Electric Corporation 188,500 3.8 3.8Yuanta Core Pacific Securities, Co. 4,197,000 3.4 3.4Yue Yuen Industrial Holdings Limited 489,000 1.6 1.6ZENON Environmental, Inc. 821,174 13.8 13.8
class A 608,500 8.9 8.9 22.7ZTE Corporation class H 43,700 0.2 0.2Zale Corporation 176,500 5.2 5.2Zarlink Semiconductor, Inc. 1,788,174 4.3 4.3Zeltia, S.A. 34,983 0.3 0.3Zeon Corporation 166,000 2.6 2.6Zhejiang Expressway Co., Ltd 2,922,000 2.1 2.1Zimmer Holdings, Inc. 61,916 4.9 4.9Zinifex Limited 100,000 0.6 0.6Zions Bancorporation 11,030 1.0 1.0Zodiac, S.A. 18,073 1.4 1.4Zurich Financial Services AG 56,573 14.0 14.0Zyxel Communications Corporation 852,000 1.9 1.9
169

INVESTMENTS IN SHARES AND BONDS OF PUBLICLY TRADED COMPANIES as at December 31, 2005(fair value - in millions of dollars)
Designation ConvertibleSecurities
Bonds Subtotal Total
8
CORPORATIONS Shares Number Amount
(continued ) (continued)
This table lists the major investments in corporate shares and bonds as shown in the assets in the combined financial statements. This table is subject to the disclosure standards applicable to the annual list of such investments. In addition to these investments and based on the investment policies of the specialized portfolios, managers use derivative financial instruments in the management of investments which produce an economic return to the Caisse on one or several stocks.
The annual list must not provide any information deemed to be detrimental to the operations of the Caisse, to its economic interests or competitiveness or which may reveal an intended transaction, a transaction or series of transactions in process or which may cause prejudice to a company. Consequently, there may occasionnally exist differences between the investments in the annual list and those recorded in the books of the Caisse, at December 31.
170

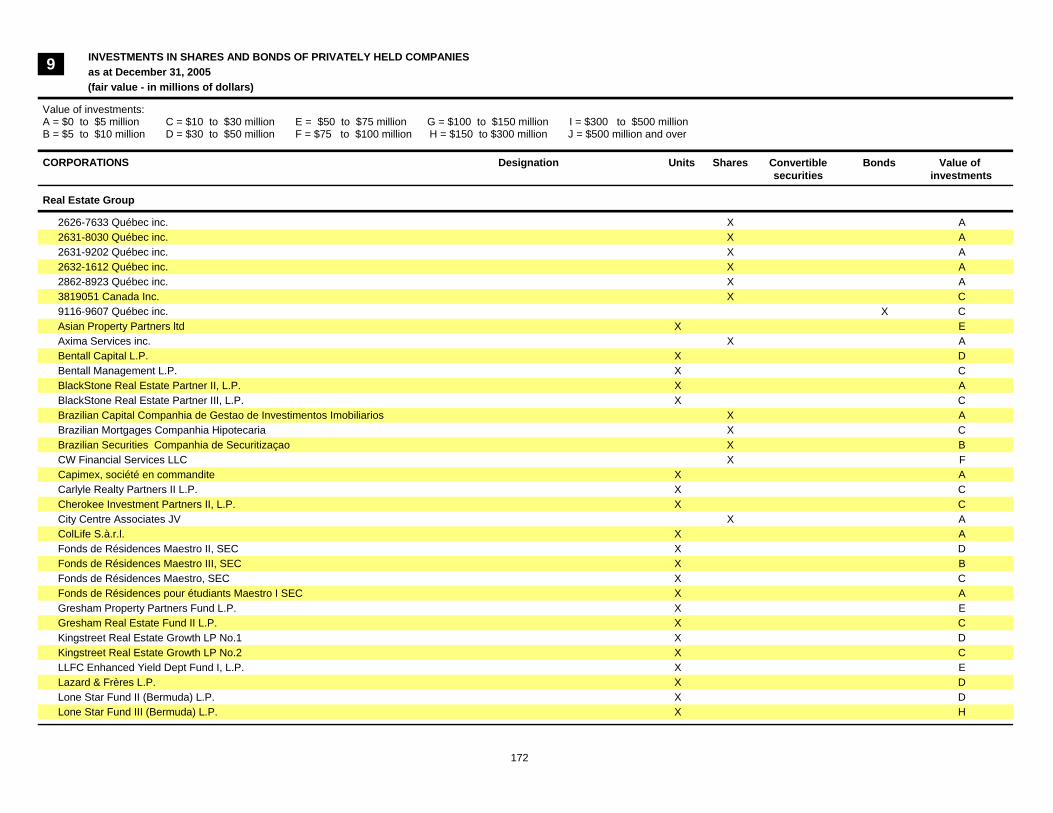
INVESTMENTS IN SHARES AND BONDS OF PRIVATELY HELD COMPANIESas at December 31, 2005(fair value - in millions of dollars)
Value of investments:A = $0 to $5 million C = $10 to $30 million E = $50 to $75 million G = $100 to $150 million I = $300 to $500 millionB = $5 to $10 million D = $30 to $50 million F = $75 to $100 million H = $150 to $300 million J = $500 million and over
CORPORATIONS Designation Shares Convertiblesecurities
Bonds Value of investments
Units
9
Real Estate Group
2626-7633 Québec inc. X A 2631-8030 Québec inc. X A 2631-9202 Québec inc. X A 2632-1612 Québec inc. X A 2862-8923 Québec inc. X A 3819051 Canada Inc. X C 9116-9607 Québec inc. X C Asian Property Partners ltd EXAxima Services inc. X A Bentall Capital L.P. DXBentall Management L.P. CXBlackStone Real Estate Partner II, L.P. AXBlackStone Real Estate Partner III, L.P. CXBrazilian Capital Companhia de Gestao de Investimentos Imobiliarios X A Brazilian Mortgages Companhia Hipotecaria X C Brazilian Securities Companhia de Securitizaçao X B CW Financial Services LLC X F Capimex, société en commandite AXCarlyle Realty Partners II L.P. CXCherokee Investment Partners II, L.P. CXCity Centre Associates JV X A ColLife S.à.r.l. AXFonds de Résidences Maestro II, SEC DXFonds de Résidences Maestro III, SEC BXFonds de Résidences Maestro, SEC CXFonds de Résidences pour étudiants Maestro I SEC AXGresham Property Partners Fund L.P. EXGresham Real Estate Fund II L.P. CXKingstreet Real Estate Growth LP No.1 DXKingstreet Real Estate Growth LP No.2 CXLLFC Enhanced Yield Dept Fund I, L.P. EXLazard & Frères L.P. DXLone Star Fund II (Bermuda) L.P. DXLone Star Fund III (Bermuda) L.P. HX
172

Lone Star Fund IV (Bermuda) L.P. JXLone Star Fund V (Bermuda) L.P. HXLone Star Opportunity Fund L.P. AXMCAP Commercial Limited Partnership X D MCAP Services Corporation X C Manhattan Conversion Fund LP BXN-46 A-B Notes Issuer Inc. X C NYC Residential Fund LP AXOne Park Realty Corp. X B PVP, LLC X A Penreal Property Trust II AXPenretail I LP AXPenretail II LP AXPenretail III L.P. AXPraedium Performance Partners LLC X D SITQ Jardins SAS X C SITQ Les Tours S.A. X H SITQ Ontario inc. X A Schroder Asian Property Fund CXShanghai Forte Land Co. Ltd X A The Praedium Fund VI Limited Partnership DXThe Praedium Group LLC X C
Private Equity¹
2752506 Canada Inc. X B 4198638 Canada Inc. X A 9082-9292 Québec inc. ² X A 9157-5357 Québec inc. class A, B X X C 9159-5793 Québec inc. ² class A, B X X D @rgentum, Corp. gestion et recherche AXAEgera Thérapeutique inc. preferred A, D X A ARC Energy Venture Fund 3 Canadian L.P. CXARC Energy Ventures Fund IV, L.P. CXAXA CDP CO-Investment Fund F.C.P.R. AXAXA LBO Fund III A CXAXA Private Equity Fund AXAXA Private Equity Fund II DXAXA Secondary Fund II L.P. CXAXA Secondary Fund III-1, L.P. CXAXA Secondary Fund L.P. CXAXA VENTURE Fund IV AXAccel IV L.P. CXAccès Capital Atlantique Maroc, L.P. AXAcurian Inc. preferred C X A
X A Administration LVER inc. X X A
173

INVESTMENTS IN SHARES AND BONDS OF PRIVATELY HELD COMPANIES (continued)as at December 31, 2005(fair value - in millions of dollars)
CORPORATIONS Designation Shares Convertiblesecurities
Bonds Value of investments
Units
9
Aeris Communications Inc. ² warrants X A preferred D, E X C X A
AgoraeGlobal preferred A-1 X A Air2Web Inc. warrants X A
preferred B, C, D X B Fonds AlterInvest, S.E.C. EXFonds d'investissement AlterInvest inc. class A, C X C Alter Moneta Limitée X A Altra Holdings Inc. preferred A X X C Ammasso, Inc. preferred A, A-1 X A Anda Networks, Inc. X A Anderson Energy, Ltd X C Aquiline Financial Services Fund, L.P. EXArcLight Energy Partners Fund I, L.P. CXArcLight Energy Partners Fund II, L.P. EXArc Second Inc. ² X A Ares Leveraged Investment Fund II, L.P. CXAres Leveraged Investment Fund, L.P. BXArgos Thérapeutics, Inc. preferred B X A
warrants X X A Ascent Medical Technology Fund, L.P. AXAsia Pacific Growth Fund II, L.P. AXAsia Pacific Growth Fund III, L.P. DXAstoria Energy LLC X EXAttraction inc. class A X A
preferred C, J X A Audisoft Technologie inc. preferred C X A
X A Auriga Ventures BXAuriga Ventures II BXAutodis S.A. X X C Automotive Sealing Systems Holdings S.A. preferred X A
X X A Automotive Sealing Systems S.A. X C BC European Capital V AXBC European Capital VI CXBC European Capital VII FXBC European Capital VIII AX
174

BC European Capital-GHG Syndication Fund EXBG Media Investors L.P. CXBGT BioGraphic Technologies inc. X X A BNP Europe Telecom & Media Fund II, L.P. CXBVP Europe II, L.P. CXBVP Europe, L.P. CXBVP Management Ltd X A Baker Tanks Inc. X D Baring Asia Private Equity Fund II L.P. 1 BXBaring Asia Private Equity Fund L.P.2 CXBaring Asia Private Equity Fund L.P.4 AXBaring Vostok Private Equity Fund III, L.P. BXBaring Vostok Private Equity, L.P. 1 CXBeta Top Co. Limited warrants X A Bigbangwidth Inc. X A BioAM AXBiogénie S.R.D.C. Inc. X A Biogentis inc. ² class D X A Biopharmacopae Design International Inc. X A BlackStone Capital Partners IV L.P. EXBlackStone Health Commitment Partners L.P. X B BlackStone Offshore Capital Partners II L.P. AXBlackStone Offshore Capital Partners III L.P. EXBonhom Luxembourg Co. SCA preferred X A
X A Bonhom SAS X A Brazil Private Equity Fund L.P., The CXBrightspark Ventures II, L.P. AXBrightspark Ventures, L.P. BXBruckmann, Rosser, Sherrill & Co. II, L.P. CXCAI Capital Partners & Company III, L.P. AXC-Chip Technologies Corp. X A CCE Holdings, LLC parts B X HXCCP Allied, LDC X B CFS Holdings BV warrants X A CMC Electronics Holdings Inc. class A X C CML Emergency Services Inc. preferred A X A
X A Callahan Baden-Wurttemberg GmbH X D Callahan InvestCo Belgium 1 S.à.r.l. class A X A
preferred X A warrants X X A
Callahan InvestCo Belgium 2 S.à.r.l. preferred X A warrants X A X X A
175

INVESTMENTS IN SHARES AND BONDS OF PRIVATELY HELD COMPANIES (continued)as at December 31, 2005(fair value - in millions of dollars)
CORPORATIONS Designation Shares Convertiblesecurities
Bonds Value of investments
Units
9
Callahan InvestCo Germany 1 S.à.r.l. class A, C X X C preferred X D
Callahan InvestCo Germany 2 S.à.r.l. class A, A-2, A-3, A-4 X X C preferred X D
Callisto Capital L.P. CXCamoplast inc. ² class A X D Canadian Regional Aircraft Finance Transaction no1. Limited preferred X A Candover 2001 Fund UK No 3 L.P. EXCandover 2005 Fund US No.2 L.P. AXSociété en commandite Capimont Technologies parts B X BXCapital Z Financial Services Fund II, L.P. AXCapital Z Lancashire Partners, LP CXCaravelle Investment Fund, L.L.C. AXCarlyle Europe Partners II, L.P. BXCarlyle Europe Technology Partners L.P. AXCarlyle Partners IV, L.P. CXCarlyle/Riverstone Global & Power Fund III, L.P. AXCellex Power Products Inc. preferred B-1 X A Cellular Genomics, Inc. preferred C X A Centre d'hébergement et de Soins de Longue Durée St-Jude Inc. X A Centres d'hébergement Bio Santé holdings inc., Les X B Century Capital Partners III, L.P. AXCercueils Victoriaville ltée class A X A Champlain Capital Partners, L.P. CXChaussure Rallye inc. class B X A Cherokee Investment Partners II, L.P. CXChina Renaissance Industries, L.P. AXChronogen Inc. warrants X A
preferred A, B-1, B-2, B-3 X B Cimbec inc. X A Citicorp Mezzanine III, L.P. CXCiviGenics Inc. preferred B X X A Clayton, Dubilier & Rice Fund VII, L.P. CXClearCross, Inc. ² preferred A, B-2, C, D, F, G, H X A
X C Cobra International Systèmes de Fixations Cie X X A Codagen Technologies Corp. X A Collocation Solutions, L.L.C. X A Commercial Alcohols Inc. X B
176
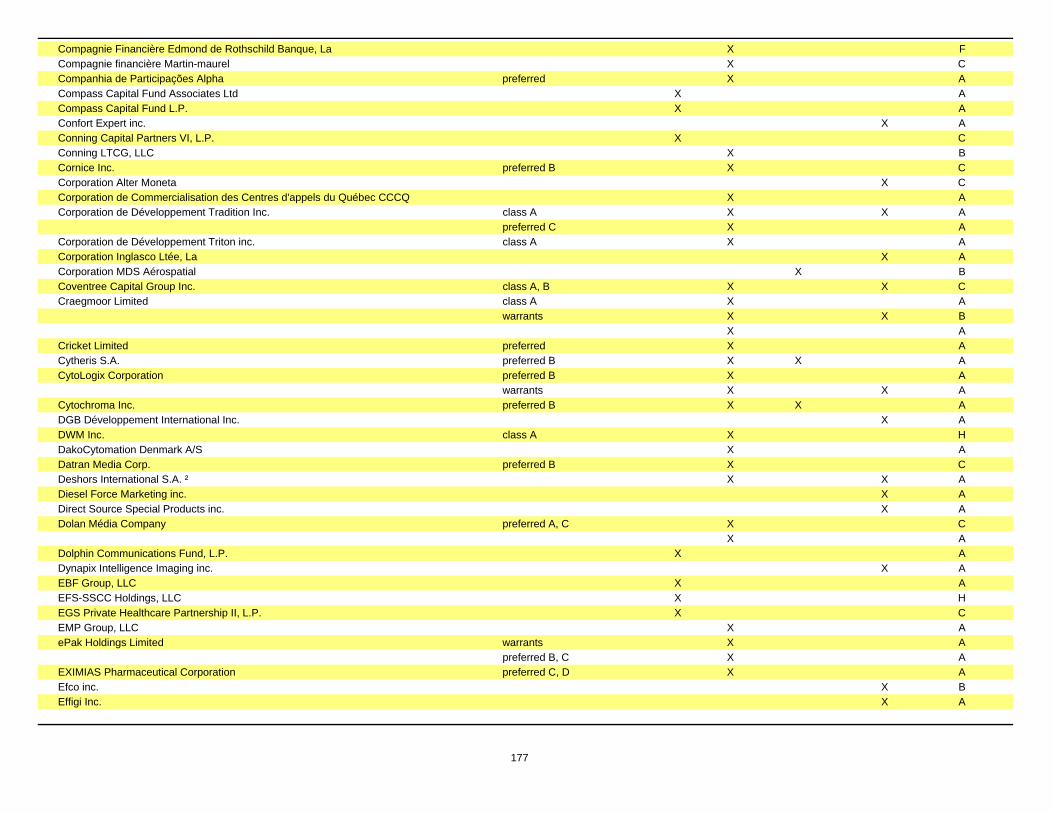
Compagnie Financière Edmond de Rothschild Banque, La X F Compagnie financière Martin-maurel X C Companhia de Participações Alpha preferred X A Compass Capital Fund Associates Ltd AXCompass Capital Fund L.P. AXConfort Expert inc. X A Conning Capital Partners VI, L.P. CXConning LTCG, LLC X B Cornice Inc. preferred B X C Corporation Alter Moneta X C Corporation de Commercialisation des Centres d'appels du Québec CCCQ X A Corporation de Développement Tradition Inc. class A X X A
preferred C X A Corporation de Développement Triton inc. class A X A Corporation Inglasco Ltée, La X A Corporation MDS Aérospatial X B Coventree Capital Group Inc. class A, B X X C Craegmoor Limited class A X A
warrants X X B X A
Cricket Limited preferred X A Cytheris S.A. preferred B X X A CytoLogix Corporation preferred B X A
warrants X X A Cytochroma Inc. preferred B X X A DGB Développement International Inc. X A DWM Inc. class A X H DakoCytomation Denmark A/S X A Datran Media Corp. preferred B X C Deshors International S.A. ² X X A Diesel Force Marketing inc. X A Direct Source Special Products inc. X A Dolan Média Company preferred A, C X C
X A Dolphin Communications Fund, L.P. AXDynapix Intelligence Imaging inc. X A EBF Group, LLC AXEFS-SSCC Holdings, LLC HXEGS Private Healthcare Partnership II, L.P. CXEMP Group, LLC X A ePak Holdings Limited warrants X A
preferred B, C X A EXIMIAS Pharmaceutical Corporation preferred C, D X A Efco inc. X B Effigi Inc. X A
177
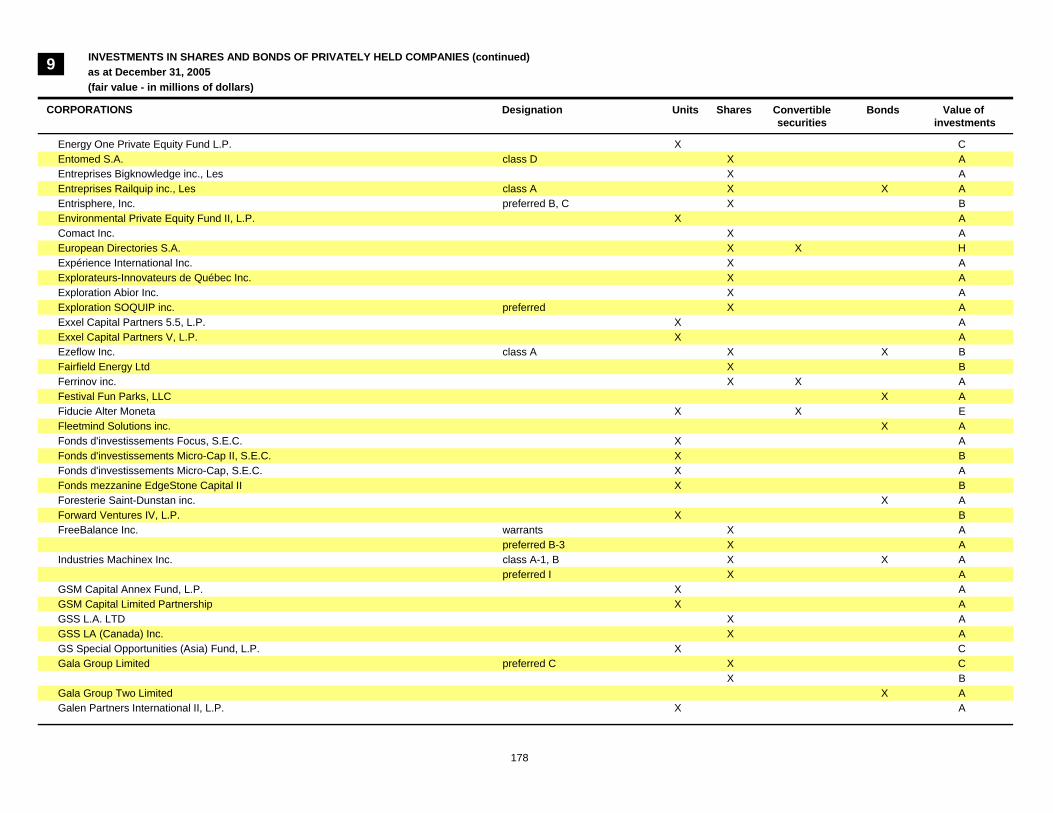
INVESTMENTS IN SHARES AND BONDS OF PRIVATELY HELD COMPANIES (continued)as at December 31, 2005(fair value - in millions of dollars)
CORPORATIONS Designation Shares Convertiblesecurities
Bonds Value of investments
Units
9
Energy One Private Equity Fund L.P. CXEntomed S.A. class D X A Entreprises Bigknowledge inc., Les X A Entreprises Railquip inc., Les class A X X A Entrisphere, Inc. preferred B, C X B Environmental Private Equity Fund II, L.P. AXComact Inc. X A European Directories S.A. X X H Expérience International Inc. X A Explorateurs-Innovateurs de Québec Inc. X A Exploration Abior Inc. X A Exploration SOQUIP inc. preferred X A Exxel Capital Partners 5.5, L.P. AXExxel Capital Partners V, L.P. AXEzeflow Inc. class A X X B Fairfield Energy Ltd X B Ferrinov inc. X X A Festival Fun Parks, LLC X A Fiducie Alter Moneta X EXFleetmind Solutions inc. X A Fonds d'investissements Focus, S.E.C. AXFonds d'investissements Micro-Cap II, S.E.C. BXFonds d'investissements Micro-Cap, S.E.C. AXFonds mezzanine EdgeStone Capital II BXForesterie Saint-Dunstan inc. X A Forward Ventures IV, L.P. BXFreeBalance Inc. warrants X A
preferred B-3 X A Industries Machinex Inc. class A-1, B X X A
preferred I X A GSM Capital Annex Fund, L.P. AXGSM Capital Limited Partnership AXGSS L.A. LTD X A GSS LA (Canada) Inc. X A GS Special Opportunities (Asia) Fund, L.P. CXGala Group Limited preferred C X C
X B Gala Group Two Limited X A Galen Partners International II, L.P. AX
178

Galileo Laboratories Inc. preferred F X A GeminX Biotechnologies Inc. class A X A
warrants X A preferred A, B X B
GeneChem Technologies Venture Fund, L.P. AXGenesis Partners II LDC BXGenesis Partners III, L.P. AXGenstar Capital Partners III CXGenstar Capital Partners IV, L.P. CXGestion Biothermica Énergie Inc. X A Gestion Capital 07 Enr. AXGestion de placements Holdun inc. class A, B X A Gestion Michel Julien inc. class A X A
preferred B, C, D X A Gestion Sky High Inc. class A X X A Gestion Sodémex inc. class A, B X A Gestion Valkar Inc. class A X A Gibraltar Exploration Ltd X D Glencoe Capital Institutional Partners III, L.P. CXGlencoe Capital Partners III, L.P. CXGlencoe/d'Amérique LLC BXGlimmerglass Networks Inc. preferred B, C X A GrandBanks Capital Venture Fund L.P. CXGreen Equity Investors III, L.P. BXGreen Equity Investors IV, L.P. CXGroupe Drolet inc. X A Groupe Lincora inc. X A Groupe Optimum inc. class AA, BB X B Groupe Santé Sedna inc. class A X X B
preferred B X B Grupo Corporativo Ono, S.A. class B X A HM/Latimer Coinvestors, L.P. CXHM/Latimer Investments No.1, L.P. BXHMY International warrants X A
X X C HOCHTIEF AirPort Capital GmbH X X H HRS Asset Management Limited X A HR Strategies, Inc. class A X A
AXHSD HOLDINGS, INC. X C Harlan Sprague Dawley, Inc. X E HealthCap IV L.P. CXHeatwave Technologies Inc. preferred A X X A Holiday Group / Travelpro International X X C Huntingdon Acquisition Partners, Inc. preferred B X A
179
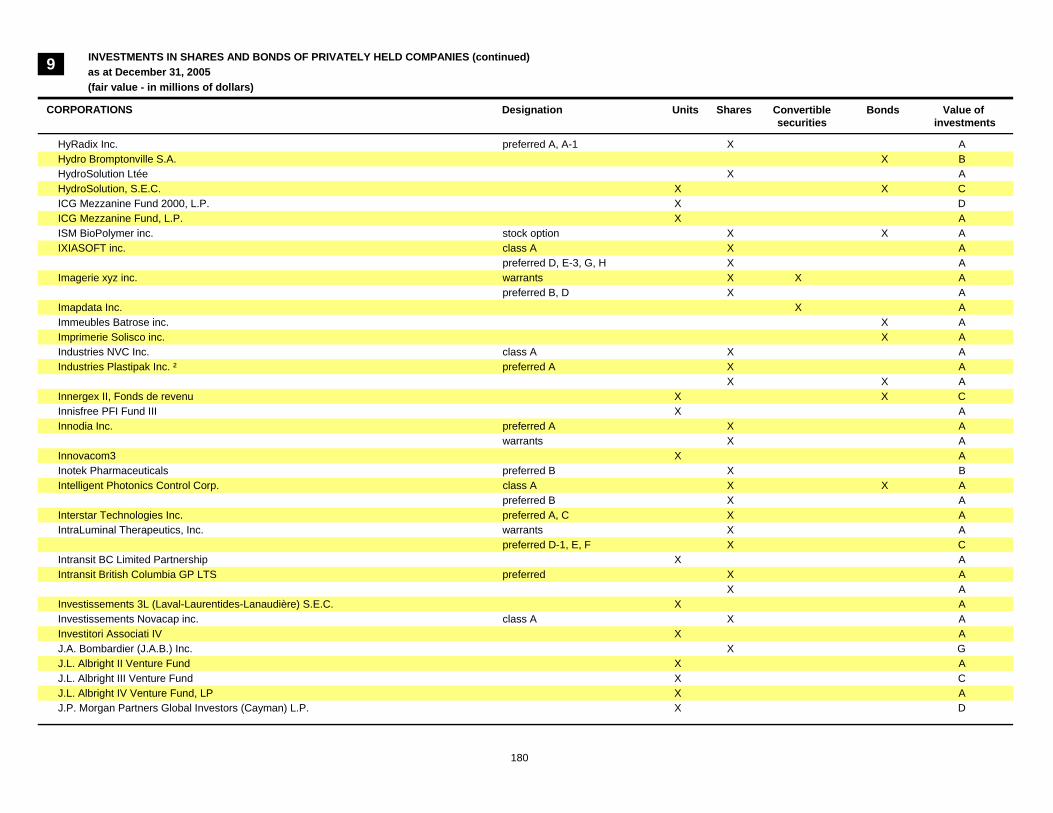
INVESTMENTS IN SHARES AND BONDS OF PRIVATELY HELD COMPANIES (continued)as at December 31, 2005(fair value - in millions of dollars)
CORPORATIONS Designation Shares Convertiblesecurities
Bonds Value of investments
Units
9
HyRadix Inc. preferred A, A-1 X A Hydro Bromptonville S.A. X B HydroSolution Ltée X A HydroSolution, S.E.C. X CXICG Mezzanine Fund 2000, L.P. DXICG Mezzanine Fund, L.P. AXISM BioPolymer inc. stock option X X A IXIASOFT inc. class A X A
preferred D, E-3, G, H X A Imagerie xyz inc. warrants X X A
preferred B, D X A Imapdata Inc. X A Immeubles Batrose inc. X A Imprimerie Solisco inc. X A Industries NVC Inc. class A X A Industries Plastipak Inc. ² preferred A X A
X X A Innergex II, Fonds de revenu X CXInnisfree PFI Fund III AXInnodia Inc. preferred A X A
warrants X A Innovacom3 AXInotek Pharmaceuticals preferred B X B Intelligent Photonics Control Corp. class A X X A
preferred B X A Interstar Technologies Inc. preferred A, C X A IntraLuminal Therapeutics, Inc. warrants X A
preferred D-1, E, F X C Intransit BC Limited Partnership AXIntransit British Columbia GP LTS preferred X A
X A Investissements 3L (Laval-Laurentides-Lanaudière) S.E.C. AXInvestissements Novacap inc. class A X A Investitori Associati IV AXJ.A. Bombardier (J.A.B.) Inc. X G J.L. Albright II Venture Fund AXJ.L. Albright III Venture Fund CXJ.L. Albright IV Venture Fund, LP AXJ.P. Morgan Partners Global Investors (Cayman) L.P. DX
180
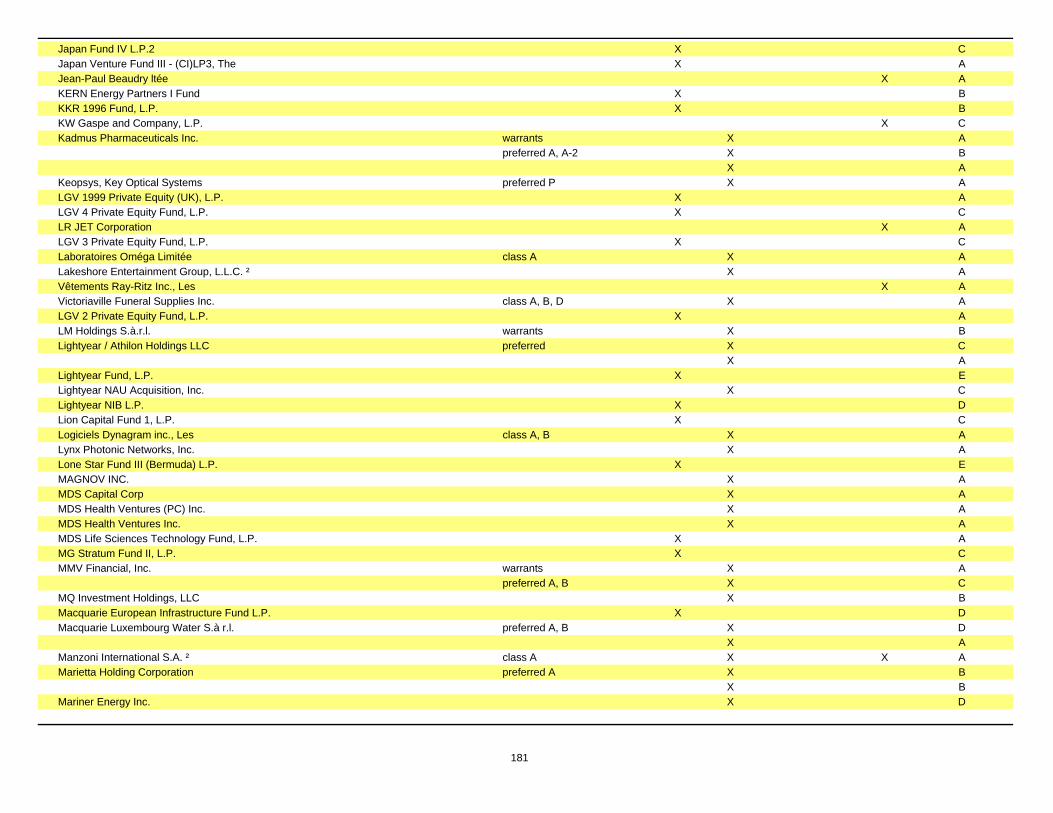
Japan Fund IV L.P.2 CXJapan Venture Fund III - (CI)LP3, The AXJean-Paul Beaudry ltée X A KERN Energy Partners I Fund BXKKR 1996 Fund, L.P. BXKW Gaspe and Company, L.P. X C Kadmus Pharmaceuticals Inc. warrants X A
preferred A, A-2 X B X A
Keopsys, Key Optical Systems preferred P X A LGV 1999 Private Equity (UK), L.P. AXLGV 4 Private Equity Fund, L.P. CXLR JET Corporation X A LGV 3 Private Equity Fund, L.P. CXLaboratoires Oméga Limitée class A X A Lakeshore Entertainment Group, L.L.C. ² X A Vêtements Ray-Ritz Inc., Les X A Victoriaville Funeral Supplies Inc. class A, B, D X A LGV 2 Private Equity Fund, L.P. AXLM Holdings S.à.r.l. warrants X B Lightyear / Athilon Holdings LLC preferred X C
X A Lightyear Fund, L.P. EXLightyear NAU Acquisition, Inc. X C Lightyear NIB L.P. DXLion Capital Fund 1, L.P. CXLogiciels Dynagram inc., Les class A, B X A Lynx Photonic Networks, Inc. X A Lone Star Fund III (Bermuda) L.P. EXMAGNOV INC. X A MDS Capital Corp X A MDS Health Ventures (PC) Inc. X A MDS Health Ventures Inc. X A MDS Life Sciences Technology Fund, L.P. AXMG Stratum Fund II, L.P. CXMMV Financial, Inc. warrants X A
preferred A, B X C MQ Investment Holdings, LLC X B Macquarie European Infrastructure Fund L.P. DXMacquarie Luxembourg Water S.à r.l. preferred A, B X D
X A Manzoni International S.A. ² class A X X A Marietta Holding Corporation preferred A X B
X B Mariner Energy Inc. X D
181

INVESTMENTS IN SHARES AND BONDS OF PRIVATELY HELD COMPANIES (continued)as at December 31, 2005(fair value - in millions of dollars)
CORPORATIONS Designation Shares Convertiblesecurities
Bonds Value of investments
Units
9
Marquee Holdings Inc. X D Mechtronix Systems Inc. class A X A
warrants X X B MedPointe Inc. X B MédiaTel Capital BXMeg Energy Corp. X D Méga Bleu inc. preferred D X X A Meridian Automotive Systems Inc. class A X A
warrants X X A Metabolex, Inc. preferred B-1 X B
warrants X A Mine Jeffrey inc. preferred X A
X A Miralta Capital II Inc. class A X X A Miralta Teramira Inc. class A X X A Mirapoint, Inc. X B Mobile Storage Group, Inc. X X C Mobile365, Inc. preferred C-1, D-1 X C Montreal Exchange X C Montreal, Maine & Atlantic Corporation warrants X A
X X C Morgan Schaffer inc. ² class A X A Mosaic Venture Partners II, L.P. BXMotovan Corporation class A X A NCP-MHZ, L.P. X A NTB Neurotrophic Bioscience Inc. X A Nanoledge X A Necta Syndication Limited Partnership DXNetActive Inc. X A Netstar Group Holding Limited X A Netstar International Holdings (BVI) Ltd preferred E X A
warrants X X A Neuro-Biotech Corporation X A Neuroscience Partners, L.P. AXNewStar Credit Opportunities Fund Ltd preferred X C
X A Newbridge Asia III, L.P. DXNewbridge Asia IV, L.P. BXNewbury Ventures Associates, L.P. AX
182
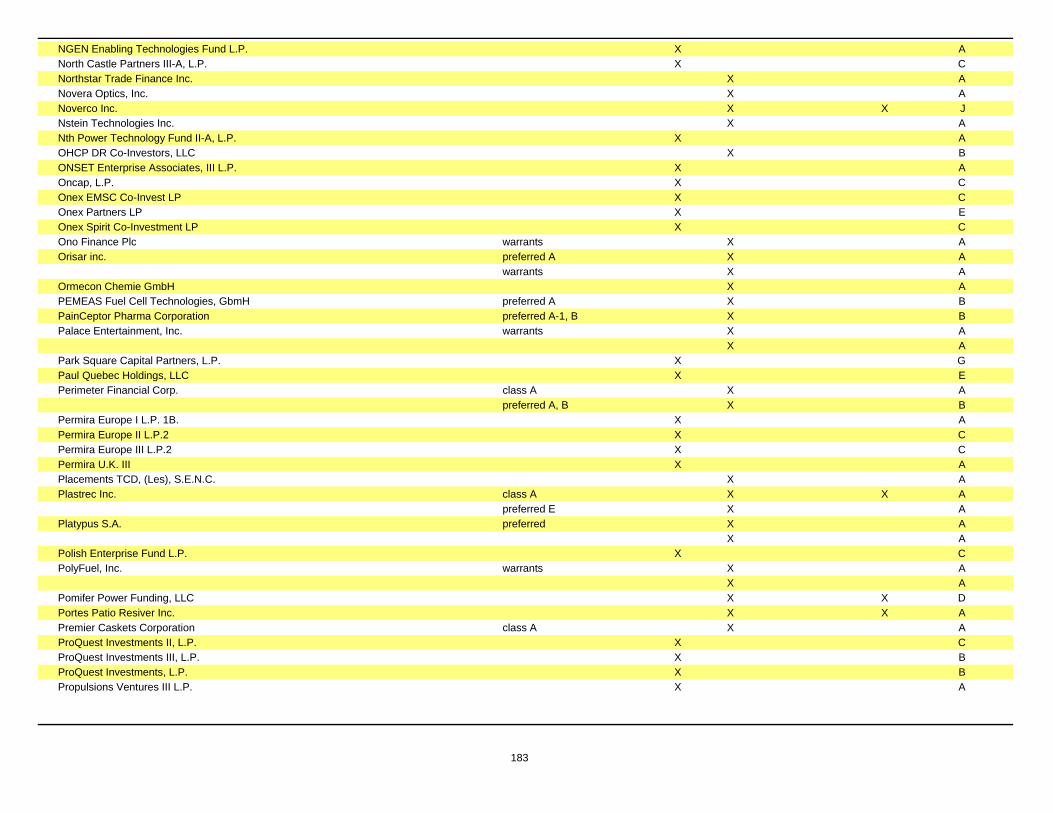
NGEN Enabling Technologies Fund L.P. AXNorth Castle Partners III-A, L.P. CXNorthstar Trade Finance Inc. X A Novera Optics, Inc. X A Noverco Inc. X X J Nstein Technologies Inc. X A Nth Power Technology Fund II-A, L.P. AXOHCP DR Co-Investors, LLC X B ONSET Enterprise Associates, III L.P. AXOncap, L.P. CXOnex EMSC Co-Invest LP CXOnex Partners LP EXOnex Spirit Co-Investment LP CXOno Finance Plc warrants X A Orisar inc. preferred A X A
warrants X A Ormecon Chemie GmbH X A PEMEAS Fuel Cell Technologies, GbmH preferred A X B PainCeptor Pharma Corporation preferred A-1, B X B Palace Entertainment, Inc. warrants X A
X A Park Square Capital Partners, L.P. GXPaul Quebec Holdings, LLC EXPerimeter Financial Corp. class A X A
preferred A, B X B Permira Europe I L.P. 1B. AXPermira Europe II L.P.2 CXPermira Europe III L.P.2 CXPermira U.K. III AXPlacements TCD, (Les), S.E.N.C. X A Plastrec Inc. class A X X A
preferred E X A Platypus S.A. preferred X A
X A Polish Enterprise Fund L.P. CXPolyFuel, Inc. warrants X A
X A Pomifer Power Funding, LLC X X D Portes Patio Resiver Inc. X X A Premier Caskets Corporation class A X A ProQuest Investments II, L.P. CXProQuest Investments III, L.P. BXProQuest Investments, L.P. BXPropulsions Ventures III L.P. AX
183

INVESTMENTS IN SHARES AND BONDS OF PRIVATELY HELD COMPANIES (continued)as at December 31, 2005(fair value - in millions of dollars)
CORPORATIONS Designation Shares Convertiblesecurities
Bonds Value of investments
Units
9
Prowatt inc. class A, B X X A preferred C X A
Publications Professionnelles SAS warrants X A Quantiscript Inc. class F X A
preferred D X A Quebecor Media, Inc. ² X J Quester Venture Partnership BXRacman inc. class A, B X A
preferred C X A Ray Investment S.à r.l. preferred X H
X A X A
RenaMed Biologics preferred C-1, C-2 X A Ressources Oxford Inc. X A Ressources Unifiées Val D'or Inc. X A Renaissance Funds LDC, The AXRho Fund Investors 2005, LP AXRho Ventures V, L.P. AXRoyalton Capital Investors, LDC CXRyshco Média inc. X A SAM HealthCare/Biotech Equity Fund Limited CXSAM Private Equity Energy Fund L.P. AXSSQ Vie X E SS8 Networks Inc. preferred A, B, C X A STM Power Inc. preferred B X B
warrants X X A SW Acquisition, L.P. X A Sagard FCPR DXSaints Capital V, L.P. AXSanderling Venture Partners IV, L.P. BXSanderling Venture Partners V, L.P. CXSanderling Venture Partners VI, L.P. AXSanderling VI Co-Investment Fund, L.P. AXPool Acquisition S.A. X X A Schroder Canadian Buy-Out Fund II Limited Partnership CLP2 AXSchroder Canadian Buy-Out Fund III Limited Partnership LP1 AXSchroder Ventures Asia Pacific Fund L.P.2 CXSeQant Asset Management Pty. Limited X A Sécurité Polygon inc. X A
184
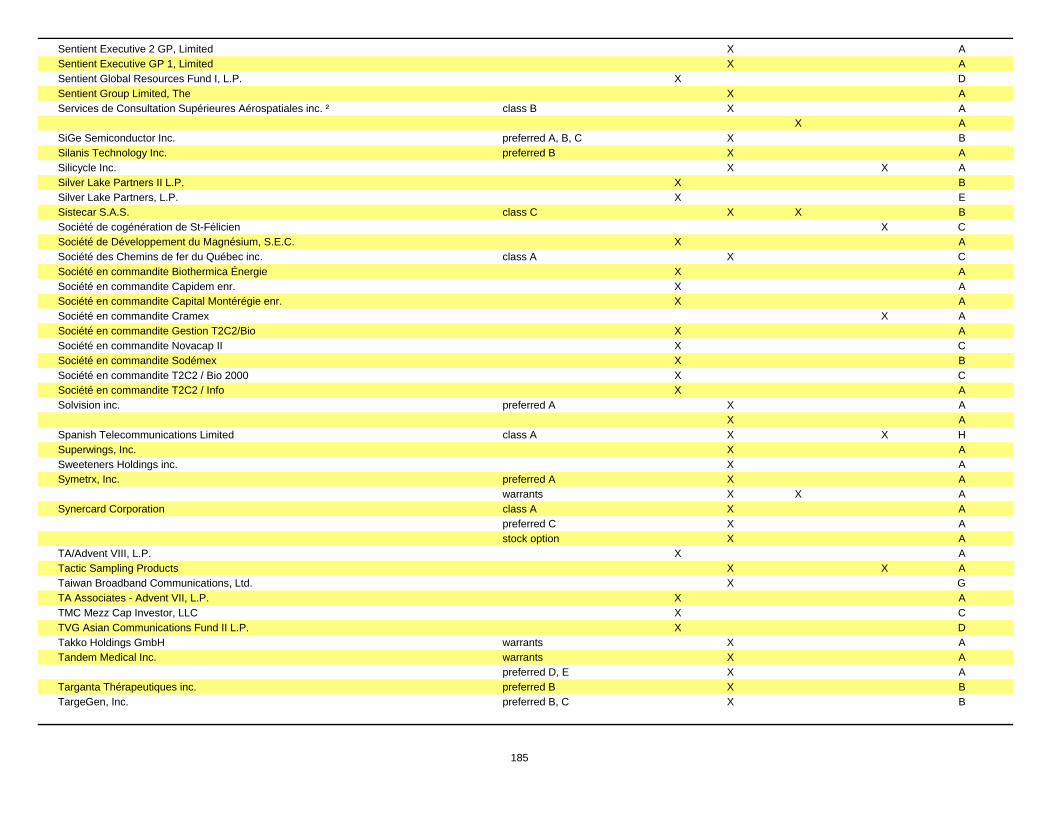
Sentient Executive 2 GP, Limited X A Sentient Executive GP 1, Limited X A Sentient Global Resources Fund I, L.P. DXSentient Group Limited, The X A Services de Consultation Supérieures Aérospatiales inc. ² class B X A
X A SiGe Semiconductor Inc. preferred A, B, C X B Silanis Technology Inc. preferred B X A Silicycle Inc. X X A Silver Lake Partners II L.P. BXSilver Lake Partners, L.P. EXSistecar S.A.S. class C X X B Société de cogénération de St-Félicien X C Société de Développement du Magnésium, S.E.C. AXSociété des Chemins de fer du Québec inc. class A X C Société en commandite Biothermica Énergie AXSociété en commandite Capidem enr. AXSociété en commandite Capital Montérégie enr. AXSociété en commandite Cramex X A Société en commandite Gestion T2C2/Bio AXSociété en commandite Novacap II CXSociété en commandite Sodémex BXSociété en commandite T2C2 / Bio 2000 CXSociété en commandite T2C2 / Info AXSolvision inc. preferred A X A
X A Spanish Telecommunications Limited class A X X H Superwings, Inc. X A Sweeteners Holdings inc. X A Symetrx, Inc. preferred A X A
warrants X X A Synercard Corporation class A X A
preferred C X A stock option X A
TA/Advent VIII, L.P. AXTactic Sampling Products X X A Taiwan Broadband Communications, Ltd. X G TA Associates - Advent VII, L.P. AXTMC Mezz Cap Investor, LLC CXTVG Asian Communications Fund II L.P. DXTakko Holdings GmbH warrants X A Tandem Medical Inc. warrants X A
preferred D, E X A Targanta Thérapeutiques inc. preferred B X B TargeGen, Inc. preferred B, C X B
185

INVESTMENTS IN SHARES AND BONDS OF PRIVATELY HELD COMPANIES (continued)as at December 31, 2005(fair value - in millions of dollars)
CORPORATIONS Designation Shares Convertiblesecurities
Bonds Value of investments
Units
9
Technique d'usinage Sinlab inc. X A Technologies Quazal Inc. class A, B X X A Technologies Sensorielles TEG inc., Les X X A Telenet Group Holding N.V. warrants X B Tellme Networks, Inc. X B Tenaska Power Fund L.P. BXTeraXion inc. X A Therion Biologics Corporation warrants X A
preferred B, C X A Topigen Pharmaceuticals Inc. preferred B X B
warrants X A Tour de Mons S.A.S., La stock option X A
X X C TransMedics, Inc. preferred A, B, C X C
X A Trident II, L.P. CXTrident III, L.P. CXTriosyn Corp. preferred A X A
warrants X X B Tripmaster Corporation warrants X X A Triton Electronique inc. class A X A Tube Images inc. class A X X X A Ultimate Juice Co. Holdings, Inc. preferred A X A VS & A Communications Partners III L.P. DXVS&A-DTN, LLC preferred A X A
X A VSS Communications Partners IV, L.P. CXVTG AG X E Validus Holdings Ltd X G VantagePoint Communications Partners L.P. AXVantagePoint Venture Partners III(Q), L.P. CXVantagePoint Venture Partners IV(Q), L.P. BXVentures West 8, L.P. AXVeritas Capital Fund II, L.P. CXVertical Networks, Inc. X A Violy, Byorum & Partners Holdings, LLC parts A X AX
parts B X AXViroChem Pharma Inc. class A X A Visionael Corporation preferred C, F X A
186

VistaScape Security Systems Corp. warrants X A preferred B, C-1, C-2, D X A X A
WCC Investments L.P. AXWageWorks, Inc. preferred D X B Warburg Pincus Private Equity IX, L.P. CXWilton Re Holdings Limited class A X C Wynnchurch Capital Partners Canada, L.P. CXXanthus Life Sciences, Inc. preferred B X A
Fixed Income
Fairview Mall X C Galerie d'Anjou X C Minto Developments Inc. (The Company) X C N-46 A-B Notes Issuer Inc. X D Promenade St-Bruno X D
¹ Investment made or held by the Caisse or a subsidiary created pursuant to section 37.1 of the Act respecting the Caisse.² Investment made or held by the Caisse or one of its subsidiaries pursuant to the last paragraph of section 37.1 of the Act respecting the Caisse.
This table lists the major investments in shares and bonds of private corporations as shown in the assets of the combined financial statements. This table is subject to the disclosure standards applicable to the annual list of such investments.
The annual list must not provide any information deemed to be detrimental to the operations of the Caisse, to its economic interests or competitiveness or which may reveal an intended transaction, a transaction or series of transactions in process or which may cause prejudice to a company. Consequently, there may occasionnally exist differences between the investments in the annual list and those recorded in the books of the Caisse at December 31.
Pursuant to agreement, the specific value of investments in any private company (according to the definition of the Québec Securities Act) does not appear in this list unless the company has agreed to such disclosure.
187

STATEMENT OF REAL ESTATE HOLDINGS as at December 31, 2005
188
Location Land and buildings
10 Location Land and buildings Location Land and buildings
Anjou Land – Parc d’affaires Calgary 320 – 4th Avenue SW Dartmouth 15, 17, 21, 25, 76, 80, 94, 95, 96 and 98 Highfield Park Drive Dartmouth 20, 30, 40, 47 and 51 Joseph Young St. Edmonton 10135 – 100 Street NW Laval Land – chemin du Bord de l’eau Montréal 10, rue Sherbrooke Ouest Montréal 360, rue St-Antoine Ouest Montréal 2020, rue University Montréal 901, square Victoria Ottawa 11 Colonel By Drive Québec 1 to 4, Place De Merici and land Toronto 1770 to 1790 Eglington East Toronto 1 Harbour Square Toronto 1530 to 1570 Victoria Park Vancouver 1601 Bayshore Drive
Foreign Investments – United States
Belleville 216 Branch Brook Drive Bronx 2296 and 2327 Andrews Llc Bronx 2073 Davidson Llc Bronx 37-39 Featherbed Lane Bronx 244 Fieldstone Terrace Bronx 2084 and 2155 Grand Llc Bronx 2800 Heath Avenue Hilton Head 2 Grasslawn Avenue Houston 850 Briarwillow Drive Houston 16818 Carl Avenue Houston 400, 501, 770, 855 and 1000 Greens Road Houston 17030 to 17050, 17103, 17206 and 17435 Imperial Valley Drive Houston 1110 Langwick Drive Houston 535 Seminar Drive Houston 17630 and 17715 Wayforest Drive Jamaica 150-75 87th Avenue Jamaica 109 Merrick Llc La Verne 1825 Foothill Boulevard La Verne 1938 Rock Lane New York 753 Amsterdam Avenue New York 10 Downing Street New York 899 Montgomery New York 20 and 41 Park Avenue New York 108 West 15th Street New York 305-319 West 33rd Street New York 301-324 West 34th Street New York 235 and 237 West 48th Street New York 401 West 56th Street New York 167 East 82nd Street
New York 120 West 86th Street New York 210 West 89th Street New York 135 West 96th Street New York 120-160 West 97th Street New York 209 West 102nd Street New York 6 West 107th Street Rancho Cucamonga 10757 Lemon Avenue Southfield 23275 Riverside Drive Tucson 3800 East Sunrise Drive
Foreign Investments – Other Brasilia (Brazil) Land Warsaw (Poland) Land – Julianowska Street Warsaw (Poland) 39, Mokotowska
Barrie Land – Simcoe Beauport Land – Joseph Casavant and Clémenceau Belleville 390 North Front Street Belleville Land – Belleville Lands Brantford 84 Lynden Road and land Brantford Land – Brantford lands Brossard 2150, boulevard Lapinière Burlington 777 Guelph Line Burlington 900 Maple Avenue Burnaby 4710, 4720 and 4880 Kingsway Street Burnaby Land – Mandrotown Phase III Calgary 100 Anderson Road SE Calgary 11012 MacLeod Trail S Calgary 3625 Shaganappi Trail NW and land Calgary 901 64th Avenue NE and land Calgary 2525 36th Street NE and land Calgary Land – Northgate Site Chatham 100 King Street W Dartmouth 21 Micmac Boulevard Dundas 101 Osler Drive Edmonton 6203 28th Avenue Edmonton 2331 66th Street NW and land Edmonton 111th Street and 51st Avenue Hull 320, boulevard St-Joseph Kelowna Land – Kelowna Site Kingston 945 Gardiners Road Laval 2999, Autoroute 440 Laval 2800, avenue du Cosmodôme and land Laval Land - St-Martin and Laval Lévis Land – Saint-Romuald Mascouche Land – Mascouche/Lachenaie Mascouche Land – Montée Masson Mercier Land – boulevard St-Jean-Baptiste Mississauga 1250 South Service Road
Montréal 1500, avenue McGill College Montréal 500, boulevard de Maisonneuve Ouest Montréal 6000, boulevard Henri-Bourassa Est Montréal 7999, boulevard Les Galeries d'Anjou Montréal 3205 and 3333, chemin de la Côte Vertu Montréal 3801, route Transcanadienne Montréal 4815, rue Buchan Montréal 4901 and 7330, rue Jean-Talon Ouest Montréal 5010, rue Paré Montréal 677, 685 and 705, rue Ste-Catherine Ouest Montréal 7500, rue Victoria Mont-Royal 2305, chemin Rockland Mont-Royal 2375, rue Lucerne Nanaimo 6631 Island Highway N and land Newmarket 17600 Yonge Street and land North York 1800 Sheppard Avenue E Oakville 240 Leighland Avenue Oshawa 419 King Street W Ottawa 100 Bayshore Drive and land Québec 440, rue Bouvier Repentigny 100, boulevard Brien Repentigny 175, rue Notre-Dame Richmond 1400, 6551 No. 3 Road Rimouski 419, boulevard Jessop Rivière-du-Loup 298, boulevard Armand Thériault and land Rosemère 201-257, boulevard Curé-Labelle Sainte-Foy 2450 and 2700, boulevard Laurier and land Saint-Léonard Land – 4325 and 4505, rue Jean-Talon Est Saint-Léonard Land – Jean-Talon and Provencher Saint-Albert 300 36th Street NE Sainte-Agathe Land – chemin Palomino Saint-Georges- 8585, boulevard Lacroix de-Beauce Saint-Hubert 5025, rue Cousineau Saint-John's 430 Topsail Road Surrey 2695 Guildford Town Centre Thetford Mines 805, boulevard Smith Nord Thornhill 800 Steel West Avenue Toronto 65 Skyway Avenue Trois-Rivières 4125, boulevard des Forges Vancouver 650 West 41st Avenue Vaughan 1 Bass Tro Mills Drive Vaughan Land - Rutherford Road Victoria 221 / 3147 Douglas Street Waterloo 550 King Street N and land Windsor 3100 Howard Avenue and land Windsor 7654 Tecumseh Boulevard E and land Winnipeg 1555 Regent Avenue W
CADIM
IVANHOE CAMBRIDGE

STATEMENT OF REAL ESTATE HOLDINGS as at December 31, 2005
189
Location Land and buildings
10 Location Land and buildings Location Land and buildings
Foreign Investments – United States
Gainesville 6419 Newberry Road Miami 950 South Miami Omaha 10000 California Street San Jose 2200 Tully Road
Foreign Investments – Other Berlin (Germany) Wilmersdorfer Stabe Leipzig (Germany) 04329 Leipzig Paunsdorf Allee Paunsdorf Centre Zwickau (Germany) 08056 Zwicau Innere Plauensche Strabe Glasgow (Scotland) 55 St. Enoch Square Madrid (Spain) Serrano, 60 280 486 Lot 5.4 Bagnoland /Corbeil 28 Général de Gaule & Route Villoison (France) Marne La Vallée 1, rue Charlie Chaplin (France) Poissy (France) Land Psieurs V (France) Lands Toulouse (France) Land Cracovie (Poland) Zakopianska 62 UI. Gliwice (Poland) Land Katowice (Poland) Rozdzienskiego 200 UI. Varsovie (Poland) Bohaterow Warszawi 42 Al. Varsovie (Poland) Jana Pawla li 82 Al. Varsovie (Poland) Targowa 72 UI. Varsovie (Poland) 124 Gorczewska Street Wroclaw (Poland) Hallera 52 Al.
Burlington 1100 Burloak Street Burlington 5575 North Service Road Calgary 211 11th Avenue SW Calgary 1726 14th Avenue NW Calgary Land – 11th/12th Avenue SW and 1st/2nd Street SW Calgary Land – 114th Avenue SE Calgary Land – 7, 8 48th Street SE Laval Land - Paroisse Ste-Rose Milton Land - Steeles Ave & Esquesing Line Mississauga 2600, 2630 and 2680 Skymark Avenue Montréal 1981 and 2001, avenue McGill College Montréal 1000, Place Jean-Paul-Riopelle Montréal 1 to 5, Place Ville-Marie Montréal 1000, rue de La Gauchandière Montréal 1155, rue Mandcalfe Montréal 249, 415 and 455,rue St-Antoine Ouest Montréal 500, rue Sherbrooke Ouest Montréal 747, square Victoria Montréal Land – 901, square Victoria North York 4101, 5150 and 5160 Yonge Street North York 90 Sheppard Avenue East North York 10, 16, 20 and 36 York Mills Québec 505, boulevard du Parc Technologique Québec 700, boulevard René-Lévesque Est Québec 801, chemin St-Louis Québec 65, rue Ste-Anne Québec Land - boulevard L'Ormière Richmond 13511, 13551, 13571, 13575, 13775, 13777 and 13800 Commerce Parkway Richmond 13700 and 13711 International Place Rimouski 80, 84 and 114, rue St-Germain Sainte-Foy 1000 and 1020, route de L`Église Saint-Léonard 6801, boulevard des Grandes-Prairies Toronto 3381 and 3389 Steeles Avenue Toronto 55 University Avenue Toronto 3900 and 4000 Victoria Park and land Vancouver 505, 555, 580 and 595 Burrard Street Vancouver 1055 Dunsmuir Street Vancouver 1075 West Georgia Street Vancouver 1040 West Pender Street Vancouver 540 Thurlow Street
Foreign Investments – United States
Amarillo 600 South Tyler Street Bellevue 320 108th Avenue NE Bellevue 355 110th Avenue NE Bellevue 3617, 3650 and 3655 131st Avenue SE
Bellevue 3605 and 3625 132nd Avenue SE Bellevue 10885 4th Street NE Bellevue 12920 38th Street SE Boston 201 Washington Street Denver 4300 and 4500 Cherry Creek South Dr. Farmer's Branch 4100 Alpha Street Farmer's Branch 4141 Blue Lake Street Farmer's Branch 4000 N., 4000 S., 4001, 4020, 4040, 4099, 4100 and 4101 McEwen Street Farmer's Branch 13456 Midway Street Houston 1001 McKenney Street New York 1250 and 1515 Broadway Street New York 450 Lexington Avenue New York 340 Madison Street New York 498 7th Avenue Redmond 18200, 18300, 18400, 18500, 18600 and 18700 NE Union Hill Road Seattle 1420 5th Avenue Tampa 100 South Ashley Drive Washington D.C. 1501 K Street Foreign Investments – Other
Francfort 72 and 74 Theodor-Heuss-Allee (Germany) Londres 35 Basinghall Street (England) Londres 1 Coleman Street (England) Londres 12 Plumtree Court (England) Londres 1 Ropemaker Street (England) Courbevoie Boulevard Mission Marchand (France)
SITQ

190
STATEMENT OF PROPERTIES HELD FOR RESALE as at December 31, 2005
Location Address
Chicoutimi 475, boulevard Talbot Gaspé 142, boulevard Gaspé Rimouski 70, rue Saint-Germain Est
The above-mentioned properties are held by the Caisse or the following subsidiary: Placements P.H.C.inc.
11

I I I . Code of Ethics Conduct for Di rectors


Code of Ethics and Conduct
for Directors

FOREWORD 1
1. DEFINITIONS 2
2. GENERAL PROVISIONS 4
2.1. Purpose 42.2. Scope of application 42.3. Adoption, revision and interpretation 42.4. Confidentiality of information provided by directors 4
3. PRINCIPLES OF ETHICS 5
3.1. Mission, values and general management principles 53.2. Loyalty, honesty and integrity 53.3. Competence, caution, due diligence and effectiveness 53.4. Professional relationships 5
4. CODE OF CONDUCT 6
4.1. Use of goods and personal activities 64.2. Benefits and gifts 64.3. Director's independence 64.4. Continuation of obligations following cessation of duties 64.5. Confidentiality 74.6. Conflict of interest 74.7. Handling of personal affairs 84.8. Loan contract 84.9. Providing of consulting and other services 84.10. Disclosure obligation 84.11. Non-participation in discussions 94.12. Share trading 9
5. APPLICATION 10
5.1. Compliance 105.2. Committee's role 105.3. Secretary's role 105.4. Reporting a violation 115.5. Declarations 11
6. DISCIPLINARY PROCESS 12
7. APPENDIXES 13
A- Declaration of interestsB- Declaration of non-participation in discussionsC- Declaration of adherence to the CodeD- Declaration concerning a blind trustE- Declaration, Loan / EmploymentF- Procedure with respect to deliberations regarding conflicts of interestG- Directive to directors regarding personal securities transactions
2005.12.16
Code of E th i c s and Conduc t fo r D i rec tors

12005.12.16
Code of E th i c s and Conduc t fo r D i rec tors
FOREWORD
The mission of the Caisse de dépôt et placement du Québec is to accept fund deposits in accordance withthe law, manage these deposits and seek the optimal return on depositors’ capital, respecting their investmentpolicies while contributing to Quebec's economic development.
In carrying out its mission and guided by its basic values – excellence, boldness, ethics and transparency –the Caisse de dépôt et placement du Québec strives to be a source of collective pride and to earn the enduringconfidence of citizens and the respect of its institutional peers.
The affairs of the Caisse de dépôt et placement du Québec are administered by a board of directors whosemembers are appointed by the Quebec government.
The board members wish to adopt rules of ethics and a code of conduct that respect the principles andrules established by the Act respecting the Caisse de dépôt et placement du Québec, the Quebec Civil Codeand the Act respecting the ethics and professional conduct of public office holders adopted under theterms of the Act respecting the Ministère du Conseil exécutif.
The board members are also dedicated to promoting integrity, objectivity and openness in the carrying outof the duties of a director. They seek to maintain their ability to act in the Caisse's best interests and toinspire complete confidence among depositors, partners, employees and the general public.
Accordingly, the members of the board of directors of the Caisse de dépôt et placement du Québec herebyadopt this Code of ethics and conduct.
1. DEFINITIONS
In this Code, unless the context indicates otherwise, the following definitions apply:
a) "director" means a member of the board of directors of the Caisse or of one of its wholly ownedsubsidiaries.
b) "Caisse" means the Caisse de dépôt et placement du Québec and all its wholly owned subsidiaries.
c) "committee" means the governance and ethics committee of the board of directors, as defined by law.
d) "conflict of interest" means any real, apparent or potential situation in which a director might be inclinedto show favour toward a particular person (including himself/herself and the people to whom he/she isrelated) to the detriment of another person. This definition also covers any situation liable to have an effectwith respect to loyalty, integrity or judgment.
e) "board" means the board of directors of the Caisse or of one of its wholly owned subsidiaries.
f) "wholly owned subsidiary" means an entity in which the Caisse either directly or indirectly holds all of thecommon shares.
g) "confidential information" means all information concerning the Caisse, all information of a strategicnature and all information regarding trends within an industry or a sector which is not public knowledgeand which, if it were known by a person other than a director, would likely give the person in question anadvantage or to compromise the carrying out of an activity in which the Caisse is involved.
This term also includes all information relating to investments or to entities, companies and investmentfunds in which the Caisse holds or is considering holding an interest.
h) "privileged information" means any information not yet publicly known and liable to affect the decisionof a reasonable investor or to have a significant influence on the value or stock price of a company thathas gone public, including any information concerning one of the following events: a capital issue, a changeto the dividend policy, a major change in the ownership of securities that could have an effect on thecontrol of the company, or a major change regarding business or clients. All privileged information isconsidered confidential.
i) "Act" means the Act respecting the Caisse de dépôt et placement du Québec (R.S.Q., c. C-2).
j) "person" means any person or firm, depending upon the particular context with respect to this Code.
k) "related persons" are persons related to a director, any persons covered by Section 40 of the Act,specifically those related by:
(i) blood relationship;
(ii) marriage;
(iii) civil union;
(iv) de facto union;
(v) adoption;
2 2005.12.16
Code of E th i c s and Conduc t fo r D i rec tors
32005.12.16
Code of E th i c s and Conduc t fo r D i rec tors
For the purposes of this Code, the following persons are also considered related:
(vi) The child of a person identified in paragraphs (ii) to (iv);
(vii) A member of his or her immediate family living under the same roof;
(viii) A person with whom a director is a business partner or the corporation of persons in which he/sheis a partner;
(ix) A firm in which the director, either directly or indirectly, holds 10% or more of one category ofvoting shares;
(x) A firm controlled by the director or by an individual identified in paragraphs (i) to (iv) and (vi) or bythe two acting together;
(xi) A firm in which he/she is a director or manager, with the exception of the firm from which the Caisse may receive deposits under the terms of the Act and a firm in which he/she is a director designated by the Caisse;
(xii) A trust or succession regarding which the director has a material right over the nature of a beneficiary’srights in which the administrator performs the role of trustee or succession liquidator or carries out related duties;
(xiii) Any person whom a director might be inclined to show favour toward owing to his/her relationshipwith this person or with a third party, his/her status, his/her title, etc.
l) "chairperson" means the chairperson of the Caisse's board of directors.
m) "president and chief executive officer" means the president and chief executive officer of the Caisse.
n) "regulation" means Regulation respecting the ethics and professional conduct of public office holders,enacted by sections 3.01 and 3.02 of the Act respecting the Ministère du Conseil exécutif (R.S.Q.,c. M-30).
o) "internal management regulation" means the Regulation respecting the internal management of theCaisse de dépôt et placement du Québec.
p) "secretary" means the Caisse secretary.
q) "security" means all securities identified under the Securities Act (R.S.Q., c V-1.1), more specifically,stocks, bonds, application rights and stock warrants and options, a term contract or other derivativeproducts. For the purposes of this Code, also considered a security is any existing, potential orconditional financial instrument or one which may be converted into a security or which conveys theright to acquire same.
However, Treasury Bills or money market instruments, government bonds (federal, and provincial) securityindexes and market index derivatives, Units in any mutual fund and segregated fund, shares or unitsin workers’ funds, deposit certificates, municipal and public utility bonds, securities purchased under adivided re-investment plan, are excluded from this definition.
r) "transaction" is any purchase, sale, transfer, settlement of a security or other acquisition, transfer of anykind or any attempt to perform one of these operations.

4 2005.12.16
Code of E th i c s and Conduc t fo r D i rec tors
2. GENERAL PROVISIONS
2.1. Purpose
2.1.1. The purpose of this Code is to maintain and strengthen citizens' trust in the integrityand impartiality of the Caisse's administration, to foster transparency within the Caisseand to promote accountability among its directors.
2.2. Scope of application
2.2.1.This Code applies to the Caisse's directors and to directors of its wholly owned subsidiaries. It also applies to directors of the Caisse or of one of its wholly owned subsidiaries who, at its request, exercise the duties of director of another organization or company or are members of same. Full-time directors are also subject to the code of ethics and conductapplicable to managers and employees.
In addition to the principles and rules stipulated in this Code, the directors must abide by the Regulation.
2.3. Adoption, revision and interpretation
2.3.1. This Code is applied in accordance with the Act, the Internal Management Regulation, and the Regulation. It reflects and, if applicable, completes, these provisions.
2.3.2. The board approves this Code on the recommendation of the committee, which is responsible for its revision.
2.3.3. The director is bound, in the course of his or her duties, to respect the principles of ethics and the rules of conduct stipulated by law and by this Code. In the case of a discrepancy, the most stringent of these principles and rules shall apply.
In the case of doubt, the director must comply with the spirit of these principles and rules.
2.3.4. In the context of this Code, the prohibition of an action also applies to any attempt to carry out the action, any participation in the action or any encouragement given with respect to carrying out the action.
2.4. Confidentiality of information provided by directors
2.4.1. The Caisse shall take the necessary measures to ensure the confidentiality of information provided by directors with respect to the application of this Code.
52005.12.16
Code of E th i c s and Conduc t fo r D i rec tors
3. PRINCIPLES OF ETHICS
3.1. Mission, values and general management principles
3.1.1. Under the terms of his/her mandate, the director shall participate in the carrying out of the Caisse's mission and, in this respect, undertakes to promote the following organizational values and management principles:
(i) Promote an active management of the Caisse’s portfolio while minimizing overall risk;
(ii) Rely on the competence of Caisse personnel;
(iii) Encourage boldness and the pursuit of excellence;
(iv) Oversee the security of capital assets;
(v) Foster professional behaviour that demonstrates integrity under all circumstances;
(vi) Promote transparency and the respect for high principles of ethics.
3.2. Loyalty, honesty and integrity
3.2.1. For the duration of his/her term, the director must demonstrate loyalty, honesty and integrityin his/her actions.
The director must make decisions independent of any consideration that is incompatible with the interests of the Caisse, especially any political partisan consideration.
3.3. Competence, caution, due diligence and effectiveness
3.3.1. In carrying out his/her duties, the director must demonstrate caution, efficiency and due diligence. He/she must maintain his/her knowledge and exercise independent professional judgment in the Caisse's best interests.
The director is responsible for taking cognizance of, promoting respect for and conforming to this Code, the applicable laws and regulations, and the policies, guidelines and rules establishedby the Caisse. He/she must also remain abreast of the economic, social and political contexts within which the Caisse conducts its activities.
3.4. Professional relationships
3.4.1. The director must maintain, with regard to all persons and the Caisse itself, relationships based on respect, cooperation and professionalism.

4. CODE OF CONDUCT
4.1. Use of goods and personal activities
4.1.1. The director must not confuse the Caisse's goods with his/her own and may not use themto benefit himself/herself or a third party.
4.1.2. A director must not, under any circumstances, associate the Caisse, either directly orindirectly, with any personal commitment related to political activities.
4.2. Benefits and gifts
4.2.1. The director may not, either directly or indirectly, offer, solicit, or accept a favour or benefit for himself/herself, a person to whom he/she is related or a third party.
The director may not accept any gifts, sign of hospitality or benefits other than those of modest value. Any other gifts, sign of hospitality or benefits received must be returned to the giver or to the Crown.
4.3. Director's independence
4.3.1. To be considered independent, a director must specifically not:
(i) Be or have been, during the three years preceding his or her appointment, employed by theCaisse or related to a person identified in Section 1 k) (i) to (v) who holds such a position;
(ii) Be employed by the government, or by a government agency or company within the meaning of sections 4 and 5 of the Auditor General Act (R.S.Q., c. V-5.01);
(iii) Have relationships of the type discussed in Section 5.5 of the Act.
Upon taking up his/her duties and subsequently on an annual basis, the director must declareto the Committee the existence or non-existence of relationships of the type identified in theaforementioned paragraphs (i) and (ii). He/she must also report, upon becoming aware of thefact, any change with respect to the aforementioned declaration.
4.4. Continuation of obligations following cessation of duties
4.4.1. A director remains obliged to demonstrate loyalty and integrity even after he/she ceasesto perform duties for the Caisse.
A director who ceases to perform his/her duties must behave in such a manner as to notderive any advantage with respect to his/her previous duties. He/she must not divulgeconfidential information obtained in the course of his/her duties nor give anyone advice basedon information not available to the public concerning the Caisse or any other organization orcompany with which he/she has had a significant relationship during the year following theend of his/her mandate.
6 2005.12.16
Code of E th i c s and Conduc t fo r D i rec tors
72005.12.16
Code of E th i c s and Conduc t fo r D i rec tors
4.4.2. During the year following cessation of his/her duties, the director shall not act on behalf of or for anyone with regard to a procedure, negotiation or any other operation in which the Caisse is a party and regarding which he/she has information not available to the public.
4.5. Confidentiality
4.5.1. Protection of confidential information
a) A director is required to exercise discretion with regard to everything of which he/she became aware in the course of his/her duties and is obliged, at all times, to respect the confidentiality of the information received in this manner. Furthermore, the board's deliberations, the positions defended by its members and the votes these persons cast are confidential.
4.5.2. Restrictions and protective measures
a) A director is to convey confidential information only to those persons authorized to be in possession of it. Furthermore, this information must not be used for the personal benefit of the director or that of other persons or that of an interest group.
b) Only the Caisse’s President and CEO is its spokesperson.
c) A director who uses the electronic mail system must comply with all practices stipulated or approved by the Caisse with regard to the storage, use and transmission of information using this means. He/she must not use this means to send any confidential information received from the Caisse to any person whatsoever.
d) A director is responsible for taking measures to protect the confidentiality of the informationto which he/she has access. These measures include but are not limited to:
(i) Not leaving documents containing confidential information in view of third parties or employees whom this information does not concern;
(ii) Taking appropriate measures to ensure the physical protection of documents;
(iii) Avoiding discussions in a public place that might result in the divulging of confidential information;
(iv) Indicating on documents intended for circulation that they contain confidential informationto be handled accordingly;
(v) Using appropriate means (shredding, archiving, etc.), to dispose of any confidential document when it is no longer needed in the course of his/her director's duties.
4.6. Conflict of interest
4.6.1. Incompatible interests
a) A director must avoid placing himself/herself in a conflict between his/her personalinterests and the obligations that his/her duties involve. The director must avoid being in a situation that leaves reasonable doubt as to his/her capacity to carry out his/her duties demonstrating loyalty and impartiality.

b) A director must avoid being in a situation in which he/she or a person to whom he/she is related might, either directly or indirectly, derive benefit from a transaction or contract involving the Caisse or from his/her influence in terms of decision-making powersarising from his/her duties at the Caisse.
c) A director who assumes obligations with respect to other entities might, on occasion, find himself/herself in a conflict of interest situation. Where this Code does not contemplate the situation in question, the director must determine if his/her conduct is in line with the behaviour that the Caisse could reasonably expect from a director under suchcircumstances. He/she must also decide whether a reasonably well-informed person would conclude that the interest he/she holds in another entity risks influencing his/her decisions and impairing his/her objectivity and impartiality in the carrying out of his/her duties at the Caisse.
4.7. Handling of personal affairs
4.7.1. Within a reasonable period of time after taking up his/her duties, a director must organize his/her personal affairs so that these do not impede the carrying out of his/her duties and in such a way as to avoid incompatible interests or conflicts of interest between his/her personalinterests and the obligations that his/her duties involve. He/she must, as need be, take all necessary measures to conform to the provisions of this Code.
4.8. Loan contract
4.8.1. The Caisse may not grant a loan to a board member, his/her spouse or his/her child. Accordingly, the director must declare to the committee, upon taking up his/her duties and subsequently on an annual basis, that no such loan has been made.
4.9. Providing of consulting and other services
4.9.1. A director must not offer consulting or other services to the Caisse either personally or through another entity in which he/she or someone he/she is related to holds a major interest.
4.10. Disclosure obligation
4.10.1. Every director must, upon taking up his/her duties and subsequently on an annual basis, send the committee a list of interests he/she holds in any legal persons, as well as the list of such interests held by his/her spouse, together with a statement of all transactions which have changed such lists during the year.
4.10.2. As soon as a director becomes aware that any interest, direct or indirect, that he or she has in a legal person that could place the director in a conflict of interest situation, the director must advise the Caisse thereof.
8 2005.12.16
Code of E th i c s and Conduc t fo r D i rec tors

92005.12.16
Code of E th i c s and Conduc t fo r D i rec tors
4.11. Non-participation in discussions
4.11.1. A director who is in a conflict of interest situation must advise the Chairperson or the Secretary and, if applicable, must abstain from participating in any discussions or decisions involving the firm in which he/she holds an interest. Furthermore, he/she must verballydeclare this situation at any meeting dealing with a matter relating to this interest so that this declaration and his/her withdrawal from the meeting are duly noted in the minutes of the meeting.
4.11.2. A director can inform the Caisse in advance of the identity of the companies or other entities in respect of which he/she wishes to withdraw from Board or Committee discussions concerning their activities.
4.11.3. In all cases where a matter involves a possible conflict of interest relating to a director's position or the director as an individual, the secretary shall apply the declaration of conflict of interest procedure set forth in Appendix F of this Code.
4.12. Share trading
4.12.1. A director having had access to privileged information concerning shares shall not conduct any share trading.
Nor may any director use confidential information to his/her personal benefit or the benefitof someone related to him/her or that of a third party, including persons performingtransactions for him/her or upon his/her advice or instructions.
4.12.2. A director or a person whose investment decisions he/she influences, oversees or controls may not carry out any transaction involving securities that appear on the "List of Restricted Transactions", which names the securities regarding which the Caisse is an insider or holds privileged information, or securities concerning which an embargo has been imposedfor so long as this embargo remains in effect.
4.12.3. A director must comply with guidelines for directors concerning securities transactions of a personal nature, as discussed in Appendix G of this Code, before conducting any suchtransaction.
4.12.4. A director is deemed to be an insider with respect to security issuers in those instances where the Caisse itself is an insider.
4.12.5. Clauses 4.12.1 à 4.12.4 do not apply to transactions effected by a Blind Trust pursuant to which, the director who has constituted the trust is never informed of the transactionseffected or of the composition of the trust’s porfolio.

5. APPLICATION
5.1. Compliance
5.1.1. This Code comprises part of the director’s professional obligations. He/she undertakes to take cognizance of it and to abide by it and any other specific guidelines or instructions that might be provided with regard to its application. In addition, he/she must, on an annual basis, confirm his/her adherence to the code.
In the case of doubt regarding the scope or application of a clause, it is the director’s responsibility to consult the committee.
5.2. Committee's role
5.2.1. The committee shall oversee the development and application of this Code. It shall interpret the clauses therein and ensure that the principles of ethics and rules of conduct are respected.
The committee may, according to the conditions it determines, relieve a director of one or more obligations stipulated in this Code if in its view this release does not violate the purpose of the code, as stipulated in Section 2.1.1. and that the provisions of the Act and the Regulations are complied with.
The committee has appointed the secretary to support it in this initiative.
5.2.2. The committee must:
i) Revise this Code and submit any amendments for approval by the board;
ii) Ensure that directors are trained and informed with regard to the contents and terms of application of this Code;
iii) Provide advice and support to the board and to any director faced with a problem;
iv) Respond to any request for information concerning this Code;
v) Conduct an investigation on its own initiative or upon receiving allegations of irregularities with respect to the code.
5.2.3. When the Committee has sufficient reason to believe that a director has not respected oneor more of the clauses in this Code, it shall immediately inform the chairperson and may impose one of the penalties stipulated in Section 6.1.4.
5.3. Secretary's role
5.3.1. The secretary shall assist the committee and the chairperson in their work with regard to the code's application.
5.3.2. The secretary shall keep archives in which he/she shall store, declarations, disclosures and attestations, which must be transmitted under the terms of this Code, as well as consultation reports, decisions and notices.
10 2005.12.16
Code of E th i c s and Conduc t fo r D i rec tors

112005.12.16
Code of E th i c s and Conduc t fo r D i rec tors
5.4. Reporting a violation
5.4.1. A director who is aware of or who suspects a code violation, including the irregular use or conveyance of confidential information or a non-disclosed conflict of interest, must report it to the committee.
This reporting must be done confidentially and must contain the following information:
(i) The identity of the author or authors of the violation;
(ii) The description of the violation;
(iii) The date or period when the violation took place;
(iv) A copy of any document supporting the reporting of the violation.
5.5. Declarations
5.5.1. The director shall provide the secretary with the following declarations during the 30 days following his/her appointment and during 90 days following December 31 of each year he/she continues to serve as a director:
(i) The declaration of his/her personal portfolio, including the securities held by him/her or his/her spouse, as stipulated in Section 4.10.1 and reproduced in Appendix A of this Code;
(ii) If applicable, a declaration of non-participation in discussions stipulated in Section 4.11.2and reproduced in Appendix B of this Code;
(iii) The declaration of adherence to the code stipulated in Section 5.1.1 and reproducedin Appendix C of this Code;
(iv) If applicable, the declaration concerning Blind Trust holdings, stipulated in Section 4.12.5and reproduced in Appendix D of this Code;
(v) The declaration that no loan exists between him/her, his/her spouse or his/her child and the Caisse, as stipulated in Section 4.8.1 and reproduced in Appendix E of this Code;
(vi) The declaration of the existence or non-existence of relationships, as stipulated in Section 4.3.1 and reproduced in Appendix E of this Code.
5.5.2. The director make the following declarations to the committee chairperson:
(i) A conflict of interest declaration, as stipulated in Section 4.11.1, in the event that such a conflict arises or ceases to exist;
(ii) At the request of the chairperson or the committee, a declaration that he/she is not in violation of this Code or, depending on the case, in violation of one of its specific clauses.
5.5.3. The declarations made to the Caisse under the terms of this section shall be treated confidentially. They shall be forwarded to the secretary, who shall store them in the Caisse's corporate records.

6. DISCIPLINARY PROCESS
6.1.1. Except for matters exclusive to the competent authority, as provided for in the Regulation, the committee shall have competent jurisdiction over disciplinary matters.
6.1.2. When the committee has sufficient reason to believe that a director has not complied with any obligation set forth in this Code, it may make the appropriate recommendation.
6.1.3. The committee shall inform the director of the alleged misconduct and the sanction that may be imposed.
The director may, over the course of the subsequent seven-day period, submit his/hercomments to the committee. He/she may also ask to be heard by the committee regardingthe matter.
6.1.4. If it is found that the director has violated the Act, the Regulation or this Code, the Committee shall recommend a penalty or depending on the case, inform the authority of competent jurisdiction stipulated in the Regulation.
The sanction provided for in section 6.1.3 may take the form of a reprimand, suspensionor dismissal. Any sanction against a director and the decision with regard to asking that he/shebe temporarily relieved of his/her duties shall be set forth in writing and substantiated.
12 2005.12.16
Code of E th i c s and Conduc t fo r D i rec tors

2005.12.16
Code of E th i c s and Conduc t fo r D i rec tors
APPENDIXES

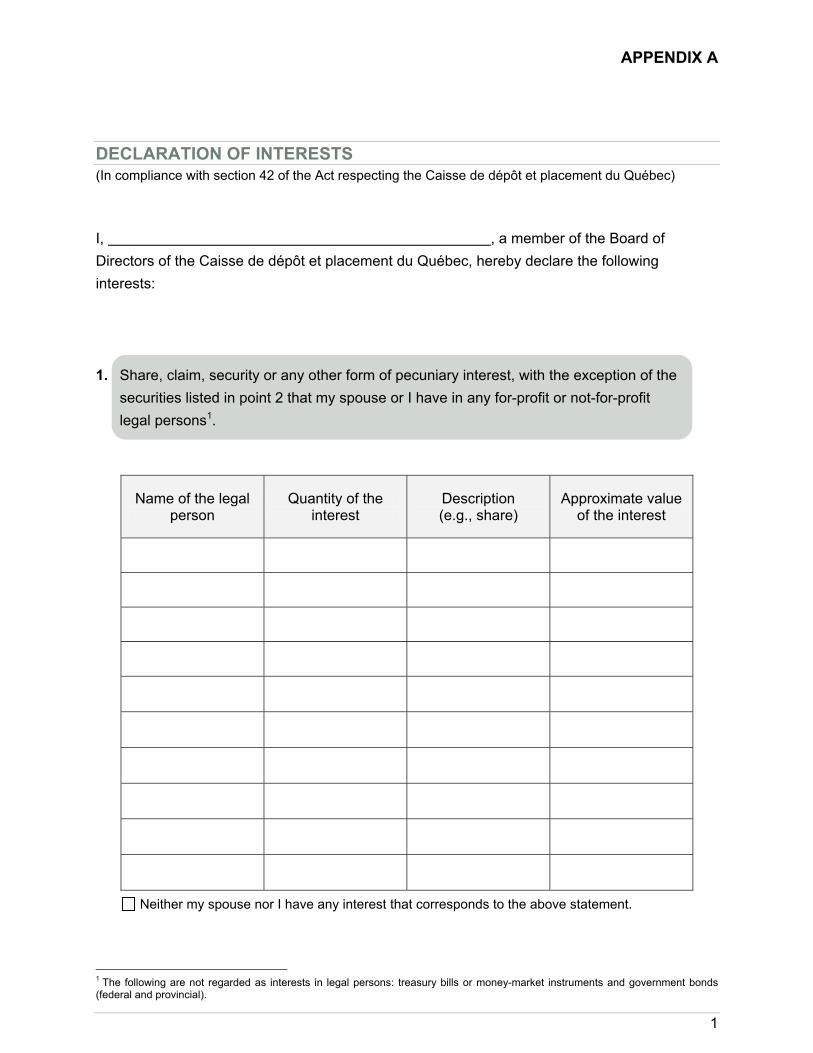
1
APPENDIX A
DECLARATION OF INTERESTS (In compliance with section 42 of the Act respecting the Caisse de dépôt et placement du Québec)
I, , a member of the Board of Directors of the Caisse de dépôt et placement du Québec, hereby declare the following interests:
1. Share, claim, security or any other form of pecuniary interest, with the exception of the securities listed in point 2 that my spouse or I have in any for-profit or not-for-profit legal persons1.
Name of the legal person
Quantity of the interest
Description (e.g., share)
Approximate value of the interest
Neither my spouse nor I have any interest that corresponds to the above statement.
1 The following are not regarded as interests in legal persons: treasury bills or money-market instruments and government bonds (federal and provincial).
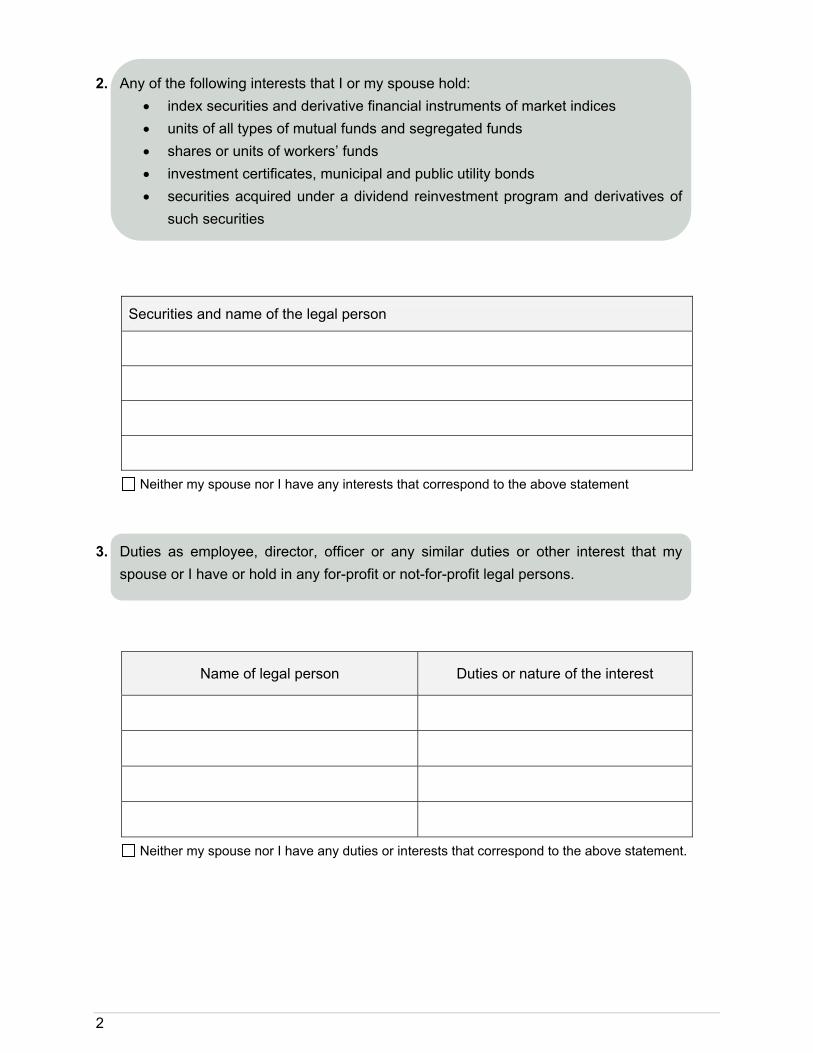
2
2. Any of the following interests that I or my spouse hold:
• index securities and derivative financial instruments of market indices • units of all types of mutual funds and segregated funds • shares or units of workers’ funds • investment certificates, municipal and public utility bonds • securities acquired under a dividend reinvestment program and derivatives of
such securities
Securities and name of the legal person
Neither my spouse nor I have any interests that correspond to the above statement
3. Duties as employee, director, officer or any similar duties or other interest that my
spouse or I have or hold in any for-profit or not-for-profit legal persons.
Name of legal person Duties or nature of the interest
Neither my spouse nor I have any duties or interests that correspond to the above statement.
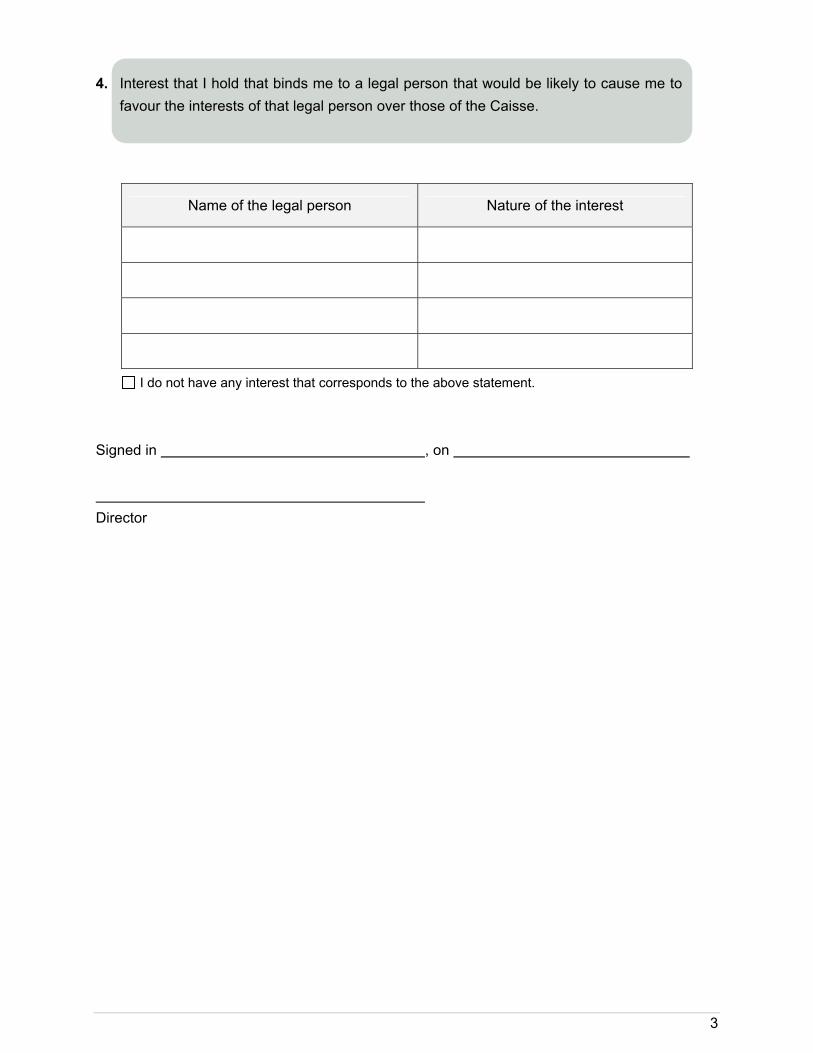
3
4. Interest that I hold that binds me to a legal person that would be likely to cause me to
favour the interests of that legal person over those of the Caisse.
Name of the legal person Nature of the interest
I do not have any interest that corresponds to the above statement.
Signed in , on Director

1
APPENDIX A
DECLARATION OF MODIFICATION OF INTERESTS (In compliance with section 42 of the Act respecting the Caisse de dépôt et placement du Québec) FILL IN THE FORM INDICATING THE CHANGES (ACQUISITION OR DISPOSITION OF SECURITIES, CESSATION OF DUTIES, ETC.) SINCE YOUR LAST DECLARATION OF INTERESTS.
I, , a member of the Board of Directors of the Caisse de dépôt et placement du Québec, hereby declare the following changes:
1. Transactions that have changed the pecuniary interests (share, claim, or any other form of pecuniary interest, with the exception of the securities listed in point 2 that my spouse or I have in any for-profit or not-for-profit legal persons 1.
IF YOU OR YOUR SPOUSE HAS ENGAGED IN MORE THAN ONE TRANSACTION PERTAINING TO THE SAME INTEREST, PLEASE PROVIDE US WITH A COMPLETE LIST.
Name of the legal person
Description (e.g., share)
Quantity of the interest in previous
declaration
Transactions conducted since then: sale (S) or
purchase (P), and quantity
Quantity of the interest as at the date of
this declaration
Value of the interest as at the date of
this declaration
Neither my spouse nor I have any changes to declare.
1 The following are not regarded as interests in legal persons: treasury bills or money-market instruments and government bonds (federal and provincial).

2
2. Changes pertaining to the interests that my spouse or I have in any of the following:
• index securities and derivative financial instruments of market indices • units of all types of mutual funds and segregated funds • shares or units of workers’ funds • investment certificates, municipal and public utility bonds • securities acquired under a dividend reinvestment program and derivatives of
such securities
Securities and name of the legal person
Interest fully withdrawn (W), retained (R),
newly purchased (P), purchased and fully
withdrawn in the year (PW)
Neither my spouse nor I have any changes to declare.

3
3. Addition of or retirement from duties as an employee, director, officer or other similar
duty that my spouse or I have in any for-profit or not-for-profit legal persons. Addition or withdrawal of any other interest that my spouse or I hold in any for-profit or not-for-profit legal persons.
Name of the legal person Duties or nature of the interest
Duties or interest withdrawn (W), retained
(R), newly added (A), added and withdrawn in
the year (AW)
Neither my spouse nor I have any changes to declare.

4
4. Addition or withdrawal of Interest that I hold, that binds me to a legal person that would
be likely to cause me to favour the interests of that legal person over those of the Caisse
Name of the legal person Nature of the interests
Interest withdrawn (W), retained (R), newly
added (A), added and withdrawn during the
year (AW)
I have no changes to declare.
Signed in , on Director

APPENDIX B
DECLARATION OF NON-PARTICIPATION IN DISCUSSIONS
I, , the undersigned, a member of the board of directors
of the Caisse de dépôt et placement du Québec, do not wish to attend board or committee
meetings at which discussions shall take place concerning one of the companies or entities
listed below:
Signed at , on
Director

APPENDIX C
DECLARATION OF ADHERENCE TO THE CODE
I, , the undersigned, a director of the Caisse de dépôt et
placement du Québec, declare that I have read the Code of Ethics and Conduct for Directors
adopted by the board of directors on December 16, 2005 and that I understand the meaning
and scope of the document.
I hereby declare that I am bound to the Caisse de dépôt et placement du Québec by each of
the provisions stipulated in the Code of Ethics and of Conduct for Directors and recognize that
this constitutes a contractual commitment on my part.
Signed at , on
Director
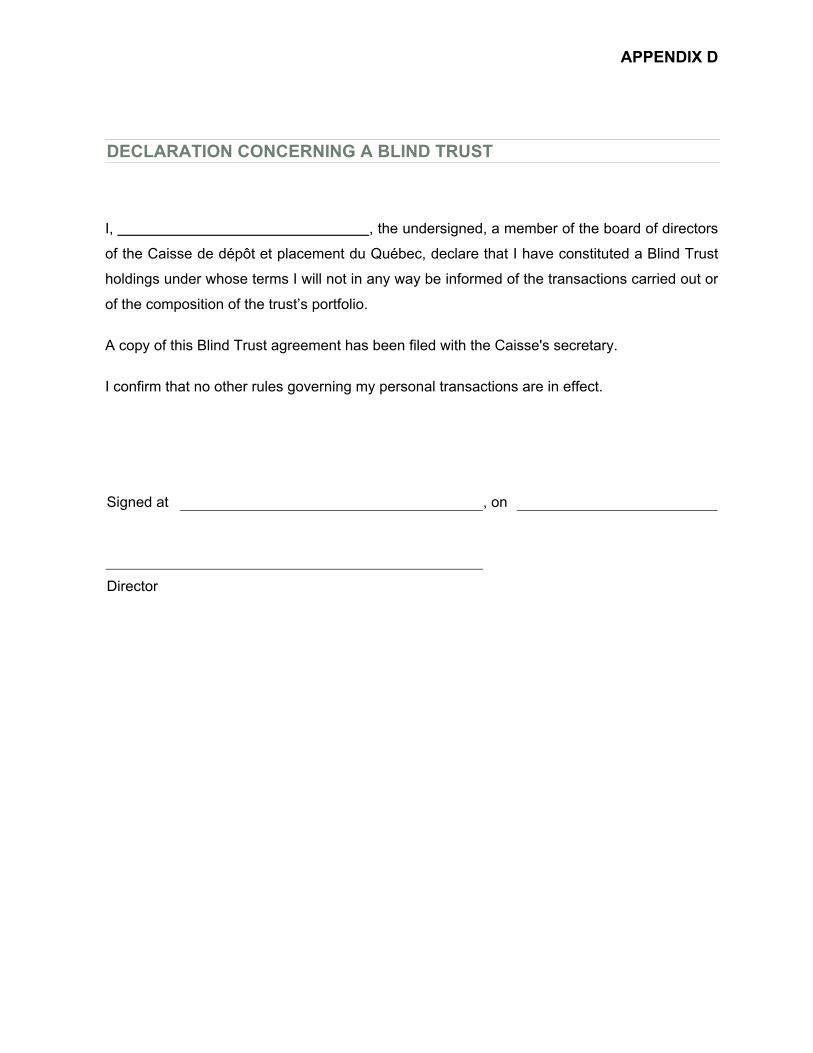
APPENDIX D
DECLARATION CONCERNING A BLIND TRUST
I, , the undersigned, a member of the board of directors
of the Caisse de dépôt et placement du Québec, declare that I have constituted a Blind Trust
holdings under whose terms I will not in any way be informed of the transactions carried out or
of the composition of the trust’s portfolio.
A copy of this Blind Trust agreement has been filed with the Caisse's secretary.
I confirm that no other rules governing my personal transactions are in effect.
Signed at , on
Director

APPENDIX E
DECLARATION
I, , the undersigned, a member of the board of
directors of the Caisse de dépôt et placement du Québec, declare as follows:
Loan (In accordance with Section 38 of the Act respecting the Caisse de dépôt et placement du Québec)
Neither I nor my spouse nor any of my children have/has a loan with the Caisse de
dépôt et placement du Québec
Employment (In accordance with Section 5.5 of the Act respecting the Caisse de dépôt et placement du Québec)
Please check the statement(s) that apply to your situation.
I am not employed by the Caisse de dépôt et placement du Québec nor was I employed by the Caisse during the three years preceding my appointment as director.
I have read Sections 4 and 5 of the Auditor-General Act and declare that I am not employed by the government or by a government agency or corporation within the meaning of these sections.
Neither my spouse nor my children are employed by the Caisse de dépôt et placement du Québec.
I am employed by a company that deposits funds into the Caisse de dépôt et placement du Québec.
Signed at , on
Director
APPENDIX F
PROCEDURE WITH RESPECT TO DELIBERATIONS REGARDING CONFLICTS OF INTEREST
To protect the Caisse and board members from potential conflict of interest situations, the Caisse's secretary follows these procedures:
1. When an item on the agenda of a Board meeting may cause a conflict of interest relating to a Caisse director's position or the director as a person, the secretary shall:
a) Send a note to this effect or verbally advise the director in question;
b) Refrain from sending the director in question documents relating to this matter and make a note to this effect in his/her file;
c) Record in the minutes of the meeting that this Board member withdrew from the meeting or abstained from taking part in the discussion or in a possible vote owing to his/her conflict of interest;
d) Remove mention of this in the minutes of the meeting sent to the director in question.
2. At any time or when an item entered on the agenda for a Board meeting gives rise to a conflict of interest or the appearance of a conflict of interest with regard to a director, this person must notify the secretary, who shall apply the above-mentioned provisions each time this item is included in a meeting's agenda.
3. When a matter is raised at a meeting, if a Board member might have personal, family or business ties in this regard, he/she must disclose this fact. The secretary shall record this in the minutes of the meeting, as well as the Board member's withdrawing from the meeting or his/her abstaining from taking part in the discussion and possible vote.
4. Should a disagreement arise regarding the need to take the measures stipulated in this document, a Board member may discuss this matter with the chairman or with the Board.
1
APPENDIX G
DIRECTIVE TO DIRECTORS REGARDING PERSONAL SECURITIES TRANSACTIONS
Introduction Section 4.12 of the Code of Ethics and Conduct for Directors of the Caisse sets forth the rules respecting securities transactions with which directors must comply. This directive completes the Code.
Directors must have all their personal securities transactions preauthorized with the Caisse’s Policies and Compliance Division, which is responsible for implementing and applying the pre-authorization process.
Securities governed by the pre-authorization process Subject to the exceptions listed below, a director who wishes to trade any security on the following list must comply with the pre-authorization process:
securities listed on Canadian exchanges;
unlisted securities, except for unlisted securities of companies in respect of which the director is certain that the Caisse has no interest therein;
derivatives of securities listed on Canadian exchanges;
corporate bonds;
securities issued by income trusts.
Exception Transactions respecting the following securities are not subject to the pre-authorization process:
securities listed on foreign exchanges;
Treasury Bills or money market instruments including currency and derivatives of such securities;
deposit certificates;
bonds issued or guaranteed by a government, municipal body, public utilities corporation, and derivatives of such securities;
index securities and market index derivatives;
units of any type of mutual or segregated fund;
shares or units in a worker’s fund;
securities purchased under a dividend reinvestment plan.
Minimum security-holding period Directors must hold the securities subject to the pre-authorization process for at least 30 calendar days.
2
Prohibited transactions In connection with the pre-authorization process, no transaction concerning the following securities is permissible:
a security on the list of restricted securities transactions, which list is kept up-to-date by the Caisse;
a security on the list of companies in respect of which the Caisse is an insider;
securities in respect of which the Caisse has had access to confidential or privileged information;
unlisted securities held in a portfolio managed by the Caisse;
securities identified by the Policies and Compliance Division, in respect of which the Caisse has traded within the last five (5) days or in respect of which it is considering trading in the next five (5) days;
securities issued by a corporation under an IPO, where the Caisse is participating therein or in the Caisse has invested in the company, excluding securities in a Stock Savings Plan (SSP).
Pre-authorization process: steps 1- The director must contact the Policies and Compliance Division on (514) 847-2361 or by e-
mail at [email protected].
2- The Policies and Compliance Division will enter the request for pre-authorization in the computerized personal transactions management system when the director makes the request. A reply will automatically be generated by the system once the transaction is entered or, in certain special cases, within a short period. The answer is given to the director.
3- The Policies and Compliance Division keeps a written record of all requests for pre-authorization submitted to it, including the following information:
a) the name of the director;
b) the date and time of the communication;
c) the name of the security issuer;
d) the name of the staff member who took the communication.
Duration of validity of the authorization Authorization for a transaction is valid until the end of the day on which the request for authorization is submitted.

IV. Code of Ethics and Professional Conduct for Officers and Employees


Code of Ethics
and Professional Conduct
for Officers and Employees

2006.02.24
Code of Ethics and Professional Conduct for Officers and Employees
1. PREAMBLE 1
2. PURPOSE OF THE CODE 2
3. STATUS OF THE CODE AND REVIEW PROCESS 3
4. SCOPE OF APPLICATION 3
5. TERM OF APPLICATION 3
6. DEFINITIONS 4
7. RULES 6
A- Act with loyalty, honesty and integrity 6i. Competence and diligence 6ii. Integrity of accounting records 6iii. Integrity of transactions 6iv. Obligations of loyalty and integrity following cessation of employment at the Caisse 6
B- Comply with applicable laws, regulations and policies 7i. Compliance with laws, regulations and policies 7ii. Fraudulent activities or transactions 7
C- Treat others with respect 7i. Relations with colleagues 7ii. Relations with clients, partners and suppliers 7iii. Relations with the community 7
D- Protect the confidentiality of information 8i. Basic principle 8ii. Scope of application 8iii. Protection of confidential information 8iv. Measures for protecting confidential information 9v. Contact with the media and disclosure of information 9vi. Personal investments and planned employment 9vii. Discussions with a business partner or client 10
E- Avoid conflicts of interest 11i. General principles 11ii. Gifts, entertainment activities, donations, services or benefits 12iii. Board memberships 13
2006.02.24
Code of Ethics and Professional Conduct for Officers and Employees
F- Comply with the rules governing personal transactions 14i. Persons covered 14ii. Basic principles 14iii. Prohibited transactions 14iv. Securities subject to the pre-authorization process 15v. Pre-authorization process for personal transactions 16vi. Minimum security-holding period 16vii. Declaration of personal transactions 17viii. Discretionary management agreement 17ix. Blind trust agreement 17x. Statements and declarations required upon being hired and annually thereafter 17xi. Compliance 18xii. Reporting 18
G- Use resources appropriately 18i. Use of Caisse resources 18ii. Protection of computerized information and use of computer resources 18iii. Inventions in connection with duties at the Caisse 19
H- Demonstrate reserve in outside activities 19i. Respect for the institution 19ii. Media relations 19iii. Priority accorded to outside duties and activities 19iv. Political activities 20
I- Report any non-compliant situation 20
J- Compliance with this code 20
8. APPLICATION OF THE CODE 21
A- Competent authorities 21
B- Employee responsibilities 21
C- Governance and Ethics Committee 22
D- Board of Directors 22
9. SANCTIONS 23
10. REQUESTS FOR INFORMATION 23
11. APPENDIXES 24
A- Declaration regarding compliance with the Code of Ethics and Professional Conduct
B- Annual statement regarding compliance with the Code of Ethics and Professional Conduct
C- Annual portfolio declaration as at December 31
D- Declaration regarding gifts, donations, services or benefits

12006.02.24
Code of Ethics and Professional Conduct for Officers and Employees
1. PREAMBLE
The Caisse de dépôt et placement du Québec has always regarded it as essential to maintain the highest standardsof conduct and practices for its executive officers and personnel, as well as for persons performing such dutiesat its subsidiaries. In this regard, the Caisse considers it important to codify rules relating to professional ethicsand conduct, over and above applicable legislative and contractual provisions, which rules must be observedby anyone acting for and on behalf of the institution.
It must be noted that the Code of Ethics and Professional Conduct for Officers and Employees (“code”) supplementsthe laws, rules and policies governing the Caisse and its activities, and is in no way intended as a replacementfor provisions that are in effect and otherwise mandatory. However, given the role and mission of the Caissewe must strive to exceed legislative minimums.
This code states the various standards, rules and principles that must guide the executive officers and personnel ofthe Caisse and its subsidiaries in situations that call for ethical and responsible conduct. The code reflects theinstitution's values of excellence, innovation, ethics and transparency.
The code, the related policies and guidelines obviously cannot deal with every possible situation thatemployees might encounter. Hence, they must at all times act with prudence and exercise good judgement.Further information regarding the code or its application may be obtained from the Senior Vice-President,Policies and Compliance by dialing 514 847-5901.

2 2006.02.24
Code of Ethics and Professional Conduct for Officers and Employees
2. PURPOSE OF THE CODE
The purpose behind this code is to maintain the Caisse's reputation for integrity, honesty and professionalism byestablishing rules of conduct applicable to confidentiality of information, conflicts of interest and professional ethics.
The goal of the code is to ensure the confidence of its depositors and the general public alike and to maintaina quality work environment. To ensure achievement of these objectives, ten rules have been formulated toguide Caisse executives and employees, who must comply with them in their activities:
• Act with loyalty, honesty and integrity;
• Comply with all applicable legislation, regulations and policies;
• Treat others with respect;
• Protect the confidentiality of information;
• Avoid conflict of interest situations;
• Comply with the rules governing personal transactions;
• Use Caisse resources appropriately;
• Demonstrate reserve in external activities;
• Report any incidence of non-compliance;
• Confirm personal compliance with this code.
32006.02.24
Code of Ethics and Professional Conduct for Officers and Employees
3. STATUS OF THE CODE AND REVIEW PROCESS
This code is subject to annual review and approval of the Board of Directors, upon recommendation of theGovernance and Ethics Committee.
The Governance and Ethics Committee formulates rules of ethics and professional conduct, revises this codeevery year, and submits it to the Board of Directors for approval.
4. SCOPE OF APPLICATION
This code applies to all executive officers and employees (hereinafter referred to as "employees") of the Caisseand of its wholly-owned subsidiaries (hereinafter referred to as "the Caisse").
Employees who retain the professional services of individuals on a contractual basis, must provide them witha copy of the code and ensure that they undertake to comply with the rules concerning them that are statedtherein. A declaration of compliance with the code must be duly signed by such persons and remitted to thePolicies and Compliance Division.
5. TERM OF APPLICATION
This code applies for any period during which an employee holds a position with the Caisse. Certain provisionsor special measures, such as those governing confidentiality of information, may continue to apply even afterthe cessation of duties at the Caisse.

4 2006.02.24
Code of Ethics and Professional Conduct for Officers and Employees
6. DEFINITIONS
In this code, unless the context otherwise requires:
a) "Board" Means the Board of Directors of the Caisse de dépôt et placement du Québec.
b) "Caisse" Means the Caisse de dépôt et placement du Québec and its wholly-owned subsidiaries, in which it holdsthe entirety of the common shares, directly or indirectly.
c) "Committee" Means the Governance and Ethics Committee prescribed in the Act respecting the Caisse de dépôt etplacement du Québec.
d) "Confidential information" Means all information concerning the Caisse, all information of a strategic nature and all informationregarding trends within an industry or a sector which is not public knowledge and which, if it wereknown by a person other than a director, would likely give the person in question an advantage or tocompromise the carrying out of an activity in which the Caisse is involved.
This term also includes all information relating to investments or to entities, companies and investmentfunds in which the Caisse holds or is considering holding an interest.
e) "Conflict of interest"Means any real, apparent, potential or contingent situation in which an employee might be inclined to favourone person (including the employee or a related person) to the detriment of another. This definition alsocovers any situation that could affect the loyalty, integrity or judgement of such employee.
f) "Dealer"Means a natural or legal person specializing in securities trading, depending on the context in which thisterm is used.
g) "Employee"Means any person who is part of the personnel of the Caisse, and includes any officer, whether engagedon a full-time, part-time, permanent or temporary basis.
h) "Person" Means any natural or legal person contemplated by this code.
i) "Personal information" Means any information concerning a natural person.
52006.02.24
Code of Ethics and Professional Conduct for Officers and Employees
j) "Privileged information"Means any information not yet publicly known and liable to affect the decision of a reasonable investor orto have a significant influence on the value or stock price of a company that has gone public, includingany information concerning one of the following events: a capital issue, a change to the dividend policy, amajor change in the ownership of securities that could have an effect on the control of the company,or a major change regarding business or clients. All privileged information is considered confidential.
k) "Related person" Means any person contemplated in Section 40 of the Act respecting the Caisse de dépôt et placement
du Québec, including, for the purposes hereof, persons related by blood, marriage, civil union, de factounion, adoption or any other relationship determined by government regulation. This term also meansa legal person or company in which the employee holds 10% or more of the voting or controlling sharesand of which he is a director or executive officer, as well as a legal person controlled by the employeeor by a person related to the employee.
l) "Security" Means any security within the meaning of the Securities Act (Québec), notably stocks, bonds, rights,warrants and all options, futures or derivatives. For the purpose of this code any present, contingent orconditional financial instrument that is convertible into a security or that entitles the holder to purchase asecurity is also a security.
Notwithstanding the foregoing, debt securities issued by a government, Treasury bills or bonds, termnotes and term deposits issued by a financial institution or government are not covered by this definition.
m) "Subsidiary"
Means a legal person in which the Caisse holds the majority of shares, including the real estate subsidiariesas well as all specialized entities constituted under the Act respecting the Caisse de dépôt et placement
du Québec.
n) "Transaction" Means any purchase, sale, transfer, disposition or any other acquisition or assignment effected in anymanner whatsoever, or any attempt to effect any such transaction.

7. RULES
A- Act with loyalty, honesty and integrity
Employees must carry out their activities with loyalty, honesty and integrity.
i. Competence and diligenceEmployees must provide competent service with all due diligence in the performance of assigned tasksand responsibilities. Employees must also strive for increased knowledge and show independentprofessional judgement.
ii. Integrity of accounting records The Caisse prides itself on compliance with the highest standards in recording and presenting itstransactions and the results thereof. Furthermore, it wishes to maintain the mechanisms thatensure the integrity of its accounting records. Accordingly, employees who process and recordinformation on behalf of the Caisse must do so in scrupulous adherence with these principles andprocess information rigorously.
All Caisse records, accounting documents, reports, invoices and other documents must present afull and accurate picture of transactions conducted. It is therefore prohibited to falsify documentsor knowingly omit any information or data affecting the accuracy of a report. It is also prohibitedto establish false or erroneous reports or produce false declarations.
Where an employee is aware of an error, omission, inaccuracy or falsification in the Caisse'sbooks, accounting records, financial statements or other Caisse documents, he must inform hismanager without delay or report such a situation in accordance with subsection I of this code.
iii. Integrity of transactionsEmployees must report the transactions effected in the course of daily activities with rigour andintegrity.
iv. Obligations of loyalty and integrity following cessation of employment at the CaisseAn employee's obligations of loyalty and integrity continue after the employee ceases employmentor no longer performs duties with the Caisse.
Former employees must continue to respect and ensure the confidentiality of all informationbrought to their attention in the performance of their duties. They must continue to respect theintegrity of the Caisse and refrain from using any item of confidential information to their advantage,to the advantage or detriment of a third party or to the detriment of the Caisse.
Similarly, no former employee may effect a transaction that would give that former executiveofficer or employee a material benefit arising from or occasioned by such confidential informationunless it has become public.
6 2006.02.24
Code of Ethics and Professional Conduct for Officers and Employees

72006.02.24
Code of Ethics and Professional Conduct for Officers and Employees
B- Comply with applicable laws, regulations and policies
Activities and transactions must at all times be conducted in compliance with the laws, regulations andpolicies applicable to the Caisse (hereinafter referred to as the “Law”).
This code does not in any way supersede the provisions of any applicable statute, regulation, or codeof conduct.
i. Compliance with laws, regulations and policiesEmployees may not directly or indirectly contravene the Law and must avoid any act that couldresult in a derogation of the Law.
Employees who are members of a professional order or the holder of a licence to practice issued bya competent authority must comply with the codes and rules of professional conduct establishedby that order or authority. In the event of a temporary or permanent suspension of a professionalorder, the employees must advise their manager or the Senior Vice-President, Policies andCompliance, in order to assess what action must be taken.
Any employee who is aware of a fact or situation that could constitute a contravention of theLaw or of this code must report such a situation in accordance with subsection I of this code.
ii. Fraudulent activities or transactionsEmployees are prohibited from participating, directly or indirectly, in fraudulent operations oractivities that are unlawful or that could be perceived as such.
C. Treat others with respect
Employees must carry out their activities with respect for others.
i. Relations with colleagues Employees must maintain professional relationships based on honesty and respect for individualswith the goal of establishing lasting and equitable employment relationships. Employees mustencourage respect for others and cooperation and professionalism among colleagues.
As stated in the Anti-Harassment Policy, no form of discrimination or harassment is tolerated.
The Caisse encourages communication and rapid dissemination of pertinent information (otherthan confidential information and personal information) concerning any decision or orientationwith significance for work-related matters.
ii. Relations with clients, partners and suppliersRelations with clients, partners and suppliers must also be conducted with respect for people andgroups in order to sustain lasting and equitable business relationships in a climate of trust.
iii. Relations with the communityConscious of its role in the community, the Caisse supports and funds charitable, philanthropicor business projects by applying specific conditions of application that it may determine fromtime to time.

The Caisse encourages the active and volunteer participation of its employees with known non-profit organizations, provided that such activities do not interfere with their work. It may decide tofinancially support such community involvement.
D. Protect the confidentiality of information
The Caisse is mindful of preserving at all times the accuracy, confidentiality, security and privacy ofthe information that it holds directly and indirectly on employees (personal information), clients,suppliers and enterprises that are its business partners.
i. Basic principleEmployees must respect the confidentiality of information to which they may have access andthey may not communicate such information except to authorized persons. Moreover, suchinformation may not be used by any employee for his or anyone else's personal benefit.
ii. Scope of applicationThe subsection D applies to all employees in their duties within the Caisse and when they are calledupon to represent the Caisse or act on its behalf in dealings with companies, and who thereforeare likely to have access to confidential information. The obligations in this subsection regardingthe protection of confidential information or restrictions on its use survive termination of themandate and cessation of employment. For the purposes of this subsection, a "company" is alegal person or partnership in which the Caisse has made or is considering making an investment.The affiliates partnership of the legal person or partnership are also "companies".
iii. Protection of confidential information
PrimacyThe purpose of this section is to affirm the primacy accorded by the Caisse to the protection ofconfidential information within the framework of the applicable legislative or regulatory provisionsand undertakings or agreements entered into, as well as through industry practices in this matter,such as the use of "Chinese walls".
"Chinese walls"This expression is a metaphor for all formal rules and procedures designed to restrict and controlthe dissemination of confidential information. All such procedures contribute to maintainingconfidence in and the integrity of investment activities. In the ordinary course of its activities,the Caisse may handle confidential information on public companies, which, if known, couldaffect the value of their shares. It is imperative that such information be kept strictly confidentialand not be used to the detriment of the issuers nor the benefit of the Caisse's employees.Accordingly, the measures proposed in this section regarding confidentiality of information andpersonal transactions, as well as certain policies, all form a set of rules to be complied with byemployees.
8 2006.02.24
Code of Ethics and Professional Conduct for Officers and Employees
92006.02.24
Code of Ethics and Professional Conduct for Officers and Employees
Use of confidential informationAs provided for in the Policy on embargos, employees in possession of confidential informationmust inform the Legal Affairs and Corporate Secretariat, which shall place the security concernedunder embargo if required. Employees must refrain from communicating or using the informationexcept for the purpose for which it was provided or for which the employee had access. Suchpurposes specifically include communication of the information within the Caisse. For this purpose,the information may be discussed only with the relevant persons.
In the event of uncertainty regarding disclosure of confidential information, it is the employee'sduty to obtain the requisite legal opinion from Legal Affairs and Corporate Secretariat.
iv. Measures for protecting confidential informationEmployees must take the necessary measures to respect the confidentiality of information,specifically by doing the following:
• Refrain from leaving documents containing confidential information where they can be readby third parties or employees not concerned with such information;
• Take appropriate measures to ensure the physical protection of documents;
• Do not discuss matters pertaining to the confidential information in public places;
• Use designated equipment for copying and transmitting confidential information;
• Take appropriate measures to dispose of documents (shredding, archiving, etc.);
• Return documents upon the cessation of its duties;
• Give the requisite notices to avoid conflict of interest situations; and
• Documents intended for circulation that contain confidential information must be marked"Confidential".
v. Contact with the media and disclosure of informationNo employee, unless authorized, may discuss on a specific investment or any other subjectpertaining to the Caisse with representatives of the news media.
vi. Personal investments and planned employment
Basic principleAs a general rule, employees may not hold any interests that are incompatible with theaccomplishment of their duties and responsibilities.
Employees who currently have personal investments or who plan to make a personal investment ina company or who have a job offer from a company may not receive any confidential informationconcerning a competitor of that company. In that regard, such employees must withdraw frommeetings or discussions when it is clear that confidential information may be disclosed.
Notwithstanding the foregoing, this provision does not preclude the exchange of industry-relatedor market-related information, unless the nature of the information is confidential within themeaning of this code.

Specific application Any person who is bound to the Caisse by a services agreement must inform the Caisse withina reasonable period of time, before accepting a job offer from a company during the term of thecontract, agreement or mandate with the Caisse and in conjunction with the Caisse and shalldetermine what confidentiality measures to be taken.
vii. Discussions with a business partner or client
Confidentiality rulesAll discussions between an employee and a company regardless of whether they involve review ofan investment proposal, the monitoring of an investment made or a fund management proposalfor a client are subject to the obligations of confidentiality.
The submission of a financing proposal by a company must reflect its acceptance of the fact that,while recognizing the confidential nature of the communications, employees must neverthelessconduct studies research, engage in consultations and validations in order to recommend ormonitor an investment.
An employee involved in the financing must ensure that the company identifies the documentsthat must be kept confidential.
Similarly, a company may express its concerns regarding the handling of any confidential informationpertaining to it inside the Caisse or one of its subsidiaries. Therefore, insofar as possible, it mustspecify the information giving rise to such concerns and specify the use or restrictions on use ofthat information.
Notification may be given to the employee handling the matter or the employee's manager, whomust inform all persons and authorities concerned.
Specific application Even in the absence of specific provisions in the employment contract, services agreement ormandate of a person who does not have employee status, a reference to the Code of Ethics andProfessional Conduct in the employment contract implies compliance with all provisions of thecode pertaining to confidentiality of information from the Caisse and the companies with whichit does business, during and after the contract of employment, services agreement or mandate.
Similarly, that person may not use information thus obtained during or after the contract, agreementor mandate, for his or her own personal gain or that of a third party.
10 2006.02.24
Code of Ethics and Professional Conduct for Officers and Employees

112006.02.24
Code of Ethics and Professional Conduct for Officers and Employees
E. Avoid conflicts of interest
In order to maintain the trust and confidence of clients, suppliers, businesses, partners and the generalpublic, employees must comply with the rules established by the Caisse for situations likely to giverise to conflicts of interest.
i. General principles
Incompatible interests In order to ensure that their honesty and impartiality are beyond reproach, employees mustavoid placing themselves in situations that could create personal obligations that third partycould exploit explicitly or implicitly for the purpose of obtaining preferential treatment within theCaisse.
Employees must take the necessary measures to avoid any conflict of interest or appearancethereof, or any situation that could potentially or contingently constitute a real or perceivedconflict, in such a manner as to constantly maintain impartiality in the performance of their tasksand responsibilities. Any employee in a real or apparent conflict of interest, potential or contingentmust withdraw from any discussions, decisions or assessment related to the particular subject.
Obligation of disclosureEmployees must disclose to their immediate superiors and to the Senior Vice-President, Policiesand Compliance any situation that may reasonably be construed as a conflict of interest situa-tion, and must comply, if applicable, with any directive or special condition established in theapplication of this code.
Furthermore, pursuant to section 42.1 of the Act respecting the Caisse de dépôt et placement
du Québec, an employee who has a direct or indirect interest in a matter putting his personalinterests and those of the personal Caisse in conflict must, under pain of dismissal, disclose hisinterest in writing to the Chairman of the Caisse's Board of Directors.
Situations to avoidEmployees must avoid placing themselves in any conflict of interest situations. Furthermore,there must be no conflict between an employee's personal interests and his duties includingwhen engaged in transactions on behalf of the Caisse.
Employees must furthermore avoid situations in which they, a related person, a dependent or amember of their immediate family could directly or indirectly benefit from a transaction orcontract concluded within the Caisse. Similarly, employees must avoid situations in which they,a related person, a dependent or a member of their immediate family could directly or indirectlybenefit from their influence or decision-making powers by virtue of their position within the Caisse.
Settling of personal mattersFrom the moment they assume their duties, employees must settle their personal matters insuch a manner as to avoid incompatible interests as well as any situation that might place themin a conflict of interest and, as the case may be, take any necessary measures in order to complywith the provisions of this code.
Employment of related personsEmployment of related persons is permissible, but in each individual case, the procedure followedmust be equitable.
Nonetheless, when two related persons might hold a position in which one would report to theother, the hiring of the person who does not already have a position should be avoided.
Where such a situation occurs and both persons are already in the employ of the Caisse, they areresponsible for informing their immediate superior who shall, if necessary, recommend specificconditions. If required, the Committee may determine whatever terms and conditions it considersappropriate.
ii. Gifts, entertainment activities, donations, services or benefits
PrincipleEmployees must avoid giving or receiving any gift, entertainment activity invitation, donation,service, benefit or other favour capable of affecting the performance of their roles and responsibilitiesor that could adversely affect the credibility of the Caisse.
Employees must maintain high standards of independence and impartiality and avoid being underobligation to any person whatsoever.
Standards of acceptability As a general rule, any gift, entertainment activity invitation, donation, service or benefit of asymbolic nature, that is non-recurring and of small monetary value may be accepted if offeredin a neutral context that does not place an employee in an embarrassing situation or influencedecisions made in the course of that employee's duties. The same applies as regards meals andtickets to cultural and sporting events or regarding financial community.
Acceptance of invitations from an investment industry-related body must be considered inconjunction with a manager and may not include free plane tickets or accommodation.
If uncertain, the employee may consult the Senior Vice-President, Policies and Compliance,which will refer the matter to the President and CEO or the Committee, if necessary.
Should a gift be delivered to the Caisse, the Corporate Affairs Division will take whatever measuresit considers appropriate to dispose of the gift.
The following are some examples of situations regarded as unacceptable:
• An employee participates in an event organized by a corporate client, an organization or nonprofit company sponsored by the Caisse and accepts a door prize that is not negligible invalue, such as a trip.
• An employee develops a friendship with a business partner and as such accepts goods orfavours, regardless of their value, for himself or his immediate family.
• An employee accepts a gift on the pretext that it is justly deserved and as such is entitled tobe treated as an exception to the rule.
12 2006.02.24
Code of Ethics and Professional Conduct for Officers and Employees

Important questions to ask yourself before accepting a gift
• Does the gift affect my ability to remain objective and independent?
• Have I properly considered all aspects and the scope of the situation?
• Would knowledge of my acceptance of the gift adversely affect the credibility of the Caisse?
• Would I be publicly perceived as being in a conflict of interest situation?
Gifts exceeding standards of acceptability and the obligation to report the giftsGifts, entertainment activities invitation, donations and benefits of small monetary value that arenon-recurring and given in the ordinary course of activities are acceptable. For example, this wouldincluded a business lunch, tickets to cultural or sporting events, gifts consistent with standards ofcourtesy and hospitality exchanged by partners or presented at public receptions, and providedthat they are reasonable.
In order to determine what is reasonable, consultation with your immediate superior is suggested.Thus, if you consider that although the standards may have been exceeded, the situation does notconstitute a conflict of interest and you then decide to accept the gift, entertainment activitiesinvitation, donations or all other benefits, you must report it to Policies and ComplianceDivision, using the prescribed form. Should you be uncertain, consult the Senior Vice-President, Policies and Compliance before accepting and report any gift received.
When the value of a gift, donation, service or benefit exceeds the established standards, theCommittee may apply any expedient measure, including declaring it an asset of the Caisse.
iii. Board memberships
Rules governing board memberships put forward by the Caisse or as part of employee's dutiesAn employee who sits on a board of directors at the request of the Caisse or pursuant to anagreement to that effect, must follow the following rules:
Consult Legal Affairs and Corporate Secretariat concerning the obligations incumbent upondirectors of legal persons;
Declare any conflict of interest that may result from the directorship; and
Remit attendance vouchers or other fees as well as options or privileges to acquire same receivedby the employee in his or her capacity as director, following which the necessary documents willbe prepared by the Caisse to neutralize the situation for tax purposes and all necessary steps willbe taken in that regard.
Rules governing all other board membershipsAn employee who wishes to sit on a board of directors or on a committee that fulfills or may fulfillsuch a role, must avoid putting himself in a conflict of interest situation. The employee mayconsult the Senior Vice-President, Policies and Compliance in that regard.
However, authorization must be obtained from the President and CEO to sit on the board of agovernment corporation.
Such board memberships must be declared annually and filed with Policies and ComplianceDivision and renewals are governed by the same terms and conditions. In no case may anemployee suggest that the Caisse supports his or her initiative.
132006.02.24
Code of Ethics and Professional Conduct for Officers and Employees
14 2006.02.24
Code of Ethics and Professional Conduct for Officers and Employees
F. Comply with the rules governing personal transactions
i. Persons covered
• All employees;
• Consultants, if they are specifically governed by these rules in their professional servicescontract with the Caisse;
• To persons for whom the above-mentioned persons act as mandatary, attorney, representativeor advisor.
ii. Basic principles
Confidentiality of informationAll persons concerned must respect the confidentiality of information to which they may haveaccess and may not communicate such information except to authorized persons. Moreover, noperson may use the information for personal gain or to the benefit of any other persons.
No person may disclose any information to any other person regarding the content of theembargo lists or confidential lists, including dealer lists, investment manager lists or financialplanner lists to which they have access.
Conflicts of interestIn general, the persons concerned may not hold any interests that are incompatible with theperformance of their duties and responsibilities.
They must effect their personal transactions in the ordinary course of business and in accordancewith market prices and commissions or market fees.
In their relations with a dealer to finalize a personal transaction, the persons concerned mustavoid placing themselves in a situation that could be perceived as a conflict of interest with theirposition with the Caisse.
Priority must be given to depositors and clientsThe persons covered must conduct themselves in such a manner that investments executed forthe Caisse always take precedence, in all respects, over their personal investments and those ofimmediate family members, acquaintances or friends and any other person living with them orany person for whom they act as a mandatary, attorney, representative or advisor.
iii. Prohibited transactionsNo transaction may be effected by the persons concerned in the following circumstances:
• When they have had access to confidential information in performance of their duties;
• When they have had access to privileged information;
• Regarding securities on the "List of securities to be monitored, under embargo" kept up todate by Legal Affairs and Corporate Secretariat;
• Regarding securities on the "List of securities to be monitored, prior verifications" kept up todate by Legal Affairs and Corporate Secretariat (trading authorization may be provided afterverification);
152006.02.24
Code of Ethics and Professional Conduct for Officers and Employees
• Securities on the list of securities in respect of which the Caisse is an insider (prohibitedbuys);
• Private equity held in portfolios managed by the Caisse (unlisted securities);
• Regarding shares of a company issued under an initial public offering ("IPO shares") in whichthe Caisse participates or where the Caisse already has an investment;
The Policies and Compliance Division may, from time to time, depending on the circumstances,determine exceptions.
New employeeEmployees holding a security on one of the aforementioned lists at the time of taking up theirposition must keep them or dispose of them as prescribed by the Senior Vice-President, Policiesand Compliance who shall, if necessary, refer the matter to the Committee.
Using confidential information that has become public Where to the knowledge of an employee, confidential information has become public, theemployee must wait until a reasonable time has elapsed before proceeding with a transaction onthe related issuer. If in doubt, they may consult the Senior Vice-President, Policies and Compliance.
If a security is not on the list of embargoed securities or on the list of securities to be monitoredand an employee is in possession of confidential information on an issuer provided by the issuer oran external manager the employee must ask, before making a personal transaction, if the person fromwhom the information was obtained would be comfortable with that transaction having been made.
Administrative unit directivesAdministrative unit directives may from time to time supplement this policy.
iv. Securities subject to the pre-authorization processAll transactions involving any security whatsoever require pre-authorization, regardless of whetherthe securities are held in a regular account or in an RRSP account or any other type of account,except the following:
• Treasury Bills or money market instruments including currency and derivatives based on suchfinancial instruments;
• Government bonds (including foreign and american, federal, provincial, municipal and publicutility bonds and any other public body) and government bond derivatives;
• Security indexes and market index derivatives;
• Units in any mutual fund including "Exchange-Traded Funds (ETF)";
• Securities purchased under a divided re-investment plan;
• Deposit certificates.
For example, the pre-authorization process applies to all transactions involving shares (listed orunlisted), share derivatives and corporate bonds, and income trusts units.

16 2006.02.24
Code of Ethics and Professional Conduct for Officers and Employees
v. Pre-authorization process for personal transactions
Prior verificationIt is the duty of all persons to whom this code applies to make prior verifications to avoid a situationincompatible with their duties and to avoid any use of confidential information and apply for pre-authorization of all personal transactions involving the above-mentioned securities.
ProceduresRequests for authorization are entered in the computerized personal transactions managementsystem.
A reply will be provided automatically, but if the request requires manual intervention, it will takelonger, usually not more than an hour.
Duration of validity of authorizationThe day approval is given.
Maintenance of confidential lists of securities to be monitored, securities under embargoand securities subject to prior verificationThe lists of securities to be monitored, securities under embargo and securities subject to priorverification are kept up to date under the supervision of Legal Affairs and Corporate Secretariat.
Every manager or vice-president responsible for portfolio management must promptly notifyLegal Affairs and Corporate Secretariat if he has reason to believe that a security should beadded to aforementioned lists.
Abstention periodWith certain exceptions, the pre-authorization process subjects all persons concerned to a period ofabstention from personal transactions that applies for five (5) business days before and after thedate of a securities transaction by the Caisse.
Exceptions to the abstention periodThe following personal transactions, if not otherwise prohibited, should be authorized in accordancewith the pre-authorization process:
• Regarding securities traded in non-Canadian or emerging markets;
• Regarding securities that are part of an index, determined by the Policies and ComplianceDivision;
• Regarding securities of minor importance compared to the level of trading on organized markets.
The Policies and Compliance Division may determine exceptions in accordance with the pre-authorization process.
vi. Minimum security-holding periodThe persons concerned must keep securities acquired through the pre-authorization process for30 calendar days.
172006.02.24
Code of Ethics and Professional Conduct for Officers and Employees
vii. Declaration of personal transactionsAll persons concerned are required to arrange for a duplicate of all confirmations of transactionsand all monthly statements of account concerning securities that require pre-authorization besent directly to the Policies and Compliance Division.
Additional requirement applicable to certain executive officers, managers, analysts and traders:Executive officers, managers, analysts and traders whose mandate is to analyze, recommend orinvest in Treasury Bills or other money market instruments, including currency, or in governmentbonds or derivatives of such financial instruments, must provide a duplicate of all confirmationsof transactions and monthly statements of personal transactions involving such securities.
viii.Discretionary management agreementSecurity transactions effected pursuant to a discretionary management agreement are notpermissible, namely, where an employee gives a securities dealer or a portfolio manager theauthority to effect security transaction on behalf of the employee without being requiredbeforehand to consult the employee regarding such transactions.
Legislation pertaining to insider trading may create problems for such an agreement if the dealeror portfolio manager buys or sells securities when the employee or the Caisse has privilegedinformation concerning the issuer or the Caisse has made an insider report concerning that issuer.
Employees who would like to enter into discretionary management agreements could ensurethat they are protected by establishing a “blind trust”.
ix. Blind trust agreementWhere the account holder is not informed in any manner whatsoever of transactions effected inhis or her account and of the composition of the account holder's portfolio, all that is required isthat the blind deposit-management mandate (or blind trust agreement) be submitted to theSenior Vice-President, Policies and Compliance. No rule governing personal transactions wouldthen apply.
x. Statements and declarations required upon being hired and annually thereafter Upon being hired all employees must complete the Declaration regarding compliance with theCode of Ethics and Professional Conduct.
At least once a year thereafter, as at December 31 and for submission before January 31 of thefollowing year, employees and certain consultants concerned must complete the following two(2) declarations:
• Annual statement regarding compliance with the Code of Ethics and Professional Conduct;
• Annual portfolio statements as at December 31, including details of the securities coveredby the pre-authorization process.
Additional requirement applicable to certain executive officers, managers, analysts and traders:Executive officers, managers, analysts and traders whose mandate is to analyze, recommend orinvest in the following securities and who also trade personally in such securities must providedetails thereof in their annual portfolio declaration:
18 2006.02.24
Code of Ethics and Professional Conduct for Officers and Employees
• Treasury Bills or other money market instruments, including currency and commodities orderivatives of such securities;
• Government bonds (including foreign, US, federal, provincial and municipal bonds those of anyother public body) or government bond derivatives.
xi. ComplianceThe Policies and Compliance Division shall implement the following procedures:
• Using the confirmations of personal transactions and monthly statements, validation, of thefollowing:
• that there has not been any "front running", namely, that personal interests did not prevailover those of the Caisse;
• consistency between reported transactions and pre-authorized transactions;
• compliance with the abstention period;
• compliance with the security-holding period;
• compliance with the prohibited transaction list;
• Monitoring the annual statements and declarations and those made upon being hired.
xii. ReportingThe Senior Vice-President, Policies and Compliance shall report all breaches to the Governanceand Ethics Committee and all situations requiring its attention. Once a year, the Division shallsubmit a report on activities, prepared with the utmost respect for confidentiality of information.
G. Use resources appropriately
Loyalty towards the institution is a basic principle for establishing a relationship of trust and confidencebetween employer and employee. Loyalty must therefore govern employees conduct and they mustensure that they preserve all Caisse property and assets over which they have custody and control.
i. Use of Caisse resourcesEmployees must use available resources for the purposes for which they are intended, and incompliance with the policies and directives issued in respect thereof. Any personal or other usemust be brought to the attention of their managers or the Senior Vice-President, Policies andCompliance, which may issue opinions regarding such use.
Employees must ensure that Caisse assets and funds are used exclusively for Caisse purposes.
ii. Protection of computerized information and use of computer resourcesEmployees have access to computer equipment as a tool to help them do their jobs. Such equipment,including the computer network, the e-mail system and the contents thereof, data, Internetaccess and the remote log-in system, is Caisse property.

192006.02.24
Code of Ethics and Professional Conduct for Officers and Employees
Use of and access to information-based assets including computerized must be in compliancewith the rules pertaining to security and integrity of information set forth in the Caisse's computersecurity policies and rules.
The use of the Caisse's electronic and e-mail systems must be done in a secure manner with respectfor individuals and groups. Employees are prohibited from visiting Internet sites of a discriminatory,pornographic or hate-mongering nature. Participation in personal on-line chat sessions or in on-linecasinos is also prohibited.
iii. Inventions in connection with duties at the CaisseAll inventions, including software developed by an employee in connection with his or her duties,during or after business hours, are Caisse property.
Employees must disclose to the Caisse all information regarding the invention and cooperate incopyright or patent registration by the Caisse. When required, employees must also sign assignmentsof rights in favour of the Caisse.
H. Demonstrate reserve in outside activities
i. Respect for the institutionAt all times, employees must refrain from making comments that would discredit or tarnish theCaisse's image or reputation.
Employees must avoid participating directly or indirectly in activities that would adversely affectthe Caisse's interests, image or reputation.
Employees who are aware of illegal or fraudulent act, in contravention of this code or who areaware of unsound management operations or practices or those that are non-compliance withthe legislation, regulations and Caisse policies must report any such situation as soon as possiblein compliance with subsection I of this code.
ii. Media relationsCommunication with the media must be done in accordance with Caisse directives. All suchcommunications shall be supervised by the External Communications Division.
iii. Priority accorded to outside duties and activitiesEmployees must give first priority to their duties for the Caisse and must not allow their outsideactivities to interfere with the performance of their duties for the Caisse.
Moreover, the performance of outside activities must not be susceptible of constituting acontravention of the rules contained in this code. Where the situation is unclear, employees mayrefer to the Senior Vice-President, Policies and Compliance who may make any recommendation inrespect thereof.
No employee may engage in remunerated outside activities that directly or indirectly concernthe Caisse without having obtained specific authorization.
20 2006.02.24
Code of Ethics and Professional Conduct for Officers and Employees
When an employee engages in activities contemplated by this section, the employee must ensurethat such activities are clearly personal to that employee, and do not in any way involve theCaisse unless they are connected with activities of the Corporate Affairs Division.
iv. Political activitiesThe Caisse does not wish to be associated in any manner whatsoever with the personal politicalactivities of any employee, especially any activity of a fundraising or partisan nature.
I. Report any non-compliant situation
Any situation that is not in compliance with this code must be reported. An employee must make thedeclaration to the persons indicated below. All declarations made by employees are kept strictlyconfidential. Furthermore, declarations can be anonymous.
Declarations may be given to the following persons:
• the employee's immediate superior;
• Senior Vice-President, Policies and Compliance Division;
• President and CEO;
• the Chair of the Governance and Ethics Committee;
• the Chair of the Board.
Non-compliant situations can also be declared by dialing the KPMG ethics hot line on number 1-866-723-CDPQ (2377).
J. Compliance with this code
Before assuming their positions, employees must confirm in writing that they have received and readthis Code of Ethics and Professional Conduct. As a condition of employment, they must agree tocomply with the rules stated therein and fulfill their obligations under the code.
Employees must also provide annual confirmation of compliance with this code as a condition ofemployment.

212006.02.24
Code of Ethics and Professional Conduct for Officers and Employees
8. APPLICATION OF THE CODE
A. Competent authorities
The Board of Directors approves the code, on the recommendation of the Governance and EthicsCommittee, which ensures that it is reviewed at least every year. In addition, the Committee considersall questions pertaining to the application of the code and, if necessary, drafts opinions or makesrecommendations. It is specifically responsible for assessing any contravention of the code andmaking whatever recommendations are necessary as a result thereof.
The Senior Vice-President, Policies and Compliance must do the following:
• Provide pertinent documentation;
• Apply this code in accordance with parameters decided by the Committee and submit anysituation to it that requires a prior opinion or recommendation;
• Disseminate the code and recommend updates or policies on ethical issues;
• Ensure the monitoring of conduct and investigate where there are breaches; Consider theapplicable sanctions and make appropriate recommendations to the President and CEO, to theCommittee or to the Board of Directors;
• Provide interpretations of this code, provide information and advice on its application onvarious ethical dilemmas;
• Organize training in ethics;
• Keep archives and retain all declarations, disclosures and attestations that must be providedpursuant to this code and take the necessary measures to protect the confidentiality of suchdeclarations, disclosures and attestations;
• Receive and study complaints from clients and the public as well as any confidential communication pertaining to a report of non-compliance with the code follow up the matterwith the President and CEO.
B. Employee responsibilities
This code is part of the professional obligations of all employees, who must give a formal undertaking toread it and comply therewith, and all directives or special instructions that may be issued regardingthe application thereof. Furthermore, they must annually confirm their compliance with the code.A copy of the code is provided to every person upon commencing duties.
When in doubt regarding the scope or application of any provision, it is the employee's duty toconsult the Senior Vice-President, Policies and Compliance who shall, if necessary, refer the matter tothe Committee.
Employees must report any situation that contravenes this code.
22 2006.02.24
Code of Ethics and Professional Conduct for Officers and Employees
Specifically, each employee must do the following:
• Comply with this code;
• Have an ethical behaviour;
• Demonstrate leadership and promote compliance with the code;
• Act according to the principle that yield is never more important than compliance with the code;
• Take action promptly where a situation that is brought to his attention could constitute acontravention of the code and report all actual contraventions.
C. Governance and Ethics Committee
As part of its mandate under this code, the Governance and Ethics Committee must do the following:
• Formulate rules of ethics and professional conduct;
• Review this code on an annual basis and recommend approval thereof to the Board of Directors;
• Receive any report on the application of this code;
• Consider any situation whose importance warrants its attention and issue pertinentrecommendations and opinions on the situation and any subject covered by the code resultingfrom its application;
• Authorize exceptions to this code where the situation warrants it;
• Receive reports on the situations reported and deal with any matters arising therefrom.
D. Board of Directors
In connection with its mandate and this code, the Board of Directors must do the following:
• Review and approve this code every year on the recommendation of the Governance andEthics Committee;
• Approve any other rule of ethics and professional conduct formulated by the Governance andEthics Committee;
• Receive the report of the Governance and Ethics Committee;
9. SANCTIONS
Compliance with the Code of Ethics and Professional Conduct is mandatory. Employees who contravene thespirit or the letter of the rules will be subject to disciplinary measures appropriate to the seriousness of thesituation. The disciplinary measures may take any of the following forms:
• A written warning placed in the employee's record;
• Imposition of a fine up to $10,000 or the obligation to personally proceed with a transaction that mayresult in a financial loss;
• Suspension;
• Dismissal;
• And, depending on the nature of the case, referral of the matter to:
•The relevant civil or regulatory authorities;
•The relevant judicial authorities in the case of contravention of penal legislation.
Asking a third party to contravene a rule and non-cooperation with an investigation constitute non-compliancewith the code.
10. REQUESTS FOR INFORMATION
Requests for information concerning the application or interpretation of this code must be sent to the SeniorVice-President, Policies and Compliance.
232006.02.24
Code of Ethics and Professional Conduct for Officers and Employees

24 2006.02.24
Code of Ethics and Professional Conduct for Officers and Employees
APPENDIXES

252006.02.24
Code of Ethics and Professional Conduct for Officers and Employees
DECLARATION REGARDINGCOMPLIANCE WITH THE CODE OF ETHICS AND PROFESSIONAL CONDUCT
I, the undersigned, ____________________________________________ acknowledge having received, read andunderstood the meaning and scope of the Caisse's Code of Ethics and Professional Conduct and undertake tocomply with its requirements.
I hereby declare all outside interests or activities that could be construed as coming into conflict with the interestsof the Caisse or persons with whom the Caisse has a business relationship. I have included any companies forwhich I act as an officer or director, independently of any request to so act having been made by the Caisse:
Securities in my personal investment portfolio (for example, listed or unlisted shares, share derivatives,corporate bonds). It is not necessary to provide information on mutual fund units held. Provide the followinginformation or statements of account:
Where relevant, I have attached a list of securities for the persons for whom I act as an agent, attorney,representative or advisor.
Name of persons: _____________________________________________________________________________
I certify that the information provided in this Declaration is complete and accurate.
Signature: ____________________________________ Title: _________________________________________
Date: ________________________________________ Division: ______________________________________
Security Issuer Dealer
Appendix A
26 2006.02.24
Code of Ethics and Professional Conduct for Officers and Employees
ANNUAL STATEMENT REGARDINGCOMPLIANCE WITH THE CODE OF ETHICS AND PROFESSIONAL CONDUCT
I, the undersigned _____________________________________ acknowledge having read and understood themeaning and scope of the Caisse's Code of Ethics and Professional Conduct. I certify that, in the last full calendaryear, I complied with the code, and I undertake to respect its requirements in the future.
In particular, I declare that I have complied the provisions regarding the confidentiality of information and,when I did not, I provided details of the relevant situations.
Furthermore, I took all necessary measures to ensure impartiality in the execution of my duties and responsibilities,by avoiding placing myself in a conflict of interest situation.
I hereby declare any outside interest or activity that could be construed as coming into conflict with the interestsof the Caisse or of persons with whom the Caisse has a business relationship. I also include the names of thecompanies for which I act as executive officer or director, independently of any request that I so act by the Caisse:
I have declined all gifts, entertainment activity invitations, donations, services or benefits, other than those of anon-recurring or symbolic nature or of minimal value. I hereby acknowledge that I am fully aware of myobligation to report any gift, entertainment activity invitation, donation, service or benefit that is not in keepingwith the standards of acceptability, using the prescribed form.
I also state that I having complied with the provisions of the code regarding personal transactions. Neither I noranyone for whom I act as an agent, attorney, representative or advisor has contravened these provisions. Inother cases, the Policies and Compliance Division was notified thereof and I followed any opinions provided inthat respect.
Comments:
Signature: ____________________________________ Title: _________________________________________
Date: ________________________________________ Division: ______________________________________
Appendix B

272006.02.24
Code of Ethics and Professional Conduct for Officers and Employees
ANNUAL PORTFOLIO DECLARATION AS AT DECEMBER 31
You must check one of the four options
1. I have no personal investments to declare.
2. My personal investments are exempt from the pre-authorization process.
3. I own securities that are subject to the pre-authorization process, such as listed or unlisted shares,share derivatives, or corporate bonds (in this case, answer A or B)
A. All my statements that include relevant securities are sent directly by my broker to the Policiesand Compliance Division.
(Comments, if relevant)
B. My portfolio contains the following relevant securities regarding which information is not sentdirectly by my broker (Ex.: securities held at home, etc.). Provide details regarding securities or indicate that a hard copy list will be furnished.
Description of security Quantity______ Place of safekeeping
_____________________________
_____________________________
4. I signed a blind trust agreement for the management of my portfolio and have furnished supportingdocuments to the Policies and Compliance Division.
Appendix C

28 2006.02.24
Code of Ethics and Professional Conduct for Officers and Employees
Signature: ____________________________________ Title: _________________________________________
Name: _______________________________________ Division: ______________________________________
Date: ________________________________________
I certify that I have not disclosed confidential information to any person whatsoever.
I certify that the information provided is complete and accurate.
Appendix C (Continued)
Check if applicable
5. I am an executive officer, manager analyst or trader whose mandate is to analyze, recommend orinvest in money market securities, government bonds or bond derivatives (Section 7.F, subparagraph (x)of the Code of Ethics)
A. All my statements that include relevant securities are sent directly by my broker to the Policiesand Compliance Division.
(Comments, if relevant)
B. My portfolio contains the following relevant securities regarding which information is not sentdirectly by my broker. Provide details regarding securities or indicate that a hard-copy list willbe furnished.
Description of security Quantity______ Place of safekeeping
Check if applicable
6. I act as mandatary, attorney, representative or advisor for the following persons, who have relevantsecurities:

292006.02.24
Code of Ethics and Professional Conduct for Officers and Employees
DECLARATION OF GIFTS, ENTERTAINMENT ACTIVITIES,DONATIONS, SERVICES OR BENEFITS
Gifts, entertainment activity invitations, donations and benefits of small monetary value that are non-recurring andgiven in the ordinary course of activities are acceptable. For example, this would included a business lunch, ticketsto cultural or sporting events, gifts consistent with standards of courtesy and hospitality exchanged by partners orpresented at public receptions, and provided that they are reasonable.
In order to determine what is reasonable, consultation with your immediate superior is suggested. Thus, if youconsider that although the standards may have been exceeded, the situation does not constitute a conflict ofinterest and you then decide to accept the gift, entertainment activities invitation, donations or all other benefits,you must report it to Policies and Compliance Division, using the prescribed form. Should you be uncertain,consult the Senior Vice-President, Policies and Compliance before accepting and report any giftreceived.
Description of the situation, gift, entertainment activity invitation, donation, services or benefits:
Position and/or relationship to third party offering gift, entertainment activity invitation, donation, services orbenefits:
Value:
Signature: ____________________________________ Title: _________________________________________
Name: _______________________________________ Division: ______________________________________
Date: ________________________________________
Appendix D

All figures in this document are expressed in Canadian dollars,unless otherwise indicated.
This publication and the Annual Report 2005 are available on theInternet : www.lacaisse.com
Information:514 [email protected]
Ce document est aussi disponible en français sur notre site Web.
Legal Deposit 2006 – Bibliothèque nationale du Québec
Completely recyclable –the responsible choice30%

www.lacaisse.com
Business Office
Centre CDP Capital1000, place Jean-Paul-RiopelleMontréal (Québec) H2Z 2B3Tel.: 514 842-3261Fax: 514 847-2498
Head Office
Édifice Price65, rue Sainte-Anne, 14e étageQuébec (Québec) G1R 3X5Tel.: 418 684-2334Fax: 418 684-2335