an svg based tool for plane geometry and mathematics...
TRANSCRIPT

An SVG Based Tool for Plane Geometry and Mathematics Education1
Xun Lai, Paul Wang
Kent State University, Kent, Ohio 44242-0001, USA
Abstract
Geometry is an important part of mathematics. Described is a Scalable Vector Graphics (SVG) based system for teaching and learning geometry and mathematics. The work is part of the WME project for enhancing mathematics education using Web technologies. An SVG library for diagramming and interactive geometry learning is created. Building on this library, a Web-based authoring tool GeoSVG that makes creating interactive geometry and other mathematics lessons simple and easy has been developed. GeoSite is a website to support publishing manipulatives authored using GeoSVG. Teachers and other experts can easily create and share interoperable geometry-based experiments to illustrate mathematical concepts. Current interactive geometry software are not Web-oriented and require users to install softwares, to have Web space to share manipulatives online, and to manipulate HTML and Java applets. GeoSVG and GeoSite together eliminate these requirements.
Key Words: Dynamic Geometry Software (DGS), Geometry, GeoSite, GeoSVG, Mathematics Education, Manipulative, SVG, WME,
1. Introduction At the Institute for Computational Mathematics (ICM/Kent), we are developing WME (Web-based Mathematics Education) as a distributed system for supporting, enhancing, and delivering mathematics education at all levels. A pilot project puts WME to in-class trial at Kimpton Middle School (Munroe Falls, Ohio) [9]. Among the many features and advantages of WME [8], hands-on learning with interactive manipulatives remains critically important. To support diagramming, interactive learning and easy authoring of geometrical manipulatives, we are creating a system called GeoSVG. Simply put, the purpose of GeoSVG is to enable specialists and school teachers to easily create, share, modify, and deploy geometry-based interactive manipulatives to teach students mathematics concepts. Although developed as part of WME, GeoSVG can be used independently. Scalable Vector Graphics (SVG) is a W3C standard for describing two-dimensional graphics in XML. It has two parts: an XML-based file format and a programming API for graphical applications [1]. Key features include shapes, text and embedded raster graphics, with many different painting styles. It supports scripting through languages such as ECMAScript which 1 Work reported herein has been supported in part by the National Science Foundation under Grant CCR-0201772 and in part by an Ohio Board of Regents Research Challenge Grant. Any opinions, findings, and conclusions or recommendations expressed in this material are those of the authors and do not necessarily reflect the views of any funding agency.

accesses SVG Document Object Model (SVGDOM) and has comprehensive support for animation. Here is an example (Figure 1) of the XML-based file format to produce a circle [21]: <?xml version="1.0" standalone="no"?> <!DOCTYPE svg PUBLIC "-//W3C//DTD SVG 20010904//EN" "http://www.w3.org/TR/2001/REC-SVG-20010904/DTD/svg10.dtd"> <svg width="" height=""> <circle cx="100" cy="100" r="50" style="stroke:#FF0000; stroke-width:2; fill:#CCCCFF"/> </svg>
Figure 1: Circle generated by SVG In last example, the circle is generated statically. Here is an example showing how to dynamically generate a circle via accessing SVGDOM [21]: myShape = SVGDoc.createElement("circle"); myShape.setAttribute("cx", 125); myShape.setAttribute("cy", 125); myShape.setAttribute("r", 50); myShape.setAttribute("style", "fill: #FFCCCC; stroke:#FF0000"); SVGRoot.appendChild(myShape); Here SVGDoc refers to the SVG document and SVGRoot refers to the root element of the SVG document. Web browsers such as Netscape, Mozilla and Firefox are beginning to have built-in support for SVG. The Adobe SVG Viewer is a plug-in that works across most platforms (Windows, Mac and Linux) and browsers (Internet Explorer, Netscape, Mozilla and Firefox). Since 1980, Dynamic Geometry Software (DGS) packages such as Cabri Geometry II [3], Geometer’s SketchPad [4], Cinderella [5], and Euclides [6], have been widely used in schools and colleges all over the world. A DGS system enables users to construct objects such as points, lines (or segments, rays and vectors) and circles (or arcs). Users can construct these objects by

simply drawing on the canvas, by classical constructions (ruler and compass), by linear transformations (translation, rotation, dilation, reflection), and by algebraic relationships using coordinates (Cartesian and polar) [2]. Measurements on objects can be made. Computations based on the measurements can be performed and used to define other objects. Loci of moving points and envelopes of moving lines can be defined and drawn, and such curves change shape instantly as adjustments are made to their defining objects (parameters) [2]. More sophiscated objects can be constructed by defining iteration rules to generate a sequence of objects. Mathematical relations (intersecting, tangent, perpendicular, parallel, positional) between objects are maintained while users interactively drag objects. We call what a user constructs in a DGS system as a manipulative. Existing DGS packages are not Web or Internet oriented. They are just stand-alone software in a computer, and manipulatives generated by these DGS packages cannot be easily embedded or viewed in a Web page or shared with other people. JavaSketchPad is an effort to make SketchPad more Internet oriented (section 2.1.3). GeoSVG is designed as a totally Web-based DGS and implemented in SVG. For software developers interested in developing manipulatives, GeoSVG provides a library of modules and a well-designed Application Program Interface (API). For general users, GeoSVG can be used just like a traditional DGS, but can also be run online. Manipulatives generated by GeoSVG can be embedded and viewed in Web pages. Furthermore, the entire GeoSVG authoring environment can be online. GeoSVG also offers other features and advantage over existing DGS. GeoSite is a Web site that provides server-side support for GeoSVG. Registered users can open, edit, and save manipulatives generated by GeoSVG to GeoSite. There is no need to install software in order to publish and deploy manipulatives online. A user can assign the manipulative to a category (Algebra, Fractions, Geometry, ..., 7th Grade, 8th Grade, ...) so that other users can easily find it. An author can also define access controls for the manipulatives created (section 2.1.1). Search over GeoSite is supported. GeoSVG can work closely with WME. Many manipulatives generated by GeoSVG are in use on the WME pilot site [7][8][9][10]. WME delivers classroom-ready lessons that are well-prepared, interesting, effective, as well as interoperable. Lesson pages contain easy to use special-purpose manipulatives to help students understand and explore mathematical concepts and skills through hands-on activities. Manipulatives are parameterized for easy customization and object-oriented for interoperability [8]. GeoSVG generates configurable manipulatives for WME. 2. GeoSVG is Web-oriented A history of Dynamic Geometry Software is given in [11]. Three characteristic features (dragmode, macro-constructions, locus of points) of DGS are presented in [12][13][14][15]. Many researchers have studied how DGS packages are used in teaching and how they affect students [2][16][17][18][19]. The goal of GeoSVG is to support the features expected in a good DGS while providing compatibility and usability for the Web and Internet and support for WME. 2.1 Complete Web Orientation

2.1.1 GeoSite: The server-side surport for GeoSVG An author needs to log into a GeoSite to access the many facilities of GeoSVG such as authoring and configuring manipulatives. Such authentication is not nessary for viewing or interacting with manipulatives. After logging in, a user can create folders and store files. Figure 2 shows My Folders on GeoSite for user tester.
Figure 2: GeoSite – My Folders for user “tester” This user has created four folders: Algebra, Percentage, Plane Geometry and Fractions. Under folder Plane Geometry there are five manipulatives, three of which are local under tester’s account, and two of which are links pointing to other users’ manipulatives. The owner of a local manipulative can edit, configure, and manipulate it. The difference between “Edit” and “Configure” will be discussed later. For a manipulative under another user’s account, a user can only run it, and the “Edit” and “Config” buttons are disabled. A user may copy or link to someone else's manipulatives, and control the accessibility to files and folders by others. Access control levels are:
• Private: Only the author can view the manipulative • Viewable: Other users can view and manipulate the manipulative • Copyable: Other users can copy the manipulative to their own folders

2.1.2 The entire GeoSVG system is online A major limitation of existing DGS packages is that they are stand-alone. A users must install the software package on a computer before using it. It’s a tedious job to install and update software on many computers in labs at a school. By exploiting the Web's native ubiquity, the entire GeoSVG system is accessible online with an up-to-date Web browser. The GeoSVG system consists of two parts, manipulation support and authoring support. Coded in SVG and ECMAScript, the entire GeoSVG source text size is comparable to a medium-sized JPEG file. After logging into GeoSite, a user has full access to the GeoSVG authroing environment. Figure 3 shows the SVG's authoring environment:
Figure 3: GeoSVG Authoring Environment

2.1.3 Manipulatives are online Consider posting a DGS generated manipulative online. This can be done at two levels. A basic level is just to make the manipulative available for downloading. Users run it with their own installed DGS systems. In this way, nothing can be viewed online, and we will not discuss this approach. A more advanced level is to embed a manipulative in a Web page allowing visitors to access and manipulate it online with a Web browser. Moreover, the manipulative in a Web page is not issolated; it is able to interact with other elements in the same page. The solution of current DGS systems such as Cinderella and Geometer’s SketchPad is to export the manipulative from the authoring environment to a Java applet. JavaSketchPad is a companion tool of Geometer’s SketchPad for this purpose. The applet version of the manipulative can then be included in a Web page. Disadvantages of this approach are
1) The applet version of the manipulative usually does not capture the full range of functions available in the DGS. Geometer’s SketchPad is such an example. The applet supports only a small subset of the mathematical functions and capabilities of the Geometer's Sketchpad [20], which is unable to export drawing functions and user input functions to the Applet.
2) The Applet may be large if it has most of the capacities of the DGS. 3) Users need to have the ability and time to publish a Web page .
In contrast, GeoSVG created manipulatives, together with manipulation support, can be easily deployed in a Web page. When the user chooses “save”, GeoSVG sends an HTTP request to the back-end server to store the manipulative on the back-end server. Later, the manipulative can be opened again for editing. Manipulatives may be classified (Algebra, Fractions, Geometry, ..., 7th Grade, 8th Grade, ...) for ease of search. A maniplative can be saved together with one or more support functions (section 3.1). Unlike applets, even if all support functions are exported, the size of a manipulative remains moderate because of the text-based vector graphics encoding. All the manipulatives in the server are stored in a hierarchical structure, and can be accessed by a standard URL in the form http://GeoSite-server-name/user-name/directory/manipulative-name, where GeoSite-server-name is the back-end GeoSite server name, user-name is the username of the author of the manipulative, directory is created by users in a user adminstration page, and manipulative-name is the name given to the manipulative by the author. This way, the manipulative is included in a Web page by a simple URL. And it is made available for everyone to use on the Web immediately. Visitors do not need to log in, to search a GeoSite for manipulatives. They can search in two ways: by categories or by folders. GeoSite provides convenient functions to the logged-in user. Figure 4 shows the user tester manipulating his own manipulative Triangle. Buttons Edit and Configure are provided. Clicking Edit button will go to the authoring environment, while clicking Configure button will go to the configiration page (section 2.2 ). Figure 5 shows tester accessing a manipulative Trapezoid from user1. Buttons Copy to My Folder is provided. Clicking the button will ask the user tester which folder he wants to copy the manipulative to. It is also possible to embed a manipulative in a Web page without using a hyperlink to a GeoSite. Just add this piece of code to an HTML file:

<embed height="301" width="501" pluginspage="http://www.adobe.com/svg/viewer/install/" src="http://GeoSite-server-name/user-name/directory/manipulative-name.svg" name="name" id="id"> </embed> The width and height values can be obtained in the authoring environment.
Figure 4: When a user is manipulating a manipulative under his own account, “Edit” and “Configure” functions are activated 2.2 Seperate views of manipulatives during different phases Logically, usage of a DGS system should be divided into three phases: authoring phase, configuration phase, and manipulation phase. • At the authoring phase, a user who is familiar with the software construct all the objects he
wants. After this phase, all the constructions together is called a manipulative.

Figrue 5: When a user is manipulating another user’s manipulative, “Copy to My Folder” function is activated.
• At the configuration phase, a second user can tune the manipulative to a desirable
configuration. For example, user 1 at the authoring phase designs a coordinates system, then user 2 at the configuration phase wants to set different maximum and minimum of x. We should not require a user at the configuration phase to be familiar with the software.
• At the manipulation phase, a user can manipulate the manipulative. Manipulation varies from
simple operations such as mouse-dragging-objects, entering-input-box to sophiscated operations as those at the authoring phase. An author at the authoring phase should define what operations are allowed for users at the manipulation phase depending on their ability and the objective of the manipulative. For example, a teacher wants students to understand triangles. If the students knows nothing about the software, the teacher can draw a triangle in advance at the authoring phase, and ask the the students to drag the vertices or edges at the manipulation phase. If the students knows more, the teacher can export the functions of drawing points and lines to the manipulative, and ask the students to draw a triangle themselves.

From the view of a school, users of these three phases correspond to three groups of users in a school: teachers who are very familar with the software, other teachers who want to use the manipulative, and students.
Figure 6: Configuration Page for Manipulative “Triangle” Unfortunately, current DGS does not explicitly define these three phases. Since most of current DGS packages are not Web-oriented, designers neglected the need to seperate three phases at the beginning. Consequently, three groups of users all need to know how to use the software to some
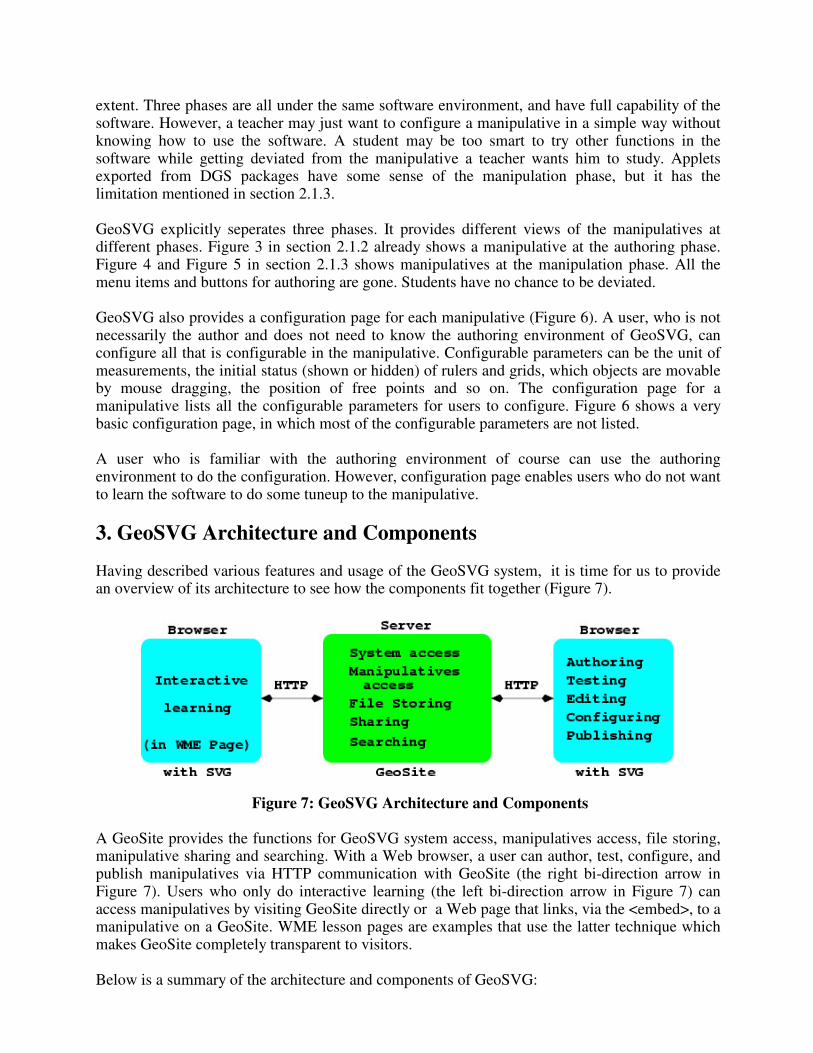
extent. Three phases are all under the same software environment, and have full capability of the software. However, a teacher may just want to configure a manipulative in a simple way without knowing how to use the software. A student may be too smart to try other functions in the software while getting deviated from the manipulative a teacher wants him to study. Applets exported from DGS packages have some sense of the manipulation phase, but it has the limitation mentioned in section 2.1.3. GeoSVG explicitly seperates three phases. It provides different views of the manipulatives at different phases. Figure 3 in section 2.1.2 already shows a manipulative at the authoring phase. Figure 4 and Figure 5 in section 2.1.3 shows manipulatives at the manipulation phase. All the menu items and buttons for authoring are gone. Students have no chance to be deviated. GeoSVG also provides a configuration page for each manipulative (Figure 6). A user, who is not necessarily the author and does not need to know the authoring environment of GeoSVG, can configure all that is configurable in the manipulative. Configurable parameters can be the unit of measurements, the initial status (shown or hidden) of rulers and grids, which objects are movable by mouse dragging, the position of free points and so on. The configuration page for a manipulative lists all the configurable parameters for users to configure. Figure 6 shows a very basic configuration page, in which most of the configurable parameters are not listed. A user who is familiar with the authoring environment of course can use the authoring environment to do the configuration. However, configuration page enables users who do not want to learn the software to do some tuneup to the manipulative. 3. GeoSVG Architecture and Components Having described various features and usage of the GeoSVG system, it is time for us to provide an overview of its architecture to see how the components fit together (Figure 7).
Figure 7: GeoSVG Architecture and Components
A GeoSite provides the functions for GeoSVG system access, manipulatives access, file storing, manipulative sharing and searching. With a Web browser, a user can author, test, configure, and publish manipulatives via HTTP communication with GeoSite (the right bi-direction arrow in Figure 7). Users who only do interactive learning (the left bi-direction arrow in Figure 7) can access manipulatives by visiting GeoSite directly or a Web page that links, via the <embed>, to a manipulative on a GeoSite. WME lesson pages are examples that use the latter technique which makes GeoSite completely transparent to visitors. Below is a summary of the architecture and components of GeoSVG:

• GeoSite support (described in section 2) • Authoring support
o Basic tools: drawing points, lines, circles directly on Canvas o Construction tools: constructing a new geometric object by combining existing
objects subject to user-specified rules and constraints. For example, picking a point and a line to construct a new line through the point parallel to the existing line.
o Measurement: Measuring length, slope, radius, distance, area, circumference, perimeter, angle, coordinate positions.
o Loci and Envelops: Constructing loci of moving points and envelops of moving lines o Animation: Visualizing the movement of objects to illustrate concepts much better
than still pictures. o Iteration: Generating a sequence of objects according to iteration rules defined by a
user o Calculation: A dynamic calculator updates results when statuses of dependent objects
change. o Graph: Plotting points and function graph in coordinate systems. o Transform: Allowing users to define center and mirror for translation, reflection,
dilation , and rotation of objects. o Macro: Condensing a series of steps in to one software command o User Input: Allowing user to enter data from which new objects are constructed. o Buttons: Making a variety of events available for the user.
• The ability to export to manipulatives any set of menu functions of GeoSVG. The GeoSVG authoring environment provides many menu functions, each of whcih can be exported as a button to a manipulative. Thus, an author may choose to include none, some, or all authoring environment capabilities for a particular manipulative. Normally authoring specific functions are not included in manipulatives to simplify the learning interface and to avoid distractions while learning. Exported buttons in a manipulative act the same way as the corresponding menu options in the authoring environment. • Manipulatives generated by GeoSVG are self-contained and directly usable online Manipulatives are available online immediately after it’s composed. Section 2.1.3 also introduces how to embed a manipulative in a Web page by linking it on the GeoSite. A manipulative is saved on GeoSite as filename.svg along with filename.es and serveral other system script files. A manipulative is self-contained, and can be used from anywhere on the Web.
Figure 8: Manipulatives are self-contained

Figure 8 shows the components of a manipulative. It has a .svg file and a .es script file. Objects in the manipulative follow a standardized interface for configuration. Basic support for manipulation, animation and computation are included in the manipulative. Additional functions are selectively included by the author and appear in the form of buttons. 4. GeoSVG defines a library of classes and APIs However powerful, a DGS is unlikely to provide for everything a user may need. For instance, existing DGS packages are unable to generate animation of a wolf walking along a number line. Existing DGS packages have lots of useful modules that can be reused, but they don’t provide APIs to give software developers a systematic way to add enhancements. GeoSVG organizes its classes as reusable modules and provides APIs for software developers. This example shows how to add an x-axis to the manipulative. The global variable canvas refers to the canvas on which all the objects are created. origin = new Origin( 300, 120 ); // origin position in pixels canvas.addObject( origin ); // add origin to the canvas origin.setVisible( false ); // set origin invisible axis = new Axis( origin, “x” ); // new x axis canvas.addObject( axis ); // add axis to the canvas axis.setPixelsPerUnit( 10 ); // set unit length of the axis axis.setMinimum( -26 ); // set minimum of the axis axis.setMaximun( 26 ); // set maximum of the axis The manipulative in Figure 9 is developed by using these APIs.
Figure 9: Manipulative developed by using APIs provided by GeoSVG

5. Assistant objects as building blocks In current DGS, all the objects are constructed from a very clear mathematical meaning. This is also a disadvantage. It’s very complicated to duplicate a construction that contains a group of objects in current DGS if the duplication is required to satisfy the following conditions.
1) The duplicated construction is always the same as the original one. Whenever the original one changes, the duplicated one changes accordingly.
2) The duplicated construction can be moved anywhere while maintaining the relation with the original one.
3) The duplicated construction is rotatable around at least one point while maintaining the relation with the original one.
These are very basic requirements for duplication. However, no existing DGS can meet these requirements, especially the one on rotation. Basically, the difficulty comes from the fact that all objects are geometrical. GeoSVG provides certain special objects that are not strictly geometrical but very useful as building blocks for object construction. In the example shown in Figure 10, the vertices for the duplicated triangle are special objects: a Pivot Point (A2) and two Copy Points. The duplicated construction is rotatable around point A2. GeoSVG will calculate the position of all the Copy Points relative to the Pivot Point whenever there is a status change, which can be the move of the original construction, or the translation or rotation of the duplicated construction.
Figure 10: Duplication of a construction
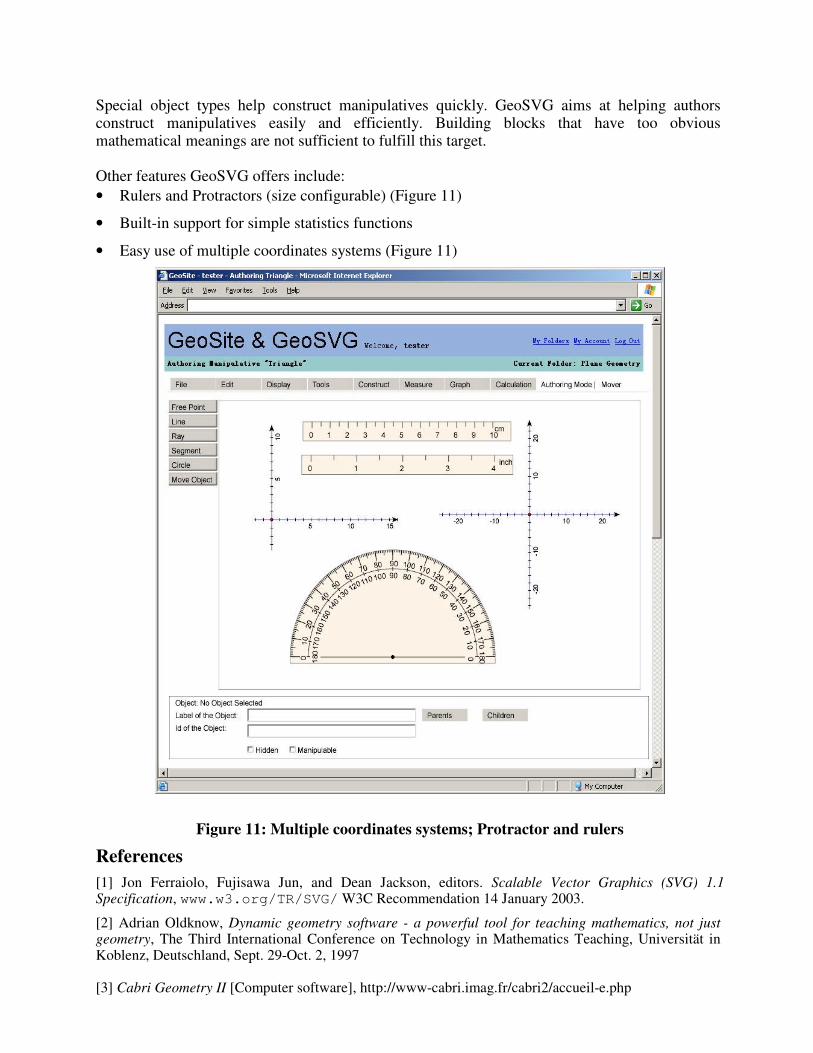
Special object types help construct manipulatives quickly. GeoSVG aims at helping authors construct manipulatives easily and efficiently. Building blocks that have too obvious mathematical meanings are not sufficient to fulfill this target. Other features GeoSVG offers include: • Rulers and Protractors (size configurable) (Figure 11)
• Built-in support for simple statistics functions
• Easy use of multiple coordinates systems (Figure 11)
Figure 11: Multiple coordinates systems; Protractor and rulers
References [1] Jon Ferraiolo, Fujisawa Jun, and Dean Jackson, editors. Scalable Vector Graphics (SVG) 1.1 Specification, www.w3.org/TR/SVG/ W3C Recommendation 14 January 2003.
[2] Adrian Oldknow, Dynamic geometry software - a powerful tool for teaching mathematics, not just geometry, The Third International Conference on Technology in Mathematics Teaching, Universität in Koblenz, Deutschland, Sept. 29-Oct. 2, 1997 [3] Cabri Geometry II [Computer software], http://www-cabri.imag.fr/cabri2/accueil-e.php

[4] Jackiw, N., (1995). The Geometer’s Sketchpad, [Computer software], Emeryville, CA: Key Curriculum Press. [5] Cinderella [Computer software], http://www.cinderella.de/tiki-index.php [6] Euclides [Computer software], http://www.euklides.hu/eng/euklides.htm [7] WME Pilot Project, http://wme.cs.kent.edu/, Department of Computer Science, Kent State University [8] (Six authors). Features and Advantages of WME: a Web-based Mathematics Education System, submitted to IEEE SoutheastCon 2005. [9] Michael Mikusa, Paul S. Wang, David Chiu, Xun Lai, Xiao Zou. Web-based Mathematics Education Pilot Project, Conference on Information Technology in Education, Elizabethtown College Elizabethtown, PA, September 18, 2004. [10] Paul S. Wang, Yi Zhou and Xiao Zou. Web-based Mathematics Education: MeML Design and Implementation, Proceedings of IEEE/ITCC’2004, April 5-7 2004, Las Vegas, Nevada, pp. 169-175 [11] Daniel Scher, Lifting the Curtain: The Evolution of The Geometer's Sketchpad, Mathematics Educator, Vol. 10, Num 2, pp. 42-48 [12] Rudolf Sträßer, Research on Dynamic Geometry Software (DGS) - an introduction, International Reviews on Mathematical Education, Vol. 34 Num. 3, June 2002 [13] Ferdinando Arzarello; Federica Olivero; Domingo Paola; Ornella Robutti, A cognitive analysis of dragging practises in Cabri environments, International Reviews on Mathematical Education, Vol. 34 Num. 3, June 2002 [14] Gert Kadunz, Macros and Modules in Geometry, International Reviews on Mathematical Education, Vol. 34 Num. 3, June 2002 [15] Ana Paula Jahn, "Locus" and "Trace" in Cabri-géomètre: relationships between geometric and functional aspects in a study of transformations, International Reviews on Mathematical Education, Vol. 34 Num. 3, June 2002 [16] Thomas Gawlick, Towards a Theory of Visualization by Dynamic Geometry Software Paradigms, Phenomena, Principles, TSG 16: Visualisation in the teaching and learning of mathematics, http://www.icme-organisers.dk/tsg16/ [17] I�ıl Üstün and Behiye Ubuz, Student’s Development of Geometrical Concepts Through a Dynamic Learning Environment, TSG 16: Visualisation in the teaching and learning of mathematics, http://www.icme-organisers.dk/tsg16/ [18] Kent D. Steen, Analyzing the impact of Web-based geometry applets on first grade students, Dissertation, University of Nebraska, Lincoln, Nebraska, 2002 [19] Alex Sandro Gomes and Gerard Vergnaud��On the Learning of geometric concepts using Dynamic Geometry Software, http://www.cinted.ufrgs.br/renote/mar2004/artigos/40-alexGomes.pdf, Interdisciplinary Center of New Technology in Education [20] Major Differences between JavaSketchpad and Desktop Sketchpad, http://www.keypress.com/sketchpad/javasketchpad/differences.php [21] Andrew H. Watt, Chris Lilley, SVG Unleashed, Sams; 1st edition