an update on hearing aid testing reading speech-maps or splograms niki timar, audiologist vancouver...
TRANSCRIPT

An Update on Hearing Aid Testing
Reading Speech-Maps or SPLograms
Niki Timar, Audiologist
Vancouver Island Health Authority – South Island

Background
• Audiologists used to routinely test hearing aids in the booth, using aided audiograms


Background
• Research has shown aided audiograms are not a good way to test modern hearing aids
• BC Public Health is switching over to the newer way of testing, using Real-Ear or simulated Real-Ear measures
• This is why you might not be receiving aided audiograms recently

What is a SpeechMap or SPLogram?
• A graph showing hearing thresholds, maximum safe or acceptable levels, and the performance of the hearing aid
• “Speechmap” is the proprietary term Audioscan uses for their software
• “SPLogram” is a term coined by Richard Seewald and his group, from the University of Western Ontario, for use with the Desired Sensation Level (DSL) hearing aid prescription formula

Audiogram on Speechmap Screen
Normal Hearing
“Speech Banana”
Hearing Thresholds
In dB Hearing Level (HL)

Speechmap or SPL-o-gram
In dB Sound Pressure Level (SPL)
Normal Hearing
“Speech Banana”
Hearing Thresholds

Soft
Loud
In dB
Sound Pressure Level
NOT Hearing Level
Difference Between Speechmap and Audiogram
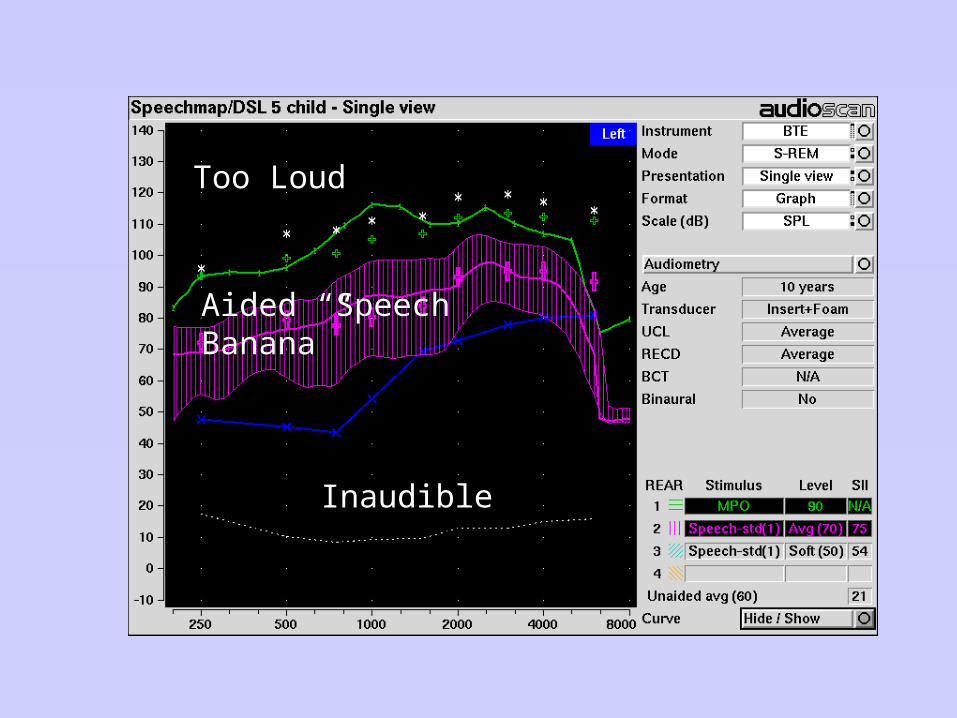
Inaudible
Aided “Speech Banana”
Too Loud

Why Not Aided Audiograms?
• Aided audiograms only show one thing: the response of the hearing aid to very soft sounds
• Aided audiograms do not tell anything about how loud the hearing aid is, and whether it is potentially damaging to a child’s hearing


Real-Ear Testing
• Instead of Aided testing in the booth, we now rely on Real-Ear Testing as our main hearing aid test

What is Real-Ear Testing?
• Real-Ear testing is objective testing with the hearing aid in the ear.
• Basically, we place a microphone in the ear just past the hearing aid, and measure what the actual output of the hearing aid is, close to the eardrum


Why the Changes in Methodology?
A Short Lesson on Hearing Aid Technology
Hearing Aids
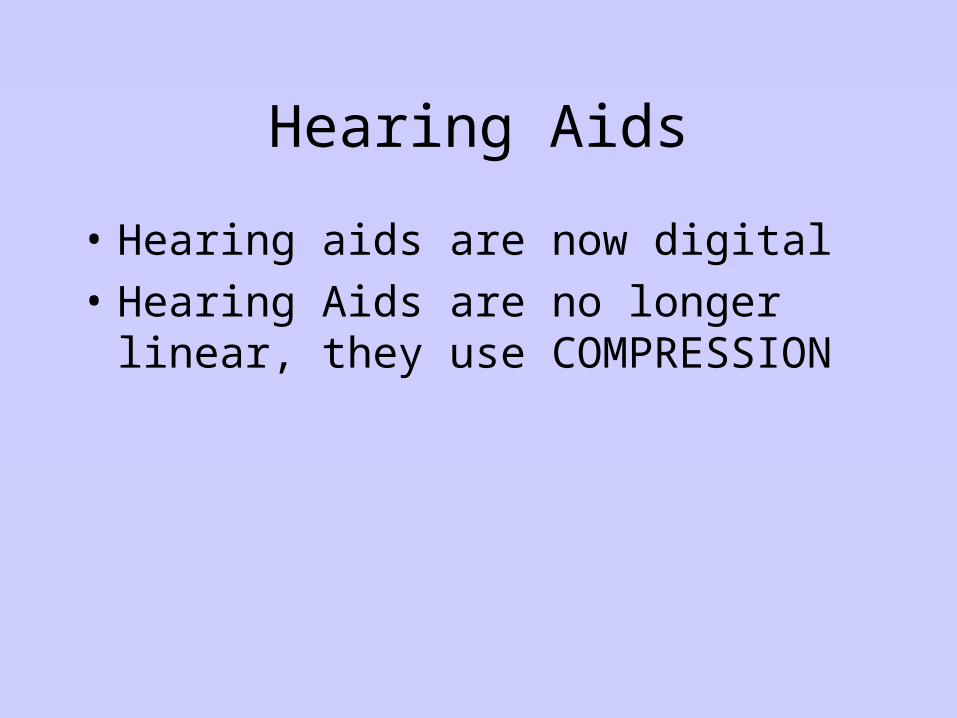
• Hearing aids are now digital
• Hearing Aids are no longer linear, they use COMPRESSION

Dynamic Range
• One important concept for understanding compression and hearing aid function is DYNAMIC RANGE
• This is the range of usable hearing for a given individual – between the quietest sounds they can hear (hearing thresholds) and the loudest sounds they can tolerate (loudness discomfort levels)

Dynamic Range
Hearing Thresholds
Maximum Output
HL

Hearing Thresholds
Dynamic Range
Maximum Output SPL

Linear Hearing Aids
• Until the 1980’s, hearing aids were linear
• They added the same amount of amplification, no matter how loud the input sound

Linear Amplification
• 140
• 120
• 100
• 80
• 60
• 40
• 20

Peak Clipping
• 140 dB is dangerously loud for most people
• To keep the sound levels safe, hearing aids used Peak Clipping – they just stopped at a given level – for example, they wouldn’t make anything louder than 120 dB
• This caused DISTORTION in the hearing aids

Peak Clipping
• 140
• 120
• 100
• 80
• 60
• 40
• 20

Compression
• In the 1980s, as a way to keep sounds comfortable but undistorted, manufacturers started using compression limiting
• Instead of amplifying the same amount no matter what the input, for sounds approaching the limit, less amplification would be used

Compression
• 140
• 120
• 100
• 80
• 60
• 40
• 20

Even Newer Advances
• As technology advanced, it became possible to have different compression levels for different frequency ranges, and for different intensities
• This is where digital hearing aids shine, as more capability can be added in these functions, without adding size or battery drain

So What Does This Have to Do With Speechmap?
• Testing just quiet sounds in the booth does not tell us about what the hearing aid does to speech
• Digital hearing aids often have noise suppression, which makes quiet, non-speech-like sounds even quieter, to avoid amplifying annoying sounds like fridges humming
• Aided audiograms are tested using quiet, non-speech-like sounds (tones)


Limitation of Aided Audiogram
• This slide shows the hearing aid’s response to quiet non-speech tones
• We can infer how much speech the child can hear, but it does not show differing performance for soft, versus loud, speech
• It does not tell us if the hearing aid is too loud, or if there is distortion
• There are no targets, so we don’t know if this is a “good” fitting


• The Speechmap shows soft speech, loud speech and very loud sounds, showing, in this case, that they all give acceptable responses
• It also shows Speech Intelligibility Index (SII), which predicts how much of the speech signal is audible for a given input

• You may also see Speechmap tables, depending how your local audiologist likes to look at things:


• The Speechmap shows clearly the limitations of what can be achieved with hearing aids for difficult fittings
• This keeps us from trying to increase the volume where it does not help, and would only cause feedback problems

