an update on toyota's fuel cell vehicle activities
TRANSCRIPT

November 04, 2009
Robert WimmerToyota Motor North America
An Update on Toyota’s Fuel Cell Vehicle Activities
Hydrogen and Fuel Cell Technical Advisory Committee

Issues that Influence Automobile Business
Petroleum Supply
Balance of Trade
Climate Change
Energy Security
BiofuelsGreen Electricity
Natural Gas
Improved EfficiencyLow Carbon Fuels
Fuels from Domestic Feedstocks
Fuels from Domestic Feedstocks
Energy & FuelDiversification
Life CycleCO2 Reduction
Reduce Imported Fuel
Reduce Imports from Unfriendly Countries
Issues Action Potential Solution

Hybrid is First Step
TOYOTA MODELS
Camry Hybrid Midsize 4 Door
GS450h Premium Sport Sedan LS600h
Flagship
LEXUS MODELS
Highlander Hybrid Midsize SUV
Averaging over 20,000 hybrids sold per month in 2008
Prius Midsize 5 Door RX450h
Luxury SUV
HS250hMidsize Sedan

Cumulative Hybrid Sales
0.0
0.5
1.0
1.5
2.0
2.5
1997 1998 1999 2000 2001 2002 2003 2004 2005 2006 2007 2008
Cum
ulat
ive
Sale
s in
Mill
ions
The Big Picture
*Toyota Estimate
Global Energy Benefits to Date*
• Over billion gallons of gasoline saved• Over 10 million tons of CO2 avoided
US Sales1,000,000
Global Sales1,800,000
Jan-June2009
New technologies must be produced in large volumes to make a meaningful impact

FCHV-adv
EV
Gasoline HV(Prius)
Natural gas
Natural gasHydrogen (70MPa)
Combined cycle power generation
ElectricityCrude oil
Refine
Gasoline
50% 50% 20%
Well-to-Tank Tank-to-Wheel Well-to-Wheel
84%
67%
Energy pathway
Gasoline ICECrude oilRefine
Gasoline
84% 19%23%
40%*1
*1 Tank-to-Wheel efficiency: measured in the Japanese 10-15 test cycle*2 Difference of Well-to-Tank efficiency between 35MPa and 70MPa: approx. 2%
40%
39%
*1
34%
33%
40%
85%
59%
(Toyota Calculation)
*2Reforming with membraneseparation
Comparison of Energy Efficiency
FCs are tough to beat for well-to-wheels efficiency

Present 2015
’02 FCHV(lease model)
Vehicle
210km 230km 500km or more
15 years or more
Dec. 2002 ~ Jul. 2005 ~
0degC ~
Toyota FCHV Progress
’08 FCHV-adv (lease model)
1/10 or less (design / materials)
* Fuel Cell Commercialization Conference of Japan
’05 FCHV(lease model)
Technical Challenges
2. Actual Cruising Range
1. Cold Start / Driving Capability
3. FC Stack Durability
4. Cost reduction
0degC~
FCCJ* / DOE Target
-30degC
Commercial Introduction M
ass
Prod
uctio
n
Toyota is making excellent progress resolving technical challenges

Overall length/ width/ height (mm) 4,735/ 1,815/ 1,685 Type Pure hydrogen
Max. speed (mph) 96 Storage system High-press. H2 tank
Cruising range (mile) Max. storage pressure (MPa)Vehicle 455
*170
Fuel
Fuel economy (mile/kg H2)Tank capacity(kg H2) 6.0 (35 degC)
*1 in LA#4 cycle
72.4 *1
FCHV-adv

Motor BatteryHybrid Technology
Power control unit
High pressurehydrogen tank
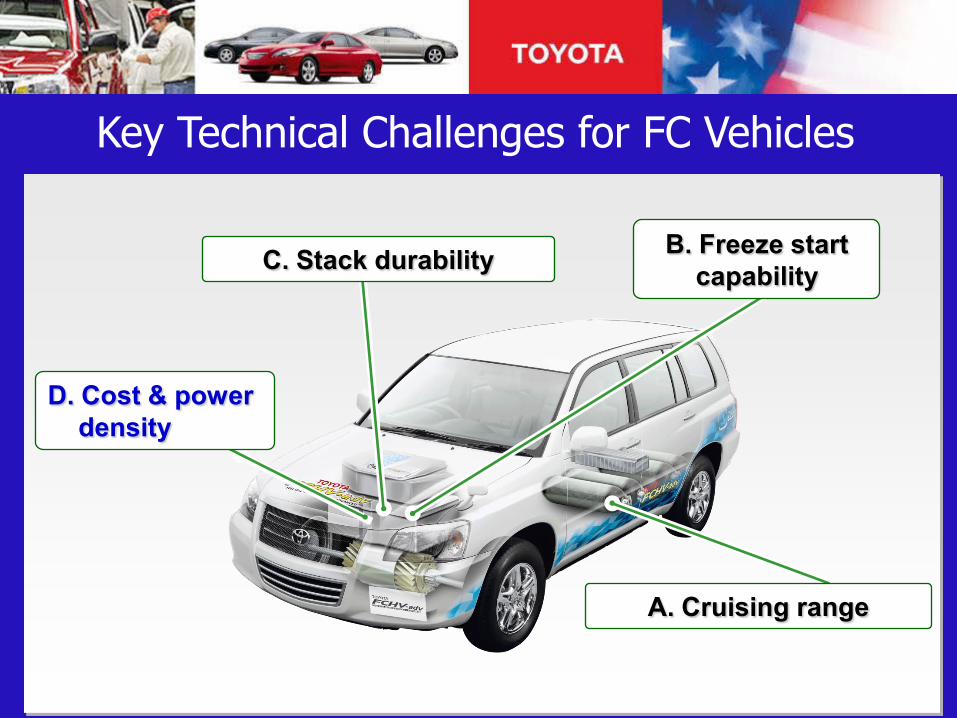
TOYOTA FC Stack
Fuel Cell System Technology
Fuel Cell System Technology

C. Stack durability
A. Cruising range
B. Freeze start capability
D. Cost & power density
Key Technical Challenges for FC Vehicles

Test cycle FCHV-adv
LA#4 455 miles
Japanese 10・15
in-house test516 miles
FCHV-adv has achieved an practical cruising range of well over 300 miles
0
20
40
60
0 20 40 60Load (%)FC
sys
tem
effi
cien
cy (%
)
FCHV
FCHV-advFCHV-adv: improved FC system efficiency at all loads
Increased regenerative energy
Improved vehicle efficiency (fuel economy)
64%
Prac
tical
fuel
eco
nom
y (m
ile/k
g)To
yota
in-h
ouse
test
cyc
le
On-board H2 (kg)
50
60
2.0 3.0 4.0 5.0 6.0 7.0(137miles,η 46%) η: Vehicle efficiency (LA#4)
FCHV-adv
FCHV
(329miles,η 58%)
45
55
65
Fuel economy+ 23%
On-board H2+ 94%
Cruising Range Improvement

Fairbanks to Vancouver• 2300 miles• Over 300 miles / tank• No mechanical problems
FCHV-adv Real-World Range
Rush Hour in Los Angeles• 2 FCHVs• Over 400 miles / tank• 68.3 miles/kg of H2

C. Stack durability
A. Cruising range
B. Freeze start capability
D. Cost & power density
Key Technical Challenges for FC Vehicles

°°CC
- 40
- 30
- 20
- 10
0
10
外気温
[℃]
2/102/10 2/122/12 2/142/14 2/162/16 2/182/18
--3737degdegCC
Am
bien
t Air
Tem
p.A
mbi
ent A
ir Te
mp. 1010
((degdegCC))
00
--1010
--2020
--3030
--4040
5050
32322020
00
--2020
--4040
((degdegFF))
2/82/8DateDate
Ambient Air Temperature at Timmins
Timmins, Canada
Yellowknife, Canada
Demonstrated Cold Start Capability
Cold weather performance similar to conventional vehicles

Measures important for cold start capability:A) Optimum purge to reduce remaining water B) Increase of water storage capacity C) Accelerating stack temperature rise
Water storage capacityA) Purge
: Amount of generated water before exceeding 0 degC
Exceed 0 degC Succeed in
starting
B) Increase water storage capacity
Management of water when starting at subfreezing temperature
After starting @ 0deg C<=
After Shutdown
After purging
Amou
nt o
f wat
er in
a c
ell
C) Accelerate stack temperature rise
Fail to exceed 0 degCFail to start
Cold Start Countermeasures

C. Stack durability
A. Cruising range
B. Freeze start capability
D. Cost & power density
Key Technical Challenges for FC Vehicles

MEA durability is steadily improving under real-world conditions
Stack Durability
Max
imum
M
axim
um
Out
put
Out
put
Cro
ssov
er
Cro
ssov
er
Am
ount
Am
ount
252500
MEA1MEA1 MEA2MEA2
MEA1MEA1
MEA2MEA2MEA3MEA3
MEAMEA44
MEAMEA44
20201515101055
MEA3MEA3
Reduction of physical deterioration
Reduction of chemical
deterioration
Threshold Threshold limit valuelimit value
Threshold Threshold limit valuelimit value
Durability (year equivalent)Durability (year equivalent)
Toyota FC Stack Durability

60
70
80
90
100
Running Distance [ mile ]0 100,000 300,000200,000
Syst
em O
utpu
t [ %
]
312,000 mile;25years equivalent
FC system Bench
Average speed : 40 mile/h
30 min / cycle
Driving Cycle Pattern of Test
Spee
d [ k
m/h
]
FC System Durability
Testing indicates linear degradation to the equivalent of 25 years

1. Degradation due to potential change at starting1. Degradation due to potential change at starting
8080
8585
9090
9595
100100
Number of Start & StopNumber of Start & Stop
Stac
k ou
tput
[%
]St
ack
outp
ut [
%] 0V 0V ⇔⇔ 0.85V0.85V
0V 0V ⇔⇔
OCVOCV
1.01.0
Start of operationStart of operation
TimeTime
Cel
l Vol
tage
[V]
Cel
l Vol
tage
[V]
00
0.850.85
Votage at start-up and shutdown must be managed
Degradation During Start-up & Shutdown

75
80
85
90
95
100
0 80 160 240 320 400Number of ON/OFF at subfreezing temp.
75
80
0 5
Catalyst layer
Membrane
Delaminated
Deteriorated condition (sample)
Stac
k ou
tput
[%]
Must minimize degradation from cold starts
Cold Start Degradation

Next steps:Develop countermeasures to enhance durability
Reduce start/stop and cold start degradation
Confirm correlation between laboratory and field test data
Confirmed system durability of FCHV-adv: 25-year equivalent durability on crossover
Approximately 70% of initial performance after the equivalent of 25 years operation
FC Stack Durability Summary
C. Stack durability
A. Cruising range
B. Freeze start capability
D. Cost & power density
Key Technical Challenges for FC Vehicles

Reducing costsBy innovative design, material, manufacturing engineering
’05 Model FCHV
By mass production
’08 ModelFCHV-adv
Model generation
Model generation
Resolving technical issues
1/10
1/10
FCHV Cost Reduction

(2) Materials: Reduce the cost of FC-system-specific materials=> Important to cooperate with
materials manufacturers
(1) Design 1. Simplify the system2. Downsize and reduce weight
of FC stack
TOYOTA FCHV
(3) Improve production technology
Approaches to FCHV Cost Reduction

TOYOTA FC Stack
(1) Design: Downsize & reduce weight(minimize materials)
1. Increase output density2. Reduce number of parts3. Improve joint/seal method4. Decrease Pt catalyst loading
(2) Material: Improve durability & reduce cost
1. Electrolyte membrane2. Separator (incl. surface treatment)3. GDL, etc.
Current Density [A/cm2]
Cel
l Vol
tage
[V]
Current density x2 with ½ electrode area
Halve cell materials used
Max. output
FC Stack Cost Reduction

Efficiency Goal
Current Status
Power Density
- Improvement of catalyst activity- Crossover reduction- Contact resistance reduction- Improvement of proton conductivity
-Improvement of gas diffusivity-Water management
Current Density (A/cm2)
Cel
l Vol
tage
(V)
Trilemma of Electrode Catalyst(1) Reduction of precious metal amount (Pt 1/10)(2) Higher performance
(High voltage / High output density)(3) Durability improvement
(200,000km for 15 years or more)
Must solve electrode catalyst “trilemma” to achieve FC stack cost targets
Electrode Catalyst “Trilemma”

(1) Reduce CFRP used (by making thinner)- Optimize laminar structure (hoop winding / helical winding)- Optimize L/D- Optimize boss size
(2)Reduce cost of CFRP- Aviation grade => general-purpose grade- Develop low-cost CFRP for high-pressure tank
Cross-section of tank body
Liner(for H2 sealing)
CFRP(for resistance to H2 gas pressure)
Tank dimension
L
ØD
Tank dimension
L
ØD
Hydrogen Tank Cost Reduction
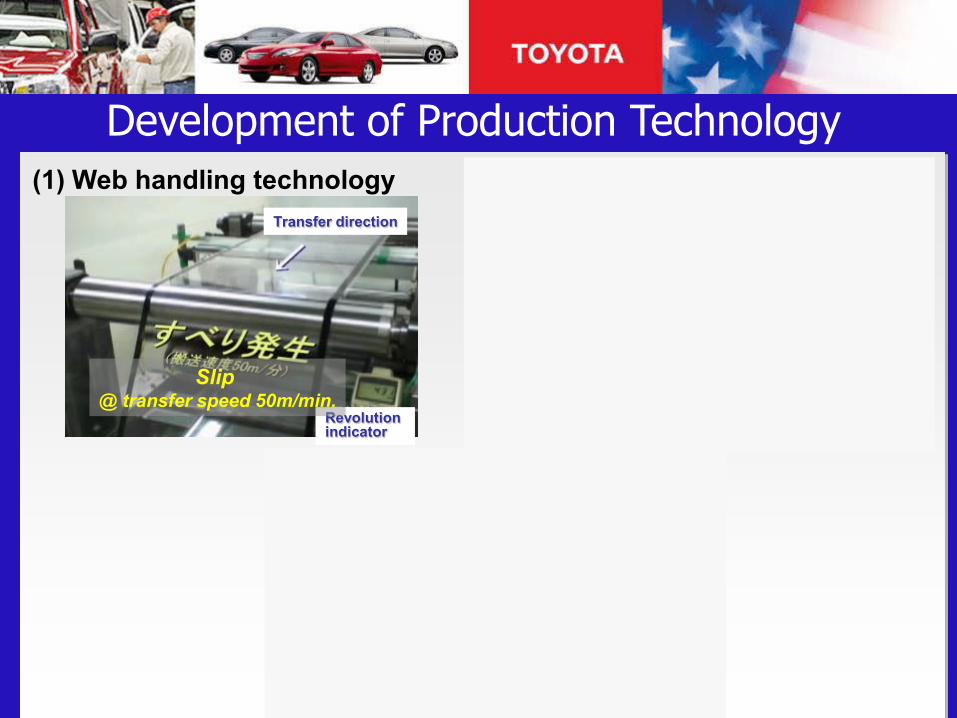
(1) Web handling technology (2) One-by-one handling technology
(3) 70 MPa hydrogen tank
Bernoulli Chuck
Cell
Before transferAfter transfer
Transfer robot
Transfer direction
Revolution indicator
Slip @ transfer speed 50m/min.
Development of Production Technology

Commercialization
Basic research
Valley of deathSource of pictures: each automaker’s web site (excluding TOYOTA FCHV)
FC development is more than half way over the “Valley of Death”
Progress of FC Technology Development

Solar / biomass
Electricity
Petroleum
Natural Gas
Coal
• Production• Storage method•CO2 Stabilization•Cost
• Transportation Method• Infrastructure Development•Codes & Standards•Hydrogen Delivery Cost
• Stack Durability• Power Density• Freeze Start Capability•Driving Range• Vehicle Cost
Car makersGovernment, Energy Suppliers
Hydrogenatedcompounds Hydrogen
Production Delivery, Supply Vehicle
Issu
es
Issu
es
Issu
es
Steps for Commercialization

California Infrastructure Concern
020406080
100120140160180200
2000
2002
2004
2006
2008
2010
2012
2014
Year
# of
H2 S
tatio
ns
0
1000
2000
3000
4000
5000
# of
veh
icle
s, O
EMs
tota
lH
2 Sta
tion
Cap
acity
Expected H2 Station # and Capacity ( serving vehicle #)
Expected FC Vehicle# based on current ZEV requirement
Assumption:One H2 station serves 25 FC vehicles
By the 2012, the demand for H2 stations will far exceed supply if station deployment is not accelerated

Conclusions• Hydrogen is one of the future fuels Toyota is pursuing
• We continue to devote considerable resources to bringing a FC vehicle to market in the 2015 time frame– Cold start & range issues are mostly resolved
– Durability & cost challenges remain
• “Green” fuels and high volumes are required for meaningful GHG benefit
• Deployment of hydrogen refueling infrastructure must accelerate for fuel cell vehicles to succeed

Thank You!