an xist-dependent protein assembly mediates localization ... · 3 mechanistically, xist is thought...
TRANSCRIPT

1
An Xist-dependent protein assembly mediates Xist localization and gene silencing Amy Pandya-Jones1, Yolanda Markaki1,4, Jacques Serizay1#,, Tsotne Chitiashvilli1,5, Walter Mancia1##,, Andrey Damianov2, Costantinos Chronis1, Bernadett Papp1,###, Chun-Kan Chen3, Robin McKee1, Xiao-Jun Wang2, Anthony Chau1, Heinrich Leonhardt4, Sika Zheng2####, Mitchell Guttman3, Douglas. L. Black2,5* and Kathrin Plath1,5* 1. Department of Biological Chemistry, University of California, Los Angeles, Los Angeles, CA
90095, USA 2. Department of Microbiology, Immunology and Molecular Genetics, University of California,
Los Angeles, Los Angeles, CA 90095, USA 3. Division of Biology and Biological Engineering, California Institute of Technology, Pasadena,
CA 91125, USA 4. Department of Biology and Center for Integrated Protein Science, LMU Munich, 82152
Munich, Germany 5. Molecular Biology Institute, Jonsson Comprehensive Cancer Center, Brain Research Institute,
Graduate Program in the Biosciences, Eli and Edythe Broad Center of Regenerative Medicine and Stem Cell Research, David Geffen School of Medicine at the University of California Los Angeles, Los Angeles, CA 90095, USA
* Correspondence to: [email protected] and [email protected] # École Normale Supérieure de Cachan, Université Paris-Saclay, Saclay, France. Current Address: The Gurdon Institute and Department of Genetics University of Cambridge, Cambridge CB2 1QN, United Kingdom ## Current Address: Department of Neurological Surgery, University of California San Francisco, San Francisco, CA 94143, USA ### Current Address: Department of Oral Biology, College of Dentistry, University of Florida, Gainesville FL 32610, USA. #### Current Address: Division of Biomedical Science, University of California, Riverside, Riverside, CA 92521, USA
author/funder. All rights reserved. No reuse allowed without permission. The copyright holder for this preprint (which was not peer-reviewed) is the. https://doi.org/10.1101/2020.03.09.979369doi: bioRxiv preprint
2
Summary Nuclear compartments play diverse roles in regulating gene expression, yet the molecular forces
and components driving compartment formation are not well understood. Studying how the
lncRNA Xist establishes the inactive-X-chromosome (Xi)-compartment, we found that the Xist
RNA-binding-proteins PTBP1, MATR3, TDP43, and CELF1 form a condensate to create an Xi-
domain that can be sustained in the absence of Xist. The E-repeat-sequence of Xist serves a
multivalent binding-platform for these proteins. Without the E-repeat, Xist initially coats the X-
chromosome during XCI onset but subsequently disperses across the nucleus with loss of gene
silencing. Recruitment of PTBP1, MATR3, TDP-43 or CELF1 to DE-Xist rescues these
phenotypes, and requires both self-association of MATR3 and TDP-43 and a heterotypic PTBP1-
MATR3-interaction. Together, our data reveal that Xist sequesters itself within the Xi-territory and
perpetuates gene silencing by seeding a protein-condensate. Our findings uncover an unanticipated
mechanism for epigenetic memory and elucidate the interplay between RNA and RNA-binding-
proteins in creating compartments for gene regulation.
Main text
The function of long non-coding RNAs (lncRNAs) and the mechanisms by which they act remain
largely unknown. One of the best studied lncRNAs is Xist, which orchestrates X-chromosome
inactivation (XCI) in placental female mammals1–7. By spreading across one X-chromosome and
mediating chromosome-wide gene silencing, Xist equalizes X-linked gene expression with that of
males8–12. XCI initiates when Xist is induced on one of the two X-chromosomes in pluripotent cells
of the implanting blastocyst, or upon induction of differentiation in embryonic stem cells
(ESCs)4,13, the latter providing a powerful model for the mechanistic dissection of XCI-initiation.
Intriguingly, Xist shapes nuclear organization during XCI-initiation. Xist establishes a
transcriptionally silent, intra-chromosomal domain (or compartment) by specifically localizing to
the X-chromosome from which it is transcribed and inducing the compaction of the forming
inactive X-chromosome (Xi), the enrichment of heterochromatin proteins, the repositioning of
silenced genes into the center of the Xi, and the exclusion of active transcriptional regulators, such
as RNA polymerase II1,2,14–20. Yet, the mechanisms that drive and maintain the Xist RNA within a
spatially confined region to establish this Xi-domain remain unclear.
author/funder. All rights reserved. No reuse allowed without permission. The copyright holder for this preprint (which was not peer-reviewed) is the. https://doi.org/10.1101/2020.03.09.979369doi: bioRxiv preprint

3
Mechanistically, Xist is thought to act as a modular scaffold for diverse proteins each
confering discrete functions on the RNA. These functions include chromatin localization, gene
silencing, recruitment of chromatin modifiers, and sub-nuclear-positioning of the Xi6,14,20–27.
Consistent with this model, functional regions within the RNA, structured as six conserved repeat
arrays termed A – F, have been identified1,6,28–33, along with many interacting proteins22,25,34 and
critical RNA-protein interactions21,22,25,29,35,36. However, which of the Xist-interacting proteins
play roles in formation of the Xi-domain and the spatial confinement of Xist is unclear.
Interestingly, during the initiation of XCI, but after initial spreading and gene silencing (within
72h of ESC differentiation), a state is reached where gene silencing remains stable even if Xist is
experimentally turned off5. This transition during XCI initiation from Xist-dependent to Xist-
independent gene silencing5 cannot currently be explained. This is partially due to the fact that
Xist-interacting proteins and functional Xist domains have primarily been examined during the
Xist-dependent phase of XCI initiation.
Among the Xist-interacting proteins are RNA-binding proteins (RBPs) with known
functions in regulating mRNA processing, including the splicing regulators Polypyrimidine Tract
Binding Protein 1 (PTBP1), MATRIN-3 (MATR3), CUG-Binding Protein 1 (CELF1), and TAR-
DNA Binding Protein (TDP-43)22,25,34. X-linked gene silencing is largely unaffected by siRNA-
mediated depletion of these factors during the Xist-dependent phase of XCI initiation (Extended
Data. Fig. 1a-c)25,37, raising the question of what roles these proteins play in XCI. Interestingly,
these RBPs have all been shown to form extensive higher-order assemblies, particularly when
concentrated by RNAs containing multivalent protein binding sites38–43,43. Because Xist contains
several highly repetitive sequences that could seed a high spatial concentration of such proteins,
we hypothesized that interactions between Xist and proteins like PTBP1, MATR3, CELF1, and
TDP-43 might create a higher-order assembly within the Xi to establish a nuclear compartment
that functions to restrict Xist localization and enforce the silent state of the Xi.
Based upon our hypothesis, we first examined whether the depletion of PTBP1, MATR3,
CELF1, or TDP-43 has an impact on Xist localization. To test this, we knocked down PTBP1,
MATR3, CELF1, or TDP-43 at day 3 of female ESC differentiation (during the Xist-dependent
phase of XCI), and observed nuclear dispersal of Xist compared to a control siRNA (Fig. 1a/b). To
author/funder. All rights reserved. No reuse allowed without permission. The copyright holder for this preprint (which was not peer-reviewed) is the. https://doi.org/10.1101/2020.03.09.979369doi: bioRxiv preprint
4
quantify the Xist dispersal, we derived the Xist aggregation score, by normalizing the projected
Xist RNA fluorescent in situ hybridization (FISH) signal by the smallest circular area
encompassing the Xist FISH mask (Fig. 1c and Extended Data Fig. 1d/e). Xist dispersal occurred
with small or no changes in Xist transcript levels and splicing (Extended Data Fig. 1f-i). Consistent
with this finding, PTBP1 knockdown in male ESCs expressing Xist from a cDNA transgene, which
does not require a splicing event, resulted in a similar dispersal of the Xist RNA FISH signal
(Extended Data Fig. 2). Depletion of PTBP1, MATR3, CELF1 or TDP-43 also revealed defects in
the enrichment of heterochromatin marks on the forming Xi (Extended Data Fig. 1j/k). These
findings demonstrate that PTBP1, MATR3, CELF1, and TDP-43 play a role in the enrichment of
Xist within the X-chromosome territory, which is largely independent of their RNA-processing
activities.
As these findings indicated a role for these RBPs in controlling Xist localization, we next
determined where on Xist these factors bind, by applying CrossLinking and ImmunoPrecipitation
of RNA followed by high-throughput sequencing (CLIP-Seq). CLIP-seq for PTBP1, MATR3 and
CELF1 was carried out in male ESCs that can inducibly express endogenous Xist, a model system
for studying the Xist-dependent phase of XCI initiation24. Each of the three RBPs yielded a striking
enrichment of reads on the E-repeat of Xist (Fig. 1d(i) and Extended Data Fig. 3a). Consistent with
the binding signature of these proteins, the 1.4kb E-repeat comprises over 50 C/U/G-rich elements
predicted to serve as PTBP1, MATR3 and CELF binding sites (Extended Data Fig. 3b-d)44–46. The
binding of PTBP1 molecules to the E-repeat RNA was further confirmed with recombinant PTBP1
and in vitro transcribed E-repeat RNA in electrophoretic mobility shift assays (Fig. 1e). The E-
repeat thus serves as a multivalent binding platform for PTBP1, MATR3, and CELF1. As Xist was
expressed for just 6 hours prior to fixing cells for CLIP, our results indicated that these factors
associate with Xist at the earliest stage of XCI initiation. To determine whether this interaction
occurs co-transcriptionally, we performed Chromatin Immunoprecipitation followed by high-
throughput sequencing (ChIP-seq) against PTBP1 and observed binding primarily over the
genomic region encoding the E-repeat, upon induction of Xist expression, but not before (Fig.
1d(ii)). Taken together, these results demonstrate that PTBP1, and likely MATR3 and CELF1,
engage Xist as it is transcribed.
author/funder. All rights reserved. No reuse allowed without permission. The copyright holder for this preprint (which was not peer-reviewed) is the. https://doi.org/10.1101/2020.03.09.979369doi: bioRxiv preprint

5
To ascertain whether these factors also associate with Xist in cells with an established Xi,
we examined published datasets. The PTBP1 CLIP-seq profile for Xist in differentiated female
cells is strikingly similar to that observed for PTBP1 in ESCs, as is the CLIP-seq signature against
PTBP2, the neural homolog of PTBP147 (Fig. 1d(iii)). We further found that TDP-43 CLIP-seq in
embryonic mouse brain displayed binding at the 3' end of the E-repeat, where multiple (GU)n
tracts presumably serve as TDP-43 binding motifs (Fig. 1d(iii) and Extended Data Fig. 3b/c)48,49.
These results indicate that binding of TDP-43 and PTBP1 to the E-repeat persists after XCI
initiation is completed and that PTBP2 likely replaces PTBP1 on Xist RNA in brain47. We conclude
that Xist is a multivalent binding platform for PTBP1, MATR3, CELF1, TDP-43 and their
homologs throughout all stages of XCI.
Next, we applied immunofluorescent staining to differentiating female ESCs to determine
whether recruitment of PTBP1, MATR3, CELF1 or TDP-43 by Xist could be microscopically
oberved within the Xi. These experiments revealed that CELF1 accumulates on the Xi, which was
delineated by the enrichment of H3K27me3, and that its accumulation increases in intensity from
day 3 to day 7 of differentiation (Fig. 1f-i). We also observed PTBP1 to concentrate within the Xi-
territory at later times of differentiation (day 7), in a mesh-like pattern distinct from the punctate
staining seen earlier (day 3) (Extended Data Fig. 4a). Although clearly present in the Xi, MATR3
and TDP-43 did not appear enriched in the Xi relative to the nuclear background (Extended Data
Fig. 4b/c). Xi-enrichment of these RBPs may not have been detected due to inassessibility of their
epitopes or because high concentrations are present elsewhere in the nucleus. These findings
indicate that, CELF1 and PTBP1 concentrate over time within the Xi-territory, consistent with the
time-dependent formation of a spatially concentrated assembly.
We reasoned that, if PTBP1, MATR3, CELF1 or TDP-43 control the Xi-accumulation of
Xist, loss of the E-repeat should disrupt XCI by reducing Xist enrichment within the X-
chromosome territory. In support of this hypothesis, it has been shown that Xist lacking Xist exon
7, which contains the E-repeat (Fig. 2a), displays compromised nuclear localization during XCI
initiation32,33. To directly test the requirement of the E-repeat in Xist localization, we deleted it in
a female hybrid mouse ESC line that carries one X-chromosome from the 129 background and a
second X-chromosome from the castaneous (cas) background. We confirmed that the deletion of
author/funder. All rights reserved. No reuse allowed without permission. The copyright holder for this preprint (which was not peer-reviewed) is the. https://doi.org/10.1101/2020.03.09.979369doi: bioRxiv preprint

6
the E-repeat occurred on the 129 allele, which also harbors 11 copies of an MS2-RNA tag within
Xist15, yielding the X129Xist DE, MS2 XCasXist WT genotype (referred to as DE ESCs below) (Fig. 2a and
Extended Data Fig. 5a-d). We ensured that DE ESCs maintained two X-chromosomes, and
differentiated normally, as judged by morphological changes and loss of NANOG expression
(Extended Data Fig. 5e-g). When transcribed from the X129Xist DE, MS2 allele, Xist exon 6 was spliced
to a cryptic site within exon 7 to generate an RNA missing specifically the E-repeat (Extended
Data Fig. 6).
RNA FISH over seven days of differentiation (Fig. 2b) revealed that the number of cells
containing an Xist-coated X-chromosome increased gradually until day 4 of differentiation in both
WT and DE cells (Fig. 2c). At later time points (days 5-7), we observed a significant decline in the
proportion of cells containing an Xist enrichment in DE compared to WT cells (>50% reduction at
day 7) (Fig. 2c). This reduction was specific to the 129Xist DE, MS2 allele as revealed by RNA FISH
against the MS2 tag (Fig. 2d). Although slightly less than in WT cells, the level of the MS2+ Xist
transcripts in DE cells continually increased during differentiation and RNA half-life was the same
for WT and DE Xist measured at day 3 of differentiation (Extended Data Fig. 7). Therefore, loss
of DE Xist enrichment on the Xi was not an apparent consequence of decreased Xist transcript
abundance or reduced RNA stability.
Early during initiation of XCI (differentiation day 3), the DE Xist was observed to enrich
over the X-chromosome, while its aggregation measurements revealed a modest, but significant,
defect in DE Xist localization compared to WT Xist (Fig. 2e/f). RNA antisense purification (RAP)
of Xist and sequencing of the associated DNA in male ESCs inducibly expressing full length or
DE Xist revealed highly correlated patterns of interaction across the X-chromosome early after Xist
induction (6h induction, Pearson, r=0.85, Fig. 2g). This confirms that the E-repeat is not required
for the initial transfer of Xist across the X-chromosome upon onset of XCI. By day 7, however,
DE Xist was strikingly dispersed within the nucleus, often localizing at the nuclear lamina (Fig. 2h
and Extended Data Fig. 8a-d). The DE Xist aggregation score decreased to less than half of WT by
day 7 (p<0.00001, 2-sample ks test) (Fig. 2f and Extended Data Fig. 8e/f). H3K27me3 enrichment
on the Xi is an Xist-dependent mark at all stages of XCI17,26. Consistent with the Xist localization
author/funder. All rights reserved. No reuse allowed without permission. The copyright holder for this preprint (which was not peer-reviewed) is the. https://doi.org/10.1101/2020.03.09.979369doi: bioRxiv preprint

7
defect later in XCI initiation, we observed lower H3K27me3 enrichment and reduced chromatin
compaction over the X-chromosome territory at day 7 of differentiation, despite having been
established normally at day 3 of differentiation (Extended Data Fig. 9/10). Notably, the DE-Xist
localization phenotype that becomes starkly apparent between day 4 and 7 of differentiation
follows the transition from the Xist-dependent to the Xist-independent phase of XCI initiation5,
and coincides with the described decrease in Xi-enrichment of the H3K27me3 methyltransferase
complex PRC217,50 (Extended Data Fig. 11). Together, these results reveal a transition in the
mechanisms that enrich Xist on the X-chromosome during XCI initiation, from a largely E-repeat-
independent to an E-repeat-dependent phase. Moreover, the inability of Xist to remain associated
with the X-chromosome in the absence of the E-repeat occurs after the induction of transcriptional
silencing (see below), and upon transition to the Xist-independent-phase of XCI.
The Xist RNA signal has been previously resolved into 100-200 individual foci (or
granules) when assessed with super-resolution imaging by 3D-SIM18. Quantifying the number of
foci, we found that MS2+Xist129 clouds at both D3 and D7 in WT cells, as well as the MS2+Xist129
clouds in DE cells at D3, were comprised of ~200 foci (Fig. 2i). However, at D7, we observed a
striking 50% increase in the average number of MS2+Xist129 foci in DE compared to WT cells
(p=0.05, two-sample ks-test) (Fig. 2i). This change occurs after the number of cells with Xist
clouds in the population has stabilized (Fig. 2c) and while Xist transcript abundance is still
increasing (Extended Data Fig. 7a). Thus, the increased number of DE Xist foci at later times may
result from disassembly of Xist foci that each contain multiple Xist transcripts51,52. Taken together,
our imaging data support a model in which the E-repeat is required for integration of multiple Xist
transcripts into individual Xist foci and for stabilizing the localization of these foci within the X-
chromosome.
The delayed timing of defective DE Xist localization raised several possibilities regarding
gene regulation. Silencing of genes on the DE Xist-expressing X-chromosome (i) might not occur,
(ii) might be initiated but not sustained, or (iii) might be both initiated and propagated normally
with DE Xist dispersal occuring after silencing becomes Xist-independent5. To distinguish between
these possibilities, we examined differentiating WT and DE ESCs using RNA FISH to measure
nascent transcripts from five X-linked genes known to be transcriptionally silenced by XCI: Gpc4,
author/funder. All rights reserved. No reuse allowed without permission. The copyright holder for this preprint (which was not peer-reviewed) is the. https://doi.org/10.1101/2020.03.09.979369doi: bioRxiv preprint
8
Rnf12, Mecp2, Chic1, and Atrx (Fig. 3a/b). The DE Xist RNA was identified by FISH against the
MS2 tag. In this assay, the presence of two nuclear nascent transcript foci is indicative of biallelic
expression of the respective X-linked gene. One focus indicates silencing of one allele, which can
be correlated to the Xi (Xist-expressing allele) by colocalization. In WT cells by day 3 of
differentiation, some genes (Gpc4 and Rnf12) already show mono-allelic and others (Atrx and
Mecp2) biallelic expression, consistent with known differences in silencing kinetics (Fig. 3c and
Extended Data Fig. 12a-d)53. Importantly, during the first three days of differentiation, we
observed little difference in the level of gene silencing between WT and DE cells for most genes
(Fig. 3c (compare top and bottom panels)/3d and Extended Data Fig. 12d ), although, silencing of
Tsix, a repressor of Xist54, and Gpc4 were slightly delayed compared to WT (Fig. 3c and Extended
Data Fig. 12c-e). Later stages of differentiation (day 4-7) presented a strikingly different pattern.
The DE Xist expressing cells frequently failed to silence the five X-linked genes (Fig. 3c/d and
Extended Data Fig. 12c/d). Consistent with this late silencing defect, we observed that RNA-
polymerase II (RNA-PolII), which was largely excluded from the DE Xist-marked territory during
early differentiation, was intermingled with the DE-Xist foci at later times (Fig. 3e and Extended
Data Fig. 11b-d). The E-repeat is thus essential for sustaining silencing of X-linked genes and
exclusion of RNA-PolII beyond the initial wave of transcriptional shutoff. Moreover, the results
demonstrate that the Xist-independent state of XCI initiation5 is not established in the absence of
the E-repeat, suggesting that Xist generates the epigenetic memory for the silent state through the
E-repeat. These findings uncover a new and crucial layer of regulation during Xist-dependent
silencing.
To test a causal relationship between the E-repeat-binding RBPs, Xist localization and gene
silencing, we synthetically fused PTBP1, MATR3, CELF1, or TDP-43 to the MS2-coat protein
(MCP)55. This allowed recruitment of these proteins to DE-Xist RNA during differentiation via the
11xMS2-tag (Fig. 2a, 4a and Extended Data Fig. 13a, c, d). In this gain-of-function approach, we
were able to differentiate ESCs for seven days, which was not possible with RBP depletion. We
then assessed whether synthetic recruitment of an RBP rescued the phenotypes associated with the
loss of the E-repeat. We first confirmed in vivo recruitment of the synthetic protein to 129MS2 Xist
by expressing a Flag-MCP-GFP fusion protein in differentiating WT ESCs (Extended Data Fig.
13b). We found that continued expression of a Flag-MCP-PTBP1 fusion protein in DE cells,
author/funder. All rights reserved. No reuse allowed without permission. The copyright holder for this preprint (which was not peer-reviewed) is the. https://doi.org/10.1101/2020.03.09.979369doi: bioRxiv preprint

9
assessed at day 7 of differentiation, rescued Xist localization, gene silencing of Gpc4 and Atrx, and
H3K27me3 enrichment on the 129DE,MS2 X-chromosome at day 7 of differentiation (Fig. 4b-e and
Extended Data Fig. 13e). Interestingly, we observed a similar rescue upon expression of Flag-
MCP-MATR3, Flag-MCP-TDP-43, or Flag-MCP-CELF1 (Fig. 4b-e and Extended Data Fig. 13e).
These data demonstrate that the E-repeat controls Xist localization, gene silencing, and
heterochromatin formation via its binding proteins PTBP1, MATR3, TDP-43 and CELF1.
The ability of PTBP1, MATR3, TDP-43 and CELF1 to individually rescue phenotypes
associated with loss of the E-repeat raised the question of whether they act redundantly in this
process. To examine this more closely, we took advantage of a known direct interaction between
PTBP1 and MATR344. We found that Flag-MCP-MATR3 harboring a mutant PTBP1-RRM
Interaction (PRI) sequence (MATR3mPRI)44, partially rescued H3K27me3 enrichment, but was
unable to rescue the Xist localization and gene silencing defects observed upon loss of the E-repeat
(Fig. 4b,d,e and Extended Data Fig. 13e/f). The converse mutation in PTBP1 (Y247Q) that
prevents interaction of PTBP1 with MATR344, was similarly unable to rescue the aggregation and
silencing phenotypes associated with loss of the E-repeat (Fig. 4b-e and Extended Data Fig. 13e).
These findings are supported by co-immunoprecipitation results demonstrating that PTBP1,
MATR3, CELF1 and TDP-43 can interact with one another in the presence of RNA, whereas only
PTBP1 and MATR3 robustly co-precipitate after RNase treatment (Fig. 4f and Extended Data Fig.
14). These findings show that PTBP1 and MATR3 are each necessary but insufficient for
conferring function on the E-repeat and do not act completely redundantly in this process.
Moreover, the data demonstrate that a specific protein-protein interaction between PTBP1 and
MATR3 is critical for Xist localization, gene silencing and H3K27me3 Xi-enrichment.
The protein CIZ1 was previously suggested to anchor Xist to chromatin via the E-repeat in
mouse embryonic fibroblasts (MEFs)31,56. Interestingly, PTBP1 and MATR3 interact with CIZ1
in both the presence and absence of RNA in our co-immunoprecipitation assay (Fig. 4f and
Extended Data. Fig. 14). However, expression of Flag-MCP-CIZ1 did not rescue Xist cloud
formation or X-linked gene silencing in our rescue system (Extended Data Fig. 15). Moreover,
unlike the CIZ1 Xi-enrichment observed in WT cells (Extended Data Fig. 16) 31,56, CIZ1 did not
accumulate on the DE-Xist-coated X-chromosome in cells expressing Flag-MCP-PTBP1, -
author/funder. All rights reserved. No reuse allowed without permission. The copyright holder for this preprint (which was not peer-reviewed) is the. https://doi.org/10.1101/2020.03.09.979369doi: bioRxiv preprint

10
MATR3, or -TDP-43 (Extended Data Fig. 16). Despite the RNA-independent interactions
observed between CIZ1 and PTBP1/MATR3, these results suggest that distinct functional
complexes assemble on the E-repeat and that rescue by PTBP1, MATR3, TDP-43 and CELF1 is
independent of CIZ1. As a negative control, we also tested a bivalent MS2-CP-GFP-MS2-CP
fusion in our rescue system (Extended Data Fig. 17), which was unable to rescue the DE-Xist
localization and silencing defects. This result suggests that the linkage formed PTBP1 and MATR3
does not function to simply tether Xist transcripts together and that additional activities conferred
by the recruited proteins likely facilitate compartmentalization of Xist and downstream events in
XCI.
To define such additional features of the E-repeat-interacting RBPs, we performed a
limited domain analysis. MATR3 encodes two zinc finger domains described as conferring DNA
binding57 (Fig 4b). We found that the rescue of the DE-Xist phenotypes by MATR3 is independent
of these Zinc finger domains (MATR3DZfn) (Fig. 4b,d,e and Extended Data Fig. 13e/f). We also
tested whether the valency of the RNA binding by PTBP1 affects the ability of the protein to confer
function on the E-repeat. PTBP1 lacking two of its four RNA recognition motifs (RRMs) (DC-
PTBP1 without RRM 3 and 4, Fig. 4b) retains some splicing repression activity58 and, in our
system, rescued Xist cloud formation, H3K27me3 Xi-enrichment, and gene silencing defects
observed upon E-repeat deletion (Fig. 4c-e and Extended Data Fig. 13e). However, closer
inspection of DE Xist clouds formed in the DC-PTBP1 rescue line, however, revealed the presence
of dispersed Xist foci within the nucleus, normally not seen for WT Xist or in the rescue with full-
length PTBP1 (see inset, Fig. 4c). This result indicates that binding valency by PTBP1 is an
important parameter in the function of the PTBP1-Xist assembly and suggests that PTBP1 likely
uses all of its RRMs to build a network of RNA-protein interactions in the Xi (Extended Data Fig.
4).
The formation of the Xist territory containing PTBP1 is interesting in light of the
observation that PTBP1 can undergo liquid-liquid de-mixing in vitro, when incubated at high
concentration with a binding RNA41,42. Similarly, MATR3, TDP-43 and CELF1 are components
stress granules and paraspeckles, membrane-less RNP granules that form via phase separation of
RNA-protein assemblies38–40,43. Therefore, we examined whether features that play a role in these
author/funder. All rights reserved. No reuse allowed without permission. The copyright holder for this preprint (which was not peer-reviewed) is the. https://doi.org/10.1101/2020.03.09.979369doi: bioRxiv preprint

11
processes apply to XCI. First, we asked whether rPTBP1 can form liquid-droplets upon interaction
with the E-repeat of Xist in vitro. We found that in the absence of RNA, a solution of rPTBP1
(60uM) remained uniformly clear as assessed by light microscopy (Extended Data Fig. 18a).
Addition of the E-repeat RNA at a concentration reported for RNA-PTBP1 droplet formation42
(3.2uM), produced RNA-protein aggregates within an hour (Fig. 5a). Lower RNA concentrations
(0.1-0.5uM) produced droplets that resembled phase-separated liquids by multiple parameters: (1)
upon addition of RNA, the PTBP1 solution became turbid (data not shown), (2) spherical,
transparent droplets accumulated over time, (3) these droplets fused with other droplets, and (4)
higher concentrations (0.3-0.5uM) of E-repeat RNA lead to larger droplets than lower
concentrations (0.1uM) (Fig. 5a/b and Extended Data Fig. 18b). In contrast, very small droplets
produced by a control RNA, containing 5 short CU-tracts, showed minmal changes in size between
upon addition of 0.1 - 0.5uM of RNA and did not aggregate at the highest concentration of RNA.
These findings indicate that the highly multivalent Xist E-repeat has a high propensity for
condensation with PTBP159.
We also assessed whether self-assembly of TDP-43 affected XCI. TDP-43 forms higher-
order complexes that undergo LLPS both in vitro and in vivo60–62 and this activity is reduced by
mutations: S48E, W334G, W385G and W412G60–62. If formation of the Xi-domain also involves
TDP-43 condensation, a mutant TDP-43 harboring these mutations (TDP-43-4xM, Fig. 4b) should
be incapable of rescuing DE-Xist associated phenotypes during XCI initiation. Indeed, unlike WT
TDP-43 (Fig. 4d), Flag-MCP-TDP-43-4xM did not restore Xist localization or gene silencing upon
deletion of the E-repeat (Fig. 5c-d and Extended Data Fig. 19). Similar results were obtained with
a MATR3 S85C mutant, previously shown to impair the formation of stress granules that also form
from condensation ((Fig. 5c-d and Extended Data Fig. 19)63–66. From these data, we posit that by
binding these proteins at high density via the E-repeat, Xist effectively concentrates PTBP1,
MATR3, TDP-43 and CELF1 to establish a physical condensate, that matures over time during
the initiation of XCI and relies on self-aggregation properties to compartmentalize Xist and enforce
X-linked gene silencing during the subsequent Xist-independent phase of XCI.
Our results suggested that the condensate set up by the E-repeat could be retained in the
absence of Xist at least through a few rounds of cell division, and this could explain how the Xist-
author/funder. All rights reserved. No reuse allowed without permission. The copyright holder for this preprint (which was not peer-reviewed) is the. https://doi.org/10.1101/2020.03.09.979369doi: bioRxiv preprint

12
independent phase of XCI initiation is achieved when Xist is deleted after day 3 of differentiation5.
To test the possibility that the protein condensate might be retained in the absence of Xist, we
immunostained CELF1 in primary female MEFs carrying a conditional Xist allele67 (Fig. 5e) to
detect the E-repeat dependent condensate. As seen with differentiating ESCs, in the WT MEFs we
observed CELF1 enrichment that co-localized with the H3K27me3 accumulation over the Xi (Fig.
5e). We then deleted Xist in the MEF cells using Cre-mediated recombination (Extended Data Fig.
20). As expected, loss of Xist led to loss of H3K27me3 accumulation on the Xi17,26 but strikingly,
in half of the Xist-deleted cells, CELF1 maintained the punctal enrichment (Fig. 5f). We conclude
that the E-repeat-seeded protein condensate is stable without Xist, which likely explains how
silencing can be enforced during the Xist-independent phase of XCI.
Our results define a new model for how Xist establishes the Xi-domain during XCI
initiation (Fig. 5g/h -top). Upon induction of differentiation, Xist is upregulated, assembles with
proteins across the RNA (Fig. 5g), and spreads along the X-chromosome24 (Fig. 5h, top left).
Previous studies have elucidated funtions for several of these proteins. SAF-A/hnRNP-U mediates
the chromatin attachment of Xist68, while the proteins SHARP25, bound at the A-repeat, and PRC1
recruited via hnRNP-K binding to the B-repeat29, silence transcription (Fig. 5h, top middle). We
now define a function for the Xist E-repeat that recruits the RNA binding proteins PTBP1,
MATR3, TDP-43 and CELF1 during the initiation of XCI. These factors each carry multiple
RRMs allowing for the simultaneous engagement of distinct repeat motifs within in the long E-
repeat sequence, whose multivalency will increase the avidity of binding to a single transcript (Fig.
5h, top middle). Our results also define homotypic and heterotypic interactions between these
factors required for the faithful initiation of XCI. Together, these multivalent RNA-protein and
protein-protein interactions will form a higher-order Xist–protein network. We propose that
increasing Xist abundance with differentiation and, likely, compaction of the X-chromosome18
concentratrate the Xist binding factors within the confined nuclear region of the Xi and result in
condensation of PTBP1, MATR3, TDP-43 and CELF1 around the nucleating Xist molecules.
After day 3 of differentiation and XCI initiation, the condensate formed by the E-repeat
binding proteins is critical for XCI and sustained silencing of X-linked genes during the Xist-
independent phase of XCI initiation (Fig. 5h, top right). At this point, the E-repeat has led to
author/funder. All rights reserved. No reuse allowed without permission. The copyright holder for this preprint (which was not peer-reviewed) is the. https://doi.org/10.1101/2020.03.09.979369doi: bioRxiv preprint
13
coalescence of Xist transcripts into the Xist granules and compartmentalization of the Xist-coated
Xi. By binding and concentrating the factors needed for establishment of the Xi-domain, Xist
enforces its own cis-limited spread and resultant gene silencing. The formation of the E-repeat-
dependent condensate can allow Xist to remain associated solely on the X chromosome from which
it is expressed. In the absence of the E-repeat, the loss of gene silencing and the dissociation of
Xist from the X-chromosome domain only occur after trancriptional shutoff and heterochromatin
formation (Fig. 5h bottom). We suggest that gene silencing, loss of active transcriptional
regulators, and heterochromatinization alter the interaction of Xist with the Xi and induce a
transition from an E-repeat-independent mode of association to one that is E-repeat-dependent.
Our model also suggests a mechanism for the epigenetic memory that perpetuates the silent
state after the inducing molecule (Xist) has been deleted. We propose that continued gene silencing
upon deletion of Xist after day 3 of differentiation5, is mediated by the E-repeat-seeded protein
condensate. This is consistent with our finding that CELF1 enrichment on the Xi can be maintained
in the absence of Xist. We hypothesize that the condensate integrates additional Xist-interacting
proteins, such as SHARP, via specific protein interactions (Fig. 5h top/bottom right). Weak
interactions between these different proteins might permit them to diffuse within the Xi-domain.
In this way, Xist-interactors, such as SHARP, maintain association with the multi-molecular
assembly independently of direct Xist interaction (Fig. 5h top right). Such a model could explain
how 100-200 Xist granules (foci)18,52 can silence >1000 genes across the 167Mb of X chromosome
DNA. A full understanding of how the condensed silencing domain controls gene silencing will
involve determining all of its components and their stoichiometry within the Xi as well further
biophysical characterization of the condenstate. It will be particularly interesting to examine
individual genes within the compartment and whether silenced or escaper genes exhibit different
interations with the condensate or locations within it.
Our silencing domain model may also explain the finding that Xist-dependent silencing can
only be triggered within a defined developmental window upon onset of XCI. PTBP1, MATR3
and CELF1 are highly expressed in ESCs and decline in abundance upon differentiation69. In
differentiated cells, the lower levels of these RBPs may be insufficient to multimerize on Xist and
condense into a silenced compartment.
author/funder. All rights reserved. No reuse allowed without permission. The copyright holder for this preprint (which was not peer-reviewed) is the. https://doi.org/10.1101/2020.03.09.979369doi: bioRxiv preprint
14
Our work provides a new way of thinking about the mechanism of XCI, where the
condensation of Xist with its interacting proteins drives the compartmentalization needed for
sustained gene regulation. Our results also reveal how RBPs, known for their roles in RNA
processing, mediate lncRNA localization and exert control over gene regulation via mechanisms
independent of their previously described RNA processing activities.
author/funder. All rights reserved. No reuse allowed without permission. The copyright holder for this preprint (which was not peer-reviewed) is the. https://doi.org/10.1101/2020.03.09.979369doi: bioRxiv preprint

15
References
1. Brockdorff, N. et al. The product of the mouse Xist gene is a 15 kb inactive X-specific transcript containing no conserved ORF and located in the nucleus. Cell 71, 515–526 (1992). 2. Brown, C. J. et al. The human XIST gene: analysis of a 17 kb inactive X-specific RNA that contains conserved repeats and is highly localized within the nucleus. Cell 71, 527–542 (1992). 3. Marahrens, Y., Panning, B., Dausman, J., Strauss, W. & Jaenisch, R. Xist-deficient mice are defective in dosage compensation but not spermatogenesis. Genes Dev. 11, 156–166 (1997). 4. Penny, G. D., Kay, G. F., Sheardown, S. A., Rastan, S. & Brockdorff, N. Requirement for Xist in X chromosome inactivation. Nature 379, 131–137 (1996). 5. Wutz, A. & Jaenisch, R. A shift from reversible to irreversible X inactivation is triggered during ES cell differentiation. Mol. Cell 5, 695–705 (2000). 6. Wutz, A., Rasmussen, T. P. & Jaenisch, R. Chromosomal silencing and localization are mediated by different domains of Xist RNA. Nat. Genet. 30, 167–174 (2002). 7. Yang, L., Kirby, J. E., Sunwoo, H. & Lee, J. T. Female mice lacking Xist RNA show partial dosage compensation and survive to term. Genes Dev. 30, 1747–1760 (2016). 8. Robert Finestra, T. & Gribnau, J. X chromosome inactivation: silencing, topology and reactivation. Curr. Opin. Cell Biol. 46, 54–61 (2017). 9. Galupa, R. & Heard, E. X-Chromosome Inactivation: A Crossroads Between Chromosome Architecture and Gene Regulation. Annu. Rev. Genet. 52, 535–566 (2018). 10. Brockdorff, N. Local Tandem Repeat Expansion in Xist RNA as a Model for the Functionalisation of ncRNA. Non-Coding RNA 4, (2018). 11. Froberg, J. E., Yang, L. & Lee, J. T. Guided by RNAs: X-inactivation as a model for lncRNA function. J. Mol. Biol. 425, 3698–3706 (2013). 12. Monfort, A. & Wutz, A. Progress in understanding the molecular mechanism of Xist RNA function through genetics. Philos. Trans. R. Soc. Lond. B. Biol. Sci. 372, (2017). 13. Monk, M. & Harper, M. I. Sequential X chromosome inactivation coupled with cellular differentiation in early mouse embryos. Nature 281, 311–313 (1979). 14. Chaumeil, J., Le Baccon, P., Wutz, A. & Heard, E. A novel role for Xist RNA in the formation of a repressive nuclear compartment into which genes are recruited when silenced. Genes Dev. 20, 2223–2237 (2006). 15. Jonkers, I. et al. Xist RNA Is Confined to the Nuclear Territory of the Silenced X Chromosome throughout the Cell Cycle. Mol. Cell. Biol. 28, 5583–5594 (2008). 16. Costanzi, C. & Pehrson, J. R. Histone macroH2A1 is concentrated in the inactive X chromosome of female mammals. Nature 393, 599–601 (1998). 17. Plath, K. Role of Histone H3 Lysine 27 Methylation in X Inactivation. Science 300, 131–135 (2003). 18. Smeets, D. et al. Three-dimensional super-resolution microscopy of the inactive X chromosome territory reveals a collapse of its active nuclear compartment harboring distinct Xist RNA foci. Epigenetics Chromatin 7, 8 (2014). 19. Teller, K. et al. A top-down analysis of Xa- and Xi-territories reveals differences of higher order structure at ≥ 20 Mb genomic length scales. Nucl. Austin Tex 2, 465–477 (2011). 20. Jégu, T. et al. Xist RNA antagonizes the SWI/SNF chromatin remodeler BRG1 on the inactive X chromosome. Nat. Struct. Mol. Biol. 26, 96–109 (2019).
author/funder. All rights reserved. No reuse allowed without permission. The copyright holder for this preprint (which was not peer-reviewed) is the. https://doi.org/10.1101/2020.03.09.979369doi: bioRxiv preprint

16
21. Chen, C.-K. et al. Xist recruits the X chromosome to the nuclear lamina to enable chromosome-wide silencing. Science 354, 468–472 (2016). 22. Chu, C. et al. Systematic discovery of Xist RNA binding proteins. Cell 161, 404–416 (2015). 23. Deng, X. et al. Bipartite structure of the inactive mouse X chromosome. Genome Biol. 16, 152 (2015). 24. Engreitz, J. M. et al. The Xist lncRNA exploits three-dimensional genome architecture to spread across the X chromosome. Science 341, 1237973 (2013). 25. McHugh, C. A. et al. The Xist lncRNA interacts directly with SHARP to silence transcription through HDAC3. Nature 521, 232–236 (2015). 26. Zhang, L.-F., Huynh, K. D. & Lee, J. T. Perinucleolar targeting of the inactive X during S phase: evidence for a role in the maintenance of silencing. Cell 129, 693–706 (2007). 27. Żylicz, J. J. et al. The Implication of Early Chromatin Changes in X Chromosome Inactivation. Cell 176, 182–197.e23 (2019). 28. Nesterova, T. B. et al. Characterization of the genomic Xist locus in rodents reveals conservation of overall gene structure and tandem repeats but rapid evolution of unique sequence. Genome Res. 11, 833–849 (2001). 29. Pintacuda, G. et al. hnRNPK Recruits PCGF3/5-PRC1 to the Xist RNA B-Repeat to Establish Polycomb-Mediated Chromosomal Silencing. Mol. Cell 68, 955–969.e10 (2017). 30. da Rocha, S. T. et al. Jarid2 Is Implicated in the Initial Xist-Induced Targeting of PRC2 to the Inactive X Chromosome. Mol. Cell 53, 301–316 (2014). 31. Sunwoo, H., Colognori, D., Froberg, J. E., Jeon, Y. & Lee, J. T. Repeat E anchors Xist RNA to the inactive X chromosomal compartment through CDKN1A-interacting protein (CIZ1). Proc. Natl. Acad. Sci. U. S. A. 114, 10654–10659 (2017). 32. Yamada, N. et al. Xist Exon 7 Contributes to the Stable Localization of Xist RNA on the Inactive X-Chromosome. PLoS Genet. 11, e1005430 (2015). 33. Yue, M. et al. Xist RNA repeat E is essential for ASH2L recruitment to the inactive X and regulates histone modifications and escape gene expression. PLOS Genet. 13, e1006890 (2017). 34. Minajigi, A. et al. Chromosomes. A comprehensive Xist interactome reveals cohesin repulsion and an RNA-directed chromosome conformation. Science 349, (2015). 35. Jeon, Y. & Lee, J. T. YY1 tethers Xist RNA to the inactive X nucleation center. Cell 146, 119–133 (2011). 36. Patil, D. P. et al. m(6)A RNA methylation promotes XIST-mediated transcriptional repression. Nature 537, 369–373 (2016). 37. Moindrot, B. et al. A Pooled shRNA Screen Identifies Rbm15, Spen, and Wtap as Factors Required for Xist RNA-Mediated Silencing. Cell Rep. 12, 562–572 (2015). 38. Fox, A. H., Nakagawa, S., Hirose, T. & Bond, C. S. Paraspeckles: Where Long Noncoding RNA Meets Phase Separation. Trends Biochem. Sci. 43, 124–135 (2018). 39. Fujimura, K., Kano, F. & Murata, M. Dual localization of the RNA binding protein CUGBP-1 to stress granule and perinucleolar compartment. Exp. Cell Res. 314, 543–553 (2008). 40. Kato, M. et al. Cell-free Formation of RNA Granules: Low Complexity Sequence Domains Form Dynamic Fibers within Hydrogels. Cell 149, 753–767 (2012). 41. Li, P. et al. Phase transitions in the assembly of multivalent signalling proteins. Nature 483, 336–340 (2012).
author/funder. All rights reserved. No reuse allowed without permission. The copyright holder for this preprint (which was not peer-reviewed) is the. https://doi.org/10.1101/2020.03.09.979369doi: bioRxiv preprint

17
42. Lin, Y., Protter, D. S. W., Rosen, M. K. & Parker, R. Formation and Maturation of Phase-Separated Liquid Droplets by RNA-Binding Proteins. Mol. Cell 60, 208–219 (2015). 43. Maharana, S. et al. RNA buffers the phase separation behavior of prion-like RNA binding proteins. Science 360, 918–921 (2018). 44. Coelho, M. B. et al. Nuclear matrix protein Matrin3 regulates alternative splicing and forms overlapping regulatory networks with PTB. EMBO J. 34, 653–668 (2015). 45. Han, A. et al. De novo prediction of PTBP1 binding and splicing targets reveals unexpected features of its RNA recognition and function. PLoS Comput. Biol. 10, e1003442 (2014). 46. Marquis, J. et al. CUG-BP1/CELF1 requires UGU-rich sequences for high-affinity binding. Biochem. J. 400, 291–301 (2006). 47. Vuong, J. K. et al. PTBP1 and PTBP2 Serve Both Specific and Redundant Functions in Neuronal Pre-mRNA Splicing. Cell Rep. 17, 2766–2775 (2016). 48. Buratti, E. Nuclear factor TDP-43 and SR proteins promote in vitro and in vivo CFTR exon 9 skipping. EMBO J. 20, 1774–1784 (2001). 49. Rogelj, B. et al. Widespread binding of FUS along nascent RNA regulates alternative splicing in the brain. Sci. Rep. 2, 603 (2012). 50. Silva, J. et al. Establishment of histone h3 methylation on the inactive X chromosome requires transient recruitment of Eed-Enx1 polycomb group complexes. Dev. Cell 4, 481–495 (2003). 51. Buzin, C. H., Mann, J. R. & Singer-Sam, J. Quantitative RT-PCR assays show Xist RNA levels are low in mouse female adult tissue, embryos and embryoid bodies. Dev. Camb. Engl. 120, 3529–3536 (1994). 52. Sunwoo, H., Wu, J. Y. & Lee, J. T. The Xist RNA-PRC2 complex at 20-nm resolution reveals a low Xist stoichiometry and suggests a hit-and-run mechanism in mouse cells. Proc. Natl. Acad. Sci. U. S. A. 112, E4216-4225 (2015). 53. Marks, H. et al. Dynamics of gene silencing during X inactivation using allele-specific RNA-seq. Genome Biol. 16, 149 (2015). 54. Lee, J. T. & Lu, N. Targeted mutagenesis of Tsix leads to nonrandom X inactivation. Cell 99, 47–57 (1999). 55. Bertrand, E. et al. Localization of ASH1 mRNA Particles in Living Yeast. Mol. Cell 2, 437–445 (1998). 56. Ridings-Figueroa, R. et al. The nuclear matrix protein CIZ1 facilitates localization of Xist RNA to the inactive X-chromosome territory. Genes Dev. 31, 876–888 (2017). 57. Belgrader, P., Dey, R. & Berezney, R. Molecular cloning of matrin 3. A 125-kilodalton protein of the nuclear matrix contains an extensive acidic domain. J. Biol. Chem. 266, 9893–9899 (1991). 58. Robinson, F. & Smith, C. W. J. A splicing repressor domain in polypyrimidine tract-binding protein. J. Biol. Chem. 281, 800–806 (2006). 59. Banani, S. F., Lee, H. O., Hyman, A. A. & Rosen, M. K. Biomolecular condensates: organizers of cellular biochemistry. Nat. Rev. Mol. Cell Biol. 18, 285–298 (2017). 60. Gopal, P. P., Nirschl, J. J., Klinman, E. & Holzbaur, E. L. F. Amyotrophic lateral sclerosis-linked mutations increase the viscosity of liquid-like TDP-43 RNP granules in neurons. Proc. Natl. Acad. Sci. U. S. A. 114, E2466–E2475 (2017).
author/funder. All rights reserved. No reuse allowed without permission. The copyright holder for this preprint (which was not peer-reviewed) is the. https://doi.org/10.1101/2020.03.09.979369doi: bioRxiv preprint

18
61. Li, H.-R., Chiang, W.-C., Chou, P.-C., Wang, W.-J. & Huang, J.-R. TAR DNA-binding protein 43 (TDP-43) liquid-liquid phase separation is mediated by just a few aromatic residues. J. Biol. Chem. (2018). doi:10.1074/jbc.AC117.001037 62. Wang, A. et al. A single N-terminal phosphomimic disrupts TDP-43 polymerization, phase separation, and RNA splicing. EMBO J. 37, e97452 (2018). 63. Protter, D. S. W. & Parker, R. Principles and Properties of Stress Granules. Trends Cell Biol. 26, 668–679 (2016). 64. Mensch, A. et al. The p.S85C-mutation in MATR3 impairs stress granule formation in Matrin-3 myopathy. Exp. Neurol. 306, 222–231 (2018). 65. Gallego-Iradi, M. C. et al. N-terminal sequences in matrin 3 mediate phase separation into droplet-like structures that recruit TDP43 variants lacking RNA binding elements. Lab. Invest. 99, 1030–1040 (2019). 66. Iradi, M. C. G. et al. Characterization of gene regulation and protein interaction networks for Matrin 3 encoding mutations linked to amyotrophic lateral sclerosis and myopathy. Sci. Rep. 8, (2018). 67. Pasque, V. et al. X chromosome reactivation dynamics reveal stages of reprogramming to pluripotency. Cell 159, 1681–1697 (2014). 68. Hasegawa, Y. et al. The matrix protein hnRNP U is required for chromosomal localization of Xist RNA. Dev. Cell 19, 469–476 (2010). 69. Chronis, C. et al. Cooperative Binding of Transcription Factors Orchestrates Reprogramming. Cell 168, 442–459.e20 (2017). 70. Ng, K. et al. A system for imaging the regulatory noncoding Xist RNA in living mouse embryonic stem cells. Mol. Biol. Cell 22, 2634–2645 (2011). 71. Rohland, N. & Reich, D. Cost-effective, high-throughput DNA sequencing libraries for multiplexed target capture. Genome Res. 22, 939–946 (2012). 72. Cremer, M. et al. Multicolor 3D Fluorescence In Situ Hybridization for Imaging Interphase Chromosomes. in The Nucleus (ed. Hancock, R.) 463, 205–239 (Humana Press, 2012). 73. Henegariu, O., Bray-Ward, P. & Ward, D. C. Custom fluorescent-nucleotide synthesis as an alternative method for nucleic acid labeling. Nat. Biotechnol. 18, 345–348 (2000). 74. Markaki, Y., Smeets, D., Cremer, M. & Schermelleh, L. Fluorescence in situ hybridization applications for super-resolution 3D structured illumination microscopy. Methods Mol. Biol. Clifton NJ 950, 43–64 (2013). 75. Kraus, F. et al. Quantitative 3D structured illumination microscopy of nuclear structures. Nat. Protoc. 12, 1011–1028 (2017). 76. Beard, C., Hochedlinger, K., Plath, K., Wutz, A. & Jaenisch, R. Efficient method to generate single-copy transgenic mice by site-specific integration in embryonic stem cells. Genes. N. Y. N 2000 44, 23–28 (2006). 77. Pandya-Jones, A. & Black, D. L. Co-transcriptional splicing of constitutive and alternative exons. RNA N. Y. N 15, 1896–1908 (2009). 78. Davidovich, C., Zheng, L., Goodrich, K. J. & Cech, T. R. Promiscuous RNA binding by Polycomb repressive complex 2. Nat. Struct. Mol. Biol. 20, 1250–1257 (2013). 79. Damianov, A. et al. Rbfox Proteins Regulate Splicing as Part of a Large Multiprotein Complex LASR. Cell 165, 606–619 (2016). 80. Van Nostrand, E. L. et al. Robust transcriptome-wide discovery of RNA-binding protein binding sites with enhanced CLIP (eCLIP). Nat. Methods 13, 508–514 (2016).
author/funder. All rights reserved. No reuse allowed without permission. The copyright holder for this preprint (which was not peer-reviewed) is the. https://doi.org/10.1101/2020.03.09.979369doi: bioRxiv preprint

19
81. Langmead, B., Trapnell, C., Pop, M. & Salzberg, S. L. Ultrafast and memory-efficient alignment of short DNA sequences to the human genome. Genome Biol. 10, R25 (2009). 82. Trapnell, C., Pachter, L. & Salzberg, S. L. TopHat: discovering splice junctions with RNA-Seq. Bioinforma. Oxf. Engl. 25, 1105–1111 (2009). 83. Yeo, G. CLIPper. A tool to define peaks in your CLIP-seq dataset. 84. Karperian, A, A. FracLac for ImageJ. (1999). 85. Demmerle, J. et al. Strategic and practical guidelines for successful structured illumination microscopy. Nat. Protoc. 12, 988–1010 (2017). 86. Schindelin, J. et al. Fiji: an open-source platform for biological-image analysis. Nat. Methods 9, 676–682 (2012). 87. Schneider, C. A., Rasband, W. S. & Eliceiri, K. W. NIH Image to ImageJ: 25 years of image analysis. Nat. Methods 9, 671–675 (2012). 88. Ollion, J., Cochennec, J., Loll, F., Escudé, C. & Boudier, T. TANGO: a generic tool for high-throughput 3D image analysis for studying nuclear organization. Bioinformatics 29, 1840–1841 (2013).
author/funder. All rights reserved. No reuse allowed without permission. The copyright holder for this preprint (which was not peer-reviewed) is the. https://doi.org/10.1101/2020.03.09.979369doi: bioRxiv preprint

20
Author contributions
K.P., A.P-J, Y.M., and D.L.B conceptualized the project, A.P-J., Y.M., J.S., T.C., W.M., A.D.,
B.P., K.C., R.M., X-J.W., C-K.C., and A.C. acquired data, A.P-J., J.S., Y.M., T.C., H.L. and K.P.,
analyzed data, A.P-J, Y.M., J.S., M.G. and K.P. interpreted the data and contributed towards
methodology and model creation, K.P., D.L.B, M.G. and H.L. acquired funding to support the
project, A.P-J. and K.P. administered the project and A.P-J. and K.P. wrote the manuscript and
included edits from all authors.
Author Information
Authors declare no competing interests.
Correspondence and requests for materials should be addressed to [email protected].
Data and materials availability
All genomic data for Xist interactions and chromatin association will be deposited in the Gene
Expression Omnibus (GEO) database before publication of the manuscript. All reagents will be
made available upon request after the manuscripts has been accepted for publication.
author/funder. All rights reserved. No reuse allowed without permission. The copyright holder for this preprint (which was not peer-reviewed) is the. https://doi.org/10.1101/2020.03.09.979369doi: bioRxiv preprint

21
Materials and Methods
Cell Culture
All mouse ESC lines were cultured in knockout DMEM (Life Technologies) supplemented with
15% FBS (Omega), 2 mM L-glutamine (Life Technologies), 1× NEAA (Life Technologies), 0.1
mM Beta-Mercaptoethanol (Sigma), 1xPenicillin/Streptomycin (Life Technologies), and 1000
U/mL murine LIF (homemade) on 0.3% gelatinized plates (porcine skin gelatin, Sigma) pre-plated
with irradiated male DR4 feeders (homemade from day 14.5 embryos with appropriate animal
protocols in place). For 3D-SIM microscopy experiments (see below), ESCs were maintained in
2i culture conditions. No differences in results upon cell differentiation (see below) were observed
between the ESC propagation conditions. ESCs were maintained as small colonies and passaged
with trypsin and single cell dissociation at 80% confluency.
Female ESC Differentiation
Female WT F1 2-1 MS2129 70(and derivatives thereof) were trypsinized to single cells and counted.
Cells were seeded in 2mL of mouse embryonic fibroblast (MEF) medium [DMEM (Invitrogen)
supplemented with 10% FBS (Omega), 2 mM L-glutamine (Life Technologies), 1× NEAA (Life
Technologies), 0.1 mM Beta-Mercaptoethanol (Sigma) and 1xPenicillin/Streptomycin (Life
Technologies)] at a density of 20,000 - 200,000 cells/4cm2 (depending on the experiment) on tissue
culture plates for Western Blotting or onto 18mm sterile glass coverslips for IF/FISH experiments,
both of which were pre-coated with sterile 0.3% gelatin (porcine skin gelatin, sigma) or matrigel
(Corning)(diluted 1:100). 24 hours post-seeding, the culture medium was changed and
supplemented with 1µM all-trans Retinoic Acid (Sigma), which was changed daily thereafter until
the cells were harvested for analysis.
Female MEF culture
Female MEFs (Xist2lox/2lox, Rosa26M2rtTA/tetO-Cre-Recombinase)67 were maintained in MEF medium as
described above. To delete Xist, cells were treated with 2µg/mL doxycycline (sigma) for 96h.
RNA Fluorescence In Situ Hybridization
FISH against Xist RNA was performed using both RNA and DNA probes. FISH against MS2,
Atrx, Gpc4, Mecp2, Rnf12 and Chic1 was performed using DNA probes. In undifferentiated ESCs,
the DNA probe against Xist additionally detects Tsix.
author/funder. All rights reserved. No reuse allowed without permission. The copyright holder for this preprint (which was not peer-reviewed) is the. https://doi.org/10.1101/2020.03.09.979369doi: bioRxiv preprint
22
RNA Probe Preparation: Strand-specific RNA probes were generated using a T3 in vitro
transcription kit (Promega) in the presence of Chromatide AlexaFluor-UTP (ThermoFisher). Six
~700nt transcription templates were generated from Xist exon 1 (Primers UCLA 1416 – 1429,
Extended Data Table 1), and used in transcription reactions containing 0.5mM ATP, CTP, GTP,
0.1mM UTP, and 0.05mM Chromatide AlexaFluor488-UTP (Life Technologies) along with 1x
T3 transcription buffer supplemented with 10mM DTT, 500U RNase inhibitor, 170U T3 RNA
polymerase and 5µg of pooled template DNA in a final volume of 500µL at 37°C overnight in the
dark. The transcription reaction was treated with 15U RNase-Free DNase for 15 minutes at 37°C
prior to probe purification. To purify the probes, 1/3 of the transcription reaction was loaded on a
pre-spun (700xg, 5minutes) Chromaspin-100 column (Clontech) and centrifuged (700g, 5
minutes). The eluates were combined and precipitated with 100% EtOH in the presence of 100mg
tRNA and 1/10th volume of sodium acetate (Sigma). We sometimes also purified RNA probes
using a 2.5x volume of AMPure beads (ThermoFisher 09-981-123, reconstituted according to 71)
, which were washed twice on a magnet with 80% ethanol before elution of the probes from the
beads with 50µL water, followed by ethanol precipitation. The RNA pellet was washed twice in
70% ethanol, resuspended in 400µL of RNase Free water, to which 1mL EtOH was added for
storage at -20C. To make the final probe, 1/7th of the Probe/EtOH solution was added to 90µL
Salmon Sperm DNA (Sigma), 90µL mouse Cot1 DNA (Life Technologies), 40µL 3M RNase Free
Sodium Acetate (Sigma), 40µL 10mg/mL tRNA (Life Technologies) and 1mL EtOH. After
vigorous shaking, the solution was centrifuged at maximum speed for 10 minutes. The pellet was
washed once with 70% EtOH and then once with 100% EtOH, allowed to dry completely, and
then resuspended in 200µL deionized Formamide (VWR) and 200µL 2x Hybridization buffer
[20% dextran sulfate (sigma), 4x SSC (Ambion), 0.1M NaH2PO4]. Probes were stored at -80C and
denatured at 95°C for 5 minutes before use.
DNA probe preparation: For 3D-SIM and Airyscan experiments, FISH probes were labelled by
nick translation as described in 72, using p15 cDNA plasmid as template and home-labelled
Atto488-, Cy3- or Texas Red-conjugated dUTPs made as described in 73. For all other
experiments, DNA probes were synthesized using the CGH Bioprime Array Kit (ThermoFisher)
author/funder. All rights reserved. No reuse allowed without permission. The copyright holder for this preprint (which was not peer-reviewed) is the. https://doi.org/10.1101/2020.03.09.979369doi: bioRxiv preprint

23
according to manufacturer’s instructions. Briefly, a 40µL solution containing 100ng of template
plasmid DNA was denatured in the presence of 1x random primers at 95°C for 5 minutes and snap
cooled on ice. 5µL of nucleotide mix, 5µL of 488, 555-, or 594- dUTP or dCTP chromatide
fluorphore (Life Technologies) and 5U Klenow exo- enzyme were then added and incubated in
the dark at 37°C for 6 hours, after which an additional 5U of Klenow Exo- were added. The
reaction was incubated at 37°C overnight, quenched with 10µL stop solution, and then purified
over a Chromatide-100 column or AMPure beads as described above. The eluate was precipitated
in the presence of 100mg yeast tRNA (Life Technologies) and sodium acetate (Sigma). The DNA
probe was then prepared as above to yield 400µL of probe solution in formamide/hybridization
buffer.
The MS2 DNA template for DNA probe preparation was PCR amplified from genomic DNA
purified from WT F1 2-1 MS2129 female ESCs (see Extended Data Table 1 for primers). For Xist,
the DNA probe was synthesized using a full-length mouse Xist cDNA plasmid (p15A-31-17.9kb
Xist, unpublished). Probes against X-linked genes were synthesized using BACs RP23-467J21
(Gpc4), RP23-265D6 (Atrx), WIBR1-2150D22 (Chic1), WIBR1-2704K12 (Rnf12) and W11-
894A5 and W11-1189K18 (Mecp2) (all obtained from CHORI-BACPAC). Note that the use of 2
BAC's for the Mecp2 probe sometimes resulted nascent FISH signals that appeared as doublets
(see Fig. 3b).
RNA FISH procedure for Epifluorescence microscopy: Culture medium was changed 10 minutes
prior to harvesting cells to remove dead cells and stimulate transcription. Upon collection, culture
medium was aspirated and coverslips were gently rinsed twice with cold 1xPBS. Coverslips were
then transferred to a new culture dish containing cold 1xPBS, which was then aspirated, and the
cells were fixed in 4% paraformaldehyde (PFA) (Electron Microscopy Sciences) in 1× PBS for 10
minutes at room temperature (RT) under standard laboratory safety practices. After fixation, the
cells were permeabilized in 0.5% Triton X-100 (Acros) in 1xPBS with 2mM Vanadyl
Ribonucleoside Complex (NEB) for 10-20 minutes on ice. Coverslips were then stored in 70%
ethanol at -20°C for 1 hour or until samples from all time points had been collected. Prior to
hybridization with probe, the coverslips with cells were brought back to 4°C and serially
author/funder. All rights reserved. No reuse allowed without permission. The copyright holder for this preprint (which was not peer-reviewed) is the. https://doi.org/10.1101/2020.03.09.979369doi: bioRxiv preprint

24
dehydrated by 5-minute incubations in ice-cold 80%, 95% and 100% ethanol. Coverslips were
removed from 100% ethanol and allowed to air dry prior to incubation with probe for 48 hours at
37°C in a sealed chamber humidified with 2xSSC / 50% Formamide. For RNA probes, coverslips
were washed 3x 5 minutes in 50% formamide (Fisher) / 2xSSC (Ambion) and 3x 5 minutes in
Wash Buffer II (10mM Tris, 0.5M NaCl, 0.1% Tween-20), prior to a 45 minutes incubation with
25 µg/mL RNaseA (ThermoFisher) in Wash Buffer II at 37°C. After RNaseA treatment, coverslips
were washed 2x 5 minutes in Wash Buffer II, 2x 5 minutes in 50% formamide / 2× SSC, 3x 5
minutes in 2× SSC and 3x 5 minutes in 1× SSC before briefly drying excess 1× SSC off and
mounting with Vectashield mounting media lacking DAPI (Vector Labs). Coverslips were sealed
with Biotium Covergrip coverslip sealant (Thermo Fisher). For DNA probes, coverslips were
washed 3x 5 minutes in 50% Formamide / 2xSSC, 3x 5 minutes in 2xSSC and 3x 5 minutes in
1xSSC prior to mounting. A 1:10,000 dilution of DAPI (0.5mg/mL) was included in all
penultimate 1xSSC washes. All washes were conducted at 42°C, cells were protected from light.
All procedures were performed, and used reagents disposed of, according to standard laboratory
safety procedures.
RNA FISH procedure for 3D-SIM and Improved-Resolution microscopy: All coverslips were
processed according to 74.
Indirect Immunofluorescence staining
The cell culture medium was changed 10 minutes prior to harvesting. Upon collection, culture
medium was aspirated and coverslips were gently rinsed twice with cold 1xPBS. Coverslips were
then transferred to a new culture dish containing cold 1xPBS. If cells were CSK treated (MS2-CP-
GFP expressing wild-type WT F1 2-1 MS2129 ESCs), then coverslips were gently treated with 1mL
(added dropwise) ice-cold CSK buffer [100mM NaCl, 300mM sucrose, 3mM MgCl2, 10mM
PIPES pH 6.8] and incubated on ice for 30 seconds before aspiration. Coverslips were then
similarly treated with 1mL ice-cold CSK-Trt Buffer (CSK+0.5% Triton X-100) for 30 seconds,
followed with a second ice-cold CSK treatment. Coverslips were then processed as described in 75. See Extended Data Table 2 for antibody information.
author/funder. All rights reserved. No reuse allowed without permission. The copyright holder for this preprint (which was not peer-reviewed) is the. https://doi.org/10.1101/2020.03.09.979369doi: bioRxiv preprint

25
Indirect Immunofluorescence staining -RNA Fluorescence In Situ Hybridization
Where immunostaining and FISH were combined, immunostaining preceded FISH.
Epifluorescence Microscopy: The immunostaining protocol was followed as outlined above, but
coverslips were not mounted. Instead, after the last round of washes (omitting DAPI in the
penultimate wash), coverslips were re-fixed in 4% PFA in 1× PBS for 10 minutes at room
temperature and then dehydrated through a 70-85-95-100% ice-cold ethanol series prior to
overnight incubation with probe as described above in the RNA FISH procedure section.
3D-SIM and Improved-Resolution microscopy: All coverslips were processed according to 74.
Plasmid Construction and Cell Line Generation
Xist-DE targeting construct: To create the targeting vector pCR2.1-Puro-XistDE, 3kb upstream
and 1.2kb downstream of the mouse Xist E repeat were PCR amplified from mouse genomic DNA
using primers WRM163-166, modified for In-Fusion cloning (Clontech) using Kapa polymerase
(Kapa biosystems) according to the manufacturer’s instructions. The upstream homology arm was
integrated at the EcoR1 site and the downstream homology arm at the BamH1 site, in a 4-piece
InFusion cloning reaction, into a vector containing a floxed puromycin resistance cassette
(PCR2.1-loxP-pGK-Puro-pA-loxP). Positive recombinants were identified by restriction digest of
with HindIII.
E-repeat deletion in WT F1 2-1 MS2129 ESCs: The Xist E repeat was deleted in female WT F1 2-
1 MS2129 ESCs derived from an F1 cross of mice from pure bread 129 and castaneous background,
and then targeted to contain a 11x tandem repeat of the MS2 hairpin located 1.2kb downstream of
the E-Repeat 70 via homologous recombination. The cells also harbor an M2-reverse tetracycline
TransActivator cassette within the Rosa26 locus that confers neomcyin resistance on the cells. ½
of a confluent T75 flask of WT F1 2-1 MS2129 female ESCs were electroporated with 40µg of PciI
author/funder. All rights reserved. No reuse allowed without permission. The copyright holder for this preprint (which was not peer-reviewed) is the. https://doi.org/10.1101/2020.03.09.979369doi: bioRxiv preprint

26
linearized PCR2.1-Puro XistDE targeting plasmid (800v, 0.2ms, 4mm cuvette, Biorad X-Cell
electroporation module) and plated at varying dilutions on 10cm plates of confluent irradiated DR4
feeders. 36 hours after plating, the cells were selected with 1µg/mL puromycin for 10 days. 100
clones were picked, expanded and subjected to southern blot analysis using a Sac1 digest and an
external probe (amplified using primers WRM193/194 (Extended Data Table 1)) as outlined in
Extended Data Fig.5. The positive clone #35 was expanded in culture, then transfected with a Cre-
recombinase plasmid using Lipofectamine 2000 according to the manufacturer’s protocol (Thermo
Fisher), to delete the puromycin resistance cassette. Transfected cells were serially diluted, 100
clones were picked, expanded and replica plated for growth in the presence or absence of
puromycin. Sub-clone #96 was sensitive to puromycin. PCR analysis of genomic DNA confirmed
the deletion of the puromycin cassette with primers APJ439/440 (Extended Data Table 1).
Subsequent southern blot analysis and sequencing of wild-type Xist and DE Xist PCR amplicons
from genomic DNA (Intron 6 to Exon 7 using APJ248/631 (Extended Data Table 1)) showed that
the DE targeting construct integrated on the 129 allele of Xist upstream of the MS2 tag, preserving
the 3’ splice site of intron 6, to yield the heterozygous E-repeat deletion ESC line X129 Xist DE,MS2
XCas Xist WT (=DE ESCs) (Extended Data Fig. 5/6 and data not shown). Sequencing of the exon 6 -
exon 7 RT-PCR amplicon (obtained from cDNA of differentiated ESCs) derived from the 129MS2
Xist transcript, revealed the use of a cryptic 3’ splice site downstream of the LoxP site (Extended
Data Fig. 6). This extended the E-repeat deletion within the Xist transcript (as initially designed)
by 42nt and removed the LoxP site and additional vector sequences present in the genomic DNA
from mature DE Xist transcripts, resulting in a scar-less ligation of the 3’ terminus of exon 6 to
nucleotide 1479 of Exon 7 (Extended Data Fig. 6 and data not shown). We ensured that DE ESCs
maintained two X chromosomes throughout the targeting process, and differentiated equally to
wild-type as judged by changes in morphology, loss of NANOG upon induction of differentiation
(Extended Data Fig. 5).
Engineering of WT and DE ESCs with a�FLP-FRT recombination platform for rescue
experiments: WT F1 2-1 MS2129 ESCs and DE ESCs described above (½ of a confluent T75 flask)
were electroporated with 40µg of Fsp1 linearized Flp-IN homing plasmid that integrates a FRT
landing site downstream of the Col1A locus and carried a puromycin resistance cassette for
author/funder. All rights reserved. No reuse allowed without permission. The copyright holder for this preprint (which was not peer-reviewed) is the. https://doi.org/10.1101/2020.03.09.979369doi: bioRxiv preprint
27
targeting 76, at 800v, 0.2ms, 4mm cuvette using a Biorad X-Cell electroporation module before
being serially diluted on 10cm plates, pre-coated with irradiated DR4 feeders. 36 hours after
plating, the cells were selected with 2µg/mL puromycin for 10 days after which 200 clones were
picked and expanded. Genomic DNA was isolated and EcoRI digested, before being subjected to
southern analysis with the Col1A Xba/Pst1 3’ probe. Positive clones 1-61 (WT) and 137 (DE) were
used for all subsequent experiments.
Generation of Flp-In plasmids encoding Flag-MS2-CP fusion proteins: The MS2 Coat Protein
(CP) coding sequence was PCR amplified with a forward primer encoding a 3xFlag tag
downstream of a Kozak-ATG start signal. The reverse primer contained an in frame Nhe1 site
(primers APJ526/570 (Extended Data Table 1)) such that any fragment ligated into the site would
be expressed in frame with the MS2-CP protein, separated by a 3-amino acid (Gly-Leu-Gly) linker.
The Flag-MS2-CP-Nhe1 fragment was inserted into the EcoRI site of the pBS32 vector using
Infusion cloning. This vector is similar to the pgkATGfrt vector described in76, except that the tet-
inducible promoter was replaced with a CAGGS promoter, allowing constitutive expression of the
fusion protein. The coding sequence for each protein (GFP, PTBP1, MATR3, TDP-43, and
CELF1) fused to the Flag-MS2-CP was PCR amplified from cDNA with infusion overhangs, or
synthesized (see below, Genewiz), and ligated into the Nhe1 site of the pBS32-Flag-MS2CP parent
plasmid using InFusion cloning (Clontech). The PTBP1 Y247Q, MATR3mutPRI and
MATR3DZfn mutants were generated using primer-directed mutagenesis. The WT PRI sequence
(GILGPPP) was mutated to create the mutant PRI sequence (GAAAPPA)44. The coding sequences
for the CELF1, MATR3 S85C, TDP43 4xM and MS2CP-GFP-MS2CP fusions were synthesized
(Genewiz). All plasmids were verified by sequencing.
The DC-Terminal PTBP1 fragment that is fused to Flag-MS2-CP in our rescue system, is
comprised of the first 299 amino acids of PTBP1, which includes the first two RRMs as well as
the MATR3 interaction site, followed by 68 amino acids that are out of frame, and do not encode
a functional linker region. A premature stop codon terminates the protein at residue 367.
author/funder. All rights reserved. No reuse allowed without permission. The copyright holder for this preprint (which was not peer-reviewed) is the. https://doi.org/10.1101/2020.03.09.979369doi: bioRxiv preprint

28
Generating WT and DE ESCs expressing Flag-MS2-CP-fusions via Flp-In recombination: 33µg
of the pBS32 plasmid DNA encoding the Flag-MS2-CP-Fusions and 26µg of plasmid encoding
the flpase FlpO were electroporated into WT ESCs carrying the FRT homing site (clone 1-61) for
the GFP fusion and DE ESCs with the FRT homing site (clone 137) for all other fusion constructs
(1/2 of a confluent T75 flask of ESCs per electroporation). Cells were plated on confluent
irradiated DR4 feeders in a 10cm dish and 36 hours after plating selected with 170µg/mL
hygromycin for 14 days, after which all colonies were picked and expanded. The resulting clones
were tested for protein expression by immunoblot of lysates (RIPA buffer in 1X SDS lysis buffer
(ThermoFisher)) using an anti-Flag antibody as well as antibodies against the respective fusion
protein (Extended Data Table 2). Immunostaining confirmed nuclear localization of all fusion
proteins that failed to rescue the phenotypes associated with loss of the E-Repeat. All clones used
maintained two X chromosomes, as determined by FISH against Tsix in undifferentiated cells. For
all rescue experiments, at least two clones were analyzed, which revealed that the data are robust.
Therefore, in most cases only the results from one rescue clone per protein or mutant are shown.
Generation of tet-inducible Xist DTsix V6.5 male ESCs: Tet-On Xist male V6.5 ESCs carrying a
tet-inducible promoter in place of the endogenous Xist promoter and a M2rtTA trans-activator as
well as puromycin resistance in the R26 locus24 (½ of a confluent T75 flask) were electroporated
with 40µg of Not1 linearized paa2D1.7 plasmid DNA (800v, 0.2ms, 4mm cuvette using a Biorad
X-Cell electroporation machine) and plated on confluent irradiated DR4 feeders. 36 hours after
plating, the cells were selected with Neomycin/G418 for 10 days after which 100 clones were
picked and subjected to southern analysis described in24 (data not shown). Positive clone 70 was
used for the PTBP1 ChIP-seq experiments.
siRNA treatments
Silencer Select siRNAs (Thermo Fisher) against PTBP1, MATR3, CELF1, TDP-43 and SAF-A
were diluted to 20nM in 1x siRNA buffer (60mM KCl, 6mM HEPES pH 7.5 0.2mM MgCl2),
aliquoted and stored at -80C until further use. Under sterile conditions at room temperature, 2.5µL
of 20nM siRNA were added to 80µL of fresh Opti-MEM solution (Gibco). 1.6µL siRNA MAX
author/funder. All rights reserved. No reuse allowed without permission. The copyright holder for this preprint (which was not peer-reviewed) is the. https://doi.org/10.1101/2020.03.09.979369doi: bioRxiv preprint

29
transfection reagent (Life Technologies) were added to 80µL Opti-MEM solution and
subsequently added to the siRNA/opti-MEM solution after 5 minutes of incubation. The resulting
solution was mixed by pipetting and left to incubate at RT for 20 minutes. The solution was then
added to 200,000 cells in 0.8mL of culture medium and plated in 1 well of a 12 well plate on 18mm
gelatinized coverslips and left overnight at 37C. For female ESCs undergoing differentiation, cells
were plated in MEF medium and after 24h, the culture medium was changed (with the addition of
1µM all-trans Retinoic Acid)(Sigma) and a second round of siRNA treatment was performed.
Knockdown efficiency was assessed by immunoblotting (Extended Data Table 2).
Immunoblotting
Cells were harvested by trypsinization, pelleted (1000xg, 5 min), resuspended in 500µL 1xPBS to
wash, and re-pelleted. The washed cell pellet was lysed in 5 pellet volumes of RIPA buffer and
40U benzonase (Novogen) and incubated at 4C overnight. The lysate was centrifuged at max speed
to pellet the remaining insoluble material and the supernatant was transferred to a new tube and
mixed with 4x Novex sample buffer containing 5% 14.3M Beta-mercaptoethanol (Sigma) to a
final concentration of 1x. The samples were then denatured for 5 min at 95C and loaded onto a 4-
12% Novex Bis-Tris acrylamide gel with 1x MES running buffer (Life Technologies) run at 120V
for 1.5-2h. The gels were transferred to a protran BA-85 nitrocellulose membrane (Whatman)
using a Novex XCell II transfer system for 1h at 30V, 4C (or overnight at 4C at 10V) in transfer
buffer (25mM Tris-HCl, 192mM glycine, 20% methanol). Membranes were probed with primary
antibody (Extended Data Table 2) in 1x Odyssey blocking buffer (LI-COR) overnight at 4C,
washed 3x5 minutes in PBS+0.2% tween-20 and then incubated with appropriate secondary
antibodies (1:10,000 dilution, Odyssey 700 and 800nm antibodies) in the dark at room temperature
for 30 minutes before being washed again and scanned on a LI-COR infrared imaging system.
Co-Immunoprecipitation
For co-immunoprecipitation experiments, Rabbit IgG and antibodies against PTBP1, MATR3,
CELF1, CIZ1, TDP-43 (Extended Data Table 2) were crosslinked to ProteinG-Dynabeads
(ThermoFisher) using the protocol provided by Abcam (http://www.abcam.com/protocols/cross-
author/funder. All rights reserved. No reuse allowed without permission. The copyright holder for this preprint (which was not peer-reviewed) is the. https://doi.org/10.1101/2020.03.09.979369doi: bioRxiv preprint

30
linking-antibodies-to-beads-protocol) with minor modifications. Briefly, 20µL of bead slurry were
isolated on a magnet and washed 3x 5 minutes at room temp in 5 volumes of 1xPBS. Beads were
then washed once in 5 volumes of binding buffer (100µL, 1xPBS containing 1mg/mL of BSA
(NEB)) for 10 minutes at RT, and incubated in 100µL binding buffer supplemented with 5µg of
Rabbit IgG or antibodies against PTBP1, MATR3, CELF1, CIZ1 or TDP43. Samples were rotated
for 1 hour at 4°C. Beads were then washed in binding buffer for 5 minutes, followed by an
additional 5 minute wash in 1xPBS. Next, the antibody was crosslinked by incubating in a 100µL
of 1xPBS solution containing 0.2M triethanolamine (Sigma) and 6.5mg/mL Dimethyl
pimelimidate (DMP) (Sigma) pH 8.5 for 30 minutes with rotation at RT. Beads were then washed
in 250µL 0.2M triethanolamine in 1xPBS for 5 minutes. DMP incubation and wash steps were
repeated two more times before samples were quenched in 100µL of 50mM ethanolamine in
1xPBS for 5 minutes. The quenching step was repeated and excess non-crosslinked antibody
removed with 2x 10 minutes incubations in fresh 1M glycine pH 3.0. Beads were washed in 1xPBS
3x 5 minutes before use in immunoprecipitations. Immunoprecipitations were performed under
non-denaturing conditions according to the Abcam protocol
(http://www.abcam.com/ps/pdf/protocols/immunoprecipitation%20protocol%20(ip).pdf).
4x15cm plates of confluent WT F1 2-1 MS2129 female ESCs were lysed by pipetting in 3mL of
lysis buffer (10M Tris-HCl pH8, 137mM NaCl, 1% NP40, 2mM EDTA) supplemented with 1x
Complete EDTA-free Protease Inhibitors (Roche) and incubated for 1h on ice with or without
RNase (10µg/mL RNase A) (Thermo Fisher). Lysate was centrifuged at 4°C, 14,000rpm in a
tabletop microfuge for 15 minutes to pellet insoluble material. The supernatant was transferred to
new tubes and precleared with 20µL of washed ProteinG-dynabeads per 1mL of lysate with
rotation at 4°C for 1 hour. 500µL of lysate were then added to each crosslinked antibody-proteinG
Dynabead prep (described above) and rotated at 4°C overnight. The next day, crosslinked
antibody-proteinG Dynabeads were isolated on a magnet and washed 4x 5 minutes in ice-cold
wash buffer (10mM Tris-HCl pH 7.4, 1mM EDTA, 1mM EGTA, 150mM NaCl, 1% TritonX-100)
supplemented with 1x Complete EDTA-free Protease Inhibitors. The co-purified proteins were
eluted by boiling in 1x NuPage Protein Loading buffer (Thermo Fisher) supplemented with 5%
Beta-mercaptoethanol, at 95°C for 5 minutes. Samples were assessed by immunoblotting. Input
represents 4% of lysate added per immunoprecipitate. 1/4th of eluate was loaded per lane.
author/funder. All rights reserved. No reuse allowed without permission. The copyright holder for this preprint (which was not peer-reviewed) is the. https://doi.org/10.1101/2020.03.09.979369doi: bioRxiv preprint

31
In Vitro RNA transcription (IVT)
For several in vitro experiments (Droplet assays, EMSA), RNAs encoding the E-repeat and other
sequences were obtained by IVT. Templates for IVT were amplified from DNA using KAPA
polymerase according to manufacturer’s instructions (KAPA Biosystems), and then gel purified
and concentrated over AMPure beads (homemade). See Extended Data Table 1 for primer
information. RNA was transcribed and UREA-PAGE purified as described in 77. For biotinylated
RNAs, Biotin-UTP (Ambion) comprised 18% of the total UTP.
Droplet Assays
Recombinant 6x-His tagged PTB was purified using Ni-NTA agarose (Invitrogen) according to
manufacturer’s instructions. The purified protein was dialyzed and stored in Buffer DG (20 mM
HEPES-KOH pH 7.9, 80 mM K. glutamate, 20% glycerol, 2.2 mM MgCl2, 1 mM DTT, and 0.1
mM PMSF). 10µL droplets were assembled in 1.5mL Eppendorf tubes as described in 42. Briefly,
5µL of a 2x buffer containing 200mM NaCl, 40mM Imidazole, 2mM DTT and 20% glycerol was
supplemented with the E-Repeat or control IVT RNA (varying concentrations), PTBP1 (to a final
concentration of 60µM) and water to 10µL (final volume). The solution was mixed by pipetting
and transferred to one well of an 8 well chamber slide (Ibidi) that had been pre-coated with 3%
BSA, washed 3x with RNase-Free water and dried. Droplets were imaged at 10x magnification.
Electrophoretic Mobility Shift Assays
EMSAs were performed as described in 78 except that 40,000cpm of 5’ end labeled RNA were
used per condition.
Quantitative RT-PCR and ActinomycinD treatment
In several experiments we determined the levels of Xist by RT-PCR. For experiments with
ActinomcyinD treatment, the drug was dissolved in DMSO at 1mg/mL and added to the culture
medium to a final concentration of 1µg/mL. For RT-PCR, cells were harvested in 1mL TRIzol
author/funder. All rights reserved. No reuse allowed without permission. The copyright holder for this preprint (which was not peer-reviewed) is the. https://doi.org/10.1101/2020.03.09.979369doi: bioRxiv preprint

32
(Thermo Fisher), after culture medium removal and PBS wash. RNA was purified over RNAeasy
columns (Qiagen). 1µg total RNA was used in a reverse-transcription (RT) reaction with
SuperScript III and appropriate strand-specific reverse primer, according to manufacturer’s
instructions (ThermoFisher). 1/20th of the RT reaction was used in a quantitative PCR reaction,
using either 480 SYBR Green LightCycler PCR mix (Roche), SsoAdvanced Universal SYBR mix
(Bio-Rad) or SYBR Green Master Mix (Applied Biosystems) and appropriate primers (see
Extended Data Table 1), in triplicate reactions. RT-qPCR experiments were normalized against
Gapdh or Rrm2 transcripts.
Crosslinking and Immunoprecipitation of RNA and high throughput sequencing (iCLiP-
Seq) for MATR3, PTBP1 and CELF1
iCLIP experiments were performed as described in 79. For CLiP-Seq all washes were conducted
for 5 minutes per wash, at 4°C with ice cold buffers. Three confluent 15cm plates of male tetO-
Xist V6.5 (pSM33) ESCs24 were used per immunoprecipitation upon 6 hours of induction of Xist
expression with 2µg/mL doxycycline, and crosslinking was performed at 100mJ/cm2 at 4°C in a
Stratalinker 1800 (Stratagene). Crosslinked cells where harvested by scraping in cold 1xPBS and
pelleted at 700xg for 2min. Cell pellets were lysed in ice cold lysis buffer [20 mM HEPES-KOH
pH 7.5 (Sigma), 150 mM NaCl (Sigma), 0.6% Triton X-100 (Sigma), 0.1% SDS (Sigma), 1 mM
EDTA (GIbco), and 0.5 mM DTT (Sigma)] and sonicated in a bioruptor (Diagenode) for 2x 15
minutes (30 sec ON, 30 sec OFF) on high setting at 4°C. Sonicated lysates were cleared by
centrifugation at 20,000g, 5min, 4C, supernatants transferred to 15mL falcon tubes and diluted in
5 volumes of buffer containing 20mM HEPES-KOH pH 7.5, 150 mM NaCl, 0.5 mM DTT, 1.25x
complete protease inhibitors EDTA-free (Roche), 50 µg/ml yeast tRNA (Life Technologies) and
400U RNAase out (Life Technologies). Samples were briefly mixed and rotated overnight at 4°C.
To prepare beads for pulldown, a magnet was used to isolate beads from 200µL of proteinG-
dynabead slurry, which were then washed 3x in WB150 [20 mM HEPES-KOH pH 7.5, 150 mM
NaCl, 0.1% Triton-X100] and incubated overnight at 4°C with 50µg antibody a-MATR3 (Abcam
ab151714), a-PTBP1 (Abcam, ab5642) in 700µL WB150. Beads were washed 3x in WB750 (20mM
HEPES-KOH pH 7.5, 750mM NaCl, 0.1% Triton-X100) and 1x with WB150 (20mM HEPES-KOH
pH 7.5, 150mM NaCl, 0.1% Triton-X100) prior to incubation with lysate. After overnight
author/funder. All rights reserved. No reuse allowed without permission. The copyright holder for this preprint (which was not peer-reviewed) is the. https://doi.org/10.1101/2020.03.09.979369doi: bioRxiv preprint

33
incubation in lysate, beads were collected at the bottom of the falcon tube with a magnet and the
supernatant was removed. Beads were then transferred to a 1.5mL eppendorf tube with 1mL of
WB150, washed 5x in WB750 and 2x in PNK buffer (20 mM HEPES-KOH pH 7.5, 10 mM MgCl2,
0.2% Tween-20). The immunoprecipitated RNA was fragmented in 100 µl of 1x MNase buffer
(NEB) containing 5.0 µg of yeast tRNA that was pre-warmed to 37°C in a thermomixer
(Eppendorf) set to shake for 15sec ON/15 sec OFF at 750rpm (or minimum speed required to
prevent settling of the beads). 50 µl of 1xMNase buffer containing 60 gel units/ml (6 Kunz
units/ml) of Micrococcal nuclease (NEB M0247S) were added and incubated for exactly for 5 min.
The reaction was stopped with the reaction with 500 µl of EGTA buffer (20 mM HEPES-KOH pH
7.5, 150 mM NaCl, 20 mM EGTA, 0.1% TritonX-100). The beads were then washed 4x in EGTA
buffer and 2x in cold PNK buffer. The fragmented RNA was dephosphorylated in 100 µl of 1x
FastAP buffer (Fermentas) containing 0.15 U/µl of Fast alkaline phosphatase (Thermo Scientific,
EF0651) and 0.2 U/µl of RNaseOUT (LifeTechnologies, 10777-019), incubated in a thermomixer
for 90 min at 37 °C, 15 sec shaking/20 sec rest. Beads were washed 4x in WB750 and 2x in cold
PNK buffer. The dephosphorylated RNA was then ligated to a 3’biotinylated linker RNA in 40µL
of buffer containing 1 mM ATP, 25% PEG4000 (Sigma, 202398), 0.5 U/µl T4 RNA ligase1 (NEB
M0204S), 0.5 U/µl RNaseOUT, and 6.0 µM L3 linker (Extended Data Table 1). The ligation
reaction was incubated in a thermomixer overnight at 16°C, 15 sec ON/4 min OFF at a speed that
prevents beads from settling. The next day, beads were washed 4x in WB150 and 2x with cold PNK
buffer. The RNA was then 5’ end labeled in 24µL PNK wash buffer with 16µL of 1x PNK buffer
(NEB) containing 150µCi of gamma P32-ATP, 10U PNK and 1U/µL of RNase OUT. The reaction
was incubated in a thermomixer for 20 minutes at 37°C set to shake for 15sec ON/20 sec OFF.
The beads were then washed 3x with WB150. The immunoprecipitated complexes were eluted off
the dynabeads in 50µL of buffer (100mM Tris-HCl pH7.5, 0.6% SDS, 5mM EDTA, 50mM DTT
and 50ng/µL yeast tRNA) incubated for 10min at 85°C shaking continuously at 900rpm. The elute
was transferred to a new tube and the beads were rinsed with 1200µL of buffer (50mM Tris-HCl
pH 7.5, 150mM NaCl, 1.25x complete protease inhibitors (Roche), 50ng/µL yeast tRNA and 0.1%
Triton X-100) which was added to the first eluate. The combined eluates were centrifuged for 5min
at 4°C at maximum speed and the supernatant transferred to a new tube to prevent carry over of
any remaining dynabeads. To prevent IgG heavy chain contamination that co-migrate with many
author/funder. All rights reserved. No reuse allowed without permission. The copyright holder for this preprint (which was not peer-reviewed) is the. https://doi.org/10.1101/2020.03.09.979369doi: bioRxiv preprint

34
proteins of interest, the biotinylated RNA-protein complexes were bound to monomeric avidin
beads. To do this, 10µL packed monomeric avidin agarose beads (Thermo Fisher) were washed
3x with WB150. Beads were pelleted after each wash by spinning in a swing bucket rotor at 1000xg,
4°C (use of the swing bucket rotor helps prevent loss of agarose beads). One packed bead volume
was mixed with an equal volume of WB150 and 15µL of the bead slurry was added to each
combined eluate and rotated at 4°C for 4 hours. The beads were then pelleted as above and washed
3x with WB150. After the final wash, carefully remove the remaining 5-20µL of supernatant with
a p10 pipette. The complexes were eluted off avidin beads by incubation in 30µL of buffer (10mM
Tris-HCl pH 7.5, 10% glycerol, 2.2% SDS, 5mM EDTA) at 85°C for 10 minutes in a thermomixer
shaking at 900rpm. After centrifugation to pellet the beads, the supernatant was transferred to a
new tube and mixed with 5µL of 1xLDS sample buffer (Life Technologies) with 300mM DTT.
Samples were incubated at 90C for 10min and then loaded on a pre-run (75v, 10min) NuPAGE
Bis-Tris Gel (Life Technologies NP0307) with 1x MOPS running buffer and run for 10-15min at
75v and then 120V until each sample has been satisfactorily separated. The gel was then incubated
in transfer buffer (25mM Bis-Tris, 25mM Bicine, 1mM EDTA pH7.2, 20% methanol) for 5
minutes and then transferred onto a protran BA-85 nitrocellulose membrane using a semi-dry
transfer apparatus (Biorad 170-3940) for 75min at 400mA (not exceeding 15V). After completion
of the transfer, the membrane was briefly washed in milli-Q water, wrapped in plastic film and
exposed on a phosophoimager screen for 1 hour. The regions of interest were then excised from
the membrane and transferred to an eppendorf tube. The RNA was eluted from the membrane by
incubation in 300µL of buffer (100mM Tris-HCl pH 7.5, 50mM NaCl, 10mM EDTA and 2µg/µL
proteinase K) for 30 minutes at 55°C in a thermomixer, shaking continuously. 300µL of pre-
warmed buffer (100mM Tris-HCl pH 7.5, 50mM NaCl, 10mM EDTA, 7M urea and 2µg/µL
proteinase K) was then added to the tube and incubated for a further 30min at 55°C. The
supernatant was then transferred to a new tube and extracted with an equal volume of
phenol:chloroform (5:1, pH 4.5). The separated aqueous phase was precipitated with 0.5µL of
Glycblue (Life Technologies), 60µL Sodium Acetate pH 5.4 and 600µL isopropanol overnight at
-20C. Next day, the RNA was pelleted by centrifugation at 4°C for 30min at max speed. The pellet
was then washed with 1mL 75% EtOH before air drying for 2 minutes, and dissolved in 5.70 µL
RNAse free water and left on ice for 5-10 minutes before being reverse transcribed. To do this,
author/funder. All rights reserved. No reuse allowed without permission. The copyright holder for this preprint (which was not peer-reviewed) is the. https://doi.org/10.1101/2020.03.09.979369doi: bioRxiv preprint

35
0.5µL of 10mM dNTPs and 0.5µL of 2µM RT primer (Extended Data Table 1) were added to the
RNA, mixed by pipetting and denatured for 5 min at 70°C before being snap cooled on ice. The
RT primers contain an 11nt Unique Molecule Identifier (UMI) used in sequence analysis (see
below). The sample was then equilibrated at 25C in a PCR machine before 3.5µL of RT mix were
added (2µL 5x First Strand Buffer, 0.5µL 100mM DTT, 0.5µL 100U/µL Superscript III (Life
Technologies) and 0.5µL 40U/µL RNase OUT (Life Technologies)) and incubated for 5 minutes
at 25°C and then for 20 minutes at 42C, and then 20 minutes at 48°C. The reverse transcription
reaction was then transferred to a new eppendorf tube containing 100µL TE, 11µL 3M Sodium
Acetate and 2.5volumes of 100% EtOH. The cDNA was precipitated overnight at -20°C, pelleted
and washed as described above, dissolved in 5µL RNase-free water and then mixed with 7.5µL of
formamide containing 10mM EDTA, bromophenol blue and xylene cyanol tracking dyes. For size
determination, ladder was prepared as follows: 2µL GeneScan 500LIZ size marker (Life
Technologies 4322682), 3µL H20, 15µL Formamide containing 10mM EDTA with NO tracking
dyes. The samples and ladder were denatured for 5min at 85°C and then loaded on a pre-run 5.5%
(19:1 Bis:acrylamide) UREA-PAGE gel (1xTBE, 7.5M UREA) for 20 min at 21V. The gel was
then scanned and a gel slice in the range of 70-120nt was excised, chopped into 1mm cubes and
the cDNA eluted in 700µL of TE buffer rotating at RT overnight. The next day, the cDNA was
precipitated overnight as described above. The washed pellet was then dissolved in 6.7µL of
RNase free water and left on ice for 5-10 minutes before being transferred to a PCR tube.
Subsequently, the RNA was circularized by addition of 1.5 µl of: 0.8µL of circligase II buffer,
0.4µL 50mM MnCl2 and 0.3µL of 100U/µl CicrLigase II ssDNA ligase (Epicentre CL9021K) and
incubated in a PCR machine at 60°C for 60 minutes. The circularized cDNA was then digested
with BamHI by addition of 30µL of: 4µL 10x FastDigest Buffer, 0.9µL of 10µM cut_oligo and
25.1µL RNase Free water. This mix was incubated for 4 minutes at 95C after which the
temperature was decreased 1C each minute until 37°C after which 2µL of FastDigest BamH1
(Thermo Scientific FD0054) was added and incubated at 37°C for a further 30 minutes. The sample
was transferred to an eppendorf tube and pelleted as described above. The pelleted DNA was
dissolved in 12 µL RNase free water. 2µL were used to prepare a 42µL PCR mix, containing 1x
PFU buffer, 0.2mM dNTPs, 0.2µM P3 and P5 solexa primers, and 0.5U PFU polymerase. A
negative control containing water instead of cDNA was also prepared. The 42µL reaction was then
author/funder. All rights reserved. No reuse allowed without permission. The copyright holder for this preprint (which was not peer-reviewed) is the. https://doi.org/10.1101/2020.03.09.979369doi: bioRxiv preprint

36
split into 4x10µL reactions and PCR amplified for 20, 24, 28 and 32 cycles (94°C/3’; 94°C/30s;
63.5°C/15s; 72°C/30s; with final extension at 72°C for 7 minutes). The PCR amplicons were run
on a 2% agarose gel in 0.5X TBE/EtBr and the number of cycles required to produce 50-200ng of
PCR product from the remaining 10µL of cDNA template was calculated. The PCR reaction was
repeated using 10µL remaining ssDNA template, run on a 2% gel as before and the 150-210bp
size range was excised and purified using Zymoclean Gel DNA recovery kit (Zymo Research
D4007). DNA concentration was determined by qubit using the dsDNA Broad Range assay and
prepared for sequencing on an Illumina HiSeq2000 machine using a single end 100bp protocol.
Enhanced Crosslinking and Immunoprecipitation of RNA and high throughput sequencing
(eCLIP) for CELF1
eCLIP experiments against CELF1 (a-CELF1 (ab129115) were performed as described in 80 with
a few modifications. As with iCLIP, male tet-inducible -Xist V6.5 ESCs (pSM33) were induced
with 2µg/mL doxycycline for 6 hours prior to crosslinking at 100mJ/cm2 at 4°C in a Stratalinker
1800 (Stratagene). Cells were then processed according to the eCLIP protocol for input and
immunoprecipitated samples until cDNA was obtained. We then used the iCLIP protocol from the
gel-purification of the cDNA through to amplification and purification of the DNA library. For
eCLIP samples were sequenced on an Illumina HiSeq2000 machine using the single end 50bp
protocol.
CLIP-seq analysis
CLIP-seq results were mapped using TopHat and processed with the publicly available fastq-tools,
fastx-toolkit, Samtools, Bedtools, DeepTools and UCSC scripts 8182. The first 11 bases of each
sequenced read correspond to a UMI, composed of a library specific barcode (3 nt) flanked by 4
degenerate nucleotides. The UMI permitted removal of PCR duplicates from the total sequenced
reads with the fastq-uniq command-line tool. The Fastx-toolkit was then used to clip 3’ adapter
sequences. Sequences shorter than 20 nt were discarded. Reads were then de-multiplexed and
mapped to the iGenome mm9 reference genome by Tophat with high stringency settings (no
mismatches, reads with multiple genome hits were discarded). Library-depth normalized counts
author/funder. All rights reserved. No reuse allowed without permission. The copyright holder for this preprint (which was not peer-reviewed) is the. https://doi.org/10.1101/2020.03.09.979369doi: bioRxiv preprint
37
were generated and data was converted to bigWig format to visualize tracks in IGV. Peaks were
called using CLIPper 83 using the --superlocal option.
ChIP-seq
3x 15 cm plates of male tetOXist-DTsix V6.5 ESCs (~100 million cells) were used to prepare
chromatin for PTBP1 ChiP-seq. Cells were induced for 0 or 20 hours with 2µg/mL doxycycline to
induce Xist prior to harvesting by trypsinization. Cells were then pelleted by centrifugation at
700g for 5 minutes at RT and resuspended in a total volume of 10mL PBS. The wash step was
repeated twice before resuspending in 10 mLs of 1x PBS and transferring to a 50mL falcon tube
to which Disuccinimidyl glutarate (DSG) (Pierce) in DMSO was added for crosslinking to a final
concentration of 2mM and incubated for 10 minutes at room temperature with gentle mixing under
standard laboratory safety practices. Cells were then pelleted and the supernatant was safely
disposed of. Cells were re-suspended in 10mL ESC medium and incubated for 10 minutes with
1% formaldehyde (16% methanol free, Pierce) at room temperature with gentle mixing under
standard laboratory safety practices. The reaction was quenched by addition of freshly made
0.125M Glycine (Sigma) for 5 minutes at room temperature. Cells were pelleted and supernatant
was safely disposed of. Cells were washed twice in 50mL PBS with protease inhibitors (Complete
EDTA free, Roche) before being pelleted and flash frozen in liquid nitrogen and stored at -80C.
The frozen pellets were processed for ChIP-seq as described in 69
ChIP-seq analysis
Reads were mapped using Bowtie to the iGenome mm9 reference genome. Duplicate reads were
removed and length extended to 49 nt. Normalized reads count were generated across 50nt bins.
Tracks were visualized in IGV in bigWig format.
RNA Affinity Purification (RAP)
author/funder. All rights reserved. No reuse allowed without permission. The copyright holder for this preprint (which was not peer-reviewed) is the. https://doi.org/10.1101/2020.03.09.979369doi: bioRxiv preprint

38
RAP was performed as described in24. For the RAP-seq experiment, we used male T20 ESCs6
carrying homing site in the Hprt locus on the single X-chromosome as well as a tetracycline-
inducible transactivator in the R26 locus. The Hprt homing site includes a bidirectional,
tetracycline-inducible promoter for expression of a control gene (EGFP) and of the Xist cDNA
transgene introduced later by site-specific recombination, as well as a loxP site neighboring the
tet-promoter and linked to a truncated neomycin-resistance gene lacking a promoter and translation
initiation codon. We integrated two different Xist cDNA transgenes into the homing site by
electroporation of the respective Xist cDNA encoding plasmid and a Cre expression plasmid. The
Xist transgene plasmid contained a promoter-less Xist sequence followed by a poly-adenylation
signal and a PGK promoter and translation initiation codon linked to a loxP site. Site-specific
recombination of the loxP sites in the Xist plasmid and the homing site linked the translation
initiation codon and Pgk1 promoter to the neo gene, which restored the antibiotic resistance
marker. A single copy of the Xist cDNA transgene was thus integrated under the control of the
inducible promoter. In this study, we employed a ~14.5kb Xist cDNA with either a 4122 nucleotide
deletion between BstEii sites within the Xist cDNA, deleting the E-repeat and surrounding
sequences, or a 1237 nucleotide deletion ending at a similar region with Xist and not including the
E-repeat, which was generating by deleting internal sequences within the cDNA by SnaBI
digestion and re-ligations (see Fig. 2g). Cells were induced with 2µg/mL dox for 6h, prior to
fixation for RAP-seq.
Microscopy
Epifluorescence imaging: Immunofluoresence and RNA FISH samples were imaged using a Zeiss
AxioImager M1 microscope with a 63x objective and acquired with AxioVision software.
Epifluorescence images shown are sections and were analyzed, merged and quantified using
ImageJ or Adobe Photoshop.
Xist aggregation analysis: To quantify the aggregation of Xist clouds, images were taken as Z-
stacks and transformed in a Maximum Intensity Projection (MIP) image to detect the entire Xist
FISH signal in one plane. The background was removed using a rolling ball radius of 50 pixels.
Xist RNA cloud areas were measured by creating a binary mask over the Xist RNA FISH signal
author/funder. All rights reserved. No reuse allowed without permission. The copyright holder for this preprint (which was not peer-reviewed) is the. https://doi.org/10.1101/2020.03.09.979369doi: bioRxiv preprint
39
for each analyzed Xist cloud. Edges of each Xist cloud signal were determined by selecting a
central pixel and all associated pixels of same intensity value (+/- 5 units). The ImageJ FracLac
plugin was then used to calculate the area of a circle encompassing each cloud signal 84. The ratio
of the Xist cloud area over its bounding circle area approximates the compaction of the Xist RNA
cloud. Significant differences between WT/DE ESC or siRNA treated samples were tested with
the non-parametric 2 sample Kolmogorov-Smirnov (K-S) test.
3D-Structured Illumination Microscopy (3D-SIM): 3D-SIM super-resolution imaging was
performed on a DeltaVision OMX V3 system (Applied Precision, GE Healthcare) equipped with
a 100 Å~/1.40 NA Plan Apo oil immersion objective (Olympus, Tokyo, Japan), Cascade II:512
EMCCD cameras (Photometrics, Tucson, AZ, USA) and 405, 488 and 593 nm diode lasers. Image
stacks were acquired with a z-distance of 125 nm and with 15 raw images per plane (five phases,
three angles). The raw data were computationally reconstructed with the soft-WoRx 6.0 software
package (Applied Precision) using a wiener filter set at 0.002 and channel-specifically measured
optical transfer functions (OTFs) using immersion oil with different refractive indices (RIs) as
described in 85. Images from the different channels were registered using alignment parameters
obtained from calibration measurements with 0.2µm diameter TetraSpeck beads (Invitrogen) as
described in 75.
Improved Confocal microscopy: Improved confocal laser scanning microscopy was performed on
a LSM880 platform equipped with 100x/1.46NA or 63x/1.4 NA plan Apochromat oil objectives
and 405/488 diode and 594 Helium-Neon lasers using the Airyscan detector (Carl Zeiss
Microscopy, Thornwood, NY). An appropriate magnification was used in order to collect image
stacks from a region that encompassed the nucleus of interest thereby optimizing imaging time
and reducing photobleaching. The pixel size and z-optical sectioning were set to meet the Nyquist
sampling criterion in each case. Airyscan raw data were linearly reconstructed using the ZEN 2.3
software.
Quantitative image analysis
author/funder. All rights reserved. No reuse allowed without permission. The copyright holder for this preprint (which was not peer-reviewed) is the. https://doi.org/10.1101/2020.03.09.979369doi: bioRxiv preprint

40
All image analysis steps were performed on Fiji/ImageJ 86,87.
CELF-1intensity plot profiles: Airyscan image stacks were imported into ImageJ and converted to
16-bit composites. The 3D-stacks were reduced into 2D images and 2µm intensity line plots were
used to extract the intensity profiles over the Xi enriched signal in the CELF1 channel. The same
line-plot was used in a random nucleoplasmic region to select for the average nuclear CELF-1
intensities. The ratio of the top 10% intensities of the signals were plotted after diving over the
nucleoplasmic signal.
Xi DAPI intensities quantification: Wide-field image stacks were generated from 3D-SIM raw data
of H3K27me3 and DAPI stained cells by average projection of five consecutive phase-shifted
images from each plane of the first angle and subjected to an iterative 3D deconvolution using
soft-WoRx 6.0 software. The reconstructed image stacks were imported to ImageJ and converted
to 8-bit files. In order to measure the Xi underlying DAPI intensity, binary masks from the
H3K27me3 channel were created to define the Xi territory of day 7 WT and DE ESC nuclei. A
threshold was carefully applied selecting the boarder of H3K27me3 enriched region that
demarcates the Xi territory. Subsequently the grey values of the corresponding masked region in
the DAPI channel were extracted and plotted.
Segmentation of Xist RNA foci from 3D-SIM datasets: The 32-bit reconstructed 3D-SIM image
stacks were imported into ImageJ were grey values were shifted to the positive range and converted
to 16-bit composites after subtracting the mode grey value to remove background noise.
Segmentation of Xist RNA foci was performed by using the TANGO plugin 88 on ImageJ
according to the pipelines described in 75. In brief, nuclear masks were created by using the nucleus
processing chain. Xist foci were segments by first pre-filtering with a TopHat filter with a radius
of 1 pixel in all three dimensions (xyz), followed by a Laplace of Gaussian filter with a radius of
1-pixel (x,y,z). Segmentation of foci was performed using the spot detector 3D with Otsu auto-
thresholding. Segmented objects were post-filtered with a size and edge filter of 5 pixels per spot
and an SNR above 2.
author/funder. All rights reserved. No reuse allowed without permission. The copyright holder for this preprint (which was not peer-reviewed) is the. https://doi.org/10.1101/2020.03.09.979369doi: bioRxiv preprint
41
Amira reconstructions: 3D-reconstructions were performed using Amira 2.3 (Mercury Computer
Systems, Chelmsford, Massachusetts, United States). Image stacks were imported into Amira as
separate channels. Xist FISH or antibody stainings were reconstructed as surface renderings while
DAPI was reconstructed as volume rendering using the Volren module that allows visualization
of intensity in color maps.
Genomics data
Genomics data (CLIP-seq, ChIP-seq and RAP-seq) will be made accessible with publication on
the GEO database.
Technical Note 1: The Xist and MS2 DNA FISH probes were synthesized using Klenow Exo-
polymerase primed with random hexamers from DNA templates. Specifically, for the Xist probe,
we used a plasmid encoding the entire 17.9kb Xist cDNA as template. The MS2 probe was
synthesized from a PCR product that amplified the 1.1kb MS2 repeat sequence from genomic
DNA of targeted F1 2-1 ESCs. See Fig. 2a for illustration of the sequences covered by the two
FISH probes. The difference in sequence length available for the probes to bind to Xist transcripts
in cells meant that the Xist probe gave more intensely fluorescent FISH signals than the MS2 probe.
To assign the cas or 129 allele-of-origin for the Xist cloud, we first looked for Xist probe signal
then asked whether we could detect any co-localizing MS2 probe signal. Thus, while we show that
50-70% of the cells with a detectable Xist cloud at late stages of initiation (day 4 onward) still
show MS2 co-localizing signal cloud formation in DE cells, we wish to emphasize that almost
none of these clouds presented as morphologically intact and our results, as presented, under-
represent the penetrance of the dispersal phenotype observe for DE-Xist transcript at later stages
of XCI initiation.
author/funder. All rights reserved. No reuse allowed without permission. The copyright holder for this preprint (which was not peer-reviewed) is the. https://doi.org/10.1101/2020.03.09.979369doi: bioRxiv preprint

42
author/funder. All rights reserved. No reuse allowed without permission. The copyright holder for this preprint (which was not peer-reviewed) is the. https://doi.org/10.1101/2020.03.09.979369doi: bioRxiv preprint

43
Figure 1: PTBP1, MATR3, TDP-43 and CELF1 bind the Xist E-repeat
a, Protein knockdown approach in differentiating female ESCs.
b, Representative images of siRNA-treated differentiating female ESCs immunostained for
indicated proteins (red) and probed for Xist by RNA FISH (green).
c i, Depiction of aggregation score calculation. Maximum Intensity Projections (MIPs) of stacked
images were used to mask the Xist RNA FISH signal and calculate the smallest bounding circle
that encompassed the entirety of the Xist mask. The aggregation score is the ratio of the Xist mask
(in pixels) to the bounding circle (in pixels). ii, Box plots showing Xist aggregation scores upon
depletion of indicated proteins. Depletion experiments for CELF1 and TDP-43 were conducted
separately to PTBP1 and MATR3, and measured relative to their paired siGFP (control) sample.
Significance testing was performed using a 2-sample K-S test (*** p < 0.0005, **** p < 0.00005).
No significant differences (p > 0.05) were observed between different siGFP treated samples. 25-
36 clouds were measured per sample from one experiment.
d i, Top: Diagram of the Xist locus with introns, exons and repeat arrays A-F of the RNA depicted.
The repeat regions (A-D and F) within exon 1 are shown in grey. The sole conserved D-repeat in
mouse (dark grey) is flanked by truncated versions (light grey coloring/dotted line). The 1.4kb E-
repeat is shown in blue. The in vitro transcribed E-repeat RNA used in (e) is indicated. PTBP1
(iCLIP), MATR3 (iCLIP) and CELF1 (eCLIP) CLIP-seq profiles across the Xist locus after 6 hours
of doxycycline (dox) treatment in male tetO-Xist ESCs are shown, together with the CELF1 input
sample. ii, PTBP1 ChIP-seq profiles across the Xist locus before or after 20 hours of dox treatment
in male tetO-Xist ESCs. iii, PTBP1, PTBP2 and TDP-43 iCLIP-seq profiles across the Xist locus
in female mouse brain.
e, Left: Radiograph of an EMSA with in vitro transcribed E-repeat RNA (see (d)) and either none,
or increasing amounts of recombinant (r) PTBP1 (0, 7.8nM, 15.6nM, 31.3nM, 62.5nM, 125nM,
250nM, 500nM, 1µM and 2µM). Right: Quantification showing fraction of bound RNA.
Quantification from two independent experiments, with standard error of the mean (SEM) shown.
f, Depiction of wildtype female ESC differentiation experiment for immunostaining.
g, Left: Confocal-airyscan optical sections through nuclei of WT female cells at day 3 or 7 of
differentiation, immunostained for CELF1 (green) and H3K27me3 (marking the Xi, red) and
counterstained with DAPI (gray). Inset: Enlargement of the Xi-territory. Right: Same as left only
author/funder. All rights reserved. No reuse allowed without permission. The copyright holder for this preprint (which was not peer-reviewed) is the. https://doi.org/10.1101/2020.03.09.979369doi: bioRxiv preprint
44
showing CELF1 staining in greyscale. Note the increased CELF1 staining intensity within the
H3K27me3-enriched territory with differentiation time.
h, Histogram showing the number of H3K27me3-marked Xi’s with a co-localizing CELF1
enrichment on days 3 and 7 of differentiation. 50-90 cells with H3K27me3 enrichment were
counted per coverslip. 3 coverslips taken from 2 independent differentiations were counted for
each sample. Error bars indicate SEM (p-value: p <0.05, 2-tailed students t-test).
i i, Intensity values for CELF1 fluorescence were recorded across a 2µm line plot over the Xi (as
marked by H3K27me3 staining) or in the nucleoplasm of the same nucleus in z-stack projections,
as illustrated in the schematic. ii, Box plot showing the distribution of the ratio between the top
10% CELF1 intensity values within the Xi compared to the top 10% intensity values within the
nucleoplasm for 12 cells per time point from one experiment.
author/funder. All rights reserved. No reuse allowed without permission. The copyright holder for this preprint (which was not peer-reviewed) is the. https://doi.org/10.1101/2020.03.09.979369doi: bioRxiv preprint

45
author/funder. All rights reserved. No reuse allowed without permission. The copyright holder for this preprint (which was not peer-reviewed) is the. https://doi.org/10.1101/2020.03.09.979369doi: bioRxiv preprint

46
Figure 2: The E-repeat is required for Xist localization and controls the number of Xist foci
a, Diagram showing Xist alleles in female WT and DE ESCs. A 11xMS2 hairpin, located 1.2kb
downstream of the 1.4kb E-repeat, is indicated in magenta. Green lines delineate the sequences
within Xist RNA targeted by the Xist FISH probe. The magenta line represents the region targeted
by the MS2 FISH probe. Note that the loxP site (black triangle) present in the genomic sequence
after targeting is spliced out in DE Xist transcripts (see Extended Data Fig. 6).
b, Scheme of Retinoic Acid (RA) differentiation experiment to assess Xist coating of the Xi in
female WT and DE ESCs.
c, Histogram showing the number of nuclei that display an Xist cloud, detected by RNA FISH
against Xist, at the indicated day of differentiation. 100 – 250 cells were counted per time point
across 3 independent differentiations. Error bars represent SEM (p-values: ** < 0.005, 2-tailed
students t-test).
d, Histogram showing the allelic origin of Xist RNA clouds for the data in (c), detected by RNA
FISH for Xist and the MS2 tag. At later days of differentiation (4-7), MS2+Xist129 (mutant) clouds
in DE cells were scored if an Xist signal (which delivers a brighter signal than the MS2 probe due
to target sequence length - see (a)) co-localized with even a weak MS2 signal. 50-80 Xist clouds
were assessed per time point, across 3 independent experiments. Error bars represent SEM (p-
values: * < 0.05, ** < 0.005, 2-tailed students t-test).
e, 3D-SIM optical sections through WT and DE cells at day 3 of differentiation showing Xist RNA
FISH signals (green) of MS2+Xist129 WT or DE clouds, with DAPI counterstaining in grey. Note,
that for simplicity, the MS2 signal is not shown, but the Xist clouds shown are derived from the
MS2+Xist129 allele. Inset: Enlargement of marked region corresponding to the Xist-coated-
chromosome. Right: Same as inset except DAPI and Xist RNA FISH are presented independently,
highlighting formation of the Barr body. Bar; 5µm. Arrowheads indicate DE-XistMS2 foci located
further from the core of the Xist cloud.
f, Violin plots of aggregation scores of MS2+Xist129 clouds formed in WT and DE cells at days 3
and 7 of differentiation. Only MS2+Xist129 clouds were chosen for the analysis, but the signal
quantified was derived from the co-localizing Xist RNA FISH signal. Significance testing was
performed using a 2-sample K-S test. 30-34 clouds were analyzed per time point from one
experiment (p-values: ** < 0.005, *** < 0.0005).
author/funder. All rights reserved. No reuse allowed without permission. The copyright holder for this preprint (which was not peer-reviewed) is the. https://doi.org/10.1101/2020.03.09.979369doi: bioRxiv preprint
47
g, Top: Diagram of the tet-inducible Xist cDNA transgenes that were inserted into the Hprt locus
on the X-chromosome in male ESCs for RAP-seq. Bottom: RAP-seq profile of +E and DE Xist
across the X-chromosome after 6 hours of dox treatment. Pearson correlation score between the
two profiles is indicated. Data were collected from one experiment.
h, Left panel: 3D-SIM MIP of the Xist RNA FISH signal from MS2+Xist129 clouds in WT (top
panel) and DE (bottom panel) nuclei at day 7 of differentiation. Xist is shown in green, MS2 in red,
DAPI in grey. Bar; 5µm. Next two large panels: Xist/DAPI signals from two different Z-plane
optical sections through the nucleus are shown. Next two small panels: Enlargements of the Xist-
coated X-chromosome from each Z-plane (Z1, top; Z2, bottom). Rightmost panels: Y-plane
sections through same cells, showing Xist localization relative to the apical and basal nuclear
lamina with enlargements of area with Xist signal area shown on the far right (see Extended Data
Figure 8a for additional images).
i, Box plot showing the distribution of Xist RNA foci number derived from the MS2+Xist129-allele
in WT and DE cells at day 3 and 7 of differentiation. Significance testing was performed using the
2-sample K-S test. 10 clouds were quantified per condition from one experiment (p-value: ** <
0.005).
author/funder. All rights reserved. No reuse allowed without permission. The copyright holder for this preprint (which was not peer-reviewed) is the. https://doi.org/10.1101/2020.03.09.979369doi: bioRxiv preprint
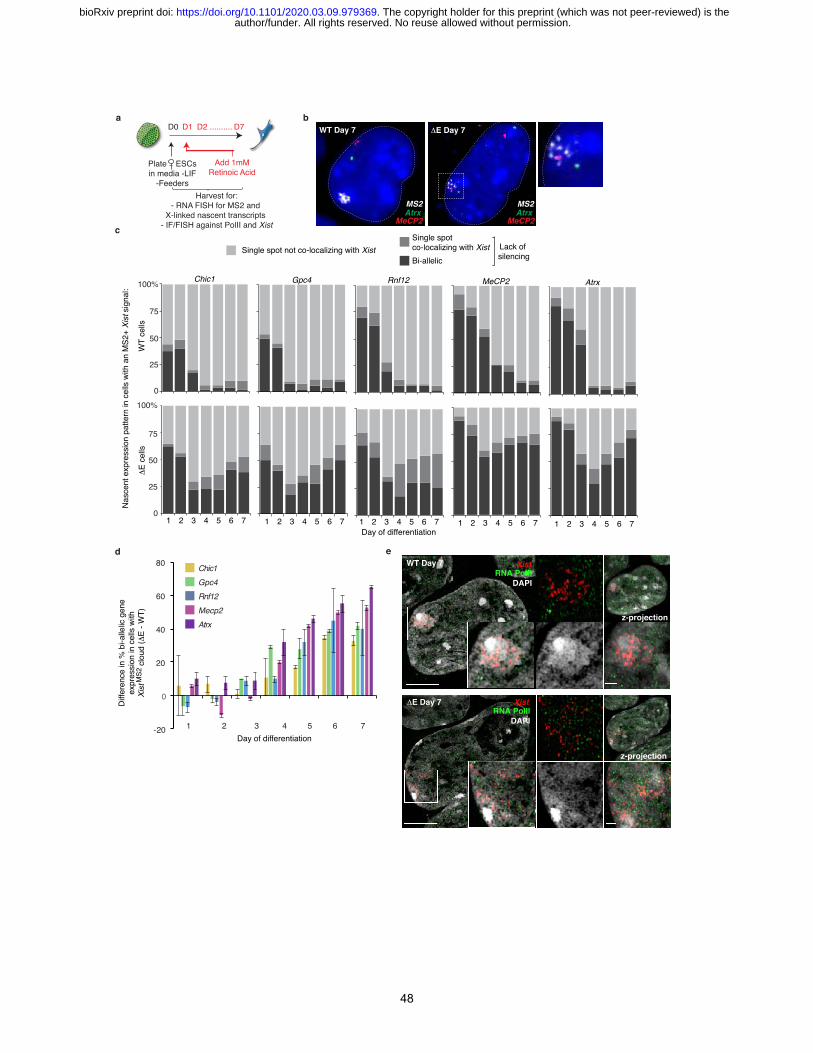
48
Add 1mMRetinoic Acid
D0 D1 D7D2 ..........a
Harvest for:- RNA FISH for MS2 and
X-linked nascent transcripts - IF/FISH against PolII and Xist
bWT Day 7 ΔE Day 7
Nas
cent
exp
ress
ion
patte
rn in
cel
ls w
ith a
n M
S2+
Xist
sig
nal:
WT
cells
Single spot not co-localizing with XistBi-allelic
Single spot co-localizing with Xist Lack of
silencing
ΔE
cells
Chic1
7654321
Atrx
7654321
MeCP2
7654321
Gpc4
7654321 Day of differentiation
c
d
1 2 3 4 5 6 7
Diff
eren
ce in
% b
i-alle
lic g
ene
exp
ress
ion
in c
ells
with
Xi
st
c
loud
(ΔE
- WT)
Day of differentiation
XistRNA PolII
DAPI
z-projection
WT Day 7
ΔE Day 7
z-projection
e
MS2
MeCP2Atrx
MS2
MeCP2Atrx
RNA PolIIDAPI
Xist
25
50
75
100%
0
0
25
50
75
Rnf12
7654321
100%
MS2
Plate ESCsin media -LIF
-Feeders
-20
0
20
40
60
80 Chic1Gpc4Rnf12Mecp2Atrx
author/funder. All rights reserved. No reuse allowed without permission. The copyright holder for this preprint (which was not peer-reviewed) is the. https://doi.org/10.1101/2020.03.09.979369doi: bioRxiv preprint

49
Figure 3: The Xist E-repeat establishes a memory of gene silencing during XCI initiation
a, Scheme of RA-differentiation experiment assessing gene silencing and Xi RNA-PolII presence
in female WT and DE ESCs.
b, Representative epifluorescence images showing the nascent expression patterns of the X-linked
genes Mecp2 (red) and Atrx (green) found in a majority of WT (mono-allelic expression on the
active X chromosome) and DE cells (bi-allelic expression) with MS2+Xist129 signal at day 7 of
differentiation, together with the MS2 RNA FISH signal (white). DAPI staining is shown in blue.
Note that MS2 signal in DE cells is faint as it is dispersed across the nucleus as described in Fig.
2. Far right: enlargement of square hatched region showing the MS2 FISH signal in DE-Xist cells.
c, Histograms showing the quantification of nascent expression patterns of indicated X-linked
genes in WT and DE cells displaying an MS2+Xist129-coated X-chromosome, across 7 days of
differentiation. 50 cells with an MS2+Xist129 clouds were counted per time point. (See Extended
Data Fig. 12c/d).
d, Histogram showing the percentage difference in bi-allelic nascent gene expression (lack of
silencing) between DE and WT cells with an MS2+Xist129 cloud, across 7 days of differentiation
for the X-linked gene expression quantification shown in (c and Extended Data Fig.12d). Error
bars represent SEM.
e, 3D-SIM optical sections through nuclei of WT and DE cells showing Xist clouds derived from
the MS2+Xist129 allele at 7 days of differentiation, stained for RNA-polII (green) and probed for
Xist (red). DAPI is shown in grey. Inset: Magnification of the marked region. Right, top: Same as
inset but only showing PolII and Xist signals. Right bottom: Same as inset but only showing DAPI.
Far right: z-stack projections of the whole nucleus (top panel) and Barr Body (lower panel). Size
bars: 5µm; inset:1µm.
author/funder. All rights reserved. No reuse allowed without permission. The copyright holder for this preprint (which was not peer-reviewed) is the. https://doi.org/10.1101/2020.03.09.979369doi: bioRxiv preprint
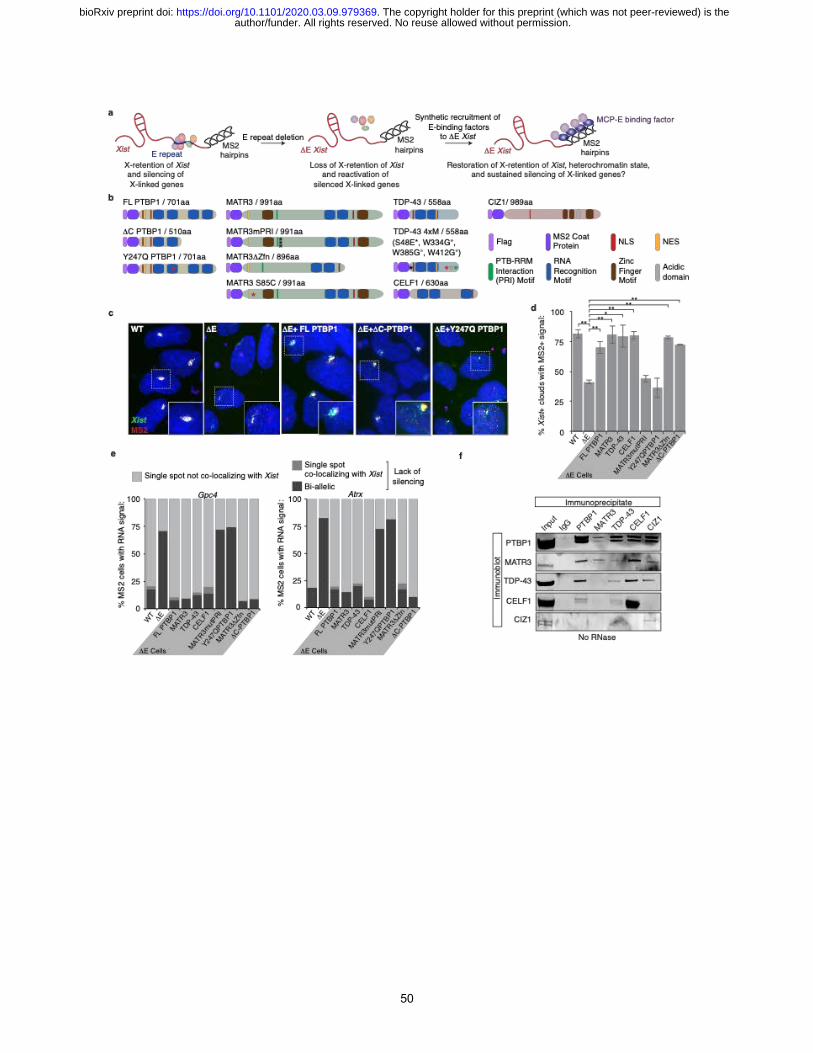
50
author/funder. All rights reserved. No reuse allowed without permission. The copyright holder for this preprint (which was not peer-reviewed) is the. https://doi.org/10.1101/2020.03.09.979369doi: bioRxiv preprint

51
Figure 4: PTBP1, MATR3, TDP-43 and CELF1 confer function on the E-repeat to localize
Xist and enable persistent X-linked gene silencing during XCI-initiation
a, Depiction of the MCP-fusion protein rescue strategy for DE Xist.
b, Illustration of Flag-tagged MCP-fusion proteins used in this study and mutants thereof. Point
mutations are indicated with asterisks (see methods for MATR3 PRI mutant sequence, denoted by
3 black asterisks). Amino acid length of fusion proteins includes Flag-tag and MCP sequence.
c, Representative epifluorescence images of RNA FISH against Xist (green) and MS2 (red) in day
7 differentiated WT, DE, and DE lines expressing variants of Flag-tagged MCP-PTBP1 fusions.
Inset: enlargement of MS2+Xist129 clouds outlined with hatched lines. Chosen clouds are
representative of the MS2+Xist129 cloud phenotype in DE cells upon rescue with the indicated
protein variant.
d, Histogram showing the number of nuclei with an Xist cloud that also displayed a co-localizing
MS2 signal at differentiation day 7, as detected by RNA FISH, in WT, DE, or DE lines expressing
the indicated Flag-tagged MCP fusions (see methods for information on scoring). 83-103 cells
were counted per sample. Error bars represent the SEM from two independent experiments (p-
values: * <0.05, ** < 0.005, 2-tailed students t-test).
e, Histograms showing the quantification of nascent Gpc4 or Atrx nascent expression pattern in
cells displaying an MS2+Xist129 coated X-chromosome at differentiation day 7 as described in (d).
50 cells with an MS2+Xist129-coated X-chromosome were counted per sample from one
experiment.
f, Immunoprecipitation of PTBP1, MATR3, CELF1, TDP-43 and CIZ1 from ESC extracts (not
RNase treated) and detection of co-precipitated proteins by immunoblotting, using the same
antibodies. Image is representative of the results obtained from three independent replicates.
author/funder. All rights reserved. No reuse allowed without permission. The copyright holder for this preprint (which was not peer-reviewed) is the. https://doi.org/10.1101/2020.03.09.979369doi: bioRxiv preprint
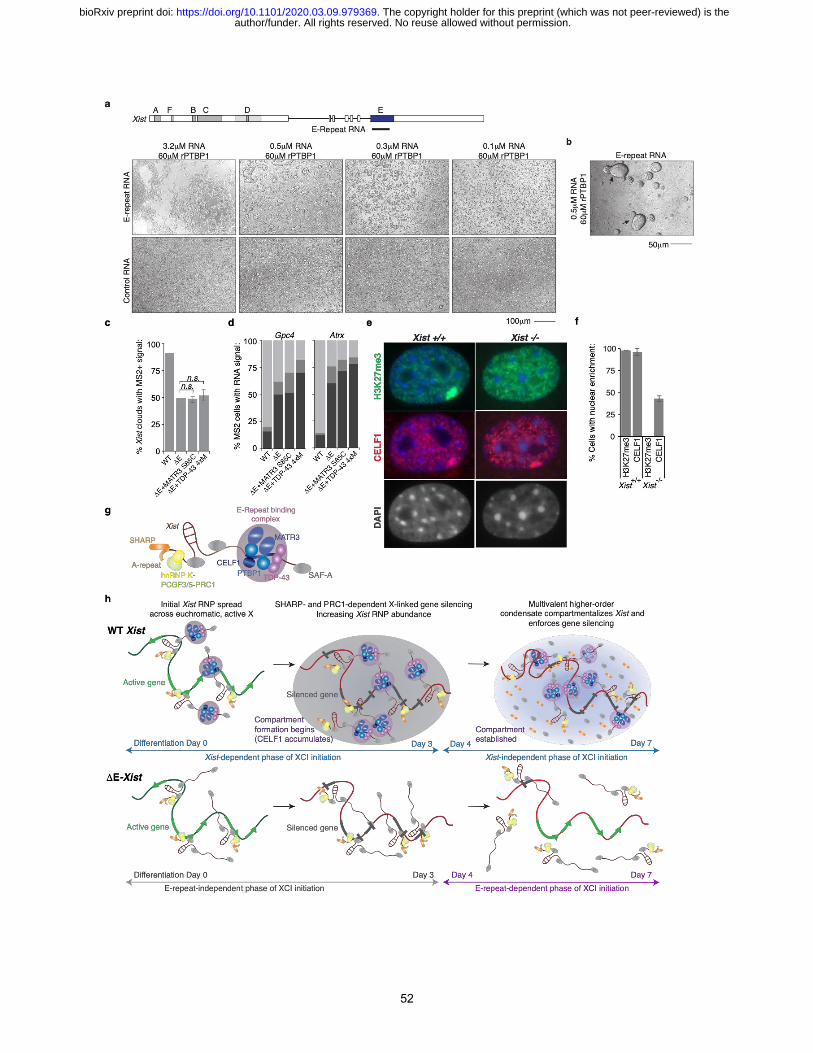
52
author/funder. All rights reserved. No reuse allowed without permission. The copyright holder for this preprint (which was not peer-reviewed) is the. https://doi.org/10.1101/2020.03.09.979369doi: bioRxiv preprint

53
Figure 5: Self-association of E-repeat binding RBPs is critical for compartment formation
a, Top: Diagram of the Xist locus with introns, exons and repeat arrays A-F depicted as in Fig. 2a.
The Xist-derived in vitro transcribed E-repeat used in droplet assays is indicated. Bottom:
Brightfield (10x) images showing droplets formed after 40 minutes with 60µM rPTBP1 and
decreasing concentrations of Xist E-repeat or control RNAs.
b, Brightfield image of droplets formed after 40 minutes with 60µM rPTBP1 and 0.5µM E-repeat
RNA, which have fused or are undergoing fusion, indicated by arrows. Images were taken at higher
magnification than in (a), note scale bar.
c, Histogram showing the number of nuclei with an Xist cloud that also displayed a co-localizing
MS2 signal, as detected by RNA FISH, in WT, DE, or DE cells expressing Flag-tagged MCP-
MATR3-S85C and TDP-43 4xM, respectively. 108-144 cells were counted per sample, from 2
independent experiments. Data for WT and DE samples were from a single experiment but was
combined with data from Fig. 2 to calculate experimental standard error of the mean. There was
no significant difference between the DE sample and experimental DE rescue lines (2-tailed
students t-test).
d, Histograms showing the quantification of nascent Gpc4 or Atrx nascent expression patterns in
cells described in (c) displaying an MS2+Xist129 coated X chromosome at differentiation day 7. 50
cells displaying an MS2+Xist129 were counted per sample, from one experiment.
e, Representative fluorescence microscopy images showing H3K27me3 (green) and CELF1 (red)
staining in Xist2lox/2lox, Rosa26M2rtTA/tetO-Cre-recombinase before, or after 96h of dox treatment. Images
of the DAPI stained nuclei (grey) are shown below.
f, Histogram showing the percentage of cells with H3K27me3 or CELF1 enrichment before or
after 96h of dox treatment (2ug/mL). Error bars represent SEM from two biological replicates.
g, Illustration of the Xist ribonucleoprotein complex. PTBP1, MATR3, CELF1 and TDP-43 bound
to the E-repeat are depicted in blue/purple. The A-repeat bound by SHARP is shown in
yellow/brown, and hnRNPK-PGCF3/5-PRC1 bound to the B-repeat indicated in yellow/green.
Proteins marked in grey indicate additional Xist-interactors, such as SAF-A/hnRNP-U.
h, Model for how the E-repeat forms the Xi domain and facilitates the transition from the Xist-
dependent to the Xist-independent phases of XCI-initiation. Top: At the onset of differentiation,
Xist expression is induced and the Xist RNP spreads across the euchromatic X-chromosome (green
line) using the 3D conformation of the chromosome and mechanisms involving SAF-A/hnRNP U
author/funder. All rights reserved. No reuse allowed without permission. The copyright holder for this preprint (which was not peer-reviewed) is the. https://doi.org/10.1101/2020.03.09.979369doi: bioRxiv preprint

54
to attach to chromatin. SHARP, bound at the A-repeat, recruits HDAC3 (not shown) to initiate
transcriptional shutoff for genes. HnRNPK, bound at the B-repeat, instates heterochromatin
formation (red line) via deposition of PRC1-dependent H2AK119ub and PRC2-dependent
H3K27me3, and contributes to gene silencing. Further differentiation and likely DNA compaction,
along with rising Xist levels, increase the overall local concentration of Xist RNPs, such that more
Xist RNPs integrate into each Xist granule detected in 3D-SIM experiments. At a critical
concentration of Xist transcripts and E-repeat-binding RBPs, the formation of a higher-order multi-
molecular and multi-valent assembly occurs. This establishes a self-sustaining condensate that
compartmentalizes Xist within the Xi-domain and enforces X-linked gene silencing, and that can
be sustained in the absence of Xist. Bottom: Without the E-repeat, the Xist-retaining silencing
compartment does not form, Xist localization cannot be reinforced, rendering the local
concentration of Xist and its directly interacting proteins insufficient to maintain gene silencing,
which ultimately results in reactivation of the Xi.
author/funder. All rights reserved. No reuse allowed without permission. The copyright holder for this preprint (which was not peer-reviewed) is the. https://doi.org/10.1101/2020.03.09.979369doi: bioRxiv preprint

55
author/funder. All rights reserved. No reuse allowed without permission. The copyright holder for this preprint (which was not peer-reviewed) is the. https://doi.org/10.1101/2020.03.09.979369doi: bioRxiv preprint

56
Extended Data Figure 1: Depletion of PTBP1, MATR3, TDP-43 or CELF1 does not strongly
affect X-linked gene silencing or Xist processing
a, Overview of siRNA approach used to deplete Xist-interacting RBPs in female differentiating
mouse ESCs and to assess XCI.
b i, Representative immunoblot showing the level of siRNA-mediated knockdown of PTBP1,
MATR3, and CELF1 relative to siGFP treatment in cells differentiated for 3 days. The percentage
depletion normalized to GAPDH is shown on the right. Error represents the SEM from 3
independent experiments. ii, As in (i), except for TDP-43.
c i, Histogram showing the nascent expression pattern of X-linked gene Gpc4 after 3 days of
differentiation and knockdown of the indicated factor. 50 cells with Xist clouds were counted per
sample from one experiment. ii, Same as (i) except showing data for the X-linked gene Chic1. iii,
Same as (i) except showing data for the X-linked gene Atrx.
d, Box plots showing the distribution of the area (mask) covered by Xist RNA FISH signal upon
knockdown of PTBP1, MATR3, CELF1 or TDP-43, used to calculate the Xist aggregation scores
displayed in Figure 1b. (p-value: * < 0.05, 2-sample KS test). 25-36 clouds were measured per
sample, from one experiment.
e i, Box plots showing the distribution of the area of the bounding circle encompassing Xist FISH
signal/mask upon knockdown of PTBP1 or MATR3 used to calculate the Xist aggregation scores
displayed in Figure 1b. ii, Same as (i) except for knockdown of CELF1 or TDP-43. (p-value: * <
0.05, **** < 0.00005, 2-sample KS test). 25-36 clouds were measured per sample, from one
experiment.
f, Diagram of Xist showing the splicing events assessed upon knockdown of PTBP1, MATR3,
TDP-43 or CELF1, and amplicon used to assess Xist abundance (exon 1 PCR). The results are
shown in (i) and (j).
g, Histogram showing the relative abundance of total Xist transcripts upon knockdown of indicated
RBPs. All samples are normalized to siGFP control treatment samples and Snrnp27 RNA (encodes
a U6 snRNP factor). Samples were assessed in triplicate from 3 independent depletions. Error bars
represent the SEM.
h, Histogram showing the relative level of Xist exon 1-2 and exon 6-7 splicing upon knockdown
of indicated factors, normalized as in (j). Samples were assessed in triplicate from three
independent depletions. Error bars represent the SEM (p-value: * < 0.05, 2-tailed students t-test).
author/funder. All rights reserved. No reuse allowed without permission. The copyright holder for this preprint (which was not peer-reviewed) is the. https://doi.org/10.1101/2020.03.09.979369doi: bioRxiv preprint

57
i, Snapshot of aligned sequences derived from the expected sequence upon splicing of exon 6
(green) - exon 7 (red) (colored, lower sequence), and the observed sequence upon siRNA treatment
targeting GFP or PTBP1 after 72h in differentiating female ESCs (black, upper sequence). Two
independent experiments were tested for splicing with identical results showing correct exon 6 - 7
ligation.
j, Histogram showing the percentage of Xist-positive cells showing co-localizing exclusion of
RNA-pol II or enrichment of PRC2 components EZH2, EED, SUZ12 and the histone modification
H3K27me3 on the Xi, in female ESCs differentiated for 3 days and treated with siRNAs against
GFP (control) or PTBP1. 54-64 cells were counted per sample from one experiment.
k, Histogram showing the percentage of Xist-positive cells with H3K27me3 Xi-enrichment in day
3 differentiated female ESCs treated with siRNAs against GFP (control), PTBP1, MATR3, TDP-
43 or CELF1. 109-146 cells were counted per sample, from one experiment independent of that
shown for (f).
author/funder. All rights reserved. No reuse allowed without permission. The copyright holder for this preprint (which was not peer-reviewed) is the. https://doi.org/10.1101/2020.03.09.979369doi: bioRxiv preprint

58
e
Xist PTBP1 Xist
siGFPsiGFP
siPTBP1siPTBP1
tetO-Xist cDNA (17.9kb, Hprt)
Add Dox in ESC mediasiRNA re-treat
IF/FISHWestern
b
Plate male ESCsin ESC media,
siRNA treat
D0 D1 D2
α-PTBP1
α-GAPDH
% k.d.: 0 93
0
20
40
60
80
100
% #
nucle
i with
Xis
t RN
A clo
udl:
siPTB
P1
siGFP
c d
siGFP
siPTBP1
Chr X
a
TetO- promoter 17.9kb full length Xist cDNA, Hprt locus
author/funder. All rights reserved. No reuse allowed without permission. The copyright holder for this preprint (which was not peer-reviewed) is the. https://doi.org/10.1101/2020.03.09.979369doi: bioRxiv preprint

59
Extended Data Figure 2: Xist dispersal upon PTBP1 knockdown is independent of splicing
a, Diagram of a tet-inducible full length (17.9kb) Xist cDNA transgene inserted into the Hprt locus
on the X-chromosome in male ESCs.
b, Approach used to deplete PTBP1 in the cells described in (a).
c, Immunoblot and quantification showing level of PTBP1 knockdown in the experiment
diagrammed in (b).
d, Histogram showing the percentage of cells with an Xist RNA cloud upon knockdown of PTBP1
and 24 hours of dox treatment in the experiment as described in (b). 82-90 cells were counted per
sample in one experiment.
e, Representative images of Xist, detected by RNA FISH, after being treated with siRNAs against
GFP or PTBP1 and dox-addition, as outlined in (b). Note the dispersal of Xist upon PTBP1
knockdown occurs in the absence of splicing regulation, as Xist is expressed from a cDNA
construct in this experiment.
author/funder. All rights reserved. No reuse allowed without permission. The copyright holder for this preprint (which was not peer-reviewed) is the. https://doi.org/10.1101/2020.03.09.979369doi: bioRxiv preprint

60
a
bTGTGTATTGTGGGTGTGTCTATTTCTTGTTTTATGTATCTATTTTTTCCTTGGTCTGTGTGTCTAATTCTTTGTTACATC
TATTTCTTCCTTGCTTTGTGTGTCTATTTCTTCCTTGCTTTGTGTGTCTATTTCTTCCTTGCATTATGTCTAATTCTTTG
TTATATCTATTTCTTCCTTGCTTTGTGTCTATTTCTTCCTTGCAGTTGTGTCTAATTCTTTGTTACATCTATTTCTTCCT
TGCTTTGTGTGTCTATTTCTTCCTTGCATTGTGTCTAATTCTTTGTTATATCTATTTCTTCCTTGCTTTGTGTGTCTGTC
TTCCTTGCTTTGTGTCTATTTCTTCCTTGCAGTTGTGTCTAATTCTTTGTTACATCTATTTCTTCCTTGCTTTTGTGTGT
CTTTCTTTCTTGCTTTTGTGTGTCTATTTCTTCCTTGCAGTTGTGTCTAATTCTTTGTTACATCTATTTCTTCCTTGCTT
TTGTGTGTCTATTTCTTCCTTGCATTGTGTCTAATTCTTTGGTATATATATTTCTTCATTGCTTTGTGTGTCTATGTCTC
CTTGTGTTGTCTAATTCGTTGTTGCATCTATTTCTTCCTTGCTTTGTGTGTCTATTTCTTCCTTGCTTTGTGTGTCTATG
TCTTCCTTGCTTTGTGTGTCTATGTCTTCCTTGTTTTGTGTATCTACTTCTTCCTTGTGTGTCTAATTCTTTGTTACATC
TATTTCTTCCTTCCTTTGCATGTCTCCTTCTTTCCTTTGTGTGTCTTTTCTGTCTGCAGTGTGTCTTACCTATTCCCATG
TTTCTCCTGCATGTTCTTTCTTGCAGAGCTTTGAGCTTTGTTTCACTTTCTCTGGTGCCTGTGTGGTCTGCTTTGTCTTC
ACTAGCTATGGCTCTCTGTTTTATCTATCTGGTTGCTATTTCTCTTAGCTTTTCTTTCACTCCTGCCTTTCGTGACTCCC
CTTTGGGTCACATGTTGCATGCATCCCTCTCTTTTTCTTGTGCTCACCCCACTTGTTCTTTGTTCAAGTTCTCTTTGTCA
GTCCATTTCAGTTTTCTTTCTGCTGCTTCTATCCTTAGTGAATTCTTGTTTACATTTCTTCCCTGCCTTTCTTGGGCCAC
TTTCTCTGTTTTCTTTTGTATTTGTGTCTCTTTGCTATTGGTGGATTTCTTATCTCAGCATCATTCTGTTGCTTTGTGTT
TGCTTGTGTTTCTATCTTCTACTTTCCTCCTTTCTGTTCACTTTGAGCATTTCATCTCTTTACAAGTCTGTGTCTCTCTT
GTATTCTAAAGTAATCCTTTCTTGGATGTTTCTTTGTATGTACATGTGCGTGTGTGCATGTGTGTTATGTGTGTCATGTG
TGAGAGGAGCTTCATAGCCCCTTCCCAATAGGTCCAGAATGTCACCCGTGGAGCCGTTCCTCACACCAGACTGCCCTGAG
AAATAATCTAAGACAAAATACATCATTCCGTCCGGTCAGGATTCAAGTGG
1. TTTCTTCCTTGCTTTGTGTGTCTA 2 TTTCTTCCTTGCTTTGTGTGTCTA 3 TTTCTTCCTTGCTTTGTGTGTCTA 4. TTCTTCCTTGCATTATGTCTA 5. TTTCTTCCTTGCTTTGTGTCTA 6. TTTCTTCCTTGCAGTTGTGTCTA 7. TTTCTTCCTTGCTTTGTGTGTCTA 8. TTTCTTCCTTGCATTGTGTCTA 9. TTTCTTCCTTGCTTTGTGTGTCTG 10. TCTTCCTTGCTTTGTGTCTA 11. TTTCTTCCTTGCAGTTGTGTCTA 12. TTTCTTCCTTGCTTTTGTGTGT 13. CTTTCTTTCTTGCTTTTGTGTGTCTA 14. TTTCTTCCTTGCAGTTGTGTCTA 15. TTTCTTCCTTGCTTTTGTGTGTCTA 16. TTTCTTCCTTGCATTGTGTCTA 17. TTTCTTCATTGCTTTGTGTGTCTA 18. TCTCCTTGTGTTGTCTA 19. TTTCTTCCTTGCTTTGTGTGTCTA 20. TTTCTTCCTTGCTTTGTGTGTCTA 21. TCTTCCTTGCTTTGTGTGTCTA 22. TCTTCCTTGTTTTGTGTATCTA 23 TTCTTCCTTGTGTGTCTA 24. TCTCCTTCTTTCCTTTGTGTGT 25. TTTTCTGTCTGCAGTGTGTCTTACCTA
1. TTCTTTGTTACATCTA 2. TTCTTTGTTATATCTA 3. TTCTTTGTTACATCTA 4. TTCTTTGTTATATCTA 5. TTCTTTGTTACATCTA 6. TTCTTTGTTACATCTA 7. TTCTTTGGTATATATA 8. TTCGTTGTTGCATCTA 9. TTCTTTGTTACATCTA
c
d
* Xist gene length
# reads in Dataset Window # Reads in window % of total mapped reads % of reads in Xist
3,328,965 1st kb of Xist (1000nt) 1084 0.0325 0.897
E repeat (1435nt) 111514 3.349 92.292
Xist (22860nt) 120827 3.629
5,020,287 1st kb of Xist 1425 0.028 1.058
E repeat 124617 2.482 92.579
Xist 134605 2.681
3,897,448 1st kb of Xist 2 5x10 0.004
E repeat 46147 1.184 99.99
Xist 46149 1.184
MATR3 CLiP
PTBP1 CLiP
CELF1 CLiP -5
author/funder. All rights reserved. No reuse allowed without permission. The copyright holder for this preprint (which was not peer-reviewed) is the. https://doi.org/10.1101/2020.03.09.979369doi: bioRxiv preprint

61
Extended Data Figure 3: A tandem array of 20-25nt C/U/G-rich elements comprises the Xist
E-repeat
a, Table showing mapping statistics of PTBP1, MATR3 and CELF1 CLIP-seq data for male ESCs
with a tet-inducible Xist allele, induced for 6 hours, for reads mapping across the Xist locus, the E-
repeat of Xist, and the 1st kb of Xist (including the A-repeat) as a percentage of total mapped reads
or of the reads located within Xist. Note that Xist is overexpressed in this experiment, which
influences the total number of reads mapping to the locus.
b, The first 1500nt of the terminal exon 7 of Xist are shown. The sequence remaining after splicing
of the Xist DE transcript is underlined (see Extended Data Figure 6). The C/U/G tandem repeats
within the 5' half of the E-repeat are indicated (pink – full repeats, blue- truncated repeats) as are
the CU-tracts (shown as CT tracks in the DNA sequence, green) in the 3' half of the sequence.
Potential TDP-43 sites are shown in orange at the 3' terminal end of the E-repeat.
c, Alignment of the 25 full C/U/G-tandem repeats (pink) in (b). Brown, green, red and black text
indicate similar nucleotide runs within each tandem repeat. Brown C/U tracts encode putative
PTBP1 and/or MATR3 binding sites. Red G/U tracts encode putative CELF1 and/or TDP-43
binding sites.
d, Alignment of the 9 truncated C/U/G-tandem repeats (blue) in (b)). Orange nucleotides are
variable within each truncated repeat unit.
author/funder. All rights reserved. No reuse allowed without permission. The copyright holder for this preprint (which was not peer-reviewed) is the. https://doi.org/10.1101/2020.03.09.979369doi: bioRxiv preprint

62
a i iiPTBP1 H3K27me3 DAPI PTBP1 PTBP1 WT Day 3
WT Day 3
WT Day 7
WT Day 7
b i
c i
WT Day 3 WT Day 7
WT Day 3 WT Day 7
MAT
R3
H3K
27m
e3 D
API
TDP-
43 H
3K27
me3
DA
PIPTBP1 H3K27me3 DAPI
Foca
l dis
tribu
tion
of P
TB1
with
in
H3K
27m
e3 e
nric
hed
terri
tory
Mes
h-lik
e co
ncen
tratio
n of
PTB
P1 w
ithin
H
3K27
me3
enr
iche
d te
rrito
ry
ii
ii
author/funder. All rights reserved. No reuse allowed without permission. The copyright holder for this preprint (which was not peer-reviewed) is the. https://doi.org/10.1101/2020.03.09.979369doi: bioRxiv preprint

63
Extended Data Figure 4: PTBP1 concentrates in a unique pattern within the Xist-coated X-
chromosome territory at day 7 of XCI initiation
a i, Left: Two independent micrographs of confocal-airyscan optical sections through nuclei of
WT female ESCs at day 3 of differentiation immunostained for PTBP1 (green) and H3K27me3
(red, detecting the Xi) and counterstained with DAPI (grey). Inset: enlargement of the Xi-territory,
showing a punctate, focal pattern of PTBP1 within the Xi. Right: same as left, except showing
only the PTBP1 signal in grayscale. ii, Same as in (i), except showing WT female ESCs
differentiated for 7 days, showing a mesh-like PTBP1 concentration within the Xi territory that is
distinct from that observed in the nucleoplasm of these cells or from the pattern within the day 3
Xi.
b i, Confocal-airyscan optical sections through nuclei of WT female ESCs at day 3 of
differentiation immunostained for MATR3 (green) and H3K27me3 (red) and counterstained with
DAPI (gray). Right: enlargement of the Xi territory showing MATR3 and H3K27me3 signals
(upper) or only MATR3 signal (lower) with DAPI counterstaining (gray). ii, Same as in (i), except
showing cells differentiated for 7 days.
c i, Same as in (b-i) except showing immunostaining for TDP-43 at day 3 of differentiation. ii,
Same as in (b-ii) except showing immunostaining for TDP-43 at day 7 of differentiation.
author/funder. All rights reserved. No reuse allowed without permission. The copyright holder for this preprint (which was not peer-reviewed) is the. https://doi.org/10.1101/2020.03.09.979369doi: bioRxiv preprint

64
author/funder. All rights reserved. No reuse allowed without permission. The copyright holder for this preprint (which was not peer-reviewed) is the. https://doi.org/10.1101/2020.03.09.979369doi: bioRxiv preprint

65
Extended Data Figure 5: DE cells undergo differentiation similar to WT cells
a, Scale diagram of the Xist gene annotated with repeat regions A-F (see Figure 2a for complete
description). Also shown is the targeting strategy used to delete the Xist E-repeat region in F1 2-1
MS2 female ESCs with the targeting plasmid pCR2.1-Puro-XistDE.
b, Diagram of the southern blot strategy with a 5’ external probe, used to identify deletion clones.
This strategy did not distinguish between targeting of the E-repeat on the 129 or cas allele of Xist.
Location of southern probe is shown, as is the location of the PCR amplicon (red) used to identify
which allele was deleted (see (d)). Asterisk denotes location of SNPs used for defining the allelic
origin of the deleted allele (see (d)).
c, Southern blot as described in (b) on targeted female ESCs with a loxP-flanked puromycin
cassette in place of the E-repeat on one Xist allele. The puromycin cassette was subsequently
deleted by Cre-recombinase transfection into the mutant line and confirmed by PCR after sub-
cloning.
d, Sequencing analysis of the long amplicon (shown in b). SNPs conforming to the 129 allele are
shown in red and are not detected in the amplicon, confirming that the E-repeat remains present
on the Cas allele and is deleted on the 129 allele.
e, Tsix RNA FISH (green) on undifferentiated WT and DE cells confirming the presence of two
Tsix nascent transcription units, used as a proxy to confirm that the targeted DE cells maintain two
X-chromosomes. DAPI stained nuclei are shown in blue.
f, Brightfield images of WT and DE cells at day 4 of differentiation, showing that the cells do not
appear morphologically different upon induction of differentiation.
g, Immunoblot of lysates from WT and DE cells at 2 days of differentiation showing early and
equal loss of Nanog expression, a pluripotency gene quickly down-regulated with the induction of
differentiation.
author/funder. All rights reserved. No reuse allowed without permission. The copyright holder for this preprint (which was not peer-reviewed) is the. https://doi.org/10.1101/2020.03.09.979369doi: bioRxiv preprint

66
author/funder. All rights reserved. No reuse allowed without permission. The copyright holder for this preprint (which was not peer-reviewed) is the. https://doi.org/10.1101/2020.03.09.979369doi: bioRxiv preprint
67
Extended Data Figure 6: Splicing of intron 6 proceeds in the absence of the E-repeat
a, RT-PCR amplicons generated from RNA isolated from day 4 differentiated WT (with primers
APJ248/624) or DE (with primers APJ248/631) cells across exon 6 – exon 7 to confirm splicing
of intron 6. (see (c) for primer locations). We found that that the PCR amplicon was shorter than
expected for the DE transcript. Sequencing across the modified exon 6 - 7 junction revealed the
use a cryptic 3’ splice site downstream of the LoxP site which extended the E repeat deletion within
the Xist transcript (but not the Xist genomic DNA) (as designed) by 42nt. This caused the LoxP
site and associated vector sequences to be excluded from the mature DE Xist transcripts, such that
the 3’ terminus of exon 6 splices to nucleotide 1479 of exon 7 to form a scar-less junction (see
(d)). Orange asterisk indicates a faint band at the expected location for the amplicon generated
from the WT Cas allele in DE cells.
b, PCR amplicons from WT or DE genomic DNA using the same primers as in (a) showing that
the intron 6-containing products can be amplified and thus, non-detection of intron 6-containing
Xist transcripts is due to splicing of DE Xist and not amplification problems.
c, Schematic outlining primers used to assess Xist gDNA and RNA in (a) and (b) across the exon
6 / intron 6 and exon 7 region in WT and DE cells that have been differentiated for 4 days.
d, Diagram of sequenced genomic and cDNA amplicons (using APJ248/631) confirming correct
integration of the targeting plasmid and cre recombinase-mediated removal of the puromycin
cassette as well as the sequence of the spliced XistDE transcript from exon 6 to exon 7. Red asterisk
denotes wild-type 3' splice site on exon 7. Black asterisk denotes splice site used in in DE
transcripts.
author/funder. All rights reserved. No reuse allowed without permission. The copyright holder for this preprint (which was not peer-reviewed) is the. https://doi.org/10.1101/2020.03.09.979369doi: bioRxiv preprint
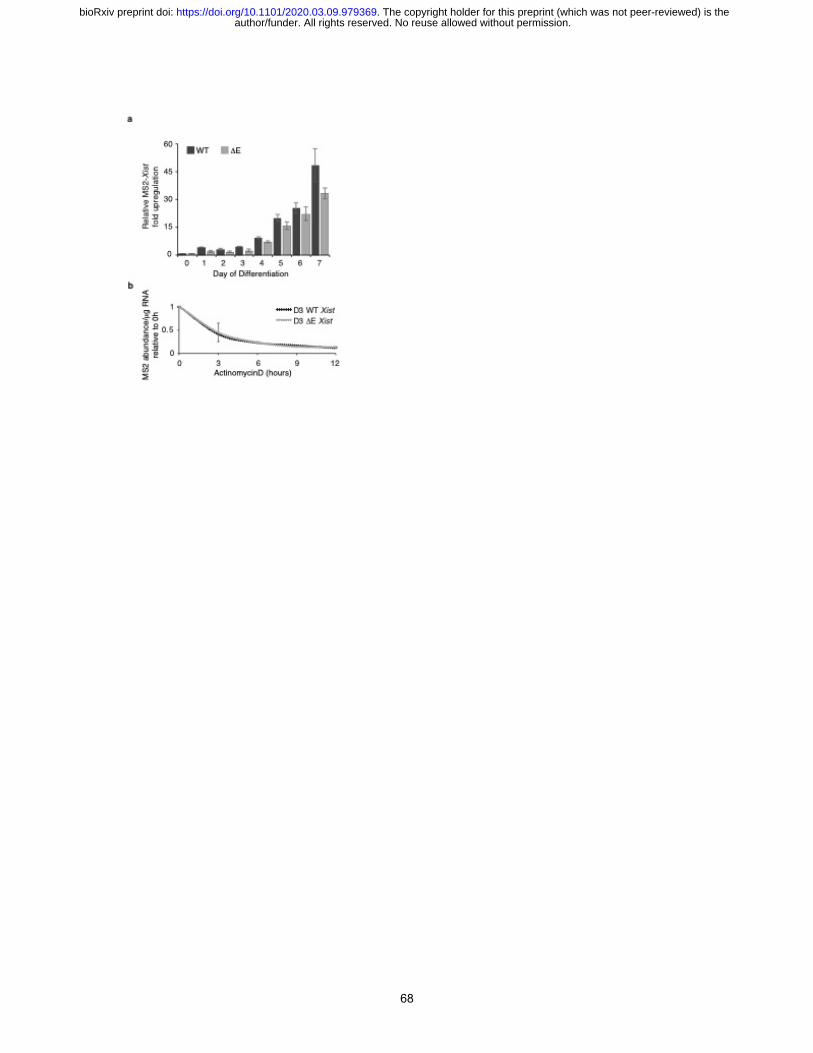
68
author/funder. All rights reserved. No reuse allowed without permission. The copyright holder for this preprint (which was not peer-reviewed) is the. https://doi.org/10.1101/2020.03.09.979369doi: bioRxiv preprint

69
Extended Data Figure 7: Deletion of the E-repeat does not affect Xist abundance or stability
a, Histogram showing RT-qPCR quantification of the fold upregulation of MS2+Xist129 RNA in
WT and DE cells over 7 days of differentiation, normalized relative to undifferentiated samples
and against an internal control (Rrm2). Error bars represent the standard error of the mean for three
independent samples measured in triplicate. Differences were not significant by 2-tailed students
t-test.
b, Line plot showing RT-qPCR measurements of Xist RNA half-life in in WT and DE cells treated
for 3, 6, 9 or 12h with ActinomycinD at day 3 of differentiation. Xist RNA amounts were calculated
as transcript copy number per microgram of total RNA. Note that DE Xist RNA displays a similar
stability as WT Xist at day 3 of differentiation, which is before the major XCI phenotype in DE
cells manifests, indicating that the deletion of the E-repeat does not make Xist inherently less
stable. Samples measured in triplicate from 3 independent samples. Error bars indicate the SEM.
author/funder. All rights reserved. No reuse allowed without permission. The copyright holder for this preprint (which was not peer-reviewed) is the. https://doi.org/10.1101/2020.03.09.979369doi: bioRxiv preprint

70
e
100
200
300
WT ΔE Day 7Day 3
WT ΔE
Xist
FI
SH s
igna
l are
a
f
400
800
1200
WT ΔE Day 7Day 3
WT ΔE
Xist
bou
ndin
g ci
rcle
are
a
***
d
WT Day 7WT Day 3
ΔE Day 3
Xist DAPI MS2 DAPI
Cel
l 1C
ell 2
a b
Z-projection Z1 Z2
XistMS2DAPI
ΔE Day 7
x
y
Z-projection Z1 Z2
XistMS2DAPI
ΔE Day 7
x
y
WT Day 7 ΔE Day 7
Xist
DA
PI
cXist DAPI MS2 DAPI
ΔE Day 7
MS
2
MS
2
z
x
z
x
author/funder. All rights reserved. No reuse allowed without permission. The copyright holder for this preprint (which was not peer-reviewed) is the. https://doi.org/10.1101/2020.03.09.979369doi: bioRxiv preprint

71
Extended Data Figure 8: DE Xist transcripts migrate to the nuclear lamina at late stages of
XCI-initiation
a, Left: MIP of 3D-SIM optical sections across a nucleus in DE cells at day 7 of differentiation
hybridized with Xist and MS2 probes. Xist is shown in green, MS2 in red and DAPI in gray. Next
images to the right: Two different lateral sections (Z1, Z2) through the same nucleus. Far Right:
Magnifications of marked regions corresponding to the Xist-MS2-coated X-chromosome from
each plane (Z1, top; Z2, bottom). Two independent nuclei are shown in addition to the cell shown
in Figure 2h. Scale bar: 5µm.
b, Left top to bottom: consecutive axial cross-sections of the nuclei shown in (a). Right:
Magnification of regions with the Xist RNA FISH signal in the top and bottom left panels. Scale
bar: 5µm. Note the aberrant localization of Xist signal at the nuclear lamina in DE cells.
c, 3D Amira reconstructions of the Xist-MS2-coated/expressing X-chromosome and surrounding
nuclear region in WT and DE cells shown in Figure 2h Xist is shown in green, DAPI with intensity
rendering (white/low to orange/high).
d, Representative conventional epifluorescence images of RNA FISH against Xist (green) and
MS2 (red) in day 3 and 7 differentiating WT and DE cells. Chromatin staining with DAPI is shown
in blue. Inset: Enhanced image of the Xist/MS2 RNA FISH signal in DE cells at Day 7.
Epifluorescent images are shown for comparison to super-resolution images shown in Figure 2e/h
and (a).
e, Box plot showing the distribution of the area (in pixels) covered by Xist RNA FISH signal at
day 3 and 7 of differentiation in WT and DE cells, for MS2+Xist129 clouds, used for the calculation
of the Xist aggregation score in Figure 2f. 30-34 cells were counted per sample from one
experiment. 2-sample KS test revealed no significant differences between samples.
f, Box plot showing the distribution of the area (in pixels) of the bounding circle encompassing
Xist RNA FISH signal at day 3 and 7 of differentiation in WT and DE cells, for MS2+Xist129 clouds,
used for the calculation of the Xist aggregation score in Figure 2f. 30-34 cells were counted per
sample from one experiment (p-value: **** < 0.00005, 2-sample KS test).
author/funder. All rights reserved. No reuse allowed without permission. The copyright holder for this preprint (which was not peer-reviewed) is the. https://doi.org/10.1101/2020.03.09.979369doi: bioRxiv preprint

72
% Xist
clou
ds w
ith c
o-lo
caliz
ing
H3K
27m
e3 e
nric
hmen
t:
WT ΔE MS2 DAPI H3K27me3WT ΔE
Enriched
Not-Enriched
a b
ΔE Day 7
MS2 DAPIH3K27me3
WT Day 7
z-projection z-projection
c i
MS2 DAPI H3K27me3
ii
ΔE Day 7MS2H3K27me3WT Day 7
MS2H3K27me3
MS2 DAPIH3K27me3
0
25
50
75
100
3 7
Day of differentiation
*
MS2
author/funder. All rights reserved. No reuse allowed without permission. The copyright holder for this preprint (which was not peer-reviewed) is the. https://doi.org/10.1101/2020.03.09.979369doi: bioRxiv preprint

73
Extended Data Figure 9: At later stages of XCI initiation, the H3K27me3 accumulation on
the DE Xist-coated X-chromosome is less compact than in WT cells
a, Epifluorescence images of WT and DE cells at day 7 of differentiation, stained for H3K27me3
(green), a well-established heterochromatin marker of the Xi, and probed for MS2 by RNA FISH
(red). In WT cells, nearly all cells displayed H3K27me3 Xi-enrichment, whereas DE cells often
lacked this Xi-enrichment when Xist-MS2 was expressed. Arrowheads indicate expected position
of MS2 co-localizing H3K27me3 immunofluorescent signal.
b, Histogram showing the number of cells with an MS2+ Xist RNA FISH cloud that also displayed
a co-localizing accumulation of H3K27me3 at days 3 and 7 of differentiation in WT and DE cells.
60 cells with XistMS2 signal were counted per sample, from 3 coverslips over 2 independent
experiments. (p-value: * < 0.05, 2-sample students t-test). To discern enrichment, we first screened
cells using the H3K27me3 channel to identify potential H3K27me3 Xi-enrichment, which was
then confirmed by checking for a co-localizing MS2 FISH signal. An inability to confidently
discern the Xi prior to confirmation with MS2 co-localization was scored as not enriched.
c i, Top left: Lateral 3D-SIM optical sections through the nucleus of day 7 differentiating WT (left)
and DE (right) cells stained for H3K27me3 (green) and hybridized with MS2 probes (red).
Chromatin counterstaining with DAPI is shown in grey. Inset: DAPI staining of H3K27me3-
enriched region corresponding to the Xist-coated X-chromosome. Right: Magnification of inset
area showing the H3K27me3, MS2 and DAPI staining (top right) or without DAPI (bottom right).
Bottom left: Z-stack MIP of the same cell shown in the bottom right, allowing a comparison
between z-stack projection or single optical section of the magnified inset area showing
H3me3K27 (green) and MS2 (red) signals. ii, 3D Amira reconstruction of the data shown in (i).
H3K27me3 shown in green, MS2 in red. Note less dense packaging of super-resolved H3K27me3
segments around dispersed Xist MS2 signal in the DE nucleus compared to WT, suggestive of
chromatin de-compaction as shown in Extended Data Figure 10 with DAPI staining.
author/funder. All rights reserved. No reuse allowed without permission. The copyright holder for this preprint (which was not peer-reviewed) is the. https://doi.org/10.1101/2020.03.09.979369doi: bioRxiv preprint

74
author/funder. All rights reserved. No reuse allowed without permission. The copyright holder for this preprint (which was not peer-reviewed) is the. https://doi.org/10.1101/2020.03.09.979369doi: bioRxiv preprint
75
Extended Data Figure 10: DAPI staining intensity of the DE Xist-coated X-chromosome
decreases compared to WT cells at day 7 of differentiation and XCI-initiation
a, Representative epifluorescence images of day 3 differentiated WT and DE cells, probed for the
MS2 RNA tag by RNA FISH (red). DNA was stained with DAPI (displayed in blue (left) and in
grey (right)). Arrowheads point to location of the Xist cloud, highlighting the DAPI-intense
staining for WT and DE Xist-coated X-chromosomes at day 3 of differentiation.
b, Line plot showing DAPI fluorescence intensity within the MS2-Xist-expressing X-chromosome
masked by H3K27me3 enrichment in WT (blue) and DE (gray) cells, differentiated for 7 days. 10
cells were analyzed per cell line from one experiment. These data indicate that the loss of DE Xist
late in differentiation is accompanied by the loss of intense DAPI staining, a hallmark of the Xi.
author/funder. All rights reserved. No reuse allowed without permission. The copyright holder for this preprint (which was not peer-reviewed) is the. https://doi.org/10.1101/2020.03.09.979369doi: bioRxiv preprint

76
% o
f Xist c
loud
s w
ith
EZH
2 en
richm
ent
WT Day 7Xist EZH2 DAPI Xist EZH2 DAPI
Showing EZH2enrichment
Lacking EZH2enrichment
a i ii
WT Day 7
0
25
50
75
100WT ΔE
3 7Day of
differentiation
*** *
***
**
cXist
RNA PolIIDAPI
XistRNA PolII
DAPI
WT Day 7 ΔE Day 7
b
z-projection z-projection
RNA PolIIMS2
DAPIWT EpiLCDay 3.5 RNA PolII
MS2DAPI
ΔE EpiLCDay 3.5
d
0
25
50
75
100
3 7Day of
differentiation
% o
f MS
2+Xist
clo
uds
with
P
olII
excl
usio
n
WT ΔE
*n.s.
author/funder. All rights reserved. No reuse allowed without permission. The copyright holder for this preprint (which was not peer-reviewed) is the. https://doi.org/10.1101/2020.03.09.979369doi: bioRxiv preprint

77
Extended Data Figure 11: EZH2 accumulation and RNA PolII exclusion occurs on the DE-
Xist-coated X-chromosome
a i, Epifluorescence images of WT female ESCs at day 7 of differentiation stained for EZH2 (red)
and probed for Xist by RNA FISH (green), showing cells with (left) and without (right) EZH2 Xi-
enrichment.
a ii, Histogram showing the percentage of Xist clouds with a co-localized EZH2 enrichment in WT
and DE cells at day 3 and 7 of differentiation. 60-70 Xist clouds were counted per sample, from 3
coverslips from 2 independent experiments. (p-value: * < 0.05, ** < 0.005, *** < 0.0005, 2-sample
students t-test). Note that the E-repeat loss-of-function phenotype arises as the EZH2 enrichment
on the WT X-chromosome declines.
b, Lateral 3D-SIM optical sections through the nuclei of WT and DE female cells at an early stage
of XCI-initiation (epiblast-like cells (EpiLCs) at day 3.5 of differentiation from ESCs) stained for
RNA-pol II (green) and probed for Xist (red). Chromatin counterstaining with DAPI is shown in
grey. Inset: RNA-pol II and Xist signals derived from the single optical section through the Xist-
associated X-chromosome. Right: Same as inset except that PolII and Xist signals are presented
independently. Far right: Z-stack projections of the cell (upper) and Xist-coated X-chromosome
(lower). Scale bar: 5µm, Inset: 1µm.
c, 3D Amira reconstruction of WT and DE cells at day 7 of differentiation (optical slices for the
same cell are shown in Figure 3E) stained for RNA-polII (green), Xist (red), and DAPI (intensity
rendering white/low to orange/high). Inset: Enlargement of the MS2-Xist-expressing X-
chromosome. Right: Same as left with the DAPI channel removed.
d, Histogram showing quantification of RNA-PolII exclusion from XistMS2-coated territory in WT
and DE cells at day 3 and 7 of differentiation. 50 cells with XistMS2 clouds were counted from 2
coverslips from 1 differentiation experiment. Significance testing was done using a 2-tailed
students t-test (p-values: * < 0.05).
author/funder. All rights reserved. No reuse allowed without permission. The copyright holder for this preprint (which was not peer-reviewed) is the. https://doi.org/10.1101/2020.03.09.979369doi: bioRxiv preprint

78
WT ΔE WT ΔE
%ES
C n
ucle
i with
ex
pres
sion
pat
tern
:
WT ΔE WT ΔE WT ΔE
aGpc4 Chic1Atrx Mecp2
WT
ΔE
Tsix Rnf12WT
ΔE
WT
ΔE
WT
ΔE
0
25
50
75
100
0
25
50
75
100
0
25
50
75
100
0
25
50
75
100
0
25
50
75
100
b
Rnf12 Atrx Mecp2 Gpc4 Chic1
Und
iffer
entia
ted
ESC
s
Cells with bi-allelic expressionCells with expression from a single allele
0
25
50
75
100
1D 2D 3D 4D 5D 1D 2D 3D 4D 5D
WT ΔE
0
25
50
75
100
cSingle spot not co-localizing with Xist
Bi-allelic
Single spot co-localizing with Xist Lack of
silencing No Signal Monoallelic Biallelic
1 2 3 4 5 0
25
50
75
100
% c
ells
with
Tsix
pat
tern
:
1 2 3 4 5
WT ΔE
e
0 0Day of differentiation
Nas
cent
exp
ress
ion
patte
rn in
cel
ls w
ith a
n M
S2+
Xist
clo
ud:
Gpc4
Atrx
Nas
cent
exp
ress
ion
patte
rn in
cel
ls w
ith a
n M
S2+
Xist
sig
nal:
WT
cells
Single spot not co-localizing with XistBi-allelic
Single spot co-localizing with Xist Lack of
silencing
ΔE
cells
Day of differentiation
25
50
75
100%
0
0
25
50
75
100%
Chic1
7654321
Rnf12
7654321
MeCP2
7654321
Atrx
7654321
Gpc4
7654321
d
author/funder. All rights reserved. No reuse allowed without permission. The copyright holder for this preprint (which was not peer-reviewed) is the. https://doi.org/10.1101/2020.03.09.979369doi: bioRxiv preprint

79
Extended Data Figure 12: Loss of the E-repeat does not interfere with X-linked gene
expression in ESCs but prevents continued gene silencing during the initiation of XCI.
a, Histograms showing the nascent transcription pattern (mono- or bi-allelic) of indicated X-linked
genes (Rnf12 (Rlim), Atrx, Mecp2, Gpc4 and Chic1) in undifferentiated female WT and DE ESCs.
64-67 cells were counted per sample from one experiment.
b, Representative epifluorescent images of cells counted in (a). FISH signals against nascent
transcripts are shown in green and red as indicated. Co-localized foci appear yellow. DAPI is
shown in blue.
c, Histograms showing the quantification of nascent expression patterns of the X-linked genes
Gpc4 and Atrx in WT and DE cells displaying an MS2+Xist129-coated X-chromosome, across 5
days of differentiation. These data are derived from an independent differentiation from that shown
in Figure 3c. 50 cells with an MS2+Xist129 cloud were counted per time point.
d, Histograms showing the quantification of nascent expression patterns of indicated X-linked
genes in WT and DE cells displaying an MS2+Xist129-coated X-chromosome, across 7 days of
differentiation. 50 cells with an MS2+Xist129 clouds were counted per time point. These data are
derived from an independent differentiation from that shown in (c) and Figure 3c.
e, Histogram showing the quantification of nascent expression patterns of the X-linked gene Tsix
in WT and DE cells across 5 days of differentiation. Note that these data were not scored relative
to XistMS2 expression (ie are derived from cells expressing either the 129 or cas allele of Xist). 77-
167 cells were counted per time point, except for the DE cells at day 5, for which only 47 cells
were counted.
author/funder. All rights reserved. No reuse allowed without permission. The copyright holder for this preprint (which was not peer-reviewed) is the. https://doi.org/10.1101/2020.03.09.979369doi: bioRxiv preprint

80
author/funder. All rights reserved. No reuse allowed without permission. The copyright holder for this preprint (which was not peer-reviewed) is the. https://doi.org/10.1101/2020.03.09.979369doi: bioRxiv preprint

81
Extended Data Figure 13: A site-specific recombination-based approach to rescue
phenotypes associated with loss of the E-repeat via expression of MCP-fusions of E-repeat
binding proteins
a, Diagram illustrating the Flp-In approach taken to constitutively express the MCP fusion proteins
in WT and DE cells (see methods). Note that only the MCP-GFP fusion protein was expressed in
WT cells.
b, MCP-GFP fusion protein recruitment to MS2+Xist in WT cells at day 7 of differentiation is
shown with representative epifluorescent images. Cells were CSK-extracted (see methods) prior
to immunostaining for the Flag epitope (green) and RNA FISH against MS2 (red). DAPI staining
is shown in blue. Arrows indicate MS2+Xist129 clouds along with co-localizing Flag-MCP-GFP
enrichment.
c, RNA FISH images of Tsix transcripts (using a DNA probe detecting both Xist (which is not
expressed in undifferentiated ESCs) and its antisense transcript Tsix) in undifferentiated DE ESCs
expressing the indicated MCP fusion proteins as illustrated in Figure 4b. Tsix signal is in green,
DAPI in blue. 2 Tsix spots were used as a proxy to confirm presence of 2 X-chromosomes in the
targeted ESC lines.
d i, Immunoblot against PTBP1 using lysates from undifferentiated DE ESCs expressing full-
length PTBP1 or PTBP1 mutants fused to MCP. ii, Immunoblot against MATR3 using lysates
from undifferentiated DE ESCs expressing full-length MATR3 and MATR3 mutants fused to
MCP. iii, Immunoblot against TDP-43 using lysates from the undifferentiated DE ESCs expressing
full-length TDP-43 fused to MCP. iv, Immunoblot against CELF1 using lysates from the
undifferentiated DE ESCs expressing full-length CELF1 fused to MCP.
e, Histogram showing the percentage of MS2+Xist129 clouds that also show enrichment of
H3K27me3 in WT or DE cells, or DE cells expressing the indicated MCP-fusion protein,
differentiated for 7 days. 83-103 cells were counted per line, from one experiment.
f, Representative epifluorescence images of RNA FISH against Xist (green) and MS2 (red) in day
7 differentiated DE cell lines expressing the indicated variants of Flag-tagged MCP fusion proteins.
Inset: enlargement of MS2+Xist129 cloud outlined with hatched lines. Chosen clouds are
representative of the MS2+Xist129 cloud phenotype in DE cells upon rescue with the indicated
protein variant. Arrowheads indicate WT Xist clouds in DE cells, derived from the cas allele.
author/funder. All rights reserved. No reuse allowed without permission. The copyright holder for this preprint (which was not peer-reviewed) is the. https://doi.org/10.1101/2020.03.09.979369doi: bioRxiv preprint

82
PTBP1
MATR3
CELF1
TDP-43
CIZ1
Input
IgG PTBP1
MATR3
TDP-43
CELF1
CIZ1Im
mun
oblo
t
+10ug/mL RNase A
aImmunoprecipitate
author/funder. All rights reserved. No reuse allowed without permission. The copyright holder for this preprint (which was not peer-reviewed) is the. https://doi.org/10.1101/2020.03.09.979369doi: bioRxiv preprint

83
Extended Data Figure 14: PTBP1 and MATR3 interact in the absence of RNA
Immunoprecipitation of PTBP1, MATR3, CELF1, TDP-43 and CIZ1 from ESC extracts (RNase
treated) and detection of co-precipitated proteins with the same antibodies by immunoblotting (to
go with Figure 4f, where no RNAse treatment was performed).
author/funder. All rights reserved. No reuse allowed without permission. The copyright holder for this preprint (which was not peer-reviewed) is the. https://doi.org/10.1101/2020.03.09.979369doi: bioRxiv preprint

84
α-CIZ-1 (red)
α-Flag (green)
Merge
ΔE + CIZ1 (
cl 9)
ΔE+CIZ1 (cl 9) ΔE+CIZ1 (cl 10)
Tsix/Xist
ΔE + CIZ1 (
cl 10)
a
b
Xist MS2 DAPI
ΔE+CIZ1 (cl 9) ΔE+CIZ1 (cl 10)
c
100
75
50
25
0WT
ΔE
ΔE+C
IZ1
% Xist c
loud
with
MS2
sig
nal:
% Xist
c
ells
with
RN
A si
gnal
:d e Atrx
WT ΔE
100
75
50
25
0
Gpc4
WT ΔE
ΔE+C
IZ1
ΔE+C
IZ1
MS2
n.s.
author/funder. All rights reserved. No reuse allowed without permission. The copyright holder for this preprint (which was not peer-reviewed) is the. https://doi.org/10.1101/2020.03.09.979369doi: bioRxiv preprint

85
Extended Data Figure 15: Expression of a Flag-MCP-CIZ1 fusion protein does not rescue
phenotypes due to loss of the E-repeat
a, Representative RNA FISH images showing biallelic Tsix expression in MCP-CIZ1 expressing
undifferentiated DE ESCs. Tsix FISH signal is in green, DAPI in blue. 2 Tsix spots were used as a
proxy to confirm presence of 2 X-chromosomes. Two DE clones expressing the CIZ1 fusion
protein (9 and 10) are shown.
b, Immunoblot against CIZ1 and Flag using lysates from undifferentiated MCP-CIZ1 expressing
DE ESCs.
c, Representative epifluorescence images of RNA FISH s against Xist (green) and MS2 (red) in
day 7 differentiated MCP-CIZ1 expressing DE cells. Two independent clones are shown.
d, Histogram showing the number of nuclei with an Xist cloud that also displayed a co-localizing
MS2 signal, as detected by RNA FISH, in WT, DE, or DE cells expressing Flag-tagged MCP-
CIZ1. Error bar is derived from the analysis of two CIZ1 rescue clones (9 and 10) 120 – 189 cells
were counted per sample from one experiment. There was no significant difference between the
DE cells and DE cells MCP-CIZ1 rescue lines (2-tailed students t-test).
e, Histograms showing the quantification of nascent Gpc4 or Atrx nascent expression patterns in
WT, DE, or DE cells expressing Flag-tagged MCP-CIZ1 (clone 9) displaying MS2+Xist129
expression at differentiation day 7 as described in (d). 50 cells with an Xist-MS2 cloud/FISH signal
were counted per sample.
author/funder. All rights reserved. No reuse allowed without permission. The copyright holder for this preprint (which was not peer-reviewed) is the. https://doi.org/10.1101/2020.03.09.979369doi: bioRxiv preprint

86
WT Day 7
ΔE + PTBP1 Day 7
ΔE + MATR3 Day 7
ΔE + TDP-43 Day 7
0/77
1/72
3/69
67/71DAPICIZ1MS2
CIZ1 MS2 DAPI
author/funder. All rights reserved. No reuse allowed without permission. The copyright holder for this preprint (which was not peer-reviewed) is the. https://doi.org/10.1101/2020.03.09.979369doi: bioRxiv preprint

87
Extended Data Figure 16: CIZ1 does not enrich on the Xi upon rescue of the E-repeat
phenotypes with MCP-PTBP1, -MATR3 or -TDP-43
Representative fluorescence images showing the Xi-enrichment of CIZ1 (immunostaining, green)
on the MS2+Xist129 chromosome (RNA FISH, red) in WT cells at 7 days of differentiation. DAPI
stained nuclei are shown in blue. The same staining for DE cells expressing MS2-CP-PTBP1,
MS2-CP-MATR3 or MS2CP-TDP43 at day 7 of differentiation is shown below and reveals that
CIZ1 does not accumulate in these cell lines. The CIZ1 Xi-enrichment seen in WT and DE cells
expressing MCP-PTBP1, MCP-MATR3 or MCP-TDP43 that does not co-localize with the MS2+
signal derives from the Cas Xi that expresses a wild-type Xist (indicated by arrow). Arrowhead
indicates rescued cloud derived from the DE 129 allele. Numbers at the top right in the merged
image represent the percentage of MS2+ Xist129 clouds showing CIZ1 co-localization. 100 cells
with an XistMS2 cloud were counted per sample, from a single differentiation experiment.
author/funder. All rights reserved. No reuse allowed without permission. The copyright holder for this preprint (which was not peer-reviewed) is the. https://doi.org/10.1101/2020.03.09.979369doi: bioRxiv preprint

88
aΔE+MCP-GFP-MCP
Tsix/Xist
MSCP-GFP-MCP / 503aa
b c
ΔE +
MCP-GFP-
M
CP
Flag-MCP-GFP-MS2CP
Endogenous GAPDH
α-Flag
α-GAPDH
dΔE+MCP-GFP-MCP
Xist
M
S2
DA
PI
0
25
50
75
100
WT ΔE
% X
ist c
loud
s w
ith M
S2+
sign
al:
WT ΔE
Atrx
WT ΔE
ΔE+M
CP-GFP-M
CP
fGpc4
ΔE+M
CP-GFP-M
CP
ΔE+M
CP-GFP-M
CP0
25
50
75
100
e
Bi-allelic
Single spot not co-localizing with Xist
Single spot co-localizing with Xist Lack of
silencing
% X
ist
c
ells
with
RN
A si
gnal
:M
S2
*
author/funder. All rights reserved. No reuse allowed without permission. The copyright holder for this preprint (which was not peer-reviewed) is the. https://doi.org/10.1101/2020.03.09.979369doi: bioRxiv preprint

89
Extended Data Figure 17: Expression of a Flag-tagged MCP-GFP-MCP fusion protein does
not rescue the phenotypes associated with E-repeat loss
a, Representative RNA FISH images showing biallelic Tsix expression in MCP-GFP-MCP
expressing undifferentiated DE ESCs. Tsix FISH signal is in green, DAPI in blue. 2 Tsix spots were
used as a proxy to confirm presence of 2 X-chromosomes.
b, Illustration of Flag-tagged MCP-GFP-MCP fusion protein. See Figure 4b for key.
c, Immunoblot against the Flag-tag and GAPDH using lysates from undifferentiated MCP-GFP-
MCP DE ESCs.
d, Representative epifluorescence images of Xist (green) and MS2 (red) detected by RNA FISH in
day 7 differentiated MCP-GFP-MCP-expressing DE cells.
e, Histogram showing the percentage of Xist clouds with co-localizing MS2 signal at day 7 of
differentiation for WT or DE cells and DE cells expressing the Flag-MCP-GFP-MCP fusion
protein. 108-144 cells were counted per sample from 2 independent clones from one differentiation
experiment. There was no significant difference between the DE cells and experimental DE MCP-
GFP-MCP rescue lines (2-tailed students t-test).
f, Histograms showing the quantification of nascent Gpc4 or Atrx nascent expression patterns in
cells displaying MS2+ Xist expression at differentiation day 7 in WT or DE cells and DE cells
expressing the Flag-MCP-GFP-MCP fusion protein. 50 cells were counted per sample from one
experiment.
author/funder. All rights reserved. No reuse allowed without permission. The copyright holder for this preprint (which was not peer-reviewed) is the. https://doi.org/10.1101/2020.03.09.979369doi: bioRxiv preprint

90
60μM rPTBP1 3.2μM E-Repeat RNA 3.2μM Control-1 RNAa
b
2.5 min 10 min 20 min 40 min 60 min
100μm
100μm
60μM rPTBP1 + 0.5μM E-Repeat RNA, 10μL reaction
author/funder. All rights reserved. No reuse allowed without permission. The copyright holder for this preprint (which was not peer-reviewed) is the. https://doi.org/10.1101/2020.03.09.979369doi: bioRxiv preprint

91
Extended Data Figure 18: Droplet formation by PTBP1 and Xist E-repeat RNA occurs over
time
a, Brightfield images showing the absence of droplet formation with 60µM rPTBP1 only, 3.2µM
E-Repeat RNA only, or 3.2µM Control RNA only.
b, Brightfield images of droplets formed with 60µM rPTBP1 and 3.2µM E-repeat RNA taken over
a 1h time course.
author/funder. All rights reserved. No reuse allowed without permission. The copyright holder for this preprint (which was not peer-reviewed) is the. https://doi.org/10.1101/2020.03.09.979369doi: bioRxiv preprint

92
aΔE+MATR3 S85C
Tsix/Xist
ΔE+TDP-43 4xM
Tsix/Xist
ΔE +
TDP-43 4x
M
Flag-MCP-TDP43 4xM
Endogenous TDP-43α-T
DP4
3
ii
Flag-MCP-MATR3 S85CEndogenous MATR3
α-M
ATR
3
ΔE +
MATR3 S85
C
c iΔE+MATR3 S85C ΔE+TDP-43 4xM
Xist MS2 DAPI
ii
b i
Xist MS2 DAPI
author/funder. All rights reserved. No reuse allowed without permission. The copyright holder for this preprint (which was not peer-reviewed) is the. https://doi.org/10.1101/2020.03.09.979369doi: bioRxiv preprint

93
Extended Data Figure 19: Mutations in MATR3 and TDP-43 that prevent self-association of
these factors do not rescue the phenotypes observed upon loss of the E-repeat
a, Representative RNA FISH images showing biallelic Tsix expression in MCP-MATR3-S85C
and MCP-TDP-43-4xM expressing undifferentiated DE ESCs. Tsix FISH signal is in green, DAPI
in blue. 2 Tsix spots were used as a proxy to confirm presence of 2 X chromosomes.
b i, Immunoblot against MATR3 using lysates from MCP-MATR3 S85C expressing
undifferentiated DE ESCs. ii, Immunoblot against TDP-43 using lysates from MCP-TDP-43-4xM
expressing undifferentiated DE ESCs.
c, Representative fluorescence images of Xist (green) and MS2 (red) in day 7 differentiated Flag-
MCP-MATR3-S85C expressing DE cells (i), and Flag-MCP- TDP-43-4xM expressing DE cells
(ii).
author/funder. All rights reserved. No reuse allowed without permission. The copyright holder for this preprint (which was not peer-reviewed) is the. https://doi.org/10.1101/2020.03.09.979369doi: bioRxiv preprint

94
a
XistDAPI
XistDAPI
No Dox + Dox
100% 100%
author/funder. All rights reserved. No reuse allowed without permission. The copyright holder for this preprint (which was not peer-reviewed) is the. https://doi.org/10.1101/2020.03.09.979369doi: bioRxiv preprint

95
Extended Data Figure 20: Dox treatment effectively deletes Xist in engineered MEFs
a, Images showing Xist as detected by RNA FISH in MEFs (Xist2lox/2lox, Rosa26M2rtTA/tetO-Cre-
recombinase) before or after 96h of dox treatment. Numbers indicate percentage of cells with the
displayed Xist expression pattern across 50 cells from 2 biological replicates. These data indicate
that Xist excision completes in all cells.
author/funder. All rights reserved. No reuse allowed without permission. The copyright holder for this preprint (which was not peer-reviewed) is the. https://doi.org/10.1101/2020.03.09.979369doi: bioRxiv preprint
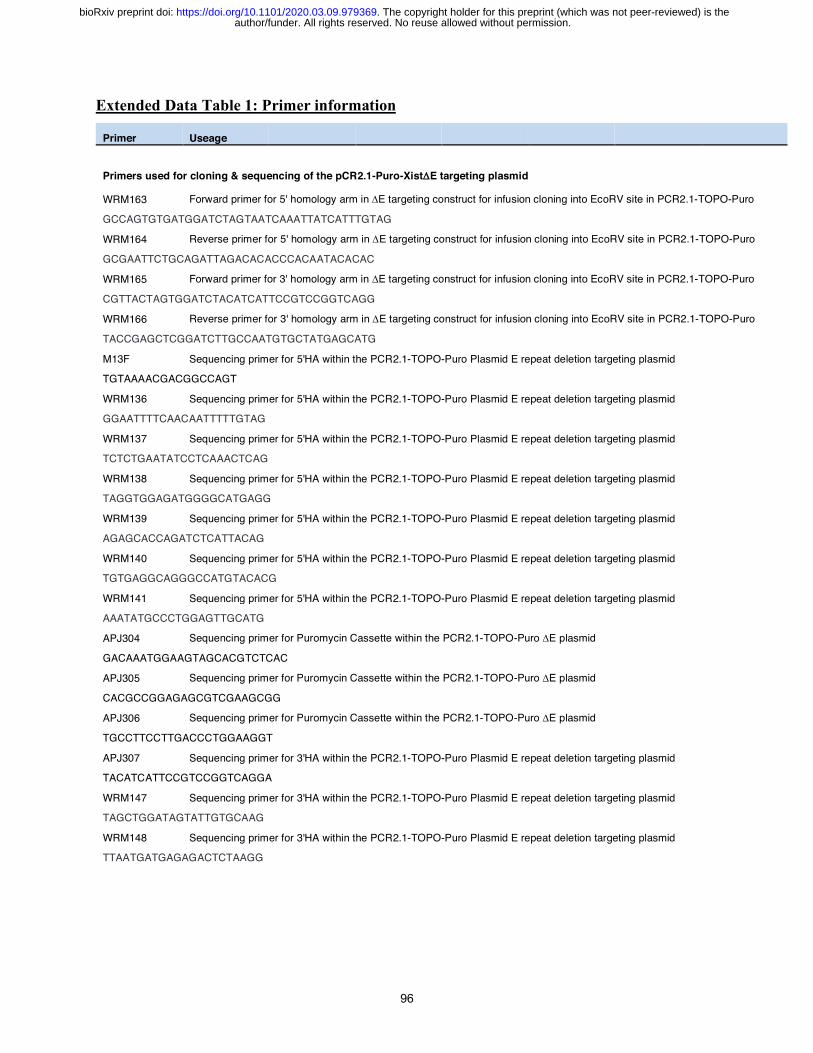
96
Extended Data Table 1: Primer information
Primer Useage
Primers used for cloning & sequencing of the pCR2.1-Puro-XistDE targeting plasmid WRM163 Forward primer for 5' homology arm in DE targeting construct for infusion cloning into EcoRV site in PCR2.1-TOPO-Puro
GCCAGTGTGATGGATCTAGTAATCAAATTATCATTTGTAG
WRM164 Reverse primer for 5' homology arm in DE targeting construct for infusion cloning into EcoRV site in PCR2.1-TOPO-Puro
GCGAATTCTGCAGATTAGACACACCCACAATACACAC
WRM165 Forward primer for 3' homology arm in DE targeting construct for infusion cloning into EcoRV site in PCR2.1-TOPO-Puro
CGTTACTAGTGGATCTACATCATTCCGTCCGGTCAGG
WRM166 Reverse primer for 3' homology arm in DE targeting construct for infusion cloning into EcoRV site in PCR2.1-TOPO-Puro
TACCGAGCTCGGATCTTGCCAATGTGCTATGAGCATG
M13F Sequencing primer for 5'HA within the PCR2.1-TOPO-Puro Plasmid E repeat deletion targeting plasmid
TGTAAAACGACGGCCAGT
WRM136 Sequencing primer for 5'HA within the PCR2.1-TOPO-Puro Plasmid E repeat deletion targeting plasmid
GGAATTTTCAACAATTTTTGTAG
WRM137 Sequencing primer for 5'HA within the PCR2.1-TOPO-Puro Plasmid E repeat deletion targeting plasmid
TCTCTGAATATCCTCAAACTCAG
WRM138 Sequencing primer for 5'HA within the PCR2.1-TOPO-Puro Plasmid E repeat deletion targeting plasmid
TAGGTGGAGATGGGGCATGAGG
WRM139 Sequencing primer for 5'HA within the PCR2.1-TOPO-Puro Plasmid E repeat deletion targeting plasmid
AGAGCACCAGATCTCATTACAG
WRM140 Sequencing primer for 5'HA within the PCR2.1-TOPO-Puro Plasmid E repeat deletion targeting plasmid
TGTGAGGCAGGGCCATGTACACG
WRM141 Sequencing primer for 5'HA within the PCR2.1-TOPO-Puro Plasmid E repeat deletion targeting plasmid
AAATATGCCCTGGAGTTGCATG
APJ304 Sequencing primer for Puromycin Cassette within the PCR2.1-TOPO-Puro DE plasmid
GACAAATGGAAGTAGCACGTCTCAC
APJ305 Sequencing primer for Puromycin Cassette within the PCR2.1-TOPO-Puro DE plasmid
CACGCCGGAGAGCGTCGAAGCGG
APJ306 Sequencing primer for Puromycin Cassette within the PCR2.1-TOPO-Puro DE plasmid
TGCCTTCCTTGACCCTGGAAGGT
APJ307 Sequencing primer for 3'HA within the PCR2.1-TOPO-Puro Plasmid E repeat deletion targeting plasmid
TACATCATTCCGTCCGGTCAGGA
WRM147 Sequencing primer for 3'HA within the PCR2.1-TOPO-Puro Plasmid E repeat deletion targeting plasmid
TAGCTGGATAGTATTGTGCAAG
WRM148 Sequencing primer for 3'HA within the PCR2.1-TOPO-Puro Plasmid E repeat deletion targeting plasmid
TTAATGATGAGAGACTCTAAGG
author/funder. All rights reserved. No reuse allowed without permission. The copyright holder for this preprint (which was not peer-reviewed) is the. https://doi.org/10.1101/2020.03.09.979369doi: bioRxiv preprint

97
Extended Data Table 1: Primer information (continued)
Primer Useage
Primers used to characterize the Xist DE cells (Southern, PCR) WRM193 Forward primer for amplification of Southern Probe to detect E repeat deletion
CATCAGACTCTGGCTGTTTAGAC WRM194 Reverse primer for amplification of Southern Probe to detect E repeat deletion
TAATGCATGGAGTCTTTCACTC APJ439 Forward Primer to check for Cre Recombinase removal of lox-Puromycin-lox cassette
CTTTGCCCTTCCCTGTTTCT APJ440 Reverse Primer to check for Cre Recombinase removal of lox-Puromycin-lox cassette
GACGGGCCATCTGTGTATTT APJ223 Xist Exon 1 Forward Primer from Engreitz et al. Science 2013 AGTGCTCTATACGTGGCGGT APJ224 Xist Exon 1 Reverse Primer from Engreitz et al. Science 2013 ATGCAACCCCAGCAATAGTC APJ264 Xist Intron 6 Forward Primer - with APJ624 or 631 confirmed correct cre-mediated excision of the E repeat
gcccttccctgtttcttgtt APJ248 Xist Exon 6 Forward Primer - with APJ624 or 631 was used to confirm splicing across intron 6 (qPCR)
AGCGTGATCAAGCAATGTGA
APJ624 Xist Exon 7 Reverse Primer in E repeat for WT and used as the reverse primer for qPCR analysis of exon 6 -7
and to generate short E repeat in vitro transcription template for Beta-Isox experiments
GATATAACAAAGAATTAGACACAATGC APJ631 Xist Exon 7 Reverse Primer downstream of E repeat for DE transcripts
CTTAGGTCTTATGCTTGGACTTAG Primers used to clone & sequence the pBS32-FRT parent and fusion protein expression plasmids
APJ526 Forward Infusion primer for Flag-MS2CP to make the MS2CP-Nhe1 linker-IRES-Puro pBS32 plasmid
ttttggcaaaGAATTGCCACCatggactacaaagaccatgacggtgattataaagatcatgatatcgattacaaggatgacgatgacggtgga
ATGGCTTCTAACTTTACTCAGTTCG APJ570 Reverse Infusion primer for MS2CP to make the MS2CP-Nhe1 linker-IRES-Puro pBS32 plasmid
CTTCGGCCAGTAACGtccGCTAGCccGTAGATGCCGGAGTTTGCTGCG APJ528 Forward infusion primer for IRES to make the MS2CP-Nhe1 linker-IRES-Puro pBS32 plasmid
CGTTACTGGCCGAAGCCGCTTGG APJ571 Reverse infusion primer for IRES to make the MS2CP-Nhe1 linker-IRES-Puro pBS32 plasmid
ATTATCATCGTGTTTTTCAAAGG
APJ572 Forward infusion primer for Puromycin cassette to make the MS2CP-Nhe1 linker-IRES-Puro pBS32 plasmid
AAACACGATGATAATATGACCGAGTACAAGCCCACGGTGC
author/funder. All rights reserved. No reuse allowed without permission. The copyright holder for this preprint (which was not peer-reviewed) is the. https://doi.org/10.1101/2020.03.09.979369doi: bioRxiv preprint

98
Extended Data Table 1: Primer information (continued)
Primer Useage
APJ533 Reverse infusion primer for puromycin cassette to make the MS2CP-Nhe1 linker-IRES-Puro pBS32 plasmid
cctgaggagtGAATTTCAGGCACCGGGCTTGCGGGTCATG APJ573 Forward infusion primer for eGFP into Nhe1 cut site within MS2CP-Nhe1 linker-IRES-Puro pBS32 plasmid
GCATCTACggGCTAGggATGGTGAGCAAGGGCGAGGAG APJ574 Reverse infusion primer for eGFP into Nhe1 cut site within MS2CP-Nhe1 linker-IRES-Puro pBS32 plasmid
AGTAACGtccGCTAGTTACTTGTACAGCTCGTCCATG APJ575 Forward infusion primer for WT Matrin3 into Nhe1 cut site within MS2CP-Nhe1 linker-IRES-Puro pBS32 plasmid
GCATCTACggGCTAGggATGTCCAAGTCATTCCAGCAGTC APJ576 Reverse infusion primer for WT Matrin3 into Nhe1 cut site within MS2CP-Nhe1 linker-IRES-Puro pBS32 plasmid
AGTAACGtccGCTAGTTAAGTTTCCTTCTTCTGTCTGC APJ575 Forward infusion primer for 5' fragment of mutPRI Matrin3 into Nhe1 site (2 piece infusion ) within pBS32-MS2CP-Nhe1
GCATCTACggGCTAGggATGTCCAAGTCATTCCAGCAGTC APJ586 Reverse infusion primer for 5' fragment of mutPRI Matrin3 into Nhe1 site (2 piece infusion ) within pBS32-MS2CP-Nhe1
TGGTGCTGGATTTGTAGACTGCTG APJ585 Forward infusion primer for 3' fragment of mutPRI Matrin3 into Nhe1 site (2 piece infusion ) within pBS32-MS2CP-Nhe1
ACAAATCCAGCACCAGGAGCCGCCGCCCCTCCAGCCCCCTCATTTCATCTTGGGGGACCAGC APJ576 Reverse infusion primer for 3' fragment of mutPRI Matrin3 into Nhe1 site (2 piece infusion ) within pBS32-MS2CP-Nhe1
AGTAACGtccGCTAGTTAAGTTTCCTTCTTCTGTCTGC APJ577 Forward infusion primer for PTBP1 into Nhe1 cut site (for 1 piece infusion insertion) within pBS32-MS2CP-Nhe1
GCATCTACggGCTAGggATGGACGGCATTGTCCCAGATATAG APJ578 Reverse infusion primer for PTBP1 into Nhe1 cut site (for1 piece infusion insertion) within pBS32-MS2CP-Nhe1
AGTAACGtccGCTAGTTAGATGGTGGACTTGGAGAAGG APJ577 Forward infusion primer for 5' fragment of WT PTBP1 into Nhe1 site (2 piece infusion) within pBS32-MS2CP-Nhe1
GCATCTACggGCTAGggATGGACGGCATTGTCCCAGATATAG APJ609 Reverse infusion primer for 5' fragment of WT PTBP1 into Nhe1 site (2 piece infusion) within pBS32-MS2CP-Nhe1
AGCGTGCAGCAGGCGTTGTAGATGTTCTGCCCGTCCAGCG APJ581 Forward infusion primer for 3' fragment of WT PTBP1 into Nhe1 site (2 piece infusion) within pBS32-MS2CP-Nhe1
CGCCTGCTGCACGCTGCGCATCGAC APJ578 Reverse infusion primer for 3' fragment of WT PTBP1 into Nhe1 site (2 piece infusion) within pBS32-MS2CP-Nhe1
AGTAACGtccGCTAGTTAGATGGTGGACTTGGAGAAGG APJ577 Forward infusion primer for 5' fragment of Y247Q PTBP1 into Nhe1 site (2 piece infusion) within pBS32-MS2CP-Nhe1
GCATCTACggGCTAGggATGGACGGCATTGTCCCAGATATAG APJ582 Forward infusion primer for 5' fragment of Y247Q PTBP1 into Nhe1 site (2 piece infusion) within pBS32-MS2CP-Nhe1
AGCGTGCAGCAGGCGTTctgGATGTTCTGCCCGTCCAGCG APJ581 Forward infusion primer for 3' fragment of Y247Q PTBP1 into Nhe1 site (2 piece infusion) within pBS32-MS2CP-Nhe1
CGCCTGCTGCACGCTGCGCATCGAC
author/funder. All rights reserved. No reuse allowed without permission. The copyright holder for this preprint (which was not peer-reviewed) is the. https://doi.org/10.1101/2020.03.09.979369doi: bioRxiv preprint
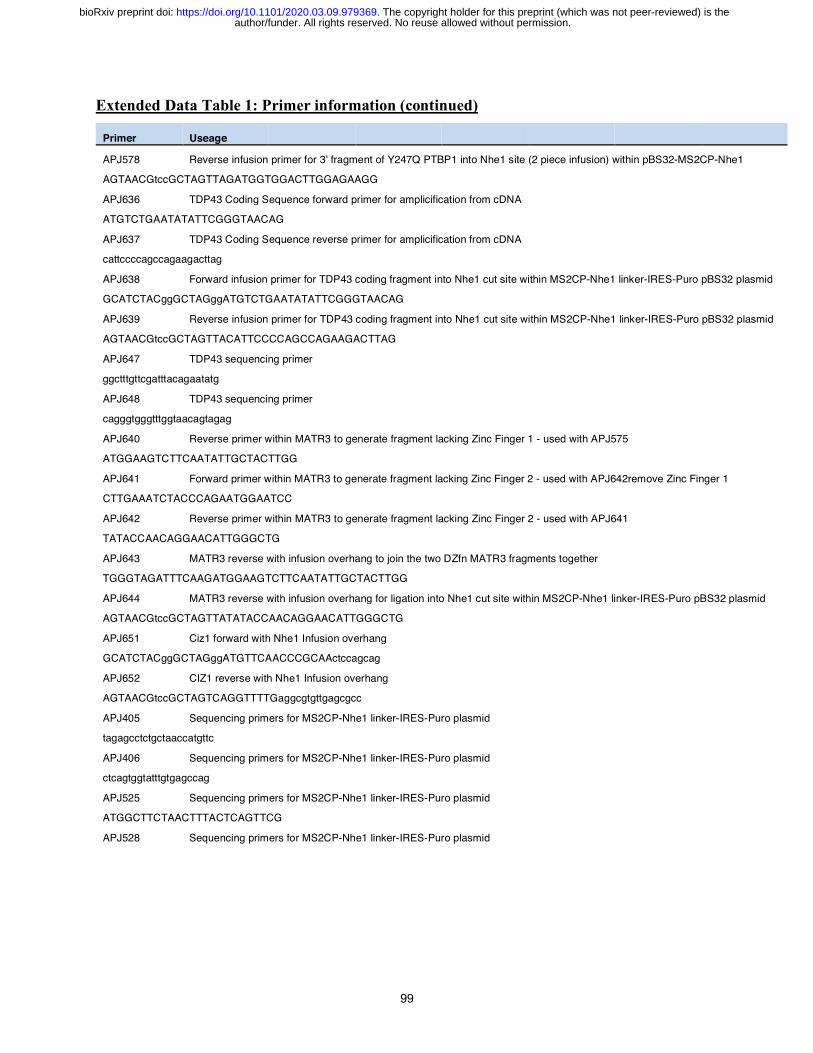
99
Extended Data Table 1: Primer information (continued)
Primer Useage
APJ578 Reverse infusion primer for 3' fragment of Y247Q PTBP1 into Nhe1 site (2 piece infusion) within pBS32-MS2CP-Nhe1
AGTAACGtccGCTAGTTAGATGGTGGACTTGGAGAAGG APJ636 TDP43 Coding Sequence forward primer for amplicification from cDNA ATGTCTGAATATATTCGGGTAACAG APJ637 TDP43 Coding Sequence reverse primer for amplicification from cDNA cattccccagccagaagacttag APJ638 Forward infusion primer for TDP43 coding fragment into Nhe1 cut site within MS2CP-Nhe1 linker-IRES-Puro pBS32 plasmid
GCATCTACggGCTAGggATGTCTGAATATATTCGGGTAACAG APJ639 Reverse infusion primer for TDP43 coding fragment into Nhe1 cut site within MS2CP-Nhe1 linker-IRES-Puro pBS32 plasmid
AGTAACGtccGCTAGTTACATTCCCCAGCCAGAAGACTTAG APJ647 TDP43 sequencing primer ggctttgttcgatttacagaatatg APJ648 TDP43 sequencing primer cagggtgggtttggtaacagtagag APJ640 Reverse primer within MATR3 to generate fragment lacking Zinc Finger 1 - used with APJ575
ATGGAAGTCTTCAATATTGCTACTTGG APJ641 Forward primer within MATR3 to generate fragment lacking Zinc Finger 2 - used with APJ642remove Zinc Finger 1
CTTGAAATCTACCCAGAATGGAATCC APJ642 Reverse primer within MATR3 to generate fragment lacking Zinc Finger 2 - used with APJ641
TATACCAACAGGAACATTGGGCTG APJ643 MATR3 reverse with infusion overhang to join the two DZfn MATR3 fragments together
TGGGTAGATTTCAAGATGGAAGTCTTCAATATTGCTACTTGG APJ644 MATR3 reverse with infusion overhang for ligation into Nhe1 cut site within MS2CP-Nhe1 linker-IRES-Puro pBS32 plasmid
AGTAACGtccGCTAGTTATATACCAACAGGAACATTGGGCTG APJ651 Ciz1 forward with Nhe1 Infusion overhang GCATCTACggGCTAGggATGTTCAACCCGCAActccagcag APJ652 CIZ1 reverse with Nhe1 Infusion overhang AGTAACGtccGCTAGTCAGGTTTTGaggcgtgttgagcgcc APJ405 Sequencing primers for MS2CP-Nhe1 linker-IRES-Puro plasmid tagagcctctgctaaccatgttc APJ406 Sequencing primers for MS2CP-Nhe1 linker-IRES-Puro plasmid ctcagtggtatttgtgagccag APJ525 Sequencing primers for MS2CP-Nhe1 linker-IRES-Puro plasmid ATGGCTTCTAACTTTACTCAGTTCG APJ528 Sequencing primers for MS2CP-Nhe1 linker-IRES-Puro plasmid
author/funder. All rights reserved. No reuse allowed without permission. The copyright holder for this preprint (which was not peer-reviewed) is the. https://doi.org/10.1101/2020.03.09.979369doi: bioRxiv preprint

100
Extended Data Table 1: Primer information (continued)
Primer Useage
CGTTACTGGCCGAAGCCGCTTGG APJ530 Sequencing primers for MS2CP-Nhe1 linker-IRES-Puro plasmid ATGACCGAGTACAAGCCCACGGTGC APJ606 Sequencing primers for MS2CP-Nhe1 linker-IRES-Puro plasmid GCCTCTGCGGCCAAAAGCCACGTG APJ607 Sequencing primers for MS2CP-Nhe1 linker-IRES-Puro plasmid GTCACCGAGCTGCAAGAACT APJ608 Sequencing primers for MS2CP-Nhe1 linker-IRES-Puro plasmid CACCAGGGCAAGGGTCTG APJ612 Sequencing primers for MS2CP-Nhe1 linker-IRES-Puro plasmid GTGTATAAGATACACCTGCAAAGG APJ595 Sequencing primers for MS2CP-Nhe1 linker-IRES-Puro plasmid with PTBP1 WT and/or Mutant inserted
CCGTGGACGCAGGGATGGCGATGG APJ596 Sequencing primers for MS2CP-Nhe1 linker-IRES-Puro plasmid with PTBP1 WT and/or Mutant inserted
CTGGCCCCCCTGGCCATCCCCTcg APJ597 Sequencing primers for MS2CP-Nhe1 linker-IRES-Puro plasmid with PTBP1 WT and/or Mutant inserted
CAGTCTCCGAGGAGGATCTCAAGG APJ598 Sequencing primers for MS2CP-Nhe1 linker-IRES-Puro plasmid with Matrin3 WT and/or Mutants inserted
GGAGCCACCATACAGAGTACC APJ599 Sequencing primers for MS2CP-Nhe1 linker-IRES-Puro plasmid with Matrin3 WT and/or Mutants inserted
CAGGACACACAATGGGTGATCC APJ600 Sequencing primers for MS2CP-Nhe1 linker-IRES-Puro plasmid with Matrin3 WT and/or Mutants inserted
CTCAGCAATTTGCCGCATTCTGGC APJ601 Sequencing primers for MS2CP-Nhe1 linker-IRES-Puro plasmid with Matrin3 WT and/or Mutants inserted
GTGGGAGACGAGACCGATCTTGC APJ602 Sequencing primers for MS2CP-Nhe1 linker-IRES-Puro plasmid with Celf-1 inserted
GCACCAAGCACAGACCATGGAGG APJ603 Sequencing primers for MS2CP-Nhe1 linker-IRES-Puro plasmid with Celf-1 inserted
ATGGTGGCCTGGGCAGCAGTGG APJ604 Sequencing primers for MS2CP-Nhe1 linker-IRES-Puro plasmid with eGFP inserted
ATGGTGAGCAAGGGCGAGGAG APJ605 Sequencing primers for MS2CP-Nhe1 linker-IRES-Puro plasmid with eGFP inserted
CTATATCATGGCCGACAAGCAG APJ647 Sequencing primers for MS2CP-Nhe1 linker-IRES-Puro plasmid with TDP-43 inserted
ggctttgttcgatttacagaatatg
author/funder. All rights reserved. No reuse allowed without permission. The copyright holder for this preprint (which was not peer-reviewed) is the. https://doi.org/10.1101/2020.03.09.979369doi: bioRxiv preprint

101
Extended Data Table 1: Primer information (continued)
Primer Useage
APJ648 Sequencing primers for MS2CP-Nhe1 linker-IRES-Puro plasmid with TDP-43 inserted
cagggtgggtttggtaacagtagag APJ653 Sequencing primers for MS2CP-Nhe1 linker-IRES-Puro plasmid with CIZ1 inserted
gtgacagccccaagcctagcagctccc APJ654 Sequencing primers for MS2CP-Nhe1 linker-IRES-Puro plasmid with CIZ1 inserted
gcagccacaagcaagggtccagcc APJ655 Sequencing primers for MS2CP-Nhe1 linker-IRES-Puro plasmid with CIZ1 inserted
gaacaagcgtcaggtccagcc APJ656 Sequencing primers for MS2CP-Nhe1 linker-IRES-Puro plasmid with CIZ1 inserted
caacactcgagccagacctgcc APJ657 Sequencing primers for MS2CP-Nhe1 linker-IRES-Puro plasmid with CIZ1 inserted
gcaggtgaagccgagagaaacatcc APJ658 Sequencing primers for MS2CP-Nhe1 linker-IRES-Puro plasmid with CIZ1 inserted
CAGACCCACCGAACCAAGCTCAG APJ659 Sequencing primers for MS2CP-Nhe1 linker-IRES-Puro plasmid with CIZ1 inserted
GGATCTTCCGCTTCTTTCTCCAG APJ660 Sequencing primers for MS2CP-Nhe1 linker-IRES-Puro plasmid with CIZ1 inserted
GTTGCACCAGCGTTTGGGCGGAG APJ405 pBS32 Forward sequencing primer upstream of EcoR1 site tagagcctctgctaaccatgttc APJ406 pBS32 Reverse sequencing primer upstream of EcoR1 site ctcagtggtatttgtgagccag Primers used to assess Xist abundance and splicing APJ236 Xist Exon 1 Forward splicing primer (qPCR) TGCTCCTCCGTTACATCAGA APJ237 Xist Exon 2 Reverse splicing primer (qPCR) GGCAGGAGCACAAAACAGAC APJ617 MS2 Forward Primer (qPCR) CCTAGCCTAGTCTAGATCCGCG APJ618 MS2 Reverse Primer (qPCR) and for PCR amplification of MS2 in vitro transcription template
and for synthesis of Control 2 RNA in the biotinylated-Isoxazole experiments
GCAGGGAAGGAAATTAATGTTACTCAG APJ614 T7-Forward primer for PCR amplification of MS2 in vitro transcription template
and for synthesis of Control 2 RNA in the biotinylated-Isoxazole experiments
TAATACGACTCACTATAGCCTAGCCTAGTCTAGATCCGCG
author/funder. All rights reserved. No reuse allowed without permission. The copyright holder for this preprint (which was not peer-reviewed) is the. https://doi.org/10.1101/2020.03.09.979369doi: bioRxiv preprint
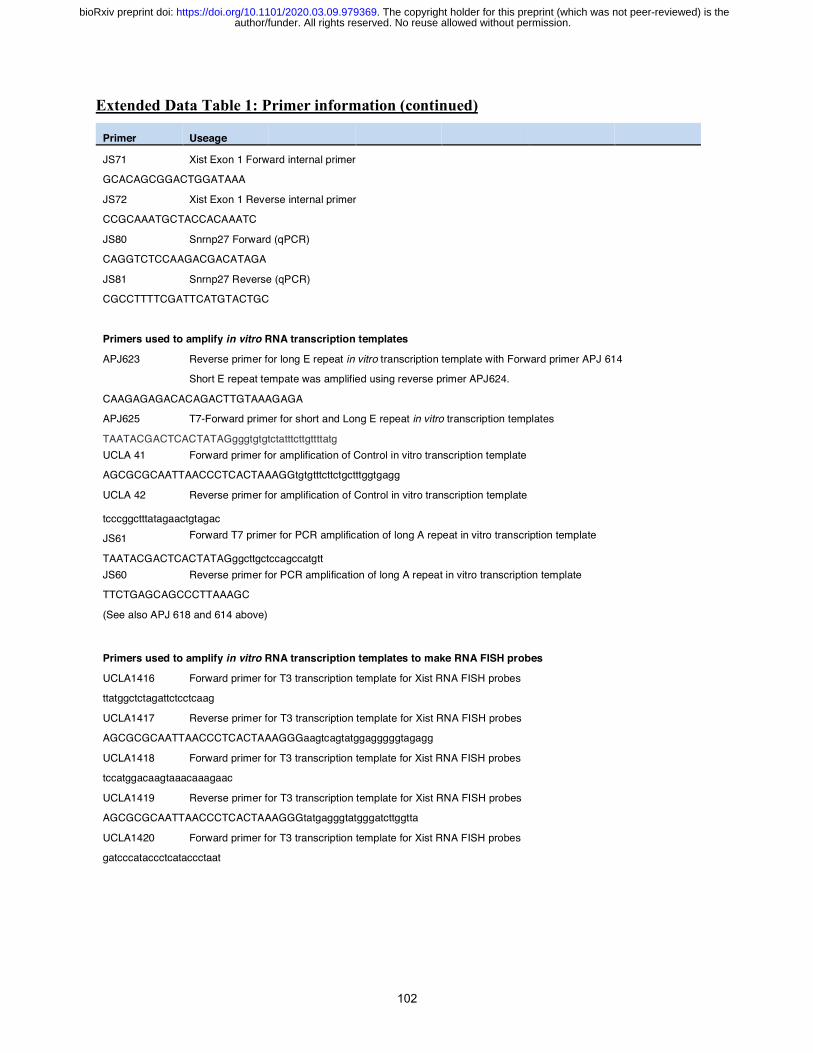
102
Extended Data Table 1: Primer information (continued)
Primer Useage
JS71 Xist Exon 1 Forward internal primer GCACAGCGGACTGGATAAA JS72 Xist Exon 1 Reverse internal primer CCGCAAATGCTACCACAAATC JS80 Snrnp27 Forward (qPCR) CAGGTCTCCAAGACGACATAGA JS81 Snrnp27 Reverse (qPCR) CGCCTTTTCGATTCATGTACTGC Primers used to amplify in vitro RNA transcription templates
APJ623 Reverse primer for long E repeat in vitro transcription template with Forward primer APJ 614
Short E repeat tempate was amplified using reverse primer APJ624.
CAAGAGAGACACAGACTTGTAAAGAGA APJ625 T7-Forward primer for short and Long E repeat in vitro transcription templates
TAATACGACTCACTATAGgggtgtgtctatttcttgttttatg UCLA 41 Forward primer for amplification of Control in vitro transcription template
AGCGCGCAATTAACCCTCACTAAAGGtgtgtttcttctgctttggtgagg UCLA 42 Reverse primer for amplification of Control in vitro transcription template
tcccggctttatagaactgtagac JS61 Forward T7 primer for PCR amplification of long A repeat in vitro transcription template
TAATACGACTCACTATAGggcttgctccagccatgtt JS60 Reverse primer for PCR amplification of long A repeat in vitro transcription template
TTCTGAGCAGCCCTTAAAGC (See also APJ 618 and 614 above) Primers used to amplify in vitro RNA transcription templates to make RNA FISH probes
UCLA1416 Forward primer for T3 transcription template for Xist RNA FISH probes
ttatggctctagattctcctcaag UCLA1417 Reverse primer for T3 transcription template for Xist RNA FISH probes
AGCGCGCAATTAACCCTCACTAAAGGGaagtcagtatggagggggtagagg UCLA1418 Forward primer for T3 transcription template for Xist RNA FISH probes
tccatggacaagtaaacaaagaac UCLA1419 Reverse primer for T3 transcription template for Xist RNA FISH probes
AGCGCGCAATTAACCCTCACTAAAGGGtatgagggtatgggatcttggtta UCLA1420 Forward primer for T3 transcription template for Xist RNA FISH probes
gatcccataccctcataccctaat
author/funder. All rights reserved. No reuse allowed without permission. The copyright holder for this preprint (which was not peer-reviewed) is the. https://doi.org/10.1101/2020.03.09.979369doi: bioRxiv preprint
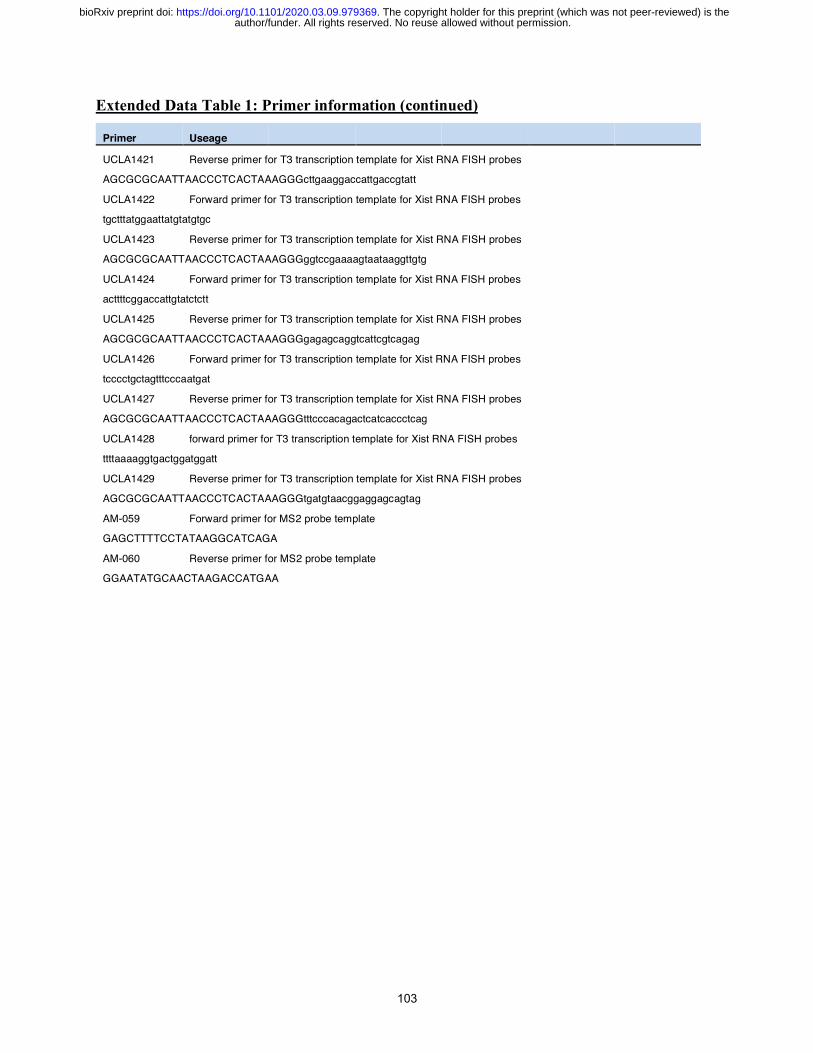
103
Extended Data Table 1: Primer information (continued)
Primer Useage
UCLA1421 Reverse primer for T3 transcription template for Xist RNA FISH probes
AGCGCGCAATTAACCCTCACTAAAGGGcttgaaggaccattgaccgtatt UCLA1422 Forward primer for T3 transcription template for Xist RNA FISH probes
tgctttatggaattatgtatgtgc UCLA1423 Reverse primer for T3 transcription template for Xist RNA FISH probes
AGCGCGCAATTAACCCTCACTAAAGGGggtccgaaaagtaataaggttgtg UCLA1424 Forward primer for T3 transcription template for Xist RNA FISH probes
acttttcggaccattgtatctctt UCLA1425 Reverse primer for T3 transcription template for Xist RNA FISH probes
AGCGCGCAATTAACCCTCACTAAAGGGgagagcaggtcattcgtcagag UCLA1426 Forward primer for T3 transcription template for Xist RNA FISH probes
tcccctgctagtttcccaatgat UCLA1427 Reverse primer for T3 transcription template for Xist RNA FISH probes
AGCGCGCAATTAACCCTCACTAAAGGGtttcccacagactcatcaccctcag UCLA1428 forward primer for T3 transcription template for Xist RNA FISH probes
ttttaaaaggtgactggatggatt UCLA1429 Reverse primer for T3 transcription template for Xist RNA FISH probes
AGCGCGCAATTAACCCTCACTAAAGGGtgatgtaacggaggagcagtag AM-059 Forward primer for MS2 probe template GAGCTTTTCCTATAAGGCATCAGA AM-060 Reverse primer for MS2 probe template GGAATATGCAACTAAGACCATGAA
author/funder. All rights reserved. No reuse allowed without permission. The copyright holder for this preprint (which was not peer-reviewed) is the. https://doi.org/10.1101/2020.03.09.979369doi: bioRxiv preprint

104
Extended Data Table 2: Antibody Information
Antigen Company Cat # Assay Dilution Additional notes
H3K27me3 Millipore 07-449 Immunofluorescence 1:400
H3K27me3 Active Motif 39536 Immunofluorescence 1:400
RNA Polymerase II Millipore 05-623 Immunofluorescence 1:1000
Matrin3 Abcam ab151714 Immunofluorescence 1:1000
Used for CLiP Immunoblot 1:1000
PTBP1 Abcam ab5642 Immunofluorescence 1:1000 Used for CLIP/ChIP
Immunoblot 1:1000 and co-IP
PTBP1 (N-Term) Douglas Black Lab N/A Immunofluorescence 1:1000
Immunoblot 1:1000
PTBP1 (C-Term) Douglas Black Lab N/A Immunofluorescence 1:1000
Immunoblot 1:1000
GAPDH Fitzgerald 10R-G109a Immunoblot 1:5000
hnRNPU/SAF-A Abcam ab20666 Immunofluorescence 1:1000
Immunoblot 1:1000
Ezh2 BD Biosciences 612667 Immunofluorescence 1:200
Flag-M2 Sigma F1804 Immunofluorescence 1:1000
Immunoblot 1:5000
Flag Sigma F7425 Immunofluorescence 1:1000
Nanog Abcam ab80892 Immunofluorescence 1:100
Immunoblot 1:500
CELF1/CUG-BP1 Abcam ab129115 Immunofluorescence 1:1000
Used for CliP Immunoblot 1:5000
CIZ1 Novus Biologicals NB100-74624 Immunofluorescence 1:1000
CIZ1 ThermoFisher PA527625 Immunoblot 1:500 Used for Co-IP
TDP-43 Abcam ab109535 Immunofluorescence 1:700
Immunoblot 1:700
Eed Homemade (Arie Otte) N/A Immunofluorescence 1:100 Clone M26
Suz12 Abcam ab12201 Immunofluorescence 1:1000
Rabbit Normal IgG Abcam ab171870 Immunoprecipitation 5ug
author/funder. All rights reserved. No reuse allowed without permission. The copyright holder for this preprint (which was not peer-reviewed) is the. https://doi.org/10.1101/2020.03.09.979369doi: bioRxiv preprint