analyses of local climatological factors controlling risk of road slipperiness during warm-air...
TRANSCRIPT

INTERNATIONAL JOURNAL OF CLIMATOLOGY, VOL. 11,315-330 (1991) 551.525.2: 551.551.8: 551.584(485): 625.7
ANALYSES OF LOCAL CLIMATOLOGICAL FACTORS CONTROLLING RISK OF ROAD SLIPPERINESS DURING
WARM-AIR ADVECTIONS TOR WORN GUSTAVSSON
Department of Physical Geography. Uniwrsity of Gothenburg. Reutersgatan 2C. S-41320 Gothenburg. Sweden
Receiwd I May 1990 Revired 18 July 1990
ABSTRACT
Temperature recordings from the Swedish Road Weather Information System (WIS) were analysed with respect to variations in the risk of road slipperiness during synoptic situations resulting in a rapid warming. Climatological data from 24 VVIS stations in the county of SMermanland, Sweden, were used in this study.
During warm-air advections, variations in the warming of the air and the road surface can lead to the development of slipperiness through sublimation. Important factors contributing to a varying spatial pattern in the risk of slipperiness are found to be: type of weather preceding a warm-front movement, local topography, and thermal properties of the road-bed material. The weather situation preceding a warm-front and the local topography influence the variation in warming rate between the stations. A rapid warming and an early risk of road slipperiness were found at open valley locations. At stations surrounded by dense vegetation, the warming of the air and road surface were more prolonged and the risk of slipperiness occurred several hours later than at open sites. The road construction materials were found to influence the warming rate of the road surface!, which has an effect on the variation in the risk of slipperiness during situations preceded by cloudy, windy weather.
KEY WORDS Topoclimate Road slipperiness Road surface temperature Warm-air advections
1. INTRODUCTION
Knowledge of topoclimatological variations in complex terrain is useful in a wide range of applications. One such application is the prediction of local slipperiness on roads caused by variations in the air and road surface temperatures. In Sweden, as in several other countries, networks of field stations are used to survey road weather conditions for major roads in a specific area. A good survey of winter road conditions is desirable for many reasons, the most significant being naturally the potential for decreasing the number of car accidents. It is also important, however, to minimize the amount of rock salt spread on roads. Although salt makes roads clear and safe in winter, it also has disadvantages, such as damage to the environment and car corrosion. General reviews of the practical benefits of using a road weather information system, applied to the climatological conditions prevailing in the United Kingdom, have been presented by, for example, Thornes (1985, 1989) and Hunt (1987).
Relations between temperature variations, topography, and winter road slipperiness have been discussed by Lindqvist (1975,1976). The knowledge extracted from these studies has been used to develop the Swedish Road Weather Information System (WIS) (Lindqvist and Mattsson, 1979; Lindqvist, 1982). This is an ongoing project, of which this paper is a part, that deals with the development and optimization of the present VVIS system. The aim of the project is to develop a local climatological model, the output of which will be a temperature survey of entire road stretches, instead of the point-wise information that local authorities receive today. It is not possible to extrapolate information gathered by the field stations to make it valid for an entire road stretch without taking into account such factors as local topography. From analyses of mobile measurements of temperature along road stretches and recordings from the W I S stations, it is possible to
0899-8418/91/03031S-16$08.~ 8 1991 by the Royal Meteorological Society

316 T. GUSTAVSSON
ascertain the relationship between local topography and variations in air and road surface temperatures. The results of the analyses are integrated into a dynamic model. The basic principle of this model is described elsewhere (Bogren and Gustavsson, 1986, 1989; Gustavsson et al., 1987; Gustavsson and Bogren, 1988, 1990% Gustavsson, 1990).
A considerable number of studies have focused upon the possibility of developing models or simple equations for predicting road surface temperatures. For example, Thornes (1972) developed a formula for forecasting nocturnal cooling, where the input parameters are the amount of clouds and wind speed. Wood (1977) constructed a model for calculating road temperatures in relation to the energy balance of the surface. Jensen (1985) reported on the development of a slab model for predicting the surface temperature in relation to net radiation, turbulent heat transfer, and soil heat flux. Models have also been developed for forecasting night minimum temperatures at the road surface in relation to the air temperature (Parrey, 1969) and in relation to the dew-point and surface temperature for the previous day (Parrey et al., 1970,1971). Rayer (1987) described the structure and development of a numerical model, where the input parameters have the form of both climatological data and information about an actual station site to be dealt with in the forecast. Nearly all of these studies encompass situations in which the surface temperature falls during the evening or night, and especially emphasizes situations in which the surface temperature is expected to fall below 0°C. However, analyses of recordings from the Swedish WIS system have shown that situations in which there is a risk of slipperiness owing to sublimation are also associated with warm air advections (Gustavsson, 1985). Slippery conditions of this kind are very difficult to predict using the above-mentioned formulae, as these were developed to give an average forecast of the temperature development in an area and thus do not take into account the local variations in air and road surface temperatures.
The primary purpose of this paper is to describe the climatological factors causing slipperiness on roads during rapid weather changes, and to review the influence of local topographical parameters on temperature reactions during such situations. Another objective has been to determine factors that have to be included in the formulae for calculating the variation in the timing of the risk of road slipperiness.
2. METHODOLOGY
2.1. Data
The temperature recordings used for this study were made in the county of Siidermanland in southeastern Sweden, see Figure 1. In this area, 24 field stations are used in surveying winter road conditions, i.e. the risk for the OcCuTrence of road slipperiness. Each station is equipped with sensors for measurements of air temperature and humidity at 2m height, and with a probe at the surface for measuring road surface
Figure 1. Location of the study area in Sweden, and details of the county of siidermanland The triangles show the synoptic weather stations in the area: A , = Dunker, A = Norrkaping, A, = Vingaker

ROAD SLIPPERINESS DURING WARM-AIR ADVECIlON 317
temperature. Some of the stations have sensors for the measurements of wind speed and wind direction as well. Tests are also carried out using sensors that measure ground heat flux, precipitation, and residual salinity on the surface. In Table I a topoclimatological description of the different sites is presented. The table also includes information about the relative openness of the area around each station site. The degree of openness has been determined from the area of a circle with a diameter of approximately lOOOm, where the station is situated in the middle. For open sites, at least three-quarters of the area of the circle must be free from vegetation or topographical shelters. Partly closed sites are only partly sheltered, i.e. approximately one-half of the area of the circle is open. Closed sites are surrounded by dense vegetation or are located close to topographical obstacles. This description of the stations has been used instead of the more commonly used sky-view factor as it takes into account a larger part of the environment.
The field stations are connected to a central unit, where a computer collects the measured values every half- hour during the winter months. The climatological data are stored and presented on data screens or as print- outs at the superintendent's office. One of their uses is as a basis for deciding whether to salt the roads. Climatological data and warnings of slippery conditions are stored at the central unit. Hence, it is possible to analyse the interaction between weather, topographical parameters, and temperature variations at different station sites during the entire winter season. The recorded values used for this study date from the period November-April of 1984-1985 and 1985-1986. To receive a more complete description of the weather situation during the period studied, data from
synoptic weather stations (Dunker, VingAker, and Norrkoping) in the study area were used. Synoptic maps from the Swedish Meteorological and Hydrological Institute (SMHI) and from Berliner Wetterkarte (Amtsblatt des Instituts fur Meteorologie, Berlin) have also been used to describe weather development during these months.
Table I. Description of the WIS stations included in the study
Site Elevation Relative number (m a.s.1) exposure'
Site characteristics
_ _ ~ ~
1 50 P.C. In the periphery of an open field 2 10 P.C. Close to road rock cut 3 5 0 Small valley close to water 4 10 0 Large flat-floored valley 5 25 P.C. Close to road rock cut 6 25 P.C. Close to road rock cut 7 35 C Small hill surrounded by vegetation 8 30 C Sheltered by vegetation and topography 9 15 0 Large valley
10 30 C Close to road rock cut and vegetation 11 30 P.C. Sheltered by small hill and vegetation 12 30 P.C. Small valley surrounded by vegetation 13 50 P.C. Small valley surrounded by a forest 14 50 P.C. In the periphery of an open field, close to vegetation 15 70 C Hilly site, surrounded by vegetation 16 25 P.C. Close to water, but sheltered by vegetation from the west 17 70 C North side of a forested hill 18 35 C Surrounded by vegetation 19 20 P.C. Small valley surrounded by Vegetation 20 65 C Surrounded by dense vegetation 21 5 0 Surrounded by open fields 22 5 P.C. Open area sheltered by vegetation from the west 23 65 P.C. Sheltered by vegetation from the east and north 24 110 C Surrounded by vegetation
'0-open site, P.C.=partly c l d site, C=closed site.

318 T. GUSTAVSSON
2.2. Accuracy of dew-point temperature measurements
The relative humidity of the air is measured at each W I S station by use of a Lambrecht 809L-100 sensor. The accuracy of this instrument is f2.5 per cent in the interval of 5-100 per cent relative humidity. The dew-point temperature is calculated from these measurements together with the air temperature as:
Td,,=T,-0133(100-Rh) i f R h 2 8 5 per cent (la) if Rh<85 per cent
where Tdcw is the dew-point temperature, T, the air temperature, and Rh the relative humidity. Analyses of the relative humidity recordings show that the variation among the stations studied is small-
approximately f 3 per cent-which is close to the accuracy of the instrument. However, three stations show significantly lower values of the relative humidity, approximately 10 per cent during parts of the studied period. The difference in Rh gives a variation in Tdew of 1.3"C according to equation (la). This variation could affect the reaction time at these stations, especially during situations preceded by cloudy weather. These three stations have therefore been excluded from the analyses of the relationship between warming rate of the road surface temperature and timing of the risk of sublimation. The effect of the variation in Rh during situations with a more rapid warming of the air is only marginal, as the differences between the road surface and dew- point temperatures are much greater during this type of weather change, i.e. a difference of 2 4 C is normally developed.
3. CLIMATOLOGICAL BACKGROUND
3.1. Weather changes and associated road slipperiness
In weather conditions with a dew-point temperature of the ambient air higher than the surface temperature, a vapour pressure gradient is established and a flux of water vapour can be developed, directed towards the road surface. When the surface temperature is below O"C, vapour can sublimate directly on to the surface as rime.
Slipperiness caused by sublimation may arise during two major types of weather situation. One situation takes place during a temperature fall in the evening, provided that the surface temperature drops more rapidly than the air and dew-point temperatures. Such situations are rare, as the heat flow from the ground normally reduces the drop in surface temperature compared with the drop in air temperature during the night. However, sublimation could occur during situations with moderate wind and a high content of water vapour. This type of sublimation is seldom very intense or common. During the winter seasons of 1984-1985 and 1985-1986, there were no recordings of such situations in the area studied.
The other type of weather situation more commonly associated with slipperiness caused by heavy sublimation is characterized by advection of warm air with a high water content transported in over a cold road surface. The air temperature rises much more quickly than the temperature of the road surface (e.g. see Figures 5% 5b). These conditions lead to the development of a flux of water vapour toward the cold surface, and sublimation can occur. The wind speed is normally high during this type of weather change. This results in an intense mixing of the air close to the road surface and thus the difference between the dew-point temperature at the 2-m level and close to the road surface is small, i.e. the difference is normally less than 05°C.
3.2. Climate of the study area
The climate of this part of Sweden has been described in several studies, e.g. ModCn and Nyberg (1968), Angstriim (1968) and Taesler (1972). The macroclimate of the study area during the winter is characterized by two major factors. One is the frequent passing of low-pressure areas from south-west to northeast. The other factor is the advection of cold air from high pressure areas in the northern part of Scandinavia, which often develops as an extension of the Russian winter high pressure area. The influence of these two weather systems

ROAD SLIPPERINESS DURING WARM-AIR ADVECnON 319
includes very sudden weather changes, often accompanied by great temperature variations (see example below).
Air temperature recordings from a synoptic weather station (Dunker) during December 1985 are shown in Figure 2. The station is located in the middle of the study area (Figure l), and could therefore be used to give a representative description of the weather changes. There were large variations in temperature during this month. Several days were characterized by very low temperatures, i.e. with night minimum temperatures below - 20°C. The cold periods were interrupted abruptly, however, on five occasions when warm air came in from the south-west. The temperature variation amounts to as much as 33°C between the extreme maximum and minimum temperature. This example shows a large number of extreme temperature changes, which from analyses of temperature recordings have been found to occur normally only once or twice during the winter months. Observations of the wind direction at 1300 hours are also shown in Figure 2. These recordings reveal the close relationship between air temperature variation and wind direction. All warm periods are generated by warm air fronts from the south-west. Cold spells, on the other hand, are preceded by winds from the northern sector and are often followed by periods of calm conditions.
4. TEMPERATURE FLUCTUATIONS AND ROAD SLIPPERINESS A CASE-STUDY
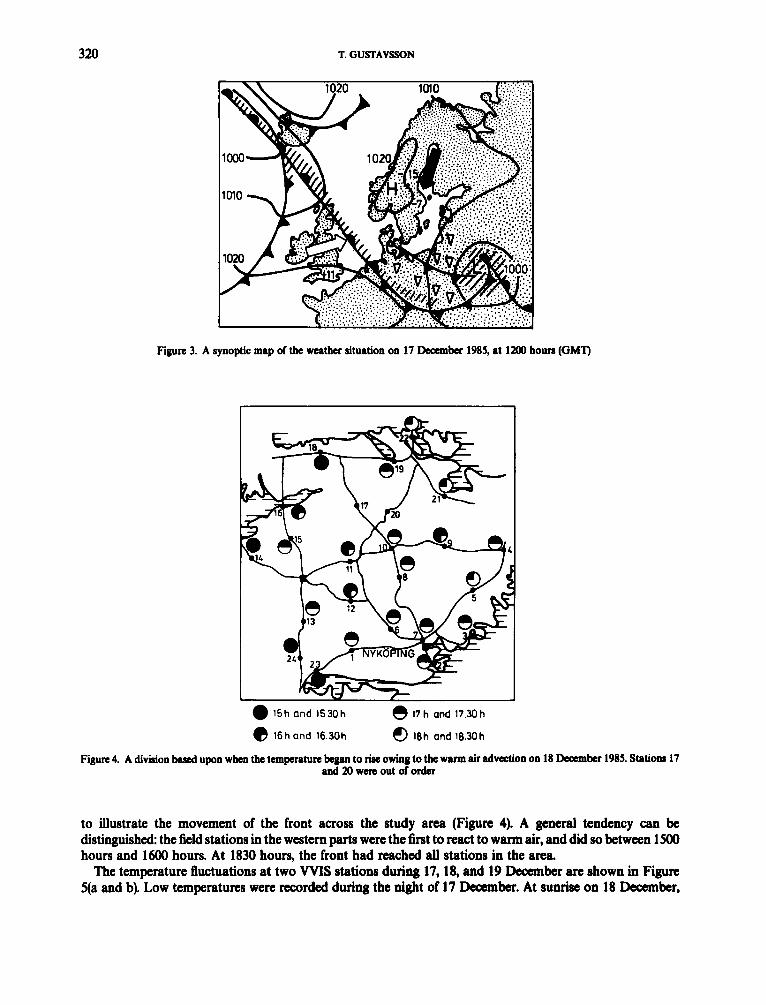
The synoptic situation used to illustrate the temperature development during a typical situation leading to slippery road conditions occurred on 18 December 1985. The synoptic situation preceding this development is presented in Figure 3. A high-pressure area was centred over Sweden and cold air flowed down from the north. A warm front was situated over the United Kingdom and the North Sea, and warm air was travelling toward the north-east. On 18 December, the active warm front moved north-eastward across Sweden and reached the study area in the afternoon. The frontal passage was marked by a rapid rise in temperature from -20°C to 0°C; simultaneously to the frontal movement, there was an in cloudiness from zero to eight octas. There was also an increase in wind speed from nearly calm conditions during the night between 17 December and 18 December to south-south-west 3ms-' at 1900 hours on 18 December.
The temperature rise, owing to warm-air advection from the south-west, started at different hours at the different station sites in the area. The stations are divided into four different time classes, which have been used
10 1
W a 2
o t
-10
-20
1 3 5 7 9 1 1 13 IS 17' 19 21 23 25 27 29 31
DATE ( December 1 Fw 2 Air temperature recorded at 0100,07OO,l300, and 1900 hours during December 1985, from a synoptic weather station in the
mi& of the study area. The d i d o n of the wind at 1300 h o w u repmental by arrows in the 6gure
320 T. GUSTAVSSON
Figure 3. A synoptic map of the weather situation OD 17 December 1985, at 12Ml h o w (GMT)
~
15h and 1530h
@ i6hand i630h
0 17 h and 17 30 h
18h and 18.30h
Figure 4. A division based upon when the temperature hcgan to riac owing to the warm air advcction on 18 December 1985. Stations 17 and 20 were out of order
to illustrate the movement of the front across the study area (Figure 4). A general tendency can be distinguished: the field stations in the western parts were the 6rst to react to warm air, and did so between ls00 hours and 1600 hours. At 1830 hours, the front had reached all stations in the area.
The temperature fluctuations at two W I S stations during 17,18, and 19 December are shown in Figure 5(a and b). Low temperatures were recorded during the night of 17 December. At sunrise on 18 December,

ROAD SLIPPERINESS DURING WARM-AIR ADVECllON 32 1
0
-2
-4
-6 - y -8
5 -10
t
- w
a -12 w 0 3 -14 I-
-1 6
-18
-20
-22
17 DECEMBER 18 DECEMBER TIME (LST)
19 DECEMBER
o r
-4
-6 - Y -8
c!j -10
- W
I- 4 K -12 w
$ -14 I-
-16
-18
-20
-22
n
- -
-- T2
--- DEWPOINT TEMP
-.- SURFACE TEMP
SUBLIMATION
18 20 22 24 2 4 6 8 10 12 14 16 18 20 22 24 2 4 6 I 10 12 17 DECEMBER 18 DECEMBER 19DECEMBER
TIME (LSTI Figure 5. Temperature recordings from 17 to 19 December 1985, from VVIS station 9 (a) and 24 0: tl , the time at which the temperature
started to risC owing to the warm front; t , , occurrcna of sublimation; TI, air temperature at tl; T,. air temperature 5 h later
the temperature began to rise at the two stations, but the normal afternoon decrease in temperature was interrupted at 1600 hours owing to the warm air that was reaching the county. The air temperature reaction differs between the stations. At station 24 (Figurcyb)), the rise in air temperature was relatively slow, approximately 05°C h-' during the first hours of the warming trend. At station 9 (Figure 5(a)), the rise in temperature during the same time period was much larger, approximately 25°C h-l. At 1900 hours, the air temperature was 2°C higher at this station, and this difference remained until 1400 hours on 19 December.

322 T. GUSTAVSSON
The actual time of the occurrence of slipperiness caused by sublimation at the 24 stations is depicted in Figure 6. As regards the rise in temperature, five different time classes have been used to divide the reactions of the stations into similar groups, i.e. each group covers a time interval of 1 h. Three hours after the start of the warming trend, there was a risk of sublimation at four stations. However, the slippery conditions did not occur first at the stations in the western area (namely numbers 14,18, and 23), where the warming first began. At these stations, there was more than 6 h difference between the beginning of the warming trend and the risk of slipperiness. However, this time period was much smaller, between 0 5 h and 1.0 h at several other stations, for example the eastern area stations, numbers 2,3,9, and 21. There is little resemblance between the patterns in Figures 4 and 6, indicating that the temperature reaction at each station site is more important for the start of sublimation on the road surface than the actual time when the warming trend begins at each station. The temperature curves in Figure 5(a and b) show that the different stations do not react similarly with respect to the warming of the air and road surface, and that the variation in temperature reaction influences the possibility for occurrence of sublimation.
5. ANALYSES OF WARMING RATE AND REACTION TIME
Temperature recordings from each VVIS station were studied in order to analyse the influence from local topography and other factors on road slipperiness associated with warm front passages. Using the same indices as in Figure 5(a and b), the important parameters are noted as follows. The actual time at which the air temperature starts to rise is denoted (tl), and the critical time ( t2) is reached when the dew-point temperature has risen above the road surface temperature and there is a risk of sublimation on the roads. The time period between (tl) and ( t 2 ) is a measure of the reaction time (At). The warming rate ( W) is calculated with respect to the temperature development during the first 5 h of the warming trend,
w= (T2 - T1)/5
I
18 h and 18.30 h
@ 19 h and 19.30 h
0 20 h and 20.30 h
8 21 h and 21.30 h
0 after 22 h
Fipre 6. Spatial pattern of the time at which rbk of subbation started on 18 December 1985

ROAD SLIPPERINESS DURING WARM-AIR ADVECllON 323
2-
where TI is the air temperature at t l , and T, the temperature 5 h later. The warming rate varies during the warming trend, but it is the variation in ( W) between different stations during the first hours of the warming trend that is most important in causing a varying slipperiness pattern. That is why the temperature change per hour has been determined separately for the first 5 h of the warming for each station.
Reaction time and warming rate have been examined during 10 different situations, all resulting in a great change in air temperature among the stations in the county. Scatter plots of these two parameters for four different situations are shown in Figure 7(a-d). The general trend revealed in three of these examples is that the reaction time decreases with an increasing rate in warming. This can basically be explained by the difference in the warming rate between the air and the road surface. At stations that have a long reaction time, the warming rates of the air and road surface temperatures are almost equal. Consequently, at stations with a short reaction time, the warming rate is much greater for the air temperature than it is for the more inert surface, and thus the curves diverge shortly after (ti).
To further study the relationship between (W) and (At) during the 10 different situations, a formula describing the variations has been adjusted to the data. The point configuration in Figure 7(a-d) suggests a non-linear form of dependence between (At) and ( W), and thus the following function has been selected to describe the interrelation
At=aWb (3)
. 0 . 0 .
0 .
o
t 0 0
0
0 : s 0 0 0 0 00 0 I
- . 0 I 2 3
WARMING RATE I°C/hour)
0 0 Y 6 0 . w a & 2 0.0
0 1 1
0.0 $
0 1 2 3 WARMING RATE ('C/hour)
'1 v 1
0 I i i WARMING RATE ('C/hour
Figure 7a. Graph of the warming rate vs. reaction time during 27 January 1985 (a), 31 January 1985 (b), 18 December 1985 (c), and 2 January 1986 (d)

324 T. OUSTAVSSON
The constants and correlation coefficient of equation (3) are calculated by transforming equation (3) into a linear equation,
(4) For six of the situations analysed, there is a strong correlation between the two variables (Table 11). The correlation coefficients indicate that warming rate alone can explain up to 97 per cent of the spatial variation in reaction time. In four situations, however, a low or insignificant relationship exists between the two variables, i.e. R is less than 01 5. The variation in warming rate was small during these situations, i.e. ( W) was less than loch-'.
LOG(At) = LOG@) + bLOG( W)
6. IDENTIFICATION OF FACTORS CONTROLLING THE RISK OF SUBLIMATION
6.1. Weather conditions preceding warm fronts
The weather sequence at Dunker (Figure 1) was used to study the influence of the weather situation that precedes the warming trend on the spatial variation in the risk of slipperiness. The temperature change per hour during the first 12 h of the warming trend at this station, together with the correlation coefficients between ( W) and (At) according to equation (4), are given in Table 11. The preceding weather situation, also shown in the table, has been divided into two groups: clear sky conditions (0-3 octas) and cloudy conditions (4-8 octas).
Two distinct groups are apparent, one with a high correlation between the warming rate and reaction time and another with a low correlation. The climatological background for this division is dependent on the weather situation before the warming trend. If the warm front passage is preceded by clear, calm conditions, the change in temperature Occurs more rapidly than if the preceding weather is cloudy. Clear, calm weather conditions favour the development of temperature differences owing to local topography, which influences the possibility for the Occurrence of a variation in warming rate (section 6.2). During cloudy, windy situations, temperature variations are smoothed out and the variation in warming rate between different station sites becomes small in the interval 05-0.7"Ch-' and the correlation to equation (4) is weak. This is due to the greater turbulencebeat diffusion and the increased counter-radiation from the cloud cover.
6.2. Local topography
The average values for the warming rate and reaction time have been calculated for each station during the six situations in Table I1 characterized by a high correlation. These values are plotted in Figure 8, with an
Table 11. Correlation coefficients between (W) and (At). Also shown is the temperature change per hour for the 10 situations
and cloud conditions praceding the warm front
Situation Correlation Temperature Cloud coefficient change conditions
(R) ("C h-')
1 2 3 4 5 6 7 8 9
10
-086 0.14
-085 010
-091 - 097 - 094 -093
015 0.12
1 *9 0 5 1.8 0 7 1.3 1.7 1.4 1.2 1.0 0 7
Clear Cloudy Clear Cloudy Clear Clear Clear Clear Cloudy Cloudy

ROAD SLIPPERINESS DURING WARM-AIR ADVECTION 325
I"
9-
6- L
2 7-
F 5-
L - 6- w I:
index related to the openness of the station site (Table I). Closed, partly closed and open sites refer to the extent of shelter and exposure offered by the topography and/or vegetation around the stations. From this division, it is possible to compare the influence of the local environment on the warming rate. There is a close resemblance between the average values of ( W) and (At) in Figure 8 and the general trend in Figure 7(a-c). This shows that the average value of these factors differs significantly between different station sites, and that an equation, such as equation (3), also could be used to describe the mean variation between the stations discussed. Figure 8 reveals that the degree of exposure has a great influence on how rapidly a temperature change can take place. Only at station sites that are open or partly closed is there a possibility of finding a warming rate exceeding 2"Ch-'. Wind shelter from vegetation and topography results in the temperature change occurring over a longer time period, as compared with the period required for open stations. The wind shelter around the stations reduces the wind speed; hence, the mixing of warm and cold air is also reduced. The average value of ( W) for closed sites is in the interval of 0.5-1.0"C h- '.
During frontal movements preceded by clear, calm weather, temperature differences could be developed owing to local topography. In Table 111, the prevailing air temperatures are noted for the evening of 20 December 1985, just before the warm front reached the study area. The warming rate at each station is calculated from equation (1) and is also presented in the table. The correlation between the temperature differences ( Tdlff) and the warming rates is strong (R = O83), i.e. low air temperatures result in a large value for the warming rate. The topoclimatological description of the WIS stations (Table I) shows that air temperatures below - 14°C and warming rates in excess of 2°C h- ' (Table 111) are primarily associated with valley locations. The accumulation and stabilization of the cold air that collects around these stations affect the temperatures in several different ways. The temperature contrast between the cold and warm air is often 54°C larger at these stations and the stabilization of the air in valleys also affects the resistance to warming. The temperature change occurs rapidly and suddenly, when a wind mixes the stratified air in the valley. The fact that the wind is an important factor can be seen from the close relationship between the start of a rise in temperature and when a wind starts to blow.
6.3. Thermal properties of the road-bed
Figure 9 shows the road surface temperature for stations 3,5, and 7 for a period of 3 days, 20-22 December 1985. The stations are sited close together in the south-western part of the study area. These stations represent
5 6 -
6 3- - a w m 2-
1-
0
c 0 0
0 0 0 0 00
%e 0°9 0
0
0 OPEN 0 PARTLY CLOSED 0 CLOSED
O O O O
04 1 1
0 1 2 3 WARMING RATE (OWhour)
Figure 8. Average warming rate and reaction time during clcar Situations plotted with an index related to the openness around each station site

326 T. GUSTAVSSON
Table 111. Minimum temperatures (T,,,,,,) before the warming of 20 Daxmber 1985 and the actual warming
rate
Site T,, Tdrr; Warming rate number (“C) (“C) (“Ch-’)
1 2 3 4 5 6 7 8 9
10 11 12 13 14 15 16 17 18 19 20 21 22 23 24
- 13.7 - 10.7 - 14.0 - 15.9 - 12.7 - 11.9 - 10.6 - 11.6 - 16.0 - 12.0 - 13.6 - 15.3 - 13.4 - 10.8 - 10.4 - 11.0
- 12.1 - 15.3 - 14.6 - 15.0 - 12.0 - 10.7
-
-
- 3.3 -0.3 - 3.6 - 5.5 - 2.3 - 1.5 - 0.2 - 1.2 - 5.6 - 1.6 - 3.2 - 4.9 - 3.0 - 0.4
0 - 0.6
- 1.7 - 4.9 - 4.2 - 4.6 - 1.6 - 0.3
-
-
1.1 0.8 2.7 2.9 0.9 1.2 1.3 1.2 2.3 1-2 1.3 2.2 1 *5 0.8 0.9 1.1
1.1 1.9
2.3 1 *9 1.5 1.2
-
-
‘TdUf is the air temperature difference between the warmest station (number 15) and the other WIS stations.
6 7
0 L 8 12 16 20 0 .4 8 12 16 20 0 L 8 12 16 20 20 DECEMBER 21 DECEMBER 22 DECEMBER
TIME (LST) Figure 9. Road surface temperature development during the warming of 2&22 Decembsr 1985 for three WIS stations with different
road-bed materials (station 3, crushed rock; station 5, thin layer of crushed rock on top of solid rock; station 7, gravel)
ROAD SLIPPERINESS DURING WARM-AIR ADVECllON 327
three different types of road-bed construction: crushed rock at station 3, a thin layer of crushed rock on top of solid rock at station 5 and gravel at station 7. The stations all have an approximately 15-cm thick asphalt layer on the top. In the first part of the diagram, until 1600 hours on 20 December, the variation in surface temperature was small, i.e. a maximum difference of 1.5-2"CY but after the warm-air advection had begun, the temperature development differs significantly. The road-bed consisting of gravel (station 7) reached the highest temperature, approximately 5°C warmer than the road-bed constructed of crushed rock (station 3). The surface temperature at station 5 was approximately 25°C lower than at station 7. The variation in surface temperatures can be related to the thermal properties of the material used in the road-bed as the variation in air temperatures was small, less than 1"C, during the last part of the warming (from 2000 hours at 21 December). The thermal conductivity and thermal capacity of the construction material is of importance for the road surface temperature. This has been documented in several studies (e.g., Gustafson, 1981; Gustavsson and Bogren, 1988). For the three materials discussed above there is a difference in the thermal conductivity (K), which during the warming of the road surface could be of particular importance. For gravel K is equal to 1.8 and 2.0 W mK- ' for frozen and unfrozen ground, respectively, and for crushed rock K is equal to 1.0 and 1.2 W mK- l , respectively. Since the warming of the surface occurs over such a long period, in this case more than 8 h, the difference in thermal conductivity is large enough to have a great influence on the warming.
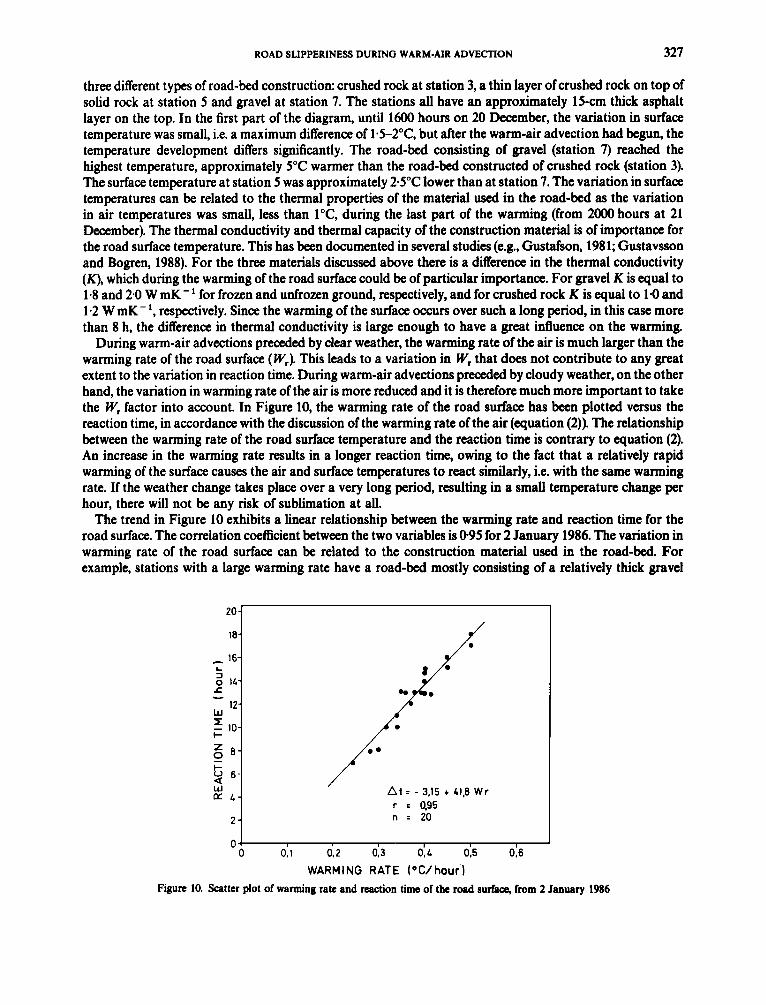
During warm-air advections preceded by clear weather, the warming rate of the air is much larger than the warming rate of the road surface ( W,). This leads to a variation in W, that does not contribute to any great extent to the variation in reaction time. During warm-air advections preceded by cloudy weather, on the other hand, the variation in warming rate of the air is more reduced and it is therefore much more important to take the W, factor into account. In Figure 10, the warming rate of the road surface has been plotted versus the reaction time, in accordance with the discussion of the warming rate of the air (equation (2)). The relationship between the warming rate of the road surface temperature and the reaction time is contrary to equation (2). An increase in the warming rate results in a longer reaction time, owing to the fact that a relatively rapid warming of the surface causes the air and surface temperatures to react similarly, i.e. with the same warming rate. If the weather change takes place over a very long period, resulting in a small temperature change per hour, there will not be any risk of sublimation at all.
The trend in Figure 10 exhibits a linear relationship between the warming rate and reaction time for the road surface. The correlation coefficient between the two variables is 095 for 2 January 1986. The variation in warming rate of the road surface can be related to the construction material used in the road-bed. For example, stations with a large warming rate have a road-bed mostly consisting of a relatively thick gravel
2ol 18
At = - 3.15 + &1,8 W r t = 0,995 n = 20
8 - F 2 6- w
0
a L -
2 -
0
At = - 3.15 + &1,8 W r /
t = 0,995 n = 20
I 1 1 1
0,5 0,6 0 001 0,2 03 0, L
WARMING RATE (OC/hour') Figure 10. Scatter plot of warming rate and reaction time of the road surface, from 2 January 1986

328 T. GUSTAVSSON
layer, whereas stations with a smaller warming rate have a road-bed consisting of coarser materials, such as crushed rock or till.
6.4. Geographical distance
The geographical distance between the sites used in this study is found to be only a minor factor influencing the actual timing of the risk of sublimation. The county of Slidermanland is not very large, less than 90 km from the eastern to the western side. Thus the variation in the time at which the temperature starts to rise is generally small, normally less than 3 h. The geographical distance could be of importance, however, when the change in temperature occurs in the afternoon or early evening. As shown in Figure 5(a and b), the fact that the drop in temperature had begun at station 9 but not at station 24, when the warming started, had a great intluence on the relative temperature contrast between the warm and cold air at the two stations. This difference occurred owing to the fact that the warm-air front reached station 4 approximately 2 h later than at station 24.
Gustavsson and Bogren (1990b) have proved that the geographical distance between W I S stations is of major importance during warm-air advections preceded by cloudy weather. However, the distances between the studied sites were much larger (approximately 170 km) than in the county of SBdermanland.
7. DISCUSSION
Information about the spatial pattern of road surface temperature and slipperiness in a certain region is important for surveys of winter road conditions. This study is concerned with the interrelationship between local topography, vegetation, temperature variations, and local risk of slipperiness during warm-air advections. Two different types of weather situations can be distinguished: when the warm-air advection is preceded by clear weather, and when the previous weather is cloudy.
A forecast model for the spatial pattern of the risk of sublimation on the road surface could be developed for the two above-mentioned types of weather situations. If the warm-air advection is preceded by anticyclonic conditions, the pattern is to a large extent controlled by the local topography and the degree of exposure around the station sites. In open areas, especially in valleys and other low points, the change in temperature will take place over a short period of time. For example, a warming rate between 5°C and 6°C per hour during the first hours of the warming trend is not unusual. In areas with dense vegetation around the station site, a much longer period (1&12 h) for the warming is required. This is due to the fact that the wind shelter around the stations reduces the wind and hence the mixing of the warm and cold air.
The regression constants for equation (3) have been calculated for the six weather situations analysed, giving
& = 4.1 w- 1.2 (5 )
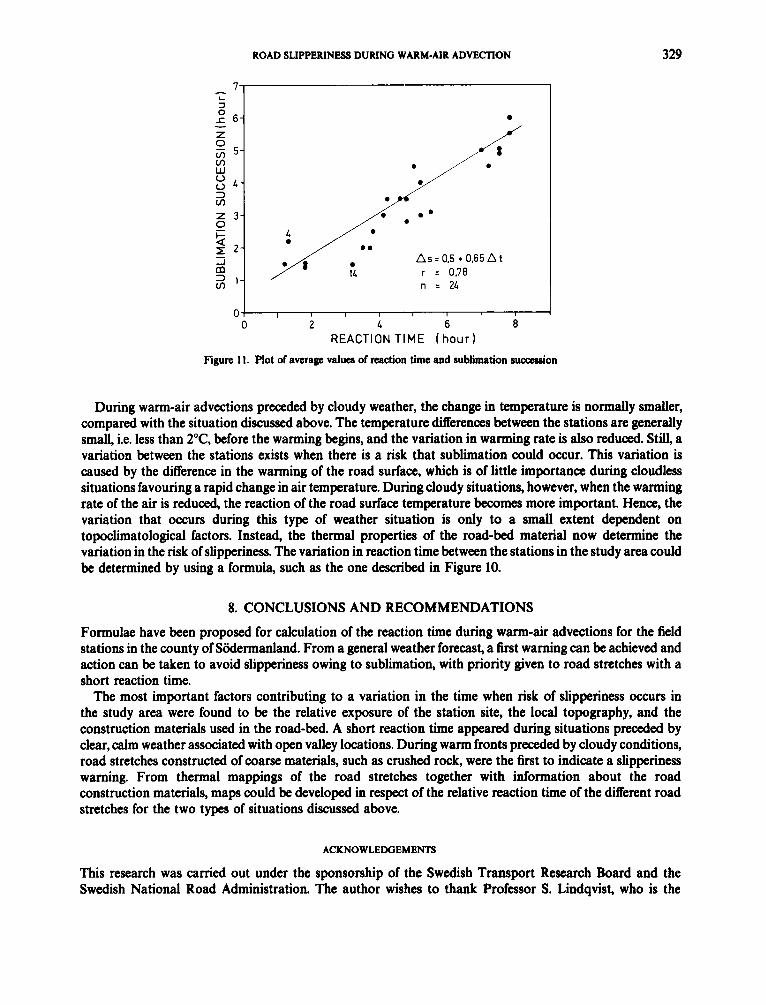
To verify this formula, the sublimation succession between the 24 stations has been determined. The sublimation succession (As) is a measure of the time period between the actual time at which there will be a risk of sublimation at each station during each warming trend, from the first and to last station affected. For example, the sublimation succession was 6 h during the 18 December 1985 situation (Figure 6).
As the correlation coefficient between the warming rate and the reaction time is high during these weather situations, the reaction time and sublimation succession must be closely related. The average reaction time has been plotted versus the average sublimation succession of each station for the discussed situations (Figure 11). The correlation coefficient is 078 between the parameters, but the ratio between them is not 1:l. The scattering of the values and the fact that the slope is not equal to 1.0 is probably an effect of the geographical distance between the stations. The warm air is transported in over the study area from the west for all the studied situations. This results in the reaction time for stations in the western area being somewhat longer than the corresponding value of (As), calculated by using the formula in Figure 11. The opposite circumstances are valid for the stations in the eastern part of the area. The values for station 4 and 14 are noted in Figure 11 to illustrate this relationship.
ROAD SLIPPERINESS DURING WARM-AIR ADVECTION 329
- - AS = 0,5 + 0,65 A t
r = 0,78 cn n = 2L
I I I I I I I
0 2 L 6 8 REACTION TIME (hour)
Figure 11. Plot of average values of reaction time and sublimation s u d o n
During warm-air advections preceded by cloudy weather, the change in temperature is normally smaller, compared with the situation discussed above. The temperature differences between the stations are generally small, i.e. less than 2"C, before the warming begins, and the variation in warming rate is also reduced. Still, a variation between the stations exists when there is a risk that sublimation could occur. This variation is caused by the difference in the warming of the road surface, which is of little importance during cloudless situations favouring a rapid change in air temperature. During cloudy situations, however, when the warming rate of the air is reduced, the reaction of the road surface temperature becomes more important. Hence, the variation that occurs during this type of weather situation is only to a small extent dependent on topoclimatological factors. Instead, the thermal properties of the road-bed material now determine the variation in the risk of slipperiness. The variation in reaction time between the stations in the study area could be determined by using a formula, such as the one described in Figure 10.
8. CONCLUSIONS AND RECOMMENDATIONS
Formulae have been proposed for calculation of the reaction time during warm-air advections for the field stations in the county of Slidermanland. From a general weather forecast, a first warning can be achieved and action can be taken to avoid slipperiness owing to sublimation, with priority given to road stretches with a short reaction time.
The most important factors contributing to a variation in the time when risk of slipperiness occurs in the study area were found to be the relative exposure of the station site, the local topography, and the construction materials used in the road-bed. A short reaction time appeared during situations preceded by clear, calm weather associated with open valley locations. During warm fronts preceded by cloudy conditions, road stretches constructed of coarse materials, such as crushed rock, were the first to indicate a slipperiness warning. From thermal mappings of the road stretches together with information about the road construction materials, maps could be developed in respect of the relative reaction time of the different road stretches for the two types of situations discussed above.
ACKNOWLEDGEMENTS
This research was carried out under the sponsorship of the Swedish Transport Research Board and the Swedish National Road Administration. The author wishes to thank Professor S. Lindqvist, who is the

330 T. GUSTAVSSON
adviser for the project, and also J. Bogren, B. Holmer, G. Loman, and J. 0. Mattsson for comments on the draft of this paper. The comments of the two referees have been very useful for the completion of the manuscript. J. Vesterlund and B. Kroeber, who have performed the English revision, and S. Svensson, who has drawn the figures, are also gratefully acknowledged.
REFERENCES
Bogren, J. and Gustavsson, T. 1986. A Method for the Development of a Local Climatological Model for Prediction of Slipperiness on Roads,
Bogren, J. and Gustavsson, T. 1989. ‘Modelling of local climate for prediction of road slipperiness’, Phys. Geogr.. 10, 147-164. Gustafeon, K. 1981. H a l h pci o l i h vdguppbyggnader, VTI Rapport 216, National Road and Trafiic Rescarch Institute, Linkciping,
Gustavsson, T. 1985. T i l h p d vdgklimatologi-fsrstudie, M.Sc. Thesis, University of Gothenburg, 64 pp. Gustavsson, T. 1990. ‘Variation in road surface temperature due to topography and wind‘, %or. Appl. Climatol., 41,227-236. Gustavsson, T. and Bogren, J. 1988. ‘Thermal mapping by UBC of infrared technique’. Proceedings of the Fourth International Conference
Gustavsson, T. and Bogren, J. 199Oa ‘Infrared thermography in applied road climatological studits’, Int. J . Remote Sensing. Gustavsson, T. and Bogren. J. 199Ob. ‘Road slipperiness during warm-air advections’. Meteorol. Mag. Gustavsson, T., Bogren, J. and Lindqvist, S. 1987. Seminar on Road Weather Cllmatolog@ctober 1987, GUNI Rapport 25, Department
of Physical Geography, University of Gothenburg, 35 pp. Hunt, R. D. 1987. ‘Dealing with Winter chaos’, Meteorol. Mag, 116,254257. Jensen. N. 0. 1985. ‘Micrometeorological techniques applied to the prediction of road icing’. Proceeding of the Second Intematwnal
Road-Weather Conference, Copenhagen, 27 February to 1 March 1985. Lindqvist, S. 1975. Vdghalkanr beroende av mi&ro-och lo&al&limatls&a faborer, GUNI Rapport 8. Department of Physical Geography,
University of Gothenburg, 41 pp. (with English summary). Lindqvist, S. 1976. Metoderfsr b e s t h i n g av halkfrekucnta viigstrdickor, GUNI Rapport 10, Department of Physical Geography,
University of Gothenburg, 32 pp. (with English summary). Lindqvist, S. 1982 Neue Methoden der Glatteisiiberwachung in Schweden, GUNI Rapport 16, Department of Physical Geography,
University of Gothenburg, 55 pp. (with English summary). Lindqvist, S. and Mattsson, J. 0. 1979. Climatfc Background Factors for Testing an Ice-surveillance System, GUNI Rapport 13,
Department of Physical Geography, University of Gothenburg, 35 pp. Modh, H. and Nyberg, A. 1968. Stockholmsomrddets klimat del2. Temperutur, molnighet, vind, m.m, SMHI-mcddelande, sene B, 29,
Stockholm, 39 pp. Pamy, G. E. 1969. ‘Minimum road temperatures’, Meteorol. Mag., 98,286290. Parrey, G. E., Ritchie, W. G. and Virgo, S. E. 1970. ‘Comparison of methods of forecasting night minimum temperatures on concrete road
Pamy, G. E., Ritchie, W. G. and Virgo, S. E. 1971. ‘Minimum temperatures at the surfacea ofconcrete road and concrete slabs’, Meteorol.
Rayer, P. J. 1987. ‘The Meteorological 06ice forecast road surface temperature model’, Meteorol. Mag., 116, 18&191. Tatsler, R. 1972. Klirnatdatafsr Swrige, SMHI, Stockholm, 672 pp. Thorn- J. E. 1972. ‘An objective aid for eatimating the night minimum temperature of a concrete road surface’, Meteorol. Mag., 101,
Thornes, J. E. 1985. ‘The prediction of ice formation on roads‘, J . Inst. Highw. Ransp.. 3&3-12. Thorn- J. E. 1989. ‘A preliminary performance and benefit analysis of the UK national road ice prediction system’, Mereorol. Mag., 118,
Wood, N. L. H. 1977. An Evalutwn of the Srvface Energy Balance Model for Giving Equilibrium Swjbce Temperature, Working paper 3.
hgst6m, A. 1968. Sveriges klimat, Generalstabens litograliska anstalts fcirlag, Stockholm, 157 pp.
GUNI Rapport 20, Department of Physical Geography, University of Gothenburg, 54 pp.
140 pp. (with English summary).
on Weather and R o d Safety. Florence, 8-10 November 1988. (Copy available from authors).
surfaces’, Meteorol. Mag., 99, 349-355.
Mag., lOO,28-32.
13-25.
93-99.
Department of Geography. University of London. 17 pp.