analysing spatio-temporal patterns of coastal aquaculture based … · 2018-12-03 · biodiversity...
TRANSCRIPT

Master Thesis
Analysing Spatio-temporal Patterns
of Coastal Aquaculture Based on
Three Decades of Satellite Data
Dorothee Stiller
Matriculation Number 1251887
Global Change Ecology (MSc)
University of Bayreuth
First SupervisorDr Martin WegmannUniversity of Wuumlrzburg
Second SupervisorDr Claudia Kuumlnzer
German Aerospace Center
In cooperation with Dr Patrick Leinenkugel German Aerospace Center
February 2018
2
Legal Statement
Hiermit versichere ich Dorothee Stiller dass ich die vorliegende Arbeit selbststaumlndigund unter Angabe aller Hilfsmittel und Referenzen angefertigt habe Des Weiterenversichere ich dass diese Arbeit in dieser oder aumlhnlicher Form noch keiner anderenPruumlfungsbehoumlrde vorgelegt wurde
I Dorothee Stiller hereby declare that to the best of my knowledge this workdoes not bear resemblance to any other work in the whole or in part and has beencompleted myself I did not use any other sources and means than specied Fur-thermore this work has not been previously submitted to any university All sourceshave been referred to and give adequate credit to others for their work and I in noway claim to have created this information myself
Location and Date Signature
4
i
Table of Contents
List of Figures iii
List of Tables v
List of Acronyms vii
1 Motivation and Background 1
11 Anthropogenic LULC Change 112 Earth Observation as a Powerful Tool to Reveal LULC Change 113 Aquaculture as an Intensive LULC Change 2
2 Analysing Spatio-temporal Patterns of Coastal Aquaculture Based
on Three Decades of Satellite Data 5
21 Introduction 622 Study Area 823 Materials and Methods 10
231 Data 102311 Landsat Surface Reectance Data 102312 Sentinel-1 Aquaculture Layer 112313 The Global Surface Water Data 12
232 Assessment of Aquaculture Dynamics 13233 Temporal Patterns and Hotspots 15234 Accuracy Assessment 15
24 Results 16241 Reference Aquaculture Layer 16242 Mapping of the Aquaculture Dynamics 17243 Quantication of Aquaculture Area 20244 Temporal Patterns and Hotspots 22245 Accuracy Assessment 25
25 Discussion 26251 Increase in Aquaculture Area 26252 Dynamics and Hotspots of Aquaculture 28253 Potentials and Limitations of This Study 29254 Outlook 31
References 33
Appendix 41
ii
iii
List of Figures
11 Asian top producing countries of aquaculture 3
12 Aquaculture production in China and Vietnam 3
21 Map of the study area 9
22 Used Landsat SR data for creating annual water masks 11
23 Workow diagram 14
24 Combination of the Sentinel-1 Aquaculture Layer with Landsat SRdata 14
25 Aquaculture dynamics for the Yellow River Delta 18
26 Aquaculture dynamics for the Pearl River Delta 18
27 Aquaculture dynamics for the Red River Delta 19
28 Aquaculture dynamics for the Mekong River Delta based on GSW data 19
29 Cumulative aquaculture area 21
210 Trend in aquaculture area 22
211 Temporal patterns and Hotspots for the Yellow River Delta 23
212 Temporal patterns and Hotspots for the Yellow River Delta 24
213 Temporal patterns and Hotspots for the Red River Delta 24
A14 Large map on the temporal patterns for the Yellow River Delta 42
A15 Large map on the temporal patterns for the Pearl River Delta 43
A16 Large map on the temporal patterns for the Red River Delta 44
A17 Large map on the temporal patterns for the Mekong River Delta 45
A18 Water areas retrieved from the Global Surface Water data 46
A19 Natural waters turned into aquaculture in the Pearl River Delta 46
A20 Natural waters turned into aquaculture in the Red River Delta 46
iv
v
List of Tables
21 Characteristics of the investigated deltas 9
22 Characteristics of the aquaculture ponds 12
23 Comparison of Sentinel-1 Aquaculture Layer with Reference Aqua-culture Layer 16
24 Increase in aquaculture area 21
25 Confusion matrix of the accuracy assessment 25
26 Accuracies and Kappa obtained by the accuracy assessment 25
27 Assessment of natural water bodies within the target deltas 26
vi
vii
List of Acronyms
CFmask C Function of maskEO Earth observationETM+ Enhanced Thematic Mapper PlusFAO Food and Agriculture Organization of the
United NationsFmask Function of maskGEE Google Earth EngineGIS Geographic Information SystemGSW Global Surface WaterIFOV Instantaneous Field Of ViewJRC Joint Research CentreLaSRC Landsat Surface Reectance CodeLEDAPS Landsat Ecosystem Disturbance Adaptive
Processing SystemLULC Land use and land coverMRD Mekong River DeltaNDWI Normalised Dierence Water IndexNIR Near-infraredOLI Operational Land ImagerPRD Pearl River DeltaRRD Red River DeltaRS Remote sensingSAR Synthetic Aperture RadarSR Surface ReectanceTM Thematic MapperToA Top of AtmosphereUSGS US Geological SurveyYRD Yellow River Delta
viii
1
1 | Motivation and Background
11 Anthropogenic LULC Change
Ever since humans stopped to migrate and settled down to farm within seven oreight regions throughout the world (Bellwood 2007) they began to reorganise nat-ural conditions and to create their individual structures which constantly remainedfor longer periods The Neolithic Revolution has begun and has enabled an increas-ingly larger population (Bocquet-Appel 2011) With a growing world populationalterations took place at an accelerated rate and many parts of the earths sur-face have been exposed to heavy Land use and land cover (LULC) change untilthe present day deforestation agriculture mining urbanisation All of these al-terations determine a variety of factors such as the radiation balance (Cui et al2012) carbon cycle (Arneth et al 2017) water balance ecosystem functioningbiodiversity (Falcucci et al 2007) and links among these A major part of LULCchanges took place in the tropics (Gibbs et al 2010) which are meaningful for na-ture conservation as these often coincide with biodiversity hotspots (Myers et al2000) LULC changes and the often accompanied decrease of natural habitats aswell as global climate change are assumed to be the most threatening factors for bio-diversity at present and in the future (Sala et al 2000 Jetz et al 2017) Speciescurrently at risk by changing climate are exposed to additional pressure caused byLULC change For this century even more dramatic consequences evoked by envi-ronmental change are expected (Sala et al 2000) Understanding and monitoringthese complex interactions is the rst step to counteract ecosystem harming and todene management strategies (Alexandridis et al 2008)
12 Earth Observation as a Powerful Tool to Reveal
LULC Change
Satellite remote sensing (RS) and geographic information system (GIS) techniquesare powerful tools to map and monitor the extent and patterns of LULC changeson large spatial scales They are cost- and time-ecient and with increasing accessto satellite imagery due to growing free data policy (Woodcock et al 2008 Wulderet al 2012) they are also greatly appreciated by ecologists and nature conservation-ists This can also be seen in the rising number of publications related to RS topicsand their applications within this eld (Seto and Fragkias 2007 Turner et al 2015Pettorelli et al 2017 Young et al 2017) If suitable satellite imagery is availablefor the desired time period investigations can be undertaken retrospectively This isespecially helpful in evaluating long-term changes for which constant and long-term
2 Chapter 1 Motivation and Background
observational data are essential Assessing and monitoring malfunctions of ecosys-tems caused by human pressure is crucial to achieve attention and emphasise theneed for policy to act (Alexandridis et al 2008)
13 Aquaculture as an Intensive LULC Change
One major LULC change of the last decades in coastal areas can be attributedto the expansion of aquaculture Aquaculture denes any sort of aquatic organismsfarmed and harvested in aquafarms which are almost exclusively destined for humanfood consumption (FAO 2016) In general two types of aquaculture can be dier-entiated which is inland aquaculture (freshwater brackishwater or saline water)and marine aquaculture (Cosslett and Cosslett 2014) The majority of aquacultureis farmed in inland aquaculture basins accounting for 63 of global production(FAO 2016) Aquaculture farming requires the use of inputs of natural resourcessuch as land water and aquatic species as well as non-natural resources such asfeeds antibiotics and articial fertilisers (FAO 2016) Aquaculture farming can beoperated on dierent levels of professionalism which comprise highly industrialisedaquafarms but also small-scale household subsistence farming In some regions itis a common practice to carry on a mixed form of aquaculture and rice cultivation(Ottinger et al 2016) Various forms of sh molluscs crustaceans and plants canbe grown which can be produced according to local conditions as they toleratedierent amounts of salinity (Cosslett and Cosslett 2014)
Asia is the hotspot region of global aquaculture production accounting for 889in 2014 followed by North and South America with 45 Europe with 40 Africawith 23 and Oceania with 03 (FAO 2016) Thirteen Asian nations are amongthe top 25 producers of farmed aquatic species (Figure 11) The increase in aqua-culture production for China and Vietnam has been enormous between 19952014(Figure 12) Country-wise China is by far the top producer which contributed616 to the aquaculture production worldwide in 2014 The Vietnamese aqua-culture production accounted for 577 of the global production and is ranked onfourth place of top producing countries (FAO 2016)
The enormous quantities of aquaculture goods produced in Asian aquafarmsrequire high amounts of land Therefore aquaculture is one of the major driversof LULC change within coastal regions at the expense of oodplains and wetlands(Alonso-Peacuterez et al 2003 Ke et al 2011 Pattanaik and Narendra Prasad 2011)also including the deforestation of mangrove forests (Valiela et al 2001) Coastalareas are hotspots of species richness and biodiversity (Diana 2009) and thereforefocus regions for conservational eorts Despite the heavy pressure on valuablenatural land cover the Vietnamese convention on preserving wetlands did not showsuccess on reducing the expansion of aquaculture but wetland retreat increased (Setoand Fragkias 2007) Similar ndings of decreasing natural coastal land cover andsimultaneously expansion of aquaculture area have been stated in numerous casestudies (Beacuteland et al 2006 Berlanga-Robles et al 2011 Pattanaik and NarendraPrasad 2011 Richards and Friess 2016)
The Food and Agriculture Organization (FAO) provides information and statis-tics on sheries and aquaculture in regular intervals to increase transparency andto optimise the system of aquaculture to preserve food security and to contributeto human well-being (FAO 2016) However data acquisition is arduous as the sub-
Chapter 1 Motivation and Background 3
mitted national statistics are not based on standardised methods The reliability ofthe provided data is questionable and improved monitoring is demanded (Pauly andZeller 2016) Therefore RS serves to provide additional and objective informationof aquaculture development and its provoked LULC changes
Figure 11 Asian countries which are among the top 25 producers of aquaculture worldwideData retrieved from FAO (2016)
Figure 12 Aquaculture production in China and Vietnam Data retrieved from FAO (2016)
4 Chapter 1 Motivation and Background
5
2 | Analysing Spatio-temporal Pat-terns of Coastal Aquaculture Basedon Three Decades of Satellite Data
Abstract
Asia is the major contributor to global aquaculture production in quantity account-ing for almost 90 of farmed species These practices lead to extensive land use andland cover changes in coastal areas and thus harm valuable and sensitive coastalecosystems RS and GIS technologies contribute to the mapping and monitoringof changes in aquaculture providing essential information for coastal managementapplications This study aims to investigate aquaculture expansion and spatio-temporal dynamics in four Asian river deltas over three decades the Yellow RiverDelta (YRD) the Pearl River Delta (PRD) the Red River Delta (RRD) and theMekong River Delta (MRD) Long-term patterns of aquaculture change are derivedbased on combining existing aquaculture information for recent years with informa-tion extracted from the Landsat long-term archive Furthermore the suitability ofthe proposed approach to be applied on a global scale is tested based on exploitingthe Joint Research Centre (JRC) Global Surface Water (GSW) dataset Enormousincreases in aquaculture area were detected for all investigated target deltas an186-fold increase for the YRD (19842016) a 41-fold increase for the PRD (19902016) a 16-fold increase for the RRD (19902016) and a 72-fold increase for theMRD (19892015) Furthermore hotspots of aquaculture expansion were detectedbased on linear regression analyses for the Chinese target deltas indicating thathotspots are located in coastal regions for the YRD and along the Pearl River inthe PRD A comparison with high resolution Google Earth Data demonstrates thatthe proposed approach is able to detect spatio-temporal changes of aquaculture atan overall accuracy of 71 The presented approach has the potential to be appliedon larger spatial scales covering a time period of more than three decades This iscrucial to dene appropriate management strategies in order to reduce the environ-mental impacts of aquaculture expansion which are expected to further increase
Keywords aquaculture Landsat earth observation remote sensing temporalanalysis river delta coastal region Asia
6 21 Introduction
21 Introduction
Aquaculture has experienced a remarkable global production increase in the lastdecades which has more than tripled from 19952014 to approximately 74 milliontonnes (FAO 2016) This trend is evoked by a variety of factors Among oth-ers continuing growth of world population globalisation and high market valuesof traded aquaculture commodities can be named (Ottinger et al 2016) In thisregard aquaculture has been promoted as a big contributer to global food securityas an alternative to capture sheries and entails an economic upswing for develop-ing and threshold countries However concerns about the environmental impact ofaquaculture farming have been rising especially on the evidence that aquaculturewill surpass shery production which has already happened in the Asian region(FAO 2016) Therefore aquaculture production and its implications for societyand the environment have become a hot topic in science and policy
Aquaculture as a high-value export good opens up new market opportunitiesfor developing countries Aquaculture is the sector of food production systems withhighest growth rates For the Vietnamese economy the MRD as a top producingregion for aquaculture plays an important role thereby has a higher gross domesticproduct growth than the rest of the country (Cosslett and Cosslett 2014) Severalstudies pointed out that aquaculture has the potential to reduce poverty across theworld (Irz et al 2007 Kaliba et al 2007 Pant et al 2014) Due to populationgrowth aquaculture as a controlled system of protein production is powerful incontributing to food security and to cover future nutrition demands which positivelyinuences human well-being (Herbeck et al 2013) In addition growing seaweedproofed to remove nutrients to counteract eutrophication of water bodies (Xiao et al2017)
However the negative eects of aquaculture production on the state of the envi-ronment especially the animal producing sector is evident The aquaculture indus-try is heavily polluting the surrounding waters both freshwater bodies or streams andsea water Wastewater created during aquaculture production is often dischargedunltered causing accumulation of pharmaceuticals (He et al 2016) and heavymetals (Liang et al 2016) accelerating eutrophication (Herbeck et al 2013) andenhancing harmful algal blooms (Wang et al 2008 Keesing et al 2011 Lee et al2011) To make room for aquaculture ponds in coastal areas mangrove forests getlogged which contribute to coastal protection are key nursery habitats and werefound to positively impact ltration eg of heavy metals (Nguyen et al 2015Nguyen van et al 2016) Heavy metals originating in industry can already be de-tected in aquaculture products (Cheng et al 2013) and the amounts even exceedChinese safety guidelines (Liang et al 2016) Besides pollution and deforestationof mangroves the water consumption of aquaculture production leads to exces-sive extraction of ground water which increases salinity (Ha et al 2018) Throughgroundwater pumping in the YRD subsidence rates are higher than local and globalsea level rise which exposes Asian megadeltas to various dangers like storm surgessalinate groundwater intensied ooding and shoreline retreat (Higgins et al 2013)In addition the positive eect of aquaculture on sustaining sh stocks (Stotz 2000)has to be doubted as most of the aquafeeds are made from shmeal and sh oil(Hardy 2010) which is produced from wild catch and consequently puts additionalpressure on sh stock (Naylor et al 2000 Pauly and Zeller 2017)
21 Introduction 7
Despite the fact that aquaculture production is detrimental to the environmentit will further expand (Pauly and Zeller 2017) In this context it is fundamen-tal to assess the dimensions of aquaculture and provide solid data for managementapplications The FAO provides the only global database on sheries and aqua-culture which is commonly used in science and policy (Garibaldi 2012) Howeverthe reliability of this database has been called into question assuming that num-bers are underestimating reality (Pauly and Zeller 2016 2017) RS technologiescan serve as an useful tool to determine aquaculture extent and its dynamics andresults may operate as an additional and independent source of data Additionallyspatio-temporal patterns of aquaculture become discernible which is crucial for themanagement of its expansion and its resources to guarantee for the maintenance ofits positive implications and to lower its negative eects
Dierent approaches exist to observe and quantify aquaculture based on RS andGIS techniques using Landsat imagery To assess bitemporal changes in shrimpaquaculture supervised classication approaches have been applied (Alonso-Peacuterezet al 2003) and change detection methods were undertaken to reveal the inu-ence of aquaculture on coastal ecosystems (Beacuteland et al 2006 Rajitha et al 2010Berlanga-Robles et al 2011 Bui et al 2014 Peneva-Reed 2014) However themajority of these studies investigate small-scale regions eg single bays or lagoons(Alonso-Peacuterez et al 2003 Bui et al 2014) a few villages (Peneva-Reed 2014) orparts along the coastline (Beacuteland et al 2006 Berlanga-Robles et al 2011) andrather focus on the quantication of aquaculture area To identify trends of aqua-culture time series assessments on large scales are needed Therefore Landsat dataprovides the ideal basis to rstly carry out an assessment on large spatial to globalscales and secondly to detect spatio-temporal patterns of aquaculture expansionon multitemporal scales However the spatial resolution of Landsat imagery is notsucient to accurately map aquaculture on single pond level which is crucial toassess spatio-temporal dynamics within the deltas Thus high resolution data isnecessary to accurately map aquaculture ponds and quantify their size and shapeespecially to distinguish between single aquaculture ponds (Ottinger et al 2017)
Therefore to cover the spatial requirements for this analysis aquaculture pondlayers based on Sentinel-1 imagery serve as the basis of this study which are kindlyprovided by Ottinger et al (2017) To cover the temporal components of this assess-ment Landsat Surface Reectance (SR) data are used thereby exploiting the largepotential of the open Landsat archive with multispectral satellite data spanning timeperiods of more than 30 years With the focus on Asian coastal aquafarms the goalof this study is to estimate increases in aquaculture area and to reveal the dynam-ics and possible hotspots of aquaculture expansion in coastal areas of four targetdeltas in China and Vietnam It is assumed that aquaculture area has increasedover the observed time period for all four study sites In addition it is hypothe-sised that hotspots of aquaculture can mainly be detected close to water sourcessuch as coastal areas and along the river course Furthermore the results of thisstudy serve to demonstrate potentials and limitations of aquaculture quanticationthrough long-term Landsat imagery and to highlight dierences in the assessmentamong the case study regions The results are compared with assessments based onGSW data which potentially serves to apply the approach on larger scales
8 22 Study Area
22 Study Area
The study area comprises four river deltas the YRD and the PRD in China andthe RRD and the MRD in Vietnam (Figure 21)
The YRD is the smallest out of the four investigated deltas and shows the small-est population (Table 21) The delta is located at the Chinese east coast in theprovince Shandong The Yellow River has a comparatively low water ow but trans-ports the highest sediment loads worldwide which originate in the countrys LoessPlateau and supply the oodplains with valuable nutrients (Ren 2015) It has alsogreat power of erosion is shifting its course and delta mouth continuously and hasbeen responsible for numerous dike breaches and oods (Higgins et al 2013 Ren2015) The delta region suers from rapid economic growth and urban expansionboth accompanied with heavy pollution as can be seen for many parts of Chinesecoastlines (Li et al 2009 Ottinger et al 2013 Wohlfart et al 2016 Li et al 2017)In addition groundwater extraction reaches alarming proportions mainly caused byaquaculture and the salt content exceeds that of seawater in some parts of the delta(Higgins et al 2013)
Among the study regions the PRD is the biggest and most populated delta (Ta-ble 21) and lies within the center of the Guangdong province The delta includesmega-cities with a population of more than 10 million like Guangzhou and Shenzhenas well as other multi-million cities The whole delta is undergoing enormous urbani-sation processes and single cities tend to become one large interwoven urban complex(Zhao et al 2017) Before the economic boom took place the delta played an es-sential role for Chinese agriculture but big parts of the land have been transformedto building land (Li and Yeh 2004) Nonetheless the majority of population isstill living in non-urban parts and agriculture is a popular practice within the PRDHeavy metal pollution originating from industry and aquaculture is a big concernwithin this area which is also evident within farmed aquatic species destined forfood consumption (Liang et al 2016) The use of pharmaceuticals in aquacultureis further accelerating pollution processes (He et al 2016) Many coastal areas inChina have to deal with heavy pollution but the PRD exceeds the usual parameters(Liang et al 2016)
The RRD and the MRD belong to the top producing regions of agriculturalcommodities in Vietnam In 1986 the doi moi (renovation) reformers were initiatedby the government to increase productivity and attraction for foreign investors (Setoand Fragkias 2007) This radical change has led to major LULC changes within thewhole country promoting intensied agriculture with high yields of valuable goods(Seto and Fragkias 2007) Within the RRD in northern Vietnam the capital Hanoiis located at the course of the Red River (Figure 21) The delta is densely populatedand has a total population of approximately 202 million (Table 21) The regionsclimate is determined by a rainy season between May and October followed by a dryseason from November to April (Nguyen et al 2015) The increase in aquaculturefarming can be seen in numbers on aquaculture production from approximately55600 tonnes in 1995 to 580915 tonnes in 2015 which is a ten fold increase within10 years (General Statistic Oce of Vietnam 2015)
The MRD is the most southern part of Vietnam and borders on Cambodia inthe northwest (Figure 21) The climate is tropical monsoonal with a dry seasonfrom December to May but humidity remains high throughout the year (Cosslett
22 Study Area 9
and Cosslett 2014) As a consequence of permanent water supply through theMekong and the tidal inuence from the South China Sea (Cosslett and Cosslett2014) the delta is of great importance for the agricultural sector The region isaccompanied with high production of paddy rice and aquaculture and thereforeessential for Vietnams economy About 26 million ha are used for agriculture forwhich rice production itself accounts for 2 million ha (Ha et al 2018) and requires65 of the available freshwater (Cosslett and Cosslett 2014) Aquaculture hasrapidly developed to a top export commodity and is pushing away from subsistencefarming towards a more prot-oriented agriculture operated by companies (Cosslettand Cosslett 2014) Another reason for the rise in aquaculture production is theincreasing salinity in the southern coastal areas Farmers are shifting from rice cul-tivation to saline brack-water shrimp farming (Cosslett and Cosslett 2014) Alongthe deltas coastline mangrove forests are getting re-established after being exces-sively logged during the 1980s and 1990s mainly due to aquaculture and shrimpfarming (Cosslett and Cosslett 2014)
Figure 21 Map of the four investigated deltas
Table 21 Characteristics of the investigated deltas (adapted from Ottinger et al 2017)
10 23 Materials and Methods
23 Materials and Methods
231 Data
2311 Landsat Surface Reectance Data
In this study multispectral Level-2 Landsat SR data are used The Landsat programbuilds an ideal basis to answer the above stated research questions as it provides acontinuous time series of satellite data starting in 1972 with Landsat 1 and contin-uing until now with its latest satellite Landsat 8 and with imagery free of chargeAlthough Landsat 1 2 and 3 were operating from 1972 onwards only data fromLandsat 4 (19821993) and Landsat 5 Thematic Mapper (TM) (19822012) Land-sat 7 Enhanced Thematic Mapper Plus (ETM+)(19992017) and Landsat 8 Opera-tional Land Imager (OLI)(20132017) are taken into consideration as they providean identical spatial resolution of 30m Downsampling methods are not appliedas they are rather work intensive and need accurate geo-referencing (Almonacid-Caballer et al 2017) In addition the envisioned data is covering a potential timeperiod from 1982 until now and most of the remarkable alterations in aquaculturefarming have been taken place in recent decades (FAO 2016)
The Level-2 SR data guarantee for atmospheric correction following the principlesof the Landsat Ecosystem Disturbance Adaptive Processing System (LEDAPS) forLandsat 5 and 7 imagery (Masek et al 2006) and the Landsat Surface ReectanceCode (LaSRC) for Landsat 8 imagery (US Geological Survey) In addition theSR data contain the so-called CFmask band The band provides values 04 forve classes where 0=clear 1=water 2=shadow 3=snow and 4=cloud Thereforeit can be used for masking disturbing pixels containing clouds or cloud shadowswithin Earth Observation (EO) data and was found to perform best among othercloud masking algorithms (Foga et al 2017) It is based on the Function of mask(Fmask) algorithm initially created in MATLAB (Zhu and Woodcock 2012) andwas later transferred to the C language to enhance its eciency (Foga et al 2017)The Landsat SR data are originally provided by the US Geological Survey (USGS)but are assessed and processed through the Google Earth Engine (GEE) platformThe GEE is a cloud-based platform providing a multi-petabyte ready to use datacatalogue and the respective computational resources for quick and eective onlineprocessing (Gorelick et al 2017)
In total 5213 Landsat SR scenes were processed in this study of which 76originate from Landsat 5 followed by 7 and 17 originating from Landsat 7and Landsat 8 respectively For the YRD a total of 1908 scenes are used whichare sucient to generate cloud free image composites for every year between 1984and 2016 (Figure 22) For the PRD a total of 2124 scenes are used with noinformation for the years 2010 2012 and 2015 due to insucient data coverageFor the RRD heavy cloud cover results in major data gaps throughout the entireobservation period which reduces annual data coverage below the feasible limitfor assessing yearly aquaculture dynamics Therefore multi-annual composites areproduced for the time periods 19901994 19951999 20002004 20052009 and20132016 The period 20102012 is excluded due to insucient data coverage andhigh cloud cover For the MRD Landsat SR data are only available for a limitednumber of years making it impossible to use the Landsat SR data in the proposed
23 Materials and Methods 11
approach Therefore the JRC GSW data set (Section 2313) was used instead toanalyse the aquaculture dynamics for this study region
Figure 22 Used Landsat SR data for creating the annual water masks for the YRD the PRDand the RRD The bar colours indicate the used Landsat SR data For the MRD Landsat SRdata were insucient and hence the JRC GSW data set was used instead for this study region
2312 Sentinel-1 Aquaculture Layer
Although the Landsat program provides data for a long time period Landsatsspatial resolution of 30m is a limiting factor for detecting small scale features suchas aquaculture ponds (Ottinger et al 2017 Phiri and Morgenroth 2017) Especiallyaquaculture farming on household scale is characterised by rather small water ponds(Ottinger et al 2017) below 900m2 corresponding to the Instantaneous Field ofView (IFOV) of the Landsat sensors Furthermore due to the narrow dams betweenindividual aquaculture ponds water areas are often recognised but will not showaccurate detection of single aquaculture ponds and would probably fail to guaranteefor assessing the diverse structures of aquaculture Therefore this study combinesthe advantage of high spatial resolution Sentinel-1 data for precise aquaculture pondmapping with the temporal component of Landsat imagery for analysing historicalpatterns and dynamics of aquaculture
Therefore for each delta an aquaculture mask derived from Sentinel-1 time seriesdata is used in this thesis to reect the actual aquaculture structures at pond levelThese layers in vector format (Figure 24) were kindly provided by Ottinger et al(2017) and are termed as Sentinel-1 Layers in further explanations The authors used10m resolution Sentinel-1A Synthetic Aperture Radar (SAR) data acquired betweenSeptember 2014 and September 2016 in an object-based classication approach to
12 23 Materials and Methods
extract aquaculture ponds resulting in an overall accuracy of 083 for all four riverdeltas The denition of aquaculture is based on several criteria like the geometryof aquaculture ponds (area and perimeter) two compactness metrics the slope oflocation and the exclusion of standing water areas For detailed information on theapproach and results consult the study of Ottinger et al (2017)
Table 22 shows some general characteristics of the aquaculture ponds derivedfrom the Sentinel-1 Layers for the four target regions It can be seen that themean aquaculture pond size is by far biggest for the YRD (434502m2) followedby the MRD (88736m2) RRD (48851m2) and PRD (39665m2) Considering thedistribution of aquaculture pond size among the deltas nearly all ponds in the YRDare larger than 900m2 with 12 and therefore the chance of being detected onthe basis of 30m Landsat imagery is high In the remaining deltas small pondsbelow 900m2 make up large proportions up to more than one third of all pondsand therefore an approach based on Landsat data alone can be expected to haveless precise results
Table 22 Characteristics of the aquaculture ponds retrieved from the Sentinel-1 AquacultureLayers
2313 The Global Surface Water Data
A global raster data set on inland water surfaces the so called GSW data set isused in this study as an alternative to custom tailored water masks derived fromthe Landsat SR data archive This has two reasons rst the GSW data set is usedas the main data source for the analysis in the MRD for which Landsat SR dataare not available Second the GSW data set is used in a comparative analysis inthe remaining three deltas to asses its use as an readily available substitute datasource for a potential global scale application In addition the GSW data set isused to asses natural water bodies for the rst year of observation that have beenturned to aquaculture ponds in subsequent years in the course of the accuracyassessment (Section 234) The GSW dataset by Pekel et al (2016) consists of avariety of products containing data on global water dynamics and extents It can beassessed through the GSW Explorer initiated by the European Commissions JRC(European Commission 2016) For this study the yearly history dataset is usedwhich is available via the GEE platform The data contain four classes 0=no data1=not water 2=seasonal water and 3=permanent water It is based on LandsatTop of Atmosphere (ToA) data and is available until the year 2015
Annual data were consistently available from 19842015 for the YRD Howeverdata coverage was not sucient for the other deltas and several years had to beexcluded for further analysis The analysis was undertaken from 19882015 for the
23 Materials and Methods 13
PRD but data was missing for 1989 19921995 and 1997-1999 The aquacultureof the RRD was again observed for 5-year intervals from 19902009 and a 3-yearinterval for 20132015 For the MRD for which only insucient Landsat SR dataare available patterns are analysed for 19892015 with missing data for the years1987 1988 and 19901998
232 Assessment of Aquaculture Dynamics
Spatio-temporal aquaculture dynamics are assessed by combining current aquacul-ture structures at pond level derived from Sentinel-1 data with annual water masksderived from historic Landsat data Thereby this methodological approach is basedon the simplied assumption that 1) due to the continuous and rapid developmentof aquaculture worldwide current pond structures resemble the maximum status ofaquaculture expansion compared to previous years and 2) that identied ponds forthe reference year 2016 are also highly likely to be ponds in a previous year whenpermanently lled with water during this specic year
The annual water masks for each delta region are generated according to thefollowing six steps (Figure 23) rstly for every target year all available Landsatimages are selected and cloud and cloud shadow masking is performed based onthe CFmask band Secondly the Normalised Dierence Water Index (NDWI) iscalculated for every Landsat image to better identify surface waters within the deltasThe NDWI formula after McFeeters (1996) using the GREEN and NIR band isapplied as it is the most common in detecting open water bodies in the eld ofapplications in EO The index is dened as
NDWI =GREEN minusNIR
GREEN +NIR (21)
The third step focuses on the exploitation of the temporal characteristics of aqua-culture ponds Aquaculture ponds can be generally described as permanent waterbodies in contrast to eg temporarily inundated rice paddy elds which are themain source of confusion in this approach Therefore temporal metrics ie the 10thand the 90th percentiles are calculated based on all cloud free NDWI observationsfor each pixel The dierence of the the lowest (10th percentile) and highest (90thpercentile) NDWI values within the year serves as a good indicator for the per-sistence of inundation supporting the accurate dierentiation between aquacultureand rice paddy elds Fourth a threshold was set to separate pixels attributed toland or water which results in a binary permanent water-land mask for each deltaThe threshold for every river delta was dened empirically by trial and error andwas validated by interpreting high resolution Google Earth imagery
In the fth step the binary land-water mask derived from Landsat was combinedwith the Sentinel-1 Aquaculture layer and the proportion of water area within eachpond was computed In the last step only those ponds were selected as correctlyidentied aquaculture ponds that showed a certain minimum percentage of watercoverage Thereby dierent thresholds were empirically tested and nally set to33 The rather low percentage can be explained by the dierent data sources(SAR versus multispectral) and spatial resolutions (30m versus 10m) as can beseen in Figure 24 It is evident that detected water surfaces and pond structuresshow generally corresponding patterns however do not match perfectly to eachother
14 23 Materials and Methods
INPUT Landsat 8 OLI
Sep 2014 - Sep 2016
Cloud masking
Calculation of NDWI
Landsat 5 7 8 (TM
ETM+ OLI)Annual
Difference
Set threshold
Composite90th
percentile
Composite10th
percentile
Binary land-water maskSep 2014 -Sep 2016
Binary land-water mask
Annual
Sentinel-1 Aquaculture
Layer
At least 33 water coverage within single
aquaculture ponds
Annual aquaculture layers
and dynamicsReference
Aquaculture Layer
OUTPUT
PROCESSING
At least 33 water coverage within single
aquaculture ponds
Figure 23 Workow diagram on creating the Reference Aquaculture Layer and assessing aqua-culture dynamics
Figure 24 The challenges on combining the Sentinel-1 Aquaculture Layer with Landsat satellitedata evoked by dierent spatial resolution One exemplary detail map for each investigated delta isshown (from left to right YRD PRD and RRD) The dierent spatial resolution of the input datarequires an appropriate approach to combine both datasets as water detection based on Landsatdata is very dierent from the aquaculture structure retrieved from the Sentinel-1 AquacultureLayer
For the YRD and PRD this approach is followed for every year where Landsat dataare available while for the RRD multiannual time steps are applied as described inSection 2311 For the MRD no adequate Landsat data were available For theYRD PRD and RRD the latest aquaculture layer incorporates all Landsat databetween September 2014 and September 2016 This so called Reference AquacultureLayer corresponds to the observation period of the Sentinel-1 Aquaculture layer and
23 Materials and Methods 15
serves as baseline for all previous years Furthermore for all four deltas additionalaquaculture layers were generated on the basis of the GSW data set for all yearsfor which respective GSW data were available This was done by replacing step 14with the annual water masks from the JRC GSW dataset
233 Temporal Patterns and Hotspots
To retrieve hotspots of aquaculture expansion and to detect their temporal patternswithin the target deltas a linear regression analysis was carried out For this pur-pose the deltas assessed with Landsat SR data (YRD PRD and RRD) were dividedinto a hexagon landscape The hexagon diameters are chosen to be the same for eachdelta with 4000m at their greatest spacing to easily enable comparisons among thedeltas The aquaculture polygons are converted into point data and are distinctlyassigned to the hexagon which they fall into The point data includes informationon the aquaculture pond area and the area is summed up for each hexagon andeach year To reveal aquaculture patterns and development over time a linear re-gression analysis was conducted thereby time is the explanatory variable and theaquaculture area is the response variable The regression analysis was undertakenfor each hexagon of the delta landscape which resulted in a total of 4349 individualregression analyses (494 for the YRD 2852 for the PRD and 1003 for the RRD)
234 Accuracy Assessment
The aim of the accuracy assessment in this study is to evaluate whether aquaculturedynamics are correctly detected through the proposed approach The PRD servesexemplary for validating the approach on assessing the temporal dynamics withinthe delta regions since this delta showed the best coverage of high resolution satel-lite data for dierent time points throughout the observation period Reference datawere collected using high resolution imagery available via Google Earth which isa frequently used source for ground truth reference data in RS studies (Khorramet al 2012) In order to include as many time points as possible in the assessmentall high resolution data available for the PRD were evaluated within the observationperiod covering the years 2004 2005 2006 2008 2011 2014 and 2016 To com-pare the agreement of prediction data and reference data two classes were created1) aquaculture ponds in the Reference Aquaculture Layer that were also detected asaquaculture in the year of evaluation (class stable aquaculture) and 2) aquacultureponds in the Reference Aquaculture Layer that have not been detected as aquacul-ture in the year of evaluation (class aquaculture change) In total 200 aquacultureponds were chosen by stratied random sampling for each of the two classes andevenly over all years of evaluation
The results on the accuracy assessment are shown in a confusion matrix andthe standard measures of accuracy ie the producers the users and the overallaccuracy as well as Cohens Kappa (Cohen 1960) were calculated The value of theKappa index is associated with dierent levels of agreement lt0 = no agreement0020 = slight agreement 021040 = fair agreement 041060 = moderate agree-ment 061080 = substantial agreement and 0811 = almost perfect agreement(Landis and Koch 1977)
With respect to the assumptions stated in Section 232 permanent natural water
16 24 Results
bodies that are converted to aquaculture in later years are one source of error leadingto overestimations of aquaculture These water areas are generally identied asaquaculture throughout the entire observation period regardless of their actual timepoint of conversion Therefore based on the GSW data annual water masks of thestarting year of investigation for each delta assessed with Landsat SR data (YRDPRD and RRD) are retrieved Articial water surfaces like aquaculture ponds areremoved manually by visual interpretation with the help of high resolution GoogleEarth imagery This results in a layer with natural water bodies for each delta andyear in which the observation period started 1984 for the YRD 1990 for the PRDand 19901994 for the RRD For the latter the yearly GSW data from 19901994were mosaicked before creating the water mask On the basis of these layers foreach delta those natural water bodies are identied that have been converted toaquaculture in later years during the observation period The proportion of theseerroneously identied ponds (false positives) in relation to all ponds can be used asindicator for the degree of uncertainty related to this error
24 Results
241 Reference Aquaculture Layer
A comparison of detected ponds and pond area for the Sentinel-1 Aquaculture Layerand the Reference Aquaculture Layer for all three deltas is shown in Table 23 Inthe YRD around 80 of ponds in the Sentinel-1 Aquaculture Layer were su-ciently covered with water as observed from the Landsat water mask and thereforewere also dened as aquaculture in the Reference Aquaculture Layer This highproportion of detected ponds for the YRD is followed by around 63 for the PRDand roughly 50 for the RRD When considering the detected aquaculture areanumbers increase to 95 for the YRD 81 for the PRD and 79 for the RRD
Table 23 Comparison of Sentinel-1 Aquaculture Layer (top) with created Reference AquacultureLayer (bottom) for the three target deltas assessed with Landsat SR data and time period fromSeptember 2014 to September 2016
24 Results 17
242 Mapping of the Aquaculture Dynamics
The dynamics of aquaculture for all four deltas were visualised with a colour-palettefrom blue (early in time) to dark red (late in time) with a corresponding grading incolour for each year as can be seen in Figure 2528 Each aquaculture pond washighlighted in the colour of the year of its rst appearance Therefore the coloursgive no evidence about the duration of their existence or their persistence Thedetailed map extents are not chosen systematically and serve for illustration purposesonly The maps provide an impression on general aquaculture characteristics likepond size (small or big) pond shape (square round or elongated) or pond location(at the coast at the course of rivers or other surface waters) Furthermore themaps reveal spatial and temporal patterns like the moving from coastal to innerdelta regions the development of ponds around surface waters Larger versions ofthe maps can be found in the appendix (Figure A14 A15 A16 and A17)
Figure 25 depicts the spatial-temporal aquaculture dynamics for the YRD forthe time period 19842016 The size of the aquaculture ponds is comparatively bigas can also be observed in Table 22 The ponds are predominantly elongated butalso squared Within the whole delta aquaculture aggregates rather at the coastalregions in particular at the north and south coast Some minor misclassicationcan be found for a small amount of ponds eg within the course of the river
The aquaculture within the PRD is characterised by the smallest mean pondsize among the investigated deltas as can also be observed from Table 22 and themap for the PRD in Figure 26 The map shows the dynamics of aquaculture for thetime period from 19902016 but due to insucient data coverage the years 20102012 and 2015 could not be included in the analysis The shape of the ponds iselongated or square-shaped The majority of aquaculture ponds concentrate alongthe branches of the river or along the coast The detailed extent within the mapshows aquaculture at one of the river mouths within the delta This spatial detailshows very clearly how aquaculture development gradually expanded from the coasttowards inland within the course of the observation period
For the RRD only ve year (19901994 19951999 20002004 20052009) andfour year (20132016) intervals could be observed as a consequence of low dataquality and quantity Figure 27 shows a focus region of the delta Most of theaquaculture within the delta is located at the coastline and at inner parts of thedelta fewer can be found close to the Red River The mean aquaculture pond sizeis 4885m2 (Table 22) and thus comparable to the pond sizes within the PRDThe aquaculture ponds are rather in square shape than elongated Just as in Fig-ure 26 the detailed map extent of Figure 27 impressively shows how aquaculturedevelopment in the RRD expands from the coast towards inland
The dynamics of aquaculture for the MRD are assessed on the basis of the GSWdata set (Figure 28) as Landsat SR data were not available for this delta regionThe rst year of observation is 1989 Many of the aquaculture ponds already existat that time followed by a high amount of aquaculture ponds rst appearing inthe early 2000s Furthermore it can be seen that aquaculture ponds developedaggregated from 2010 onwards
18 24 Results
Figure 25 Aquaculture dynamics for the YRD from 19842016
Figure 26 Aquaculture dynamics for the PRD from 19902016
24 Results 19
Figure 27 Aquaculture dynamics for the RRD from 19902016
Figure 28 Aquaculture dynamics for the MRD from 19892015 based on the GSW dataset
20 24 Results
243 Quantication of Aquaculture Area
A comparison of the increase in aquaculture area obtained by Landsat SR and GSWdata is shown in Table 24) The cumulative aquaculture area for the four deltaregions can be seen in Figure 29 The bar graphs indicate the observed aquaculturearea in km2 within each delta for the years of investigation on the x-axis for theYRD (Landsat SR data 19842016 GSW data 19842015) the PRD (Landsat SRdata 19902016 GSW data 19882015) the RRD (Landsat SR data 19902016GSW data 19902015) and the MRD (19882015 analysed with GSW data only)Figure 210 shows separately the accompanied results from regression analyses withregression lines for each delta including the 95 condence region
Based on Landsat SR data dierent local peaks for the YRD can be seen for 1990with 227 km2 for 1998 with 278 km2 and for 2002 with 434 km2 (Figure 29) Themaximum aquaculture area in this delta region occurred in year 2015 with 779 km2The minimum was observed for the year 1984 with a total aquaculture area of 42 km2which is also the beginning of the observation period The Aquaculture area from1984 to 2015 based on GSW data shows also an increase although the overallincrease is relatively low with 722 compared to the increase of 1856 based onLandsat SR data (Table 24) At the beginning of the observation in 1984 theaquaculture area is calculated with 105 km2 for the GSW data which is a dierenceof approximately 63 km2 compared to the assessment with Landsat data In 2015the aquaculture area is 807 km2 for the GSW data which corresponds to a dierenceof 27 km2 However a clear upward trend can be seen for both The results from theregression analysis reveal that the annual increase in aquaculture area is identicalfor the YRD and amounts to 22 km2 (Landsat SR data adj R2 = 095 p-value= lt22times 10minus16 GSW data set adj R2 = 091 p-value = lt22times 10minus16) (Figure210)
Local peaks for the PRD can be detected for the assessment with Landsat datain 1993 with 364 km2 and in 2008 with 664 km2 whereas the maximum aquaculturearea was observed in the year 2016 with 838 km2 which marks the nal year ofthe observation period The overall minimum of aquaculture area for the PRD from19902016 can be observed in 1991 with 187 km2 The annual increase in aquaculturearea assessed with Landsat data is 25 km2 (adj R2 = 091 p-value = 264times 10minus10)(Figure 210) Considering the aquaculture area for the PRD assessed with GSWdata an overall increase of 406 from 241 km2 to 674 km2 in the period from 19882015 can be observed (Table 24) This coincides with an annual increase of 16 km2
(adj R2 = 075 p-value = 5362times 10minus7) The annual increase is not in accordancewith the results presented for the Landsat SR data which revealed a 9 km2 higherincrease in aquaculture area per year (Figure 210) Therefore the two dierentapproaches provide dissimilar results for the temporal aquaculture dynamics in thePRD
For the RRD a continuous and steady increase in aquaculture can be observedfrom 132 km2 in the 19901994 interval up to 205 km2 observed for the 20132016interval On the basis of the GSW dataset the areal increase for the RRD amountsto 16 km2 for each multi-annual time step (adj R2 = 073 p-value = 004) Bothassessments yield similar results for the RRD and show only slight dierences Withthe used GSW data an aquaculture area of 136 km2 for 19901994 and 197 km2 for20132015 is identied which is an increase of 145 (Figure 210) No signicanttrend can be revealed for the GSW data (adj R2 = 073 p-value = 006)
24 Results 21
For the MRD the surface area used for aquaculture increased from 352 km2 in1989 to 2507 km2 in 2015 which corresponds to a total increase of 712 (Figure29) Therefore the annual increase for the time period from 19892015 is 94 km2
(adj R2 = 074 p-value = 2952times 10minus6) per year (Figure 210) This is the highestyearly increase found within this study Additionally a strong increase can beobserved from 19992005 and afterwards the area almost remains between 2200 km2
and 2500 km2
Table 24 Increase in aquaculture area for the assessment based on Landsat SR data and GSWdata showing the results for the rst and last years of observation and accompanied increase inpercent
Figure 29 Cumulative aquaculture area for the YRD PRD RRD and MRD based on GSWdata (yellow) and Landsat SR data (purple) The overlapping parts of the GSW data set and theLandsat SR are brownish coloured (mixture of both colours)
22 24 Results
Figure 210 Trend in aquaculture area for the YRD PRD RRD and MRD based on GSW data(yellow) and Landsat SR data (purple) with adjusted R2 and p-value obtained from the regressionanalysis The overlapping parts of the GSW data set and the Landsat SR are brownish coloured(mixture of both colours)
244 Temporal Patterns and Hotspots
In order to reveal aquaculture patterns over time and to identify hotspot areas aspatial explicit regression analysis was carried out for three deltas on the basis ofthe hexagon landscape (Figure 211 212 and 213) described in Section 233 Themaps reveal the trend of aquaculture development for the observed time period andfor each 4000m hexagon within the delta landscape (each hexagon area correspondsto approximately 13 million m2) For areas without aquaculture no hexagons wheregenerated The observed trends are divided into four classes namely increase inaquaculture area decrease in aquaculture area no observed trend or no signicantchange (p-value le 005) The average increase in area of aquaculture per year ortime step is again grouped according to the slope values retrieved from the regres-sion analysis The division into classes was made according to the Jenks NaturalBreaks algorithm (Jenks and Caspall 1971) and the resulting values were roundedfor reasons of clarity
The map for the YRD can be seen in Figure 211 The delta is divided into a totalof 494 hexagons containing aquaculture Only 10 of the hexagons show a decreasein aquaculture area and 97 reveal no signicant trend For 441 hexagons an in-crease in aquaculture area from 19842016 can be observed which corresponds to894 of the total number of hexagons For approximately 63 of all hexagons (310hexagons) aquaculture increase is lt30000m2) 85 of the hexagons are charac-terised by high (180000290000m2) and very high (gt290000m2) increase per yearConsidering the spatial distribution of these two classes and the medium increase
24 Results 23
class (90000180000m2) the major increases of aquaculture over the consideredtime period are present at the coastline of the delta
The PRD is divided into a total of 2852 hexagons (Figure 212) 158 ofthese showing no signicant trend 14 revealing a declining trend in regard ofaquaculture area and for 01 no trend is apparent The parts of the delta inwhich a decrease can be observed are mainly located at the coastline or on oshoreislands of the region For 827 of the hexagons an increase in aquaculture areafrom 19902016 can be observed The high area increase classes (4000080000m2
and gt80000m2) are mostly located in near proximity to the Pearl River and canbe found for some areas along the coast
The spatio-temporal dynamics for aquaculture within the RRD is displayed inFigure 213 The whole region is divided into 1003 hexagons of which 673 revealto be not signicant 09 show no trend and 94 show a decrease in aquaculturearea over time The remaining part of 224 of the delta expose an increasingtrend in aquaculture area Although the results of the regression analysis gave nosignicant results for most of the parts the increase of aquaculture area at the coastsgives an idea on the patterns over time The parts of the delta with declining trendare distributed all over the delta Thus no clear pattern can be revealed for theRRD
Figure 211 Temporal patterns and Hotspots of aquaculture expansion for the YRD
24 24 Results
Figure 212 Temporal patterns and Hotspots of aquaculture expansion for the PRD
Figure 213 Temporal patterns and Hotspots of aquaculture expansion for the RRD
24 Results 25
245 Accuracy Assessment
The PRD serves exemplary for validating the outcomes of this study The confu-sion matrix reveals that a large majority was correctly identied as the class stableaquaculture with 196 aquaculture ponds out of 200 and only 4 ponds were incor-rectly assigned to this class (Table 25) However only 88 aquaculture ponds werecorrectly classied as the class aquaculture change and 112 ponds were incorrectlydetected as aquaculture change Therefore based on the presented approach theclass stable aquaculture is often confused with the class aquaculture change
The accuracies and Kappa coecient can be observed in Table 26 The Overallaccuracy is given with 071 and represents the agreement of the prediction and thereference data The computed Kappa with 072 can be categorised as a substantialagreement of both prediction and reference data (Landis and Koch 1977) Theproducers accuracy is 064 for the class stable aquaculture and 095 for the classaquaculture change The Users Accuracy is given with 098 for stable aquacultureand 056 for aquaculture change
Table 25 Confusion matrix of the accuracy assessment for the PRD The class stable aquaculturerepresents aquaculture ponds which are present in 2016 and present in a reference year in the pastThe class aquaculture change account for aquaculture ponds which are present in 2016 howevernot present in a reference year in the past Following years were considered as reference years2014 2011 2008 2006 2005 and 2004
Table 26 Accuracies and Kappa obtained by the accuracy assessment for the PRD
One source of error of this approach are ponds that have been converted from per-manent mostly natural water bodies These ponds are generally identied as aqua-culture throughout the entire observation period regardless of their actual time pointof conversion Therefore the proportions of permanent water bodies were quantiedto have an idea on the impact of these water surfaces on the overall accuracy of thisapproach The assessment of natural water bodies is shown in Table 27 For theYRD 67 of all ponds are identied as natural water surfaces which coincides with
26 25 Discussion
38 of the total aquaculture area For the PRD 39 of the aquaculture pondsfrom the Reference Aquaculture Layer are considered to be natural water whichcorresponds to 79 of aquaculture area 36 of aquaculture ponds and 47 ofaquaculture area are detected as natural waters within the RRD
Table 27 Assessment of natural water bodies within the target deltas The shown numbers arein percentage of the total aquaculture ponds from the Reference Aquaculture Layer
25 Discussion
251 Increase in Aquaculture Area
One major aim of this study was to investigate the change in aquaculture area withinthe observed time period for the target river deltas The expectation was to observean increase in area An expansion in aquaculture area was revealed for each of thefour deltas and for both assessments based on Landsat SR data and based on theGSW data set
Considering the assessment based on Landsat SR data the highest relative andtotal increase was detected for the YRD (186-fold increase in aquaculture area from1984 to 2016) although it is the smallest region of interest This is in accordancewith ndings showing that the Shandong province is the main aquaculture produceralong Chinas coastal regions (Gao et al 2008) Furthermore aquaculture is a ma-jor expanding land cover type within the YRD (Higgins et al 2013 Ottinger et al2013) Another factor which might contribute to aquaculture expansion is the largesize of single aquaculture ponds within the YRD (Table 22) which adds a highamount of aquaculture area per year caused by comparatively few additional pondsThe size of aquaculture ponds also supports that the aquaculture production in theYRD is rather commercial than on small household or subsistence scale (Hamilton2013) Based on the assessment with the GSW data set the increase in aquacul-ture area deviates substantially from the results based on Landsat SR data TheGSW results revealed a 71-fold increase in area (19842015) for the YRD therebyincreases in aquaculture area are considerably lower Water areas might be overes-timated for the beginning of the observation period which would cause the overallincrease in aquaculture area to be lower Large areas at the coast have been identi-ed as water eg seasonally ooded land cover types like wetlands and oodplainsThis eect has also been shown during the creation of water masks whereby watersurfaces were especially overrepresented along the coast of the YRD which resultedin bigger water areas for the coastal regions (Figure A18)
The PRD is characterised by a 41-fold increase based on Landsat data and a28-fold increase based on the GSW data set (Table 24) The magnitude of aqua-culture expansion is again lower for the assessment with GSW data set and can bejustied based on the assumption made in the previous paragraph The increase inaquaculture area is relatively low for the PRD when compared to the ndings for
25 Discussion 27
the YRD This might be caused by rapid urban growth within the Pearl delta regionIn the past decades a major part of the deltas former agriculture area has beenturned into building land for real estate and industry (Li and Yeh 2004 Zhou andSun 2010) As a consequence it is no longer available for aquaculture productionIn addition the PRD became the biggest urban region in size and population (WorldBank Group 2015) which rather promotes urbanisation than increases in aquacul-ture area Although the total increase in aquaculture area is lower for the PRDits expansion in area of 632 km2 (Landsat SR data) and 279 km2 (GSW data set) isconsiderable with an annual increase in area of approximately 25 km2 (Landsat SRdata) and 16 km2 (GSW data set) This let to the conclusion that aquaculture isstill maintaining and increasing in area even in the most populated urban regionworldwide
The aquaculture area in the RRD shows a 16-fold increase based on Landsatdata and a 15-fold increase based on the assessment with GSW data set indicating asolid agreement of both assessments for this delta region The aquaculture expansionis comparatively low with 73 km2 (Landsat SR data) and 61 km2 (GSW data set) forthe observation period A possible reason can be found within the historical LULCchange in Vietnam As stated earlier the Vietnamese renovation reforms wereenacted in 1986 followed by mangrove removal and intensication of agriculturealso promoting excessive aquaculture expansion within the RRD in less than onedecade (Seto and Fragkias 2007) Consequently major changes in aquaculturemight have taken place prior to the rst year of observation in 1990 and thus arenot considered within the observed time period In addition mangrove reforestationprograms were initiated in 1988 and two nature reserves were established in 1988 and1995 covering a total coastal area of 145 km2 (Seto and Fragkias 2007) which wouldnot favour aquaculture expansion Both circumstances might have contributed tothe comparatively low increase in aquaculture area within the RRD
A strong increase in aquaculture area is demonstrated for the MRD showinga 71-fold increase in aquaculture area from 1988 to 2015 and annual aquacultureexpansion of 94 km2 (GSW data set) Unfortunately no comparison based on Land-sat SR data can be drawn for the MRD as data was not available for this deltaregion The MRD is an important region for the Vietnamese agricultural sectoreg rice paddy production and contributes enormous amounts of capture sheriesand aquaculture Especially in the 1980s and 1990s mangrove forests were destroyedfor aquaculture farming (Cosslett and Cosslett 2014) which is also reected in thesubstantial increase in aquaculture area found in this study Comparing the ex-pansion of capture sheries and aquaculture between 2000 and 2010 aquacultureproduction increased much faster with an annual growth rate of 1846 comparedto 988 in capture sheries (Cosslett and Cosslett 2014) In addition the pro-duction of aquaculture goods revealed a 5-fold increase from 2000 to 2010 (Cosslettand Cosslett 2014) The strongest increase in aquaculture area was also shownfor this time period with an approximately tripling of the aquaculture area (Figure29) This indicates that the increase in production is linked with an increase inaquaculture area too
To conclude both assessments revealed that aquaculture dynamics are charac-terised by notable expansions of aquaculture area within the observed time periodFrom an economic point of view an increase in aquaculture is likely to be followedby economic growth (Touque and Belton 2014) decrease in poverty (Irz et al
28 25 Discussion
2007 Kaliba et al 2007) and an increase in welfare on the individual basis (Pantet al 2014) From a nature conservation point of view increases in aquaculturearea are linked with increasing ecological vulnerability of the delta regions rangingfrom salinisation (Pine and Boyd 2011) over pollution (Li et al 2009 Herbecket al 2013 He et al 2016) to wetland change and mangrove removal (Xu et al2011 Pham and Yoshino 2016 Richards and Friess 2016) The results regard-ing aquaculture expansion revealed that the increase in aquaculture varies in termsof magnitude among the four deltas In addition aquaculture ponds structureseg pond size are very dierent for the investigated deltas both facts emphasisingthat aquaculture management requires adaptable conservation strategies As shrimpfarming is a big contributor to Asian aquaculture production but is also very haz-ardous for the environment (Cao et al 2007) two general scenarios for sustainableshrimp aquaculture exist (Bush et al 2010) These are designed for either small-scale producers or industrial scale producers (Bush et al 2010) which could beapplied based on delta-specic conditions Moreover several studies on optimisingaquaculture farming exist In general low-intensity aquaculture has the potentialto decrease environmental pressure It could support the reproduction success fornatural depleted populations uses less feed and environmentally disturbing supple-ments (Diana 2012) and can be integrated into coastal and mangrove habitats whilemaintaining their ecological functions (Bush et al 2010) Another option would beto promote plant-based aquaculture which has been shown to positively inuencewater quality by removing nutrients from coastal waters (Xiao et al 2017) and fromwastewaters originating during aquaculture production (Kumar et al 2015)
252 Dynamics and Hotspots of Aquaculture
No clear hotspot patterns could be revealed for the RRD as the regression anal-ysis was not signicant which might be a result of the low amount of data input(19901994 19951999 20002004 20052009 and 20132016) However the ex-ample result map for the RRD (Figure 27) revealed a spatio-temporal pattern ofaquaculture expansion developing from coast towards inland arguing that aquacul-ture was rst located at the coast and with growth in production new aquacultureponds have been built at the inner part of the coast
For the YRD and the PRD clear trends in hotspots of aquaculture expansionhave been revealed (Figure 211 and Figure 212) Hotspots have been expectedto be located at the coast and along the river course of the deltas mainly due toeasy water supply This hypothesis has been validated although with remarkabledierences among the two deltas
Hotspots of aquaculture expansion within the YRD have been detected along thecoast This is in accordance with ndings from Ottinger et al (2013) who foundincreases in cultivated aquatic surfaces primarily in coastal areas Additionally theauthors stated that aquaculture expansion is characterised by a coastward movementwith strongest increases in area within 35 km from the coastline in 2010 whichcoincides with the results of this study Aquaculture is often found in coastal areasas coasts provide easy access to water resources and they belong to low lying regionswhich are favourable for aquaculture production (Primavera 2006)
On the contrary for the PRD the hotspots of aquaculture increase are locatedalong the course of the river (Figure 212) In the PRD aquaculture is traditionally
25 Discussion 29
located along the river as farmers can easily ll up ponds with freshwater from theriver (Ruddle and Zhong 1988) Consequently this pattern is still apparent andthe ndings assume that additional aquafarms have been created along the PearlRiver during the observed period Simultaneously several areas along the coasthave been detected to show a decrease in aquaculture from 19902016 This mightbe a consequence of urban land expansion as the PRD is characterised by majorurbanisation processes and by industrial growth (Zhao et al 2017) This also causesconsiderable water pollution with heavy metals (Nguyen van et al 2016) As waterfor aquaculture farming is mainly withdrawn from the Pearl River the pollutedwater within the aquaculture ponds is absorbed by the farmed aquatic species Theheavy metals can be detected in cultured sh (Nghia et al 2009 Cheng et al 2013)therefore heavy metal contamination can be considered as a public health concern(Liang et al 2016)
To sum up hotspots of aquaculture expansion were found to be mainly locatedalong the coast (YRD) and rivers (PRD) Especially in Chinese delta regions waterquality is poor (Li et al 2009 Liang et al 2016 Wohlfart et al 2016) In aquacul-ture farming it is common practice to discharge polluted water unltered (Ottingeret al 2016) Therefore it can be assumed that increase in aquaculture productionin the investigated deltas is contributing to a deterioration of water quality
253 Potentials and Limitations of This Study
The outcomes of this study revealed the increases of aquaculture within all targetregions and illustrated the hotspots of aquaculture expansion for two deltas How-ever several limitations need to be taken into consideration regarding the methodsand assumptions used
The Landsat archive provides an outstanding availability of free EO imagerycovering a long-term time period (Wulder et al 2012) To exploit this data sourceLandsat SR data have been used to identify spatio-temporal dynamics of aquacultureover the last decades However optical satellite data are vulnerable to the eects ofclouds thus are restricted for applications in cloud-prone areas such as the humidtropics (Asner 2001) This was observable when processing data for the RRDexperiencing missing data for many years This was also true for some years withinthe observed time period for the PRD High cloud coverage inuenced the quality ofannual composites which might be an explanation for the annual uctuations withinthe results for the aquaculture area (Figure 29) Additionally no Landsat SR datawere available for the MRD Therefore data quality and availability were majorconstraints of this study Nevertheless the presented results provide an overviewon the general trends in aquaculture expansion and give insights in the aquaculturedynamics and the hotspot development
Another limitation for detecting the water areas of aquaculture with Landsatimagery is the coarse spatial resolution of 30m A high proportion of aquacultureponds from the Sentinel-1 Aquaculture Layer were not able to be detected withused Landsat SR data (Table 23) Therefore aquaculture area might be consider-ably higher than observed by this study In addition the outcomes of the accuracyassessment showed that aquaculture ponds have often been failed to be detectedfor the past years (Table 26 and 25) A major reason to be named is the coarsespatial resolution of Landsat imagery as large ponds in the YRD were more suit-
30 25 Discussion
able for being detected than smaller aquaculture ponds of the PRD and the RRDTherefore aquaculture characterised by bigger ponds is more likely to be detectedthan aquaculture consisting of rather small ponds That might also be caused bypixel-mixing eects (Birnie 1986) which make it dicult to identify smaller aqua-culture ponds However it does also make a dierence which type of aquaculture isobserved Alexandridis et al (2008) compared dierent imagery on the applicationof the identication of marine mussel farms and argue that high resolution imagerydoes not automatically give the best results for aquaculture assessments and thesensor types should be chosen according to observed aquaculture type
Furthermore all assessments of this study are based on the Sentinel-1 Aqua-culture Layer Thus it is assumed that aquaculture ponds did not change for theobserved time period which would indicate a bias in the results The used Sentinel-1Aquaculture Layer is based on the aquaculture pond location and extent for the timeperiod from September 2014 to September 2016 This would also lead in biggestaquaculture area for this period based on the assessment with Landsat SR dataTherefore aquaculture area for the last years of observation might be overrepre-sented whereas aquaculture ponds in former times are not considered and mightbe underestimated Based on the accuracy assessment it was revealed that aqua-culture ponds in the past have almost ever been correctly classied as aquacultureponds However based on the prediction data representing the assessment basedon this approach aquaculture ponds have not been detected in 56 of the cases(Table 26) This argues that more aquaculture ponds have been present in thepast and were not detected by this approach indicating that aquaculture area wasunderestimated at that point of time and therefore the expansion of aquaculturemight be overestimated for the observation period
In addition the approach ignores the presence of other water features like naturalwaters These water features were not excluded within the analysis Thereforenatural waters which have been turned into aquaculture during the observationperiod are a source of error Especially along the coasts of the PRD additionalaquaculture ponds have been built in natural coastal oodplains in the sea (byextending the coastline) (Figure A19) or in inland waters in the RRD (FigureA20) However this error was quantied by assessing natural water bodies for therst years of observation (1984 for the YRD 1990 for the PRD and 19901994 forthe RRD) The results showed that this eect does matter for aquaculture withinthe observed target deltas with 38 of aquaculture area accounting for naturalwaters within the YRD 79 for the PRD and 47 for the RRD (Table 27) Asa consequence the presence of natural waters aected the analysis of aquacultureand furthermore might also inuence the hotspot patterns found for the YRD andthe PRD Therefore I suggest to eliminate natural waters before assessing changesin aquaculture in further research One option would be to manually extract thembased on the GSW data set Another option is to apply the presented approachby Han et al (2005) which is based on feature extraction methods using Landsatimagery enabling the separation of aquaculture from other water features Howeverit can be doubt that this can accurately be performed for single aquaculture pondssolely on the basis of Landsat data and would require imagery with higher spatialresolution (Ottinger et al 2017) which might not be available for a deltawide orcontinentwide assessment
31
Besides stated limitations of this study an overall accuracy of 71 and a sub-stantial Kappa coecient of 072 were shown for the used temporal metrics (Table26) These results reveal a thorough accuracy for the presented approach Further-more spatio-temporal dynamics and patterns of aquaculture of four river deltas havebeen detected also highlighting similarities and dierences among the deltas Theapproach itself can easily be applied on larger spatial scales either by using LandsatSR data or with the help of global datasets like the used GSW product The ap-proach is not site-specic therefore suitable for being used in other target regionsAlthough it requires a high resolution aquaculture layer comparable to the Sentinel-1Aquaculture Layer Ottinger et al (2017) state that it can easily be created for otherregions even on continental and global scales Within this study the combination ofthe Sentinel-1 Aquaculture Layer with Landsat data guaranteed for precise mappingof the aquaculture ponds and opened the possibility to exploit the long-term dataavailability of the Landsat eet The combination of radar and Landsat satellitedata are widely used in the eld of EO where radar data has been shown to be avaluable complementary data source to Landsat imagery (Shimabukuro et al 2007Eckardt et al 2013 Cheng et al 2016) which was also demonstrated in this study
254 Outlook
The presented ndings revealed strong increases in aquaculture area for all fourriver deltas These results serve exemplary for other coastal regions in Asia andhighlight major environmental impacts of such a development As Asia has be-come the leading global aquaculture producer contributing almost 90 of quantityfurther increases in aquaculture area have to be expected This is particularly haz-ardous for the sensitive coastal ecosystems as many environmental consequences ofaquaculture expansion are already present and are likely to intensify in the futureBased on the investigated deltas the ndings of this study suggest that aquacultureexpansion is not following equal spatio-temporal dynamics Therefore unique man-agement eorts need to be elaborated to guarantee for human welfare and ecosystemfunctioning
Following up the results of this study an assessment for the complete Asiancoast would be the next step in further research Based on this the detection ofspatio-temporal dynamics for the coastal areas would not be restricted to singledelta regions but showing aquaculture development for the entire coastal regionsof Asia Therefore similarities and dierences of delta versus non-delta regionscould be retrieved also highlighting the strongest increases in aquaculture areaover time along the Asian coastal zone and revealing possible indicators for thedevelopment of aquaculture expansions and dynamics This could also be comparedfor conservation areas versus non-conservation areas or wetland areas versus non-wetland areas which would have valuable implications for the management of coastalregions across Asia
32
33
References
Alexandridis T K Topaloglou C A Lazaridou E and Zalidis G C The performanceof satellite images in mapping aquacultures Ocean amp Coastal Management 51(8-9)638644 2008 doi101016jocecoaman200806002
Almonacid-Caballer J Pardo-Pascual J and Ruiz L Evaluating fourier cross-correlation sub-pixel registration in Landsat images Remote Sensing 9(10)115 2017doi103390rs9101051
Alonso-Peacuterez F Ruiz-Luna A Turner J Berlanga-Robles C A and Mitchelson-Jacob G Land cover changes and impact of shrimp aquaculture on the landscape inthe Ceuta coastal lagoon system Sinaloa Mexico Ocean amp Coastal Management 46(6-7)583600 2003 doi101016S0964-5691(03)00036-X
Arneth A Sitch S Pongratz J Stocker B D Ciais P Poulter B Bayer A DBondeau A Calle L Chini L P Gasser T Fader M Friedlingstein P KatoE Li W Lindeskog M Nabel J E M S Pugh T A M Robertson E ViovyN Yue C and Zaehle S Historical carbon dioxide emissions caused by land-usechanges are possibly larger than assumed Nature Geoscience 10(2)7984 2017 ISSN1752-0894 doi101038ngeo2882
Asner G P Cloud cover in Landsat observations of the Brazilian Amazon In-
ternational Journal of Remote Sensing 22(18)38553862 2001 ISSN 0143-1161doi10108001431160010006926
Barsi J Lee K Kvaran G Markham B and Pedelty J The spectral response ofthe Landsat-8 Operational Land Imager Remote Sensing 6(12)1023210251 2014doi103390rs61010232
Beacuteland M Goiumlta K Bonn F and Pham T T H Assessment of landcover changesrelated to shrimp aquaculture using remote sensing data A case study in the GiaoThuy District Vietnam International Journal of Remote Sensing 27(8)149115102006 ISSN 0143-1161 doi10108001431160500406888
Bellwood P S First farmers The origins of agricultural societies Blackwell Pub MaldenMA 2007 ISBN 978-0-631-20565-4
Berlanga-Robles C A Ruiz-Luna A Bocco G and Vekerdy Z Spatial anal-ysis of the impact of shrimp culture on the coastal wetlands on the northerncoast of Sinaloa Mexico Ocean amp Coastal Management 54(7)535543 2011doi101016jocecoaman201104004
Birnie R V Pixel-mixing eects and their signicance to identifying snow condition fromLandsat MSS data International Journal of Remote Sensing 7(7)845853 1986 ISSN0143-1161 doi10108001431168608948894
34
Bocquet-Appel J-P When the worlds population took o The springboardof the Neolithic Demographic Transition Science 333(6042)560561 2011doi101126science1208880
Bui T D Maier S W and Austin C M Land cover and land use change related toshrimp farming in coastal areas of Quang Ninh Vietnam using remotely sensed data En-vironmental Earth Sciences 72(2)441455 2014 ISSN 1866-6280 doi101007s12665-013-2964-0
Bush S R van Zwieten P A Visser L van Dijk H Bosma R de Boer W Fand Verdegem M Scenarios for resilient shrimp aquaculture in tropical coastal areasEcology and Society 15(2)117 2010 ISSN 1708-3087 doi105751ES-03331-150215
Cao L Wang W Yang Y Yang C Yuan Z Xiong S and Diana J Environmentalimpact of aquaculture and countermeasures to aquaculture pollution in China Envi-
ronmental Science and Pollution Research - International 14(7)452462 2007 ISSN0944-1344 doi101065espr200705426
Cheng Y Le Yu Cracknell A P and Gong P Oil palm mapping using Landsat andPALSAR A case study in Malaysia International Journal of Remote Sensing 37(22)54315442 2016 ISSN 0143-1161 doi1010800143116120161241448
Cheng Z Man Y B Nie X P and Wong M H Trophic relationshipsand health risk assessments of trace metals in the aquaculture pond ecosystem ofPearl River Delta China Chemosphere 90(7)21422148 2013 ISSN 1879-1298doi101016jchemosphere201211017
Cohen J A coecient of agreement for nominal scales Educational and Psychological
Measurement 20(1)3746 1960 ISSN 0013-1644 doi101177001316446002000104
Cosslett T L and Cosslett P D Water Resources and Food Security in the Viet-
nam Mekong Delta volume 44 of Natural Resource Management and Policy SpringerSwitzerland 2014 ISBN 978-3-319-02197-3
Cui Y Liu J Hu Y Wang J and Kuang W Modeling the radiation balance ofdierent urban underlying surfaces Chinese Science Bulletin 57(9)10461054 2012ISSN 1001-6538 doi101007s11434-011-4933-x
Diana J S Aquaculture production and biodiversity conservation BioScience 59(1)2738 2009 ISSN 1525-3244 doi101525bio20095917
Diana J S Is lower intensity aquaculture a valuable means of producing food Anevaluation of its eects on near-shore and inland waters Reviews in Aquaculture 4(4)234245 2012 ISSN 17535123 doi101111j1753-5131201201079x
Eckardt R Berger C Thiel C and Schmullius C Removal of optically thick cloudsfrom multi-spectral satellite images using multi-frequency SAR data Remote Sensing5(12)29733006 2013 doi103390rs5062973
European Commission Global Surface Water Explorer 2016 URL https
global-surface-waterappspotcom
Falcucci A Maiorano L and Boitani L Changes in land-useland-cover patterns inItaly and their implications for biodiversity conservation Landscape Ecology 22(4)617631 2007 ISSN 0921-2973 doi101007s10980-006-9056-4
35
FAO The State of World Fisheries and Aquaculture 2016 Contributing to food security
and nutrition for all The state of world sheries and aquaculture Rome 2016 ISBN978-92-5-109185-2
Foga S Scaramuzza P L Guo S Zhu Z Dilley R D Beckmann T Schmidt G LDwyer J L Joseph Hughes M and Laue B Cloud detection algorithm comparisonand validation for operational Landsat data products Remote Sensing of Environment194379390 2017 ISSN 00344257 doi101016jrse201703026
Gao J Yang Z and Xie J Review on demand markets and trade of farming sheryproducts in China 2008
Garibaldi L The fao global capture production database A six-decade eort to catch thetrend Marine Policy 36(3)760768 2012 doi101016jmarpol201110024
General Statistic Oce of Vietnam 2015 URL httpsgsogovvnDefault_enaspx
tabid=491
Gibbs H K Ruesch A S Achard F Clayton M K Holmgren P Ramankutty Nand Foley J A Tropical forests were the primary sources of new agricultural land in the1980s and 1990s Proceedings of the National Academy of Sciences of the United States
of America 107(38)1673216737 2010 ISSN 1091-6490 doi101073pnas0910275107
Gorelick N Hancher M Dixon M Ilyushchenko S Thau D and Moore R GoogleEarth Engine Planetary-scale geospatial analysis for everyone Remote Sensing of En-vironment 2021827 2017 ISSN 00344257 doi101016jrse201706031
Ha T P Dieperink C van Dang Tri P Otter H S and Hoekstra P Governance con-ditions for adaptive freshwater management in the Vietnamese Mekong Delta Journalof Hydrology 557116127 2018 ISSN 00221694 doi101016jjhydrol201712024
Hamilton S Assessing the role of commercial aquaculture in displacing man-grove forest Bulletin of Marine Science 89(2)585601 2013 ISSN 00074977doi105343bms20121069
Han J Chi KwangHoon and Yeon YeonKwang Aquaculture feature extraction fromsatellite image using independent component analysis In Perner Petra and Imiya At-sushi editors Machine Learning and Data Mining in Pattern Recognition pages 660666 Springer Berlin Heidelberg 2005 ISBN 978-3-540-26923-6
Hardy R W Utilization of plant proteins in sh diets Eects of global demand andsupplies of shmeal Aquaculture Research 41(5)770776 2010 doi101111j1365-2109200902349x
He Z Cheng X Kyzas G Z and Fu J Pharmaceuticals pollution of aquacultureand its management in China Journal of Molecular Liquids 223781789 2016 ISSN01677322 doi101016jmolliq201609005
Herbeck L S Unger D Wu Y and Jennerjahn T C Euent nutrient and organicmatter export from shrimp and sh ponds causing eutrophication in coastal and back-reef waters of NE Hainan tropical China Continental Shelf Research 5792104 2013ISSN 02784343 doi101016jcsr201205006
Higgins S Overeem I Tanaka A and Syvitski J P M Land subsidence at aquaculturefacilities in the Yellow River delta China Geophysical Research Letters 40(15)38983902 2013 ISSN 00948276 doi101002grl50758
36
Irz X Stevenson J R Tanoy A Villarante P and Morissens P The equity andpoverty impacts of aquaculture Insights from the Philippines Development Policy
Review 25(4)495516 2007 ISSN 09506764 doi101111j1467-7679200700382x
Jenks G F and Caspall F C Error on chorophlethic maps denition measurementreduction Annals of the Association of American Geographers 61(2)217244 1971ISSN 0004-5608 doi101111j1467-83061971tb00779x
Jetz W Wilcove D S and Dobson A P Projected impacts of climate and land-use change on the global diversity of birds PloS Biology 5(6)12111219 2017doi101371journalpbio0050157g001
Kaliba A R Ngugi C C Mackambo J M Osewe K O Senkondo E MnembukaB V and Amisah S Potential eect of aquaculture promotion on poverty reduction inSub-Saharan Africa Aquaculture International 15(6)445459 2007 ISSN 0967-6120doi101007s10499-007-9110-5
Ke C-Q Zhang D Wang F-Q Chen S-X Schmullius C Boerner W-M andWang H Analyzing coastal wetland change in the Yancheng National Nature Re-serve China Regional Environmental Change 11(1)161173 2011 ISSN 1436-3798doi101007s10113-010-0130-8
Keesing J K Liu D Fearns P and Garcia R Inter- and intra-annual patterns of Ulvaprolifera green tides in the Yellow Sea during 2007-2009 their origin and relationshipto the expansion of coastal seaweed aquaculture in China Marine pollution bulletin 62(6)11691182 2011 ISSN 1879-3363 doi101016jmarpolbul201103040
Khorram S Nelson S A Koch F H and van der Wiele C F Remote SensingSpringer-Verlag New York Boston MA 1 edition 2012 ISBN 978-1-4614-3103-9doi101007978-1-4614-3103-9
Kumar D Santhanam P Thillainayagam J Kumar N Selvaraju A Devi S andPrasath B Excessive nutrients and heavy metals removal from diverse wastewaters usingmarine microalga Chlorella marina (Butcher) Indian Journal of Geo-Marine Sciences4497103 2015
Landis J R and Koch G G The measurement of observer agreement for categoricaldata Biometrics 33(1)159174 1977 doi1023072529310
Lee J H Pang I-C Moon I-J and Ryu J-H On physical factors that controlled themassive green tide occurrence along the southern coast of the Shandong Peninsula in2008 A numerical study using a particle-tracking experiment Journal of Geophysical
Research 116112 2011 ISSN 0148-0227 doi1010292011JC007512
Li H Y Man W D Li X Y Ren C Y Wang Z M Li L Jia M M and MaoD H Remote sensing investigation of anthropogenic land cover expansion in the low-elevation coastal zone of Liaoning Province China Ocean amp Coastal Management 148245259 2017 doi101016jocecoaman201708007
Li X and Yeh A G-O Analyzing spatial restructuring of land use patterns in a fastgrowing region using remote sensing and GIS Landscape and Urban Planning 69(4)335354 2004 ISSN 01692046 doi101016jlandurbplan200310033
Li X Mander Uuml Ma Z and Jia Y Water quality problems and potential for wetlandsas treatment systems in the Yangtze River Delta China Wetlands 29(4)112511322009 ISSN 0277-5212 doi10167208-2051
37
Liang P Wu S-C Zhang J Cao Y Yu S and Wong M-H The eects of mar-iculture on heavy metal distribution in sediments and cultured sh around the PearlRiver Delta region south China Chemosphere 148171177 2016 ISSN 1879-1298doi101016jchemosphere201510110
Masek J G Vermote E F Saleous N E Wolfe R Hall F G Huemmrich K FGao F Kutler J and Lim T-K A Landsat Surface Reectance dataset for NorthAmerica 19902000 IEEE Geoscience and Remote Sensing Letters 3(1)6872 2006doi101109LGRS2005857030
McFeeters S K The use of the Normalized Dierence Water Index (NDWI) in thedelineation of open water features International Journal of Remote Sensing 17(7)14251432 1996 ISSN 0143-1161 doi10108001431169608948714
Myers N Mittermeier R A Mittermeier C G da Fonseca Gustavo A B and KentJ Biodiversity hotspots for conservation priorities Nature 403(6772)853858 2000ISSN 1476-4687 doi10103835002501
Naylor R L Goldburg R J Primavera J H Kautsky N Beveridge M C Clay JFolke C Lubchenco J Mooney H and Troell M Eect of aquaculture on world shsupplies Nature 405(6790)10171024 2000 ISSN 1476-4687 doi10103835016500
Nghia N D Lunestad B T Trung T S Son N T and Maage A Heavy metals inthe farming environment and in some selected aquaculture species in the Van Phong Bayand Nha Trang Bay of the Khanh Hoa Province in Vietnam Bulletin of environmental
contamination and toxicology 82(1)7579 2009 ISSN 1432-0800 doi101007s00128-008-9561-z
Nguyen T S Chen C-F Chang N-B Chen C-R Chang L-Y and Thanh B-X Mangrove mapping and change detection in Ca Mau Peninsula Vietnam usingLandsat data and object-based image analysis IEEE Journal of Selected Topics in
Applied Earth Observations and Remote Sensing 8(2)503510 2015 ISSN 1939-1404doi101109JSTARS20142360691
Nguyen van T Ozaki A Nguyen Tho H Nguyen Duc A Tran Thi Y and KurosawaK Arsenic and heavy metal contamination in soils under dierent land use in an estuaryin northern Vietnam International journal of environmental research and public health13(11)113 2016 ISSN 1660-4601 doi103390ijerph13111091
Ottinger M Kuenzer C Liu G Wang S and Dech S Monitoring land cover dynamicsin the Yellow River Delta from 1995 to 2010 based on Landsat 5 TM Applied Geography445368 2013 ISSN 01436228 doi101016japgeog201307003
Ottinger M Clauss K and Kuenzer C Aquaculture Relevance distribution impactsand spatial assessments A review Ocean amp Coastal Management 119244266 2016doi101016jocecoaman201510015
Ottinger M Clauss K and Kuenzer C Large-scale assessment of coastal aqua-culture ponds with Sentinel-1 time series data Remote Sensing 9(5)123 2017doi103390rs9050440
Pant J Barman B K Murshed-E-Jahan K Belton B and Beveridge M Canaquaculture benet the extreme poor A case study of landless and socially marginalizedAdivasi (ethnic) communities in Bangladesh Aquaculture 418-419110 2014 ISSN00448486 doi101016jaquaculture201309027
38
Pattanaik C and Narendra Prasad S Assessment of aquaculture impact on mangrovesof Mahanadi delta (Orissa) East coast of India using remote sensing and GIS Ocean amp
Coastal Management 54(11)789795 2011 doi101016jocecoaman201107013
Pauly D and Zeller D Catch reconstructions reveal that global marine sheries catchesare higher than reported and declining Nature communications 719 2016 ISSN2041-1723 doi101038ncomms10244
Pauly D and Zeller D Comments on FAOs state of world sheries and aquaculture(SOFIA 2016) Marine Policy 77176181 2017 doi101016jmarpol201701006
Pekel J-F Cottam A Gorelick N and Belward A S High-resolution mapping ofglobal surface water and its long-term changes Nature 540(7633)418422 2016 ISSN1476-4687 doi101038nature20584
Peneva-Reed E Understanding land-cover change dynamics of a mangrove ecosystem atthe village level in Krabi Province Thailand using Landsat data GIScience amp Remote
Sensing 51(4)403426 2014 ISSN 1548-1603 doi101080154816032014936669
Pettorelli N Schulte to Buumlhne H Tulloch A Dubois G Macinnis-Ng C QueiroacutesA M Keith D A Wegmann M Schrodt F Stellmes M Sonnenschein R GellerG N Roy S Somers B Murray N Bland L Geijzendorer I Kerr J TBroszeit S Leitatildeo P J Duncan C El Serafy G He K S Blanchard J LLucas R Mairota P Webb T J Nicholson E Rowclie M and Disney MSatellite remote sensing of ecosystem functions Opportunities challenges and way for-ward Remote Sensing in Ecology and Conservation 112(3)123 2017 ISSN 20563485doi101002rse259
Pham T D and Yoshino K Impacts of mangrove management systems on man-grove changes in the Northern Coast of Vietnam Tropics 24(4)141151 2016doi103759tropics24141
Phiri D and Morgenroth J Developments in Landsat land cover classication methodsA review Remote Sensing 9(967)125 2017 doi103390rs9090967
Pine H J and Boyd C E Stream salinization by inland brackish-water aquacul-ture North American Journal of Aquaculture 73(2)107113 2011 ISSN 1522-2055doi101080152220552011545580
Primavera J H Overcoming the impacts of aquaculture on the coastal zone Ocean amp
Coastal Management 49(9-10)531545 2006 doi101016jocecoaman200606018
Rajitha K Mukherjee C K Vinu Chandran R and Prakash Mohan M M Land-cover change dynamics and coastal aquaculture development A case study in theEast Godavari delta Andhra Pradesh India using multi-temporal satellite data In-
ternational Journal of Remote Sensing 31(16)44234442 2010 ISSN 0143-1161doi10108001431160903277456
Ren M Sediment discharge of the Yellow River China Past present and future-Asynthesis Acta Oceanologica Sinica 34(2)18 2015 doi101007s13131-015-0619-6
Richards D R and Friess D A Rates and drivers of mangrove deforestation in SoutheastAsia 2000-2012 Proceedings of the National Academy of Sciences of the United States
of America 113(2)344349 2016 ISSN 1091-6490 doi101073pnas1510272113
39
Ruddle K and Zhong G Integrated agriculture-aquaculture in south China The dike-
pond system of the Zhujiang Delta Cambridge University Press Cambridge UK 1988ISBN 978-0521341936
Sala O E Chapin III F S Armesto J J Berlow E Bloomeld J Dirzo R Huber-Sanwald E Huenneke L F Jackson R B Kinzig A Leemans R Lodge D MMooney H A Oesterheld M Po N L Sykes M T Walker B H Walker Mand Wall D H Global biodiversity scenarios for the year 2100 Science 287(5459)17701774 2000 doi101126science28754591770
Seto K C and Fragkias M Mangrove conversion and aquaculture development inVietnam A remote sensing-based approach for evaluating the Ramsar Conventionon Wetlands Global Environmental Change 17486500 2007 ISSN 09593780doi101016jgloenvcha200703001
Shimabukuro Y E Almeida-Filho R Kuplich T M and de Freitas R M Quantifyingoptical and SAR image relationships for tropical landscape features in the AmazocircniaInternational Journal of Remote Sensing 28(17)38313840 2007 ISSN 0143-1161doi10108001431160701236829
Stotz W When aquaculture restores and replaces an overshed stock Is the conservationof the species assured The case of the scallop Argopecten purpuratus in Northern ChileAquaculture International 8237247 2000 doi101023A1009215119051
Touque K A and Belton B Is aquaculture pro-poor Empirical evidence of im-pacts on sh consumption in Bangladesh World Development 64609620 2014doi101016jworlddev201406035
Turner W Rondinini C Pettorelli N Mora B Leidner A K Szantoi Z BuchananG Dech S Dwyer J Herold M Koh L P Leimgruber P Taubenboeck HWegmann M Wikelski M and Woodcock C Free and open-access satellite dataare key to biodiversity conservation Biological Conservation 182173176 2015 ISSN00063207 doi101016jbiocon201411048
US Geological Survey Product guide Landsat 8 Surface Reectance Code (LaSRC)product Version 42 URL httpslandsatusgsgovsitesdefaultfiles
documentslasrc_product_guidepdf
Valiela I Bowen J L and York J K Mangrove forests One of the worlds threat-ened major tropical environments BioScience 51(10)807 2001 ISSN 1525-3244doi1016410006-3568(2001)051[0807MFOOTW]20CO2
Wang S Tang D He F Fukuyo Y and Azanza R V Occurrences of harmful algalblooms (HABs) associated with ocean environments in the South China Sea Hydrobi-ologia 596(1)7993 2008 ISSN 0018-8158 doi101007s10750-007-9059-4
Wohlfart C Kuenzer C Chen C and Liu G Socialecological challenges in the YellowRiver basin (China) a review Environmental Earth Sciences 75(13)179 2016 ISSN1866-6280 doi101007s12665-016-5864-2
Woodcock C E Allen R Anderson M Belward A Bindschadler R Cohen WGao F Goward S N Helder D Helmer E Nemani R Oreopoulos L SchottJ Thenkabail P S Vermote E F Vogelmann J Wulder M A and Wynne RFree access to Landsat imagery Science (New York NY) 320(5879)1011 2008 ISSN1095-9203 doi101126science32058791011a
40
World Bank Group East Asias Changing Urban Landscape Measuring a Decade of Spatial
Growth The World Bank Washington 2015 ISBN 978-1-4648-0363-5 doi101596978-1-4648-0363-5
Wulder M A Masek J G Cohen W B Loveland T R and Woodcock C EOpening the archive How free data has enabled the science and monitoring promiseof Landsat Remote Sensing of Environment 122210 2012 ISSN 00344257doi101016jrse201201010
Xiao X Agusti S Lin F Li K Pan Y Yu Y Zheng Y Wu J and DuarteC M Nutrient removal from Chinese coastal waters by large-scale seaweed aquacultureScientic reports 716 2017 ISSN 2045-2322 doi101038srep46613
Xu C Sheng S Zhou W Cui L and Liu M Characterizing wetland change atlandscape scale in Jiangsu Province China Environmental monitoring and assessment179(1-4)279292 2011 ISSN 0167-6369 doi101007s10661-010-1735-6
Young N E Anderson R S Chignell S M Vorster A G Lawrence R and Evan-gelista P H A survival guide to Landsat preprocessing Ecology 98(4)920932 2017ISSN 0012-9658 doi101002ecy1730
Zhao M Derudder B and Huang J Polycentric development in Chinas mega-cityregions 2001-08 A comparison of the Yangtze and Pearl River Deltas Die Erde 148(1)113 2017 doi1012854erde-148-26
Zhou Q and Sun B Analysis of spatio-temporal pattern and driving force of land coverchange using multi-temporal remote sensing images Science China Technological Sci-
ences 53(S1)111119 2010 ISSN 1674-7321 doi101007s11431-010-3196-0
Zhu Z and Woodcock C E Object-based cloud and cloud shadow detection in Land-sat imagery Remote Sensing of Environment 1188394 2012 ISSN 00344257doi101016jrse201110028
41
Appendix
Software and software packages used for reading the spatial data processing it anddetermining aquaculture hotspots
bull ArcGIS 1051bull dplyr 074bull ggplot2 221bull gridExtra 23bull lemon 031bull plyr 184bull QGIS 2183bull R Studio 11383bull rgdal 124bull scales 041bull sp 123
42
FigureA14Largemaponthetem
poralpattern
sfortheYRD
43
FigureA15LargemaponthetemporalpatternsforthePRD
44
FigureA16Largemaponthetem
poralpattern
sfortheRRD
45
FigureA17LargemaponthetemporalpatternsfortheMRD
46
Figure A18 Water areas retrieved from the GSW data Both maps illustrate two parts of thebinary water mask from the YRD for 1984 which is used for the validation assessment based onthe GSW data It can be seen that the water areas are large and a separation between singleaquaculture ponds is not possible This results in a higher aquaculture area for the initial year1984 compared to the assessment based on Landsat SR data This might be the reason for thelower relative increase found for the analysis based on the GSW data
Figure A19 Natural waters turned into aquaculture in the PRD Especially the coastal regionsare very dynamic and aquaculture ponds have been installed in the sea
Figure A20 Natural waters turned into aquaculture in the RRD This example shows inlandwater bodies which have been turned into aquaculture ponds
- Legal Statement
- Table of Contents
- List of Figures
- List of Tables
- List of Acronyms
- Motivation and Background
-
- Anthropogenic LULC Change
- Earth Observation as a Powerful Tool to Reveal LULC Change
- Aquaculture as an Intensive LULC Change
-
- Analysing Spatio-temporal Patterns of Coastal Aquaculture Based on Three Decades of Satellite Data
-
- Introduction
- Study Area
- Materials and Methods
-
- Data
-
- Landsat Surface Reflectance Data
- Sentinel-1 Aquaculture Layer
- The Global Surface Water Data
-
- Assessment of Aquaculture Dynamics
- Temporal Patterns and Hotspots
- Accuracy Assessment
-
- Results
-
- Reference Aquaculture Layer
- Mapping of the Aquaculture Dynamics
- Quantification of Aquaculture Area
- Temporal Patterns and Hotspots
- Accuracy Assessment
-
- Discussion
-
- Increase in Aquaculture Area
- Dynamics and Hotspots of Aquaculture
- Potentials and Limitations of This Study
- Outlook
-
- References
- Appendix
-
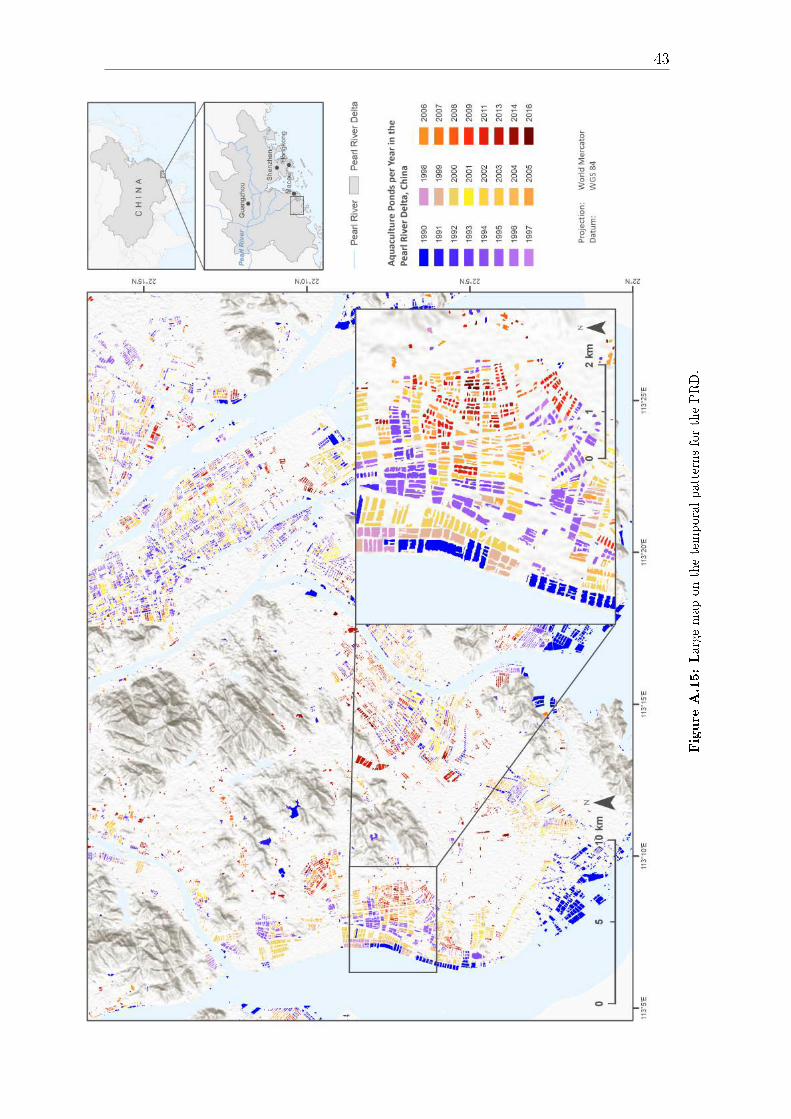