analysing spire fts spectra 1 day 4: spire rosalind hopwood
TRANSCRIPT
1
Analysing SPIRE FTS spectraDay 4: SPIRE
Rosalind Hopwood
Herschel Online Data Processing Workshop 19th June 2015 2
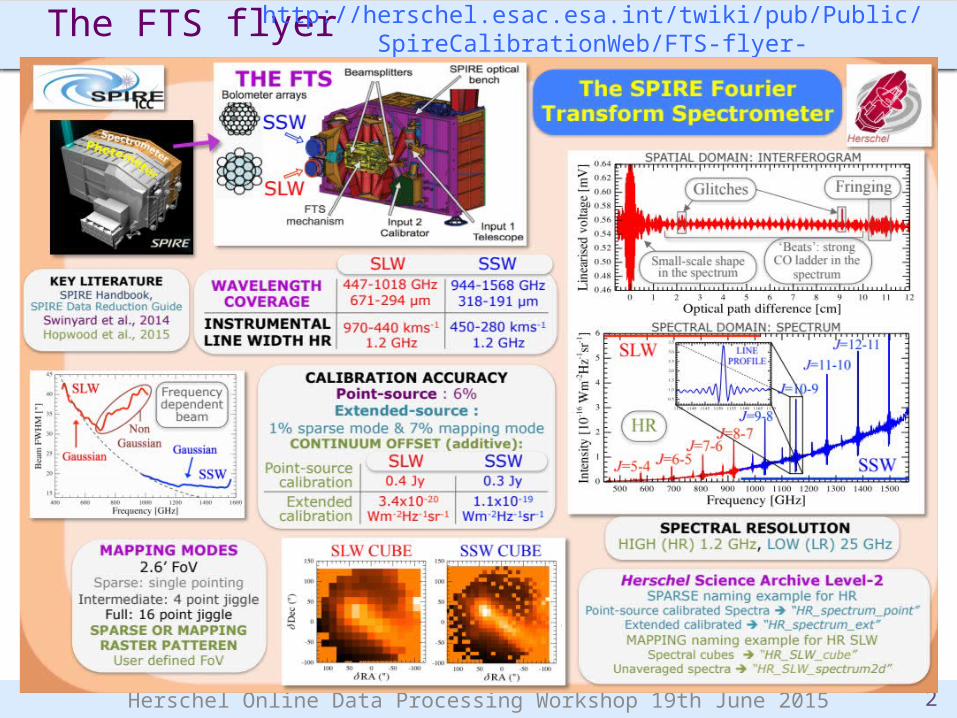
The FTS flyer http://herschel.esac.esa.int/twiki/pub/Public/SpireCalibrationWeb/FTS-flyer-landscape_v12_A4.pdf
Herschel Online Data Processing Workshop 19th June 2015
Analysing SPIRE FTS spectra
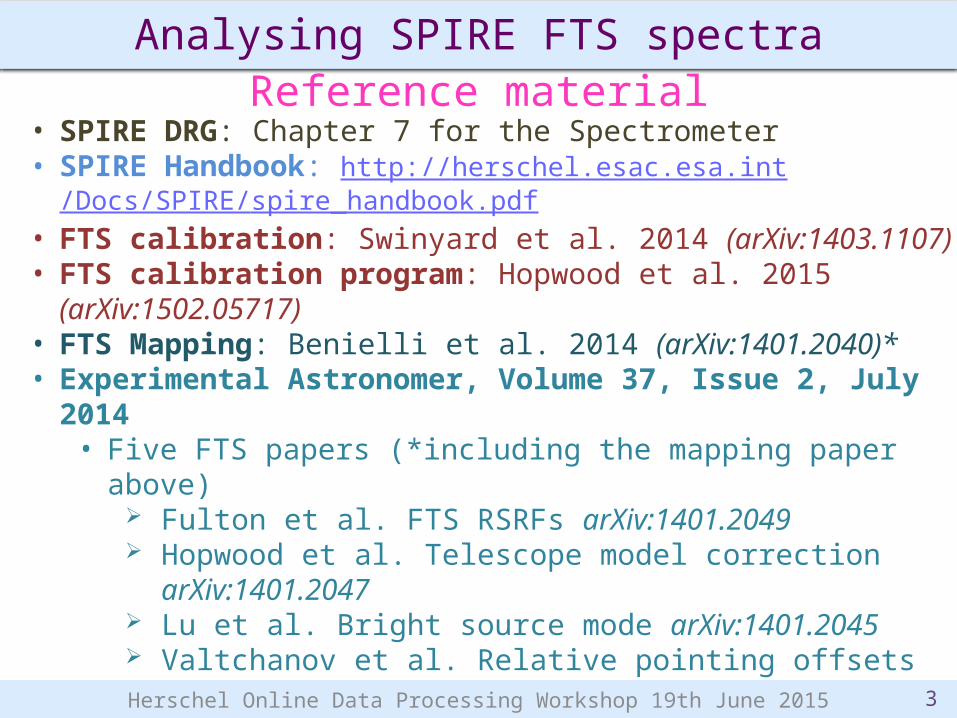
• SPIRE DRG: Chapter 7 for the Spectrometer• SPIRE Handbook: http://herschel.esac.esa.int/Docs/SPIRE/spire_handbook.pdf• FTS calibration: Swinyard et al. 2014 (arXiv:1403.1107)• FTS calibration program: Hopwood et al. 2015 (arXiv:1502.05717)• FTS Mapping: Benielli et al. 2014 (arXiv:1401.2040)*• Experimental Astronomer, Volume 37, Issue 2, July 2014
• Five FTS papers (*including the mapping paper above) Fulton et al. FTS RSRFs arXiv:1401.2049 Hopwood et al. Telescope model correction arXiv:1401.2047 Lu et al. Bright source mode arXiv:1401.2045 Valtchanov et al. Relative pointing offsets arXiv:1401.2043
• SECT: Wu et al. 2013 (arXiv:1306.5780)• Beam profile: Makiwa et al. 2013 (Applied Optics, Vol. 52, Issue 16, p. 3864-3875)• Pipeline: Fulton et al. 2010 (to be updated soon) (SPIE Conference Series,
2010)3
Reference material
Herschel Online Data Processing Workshop 19th June 2015 4
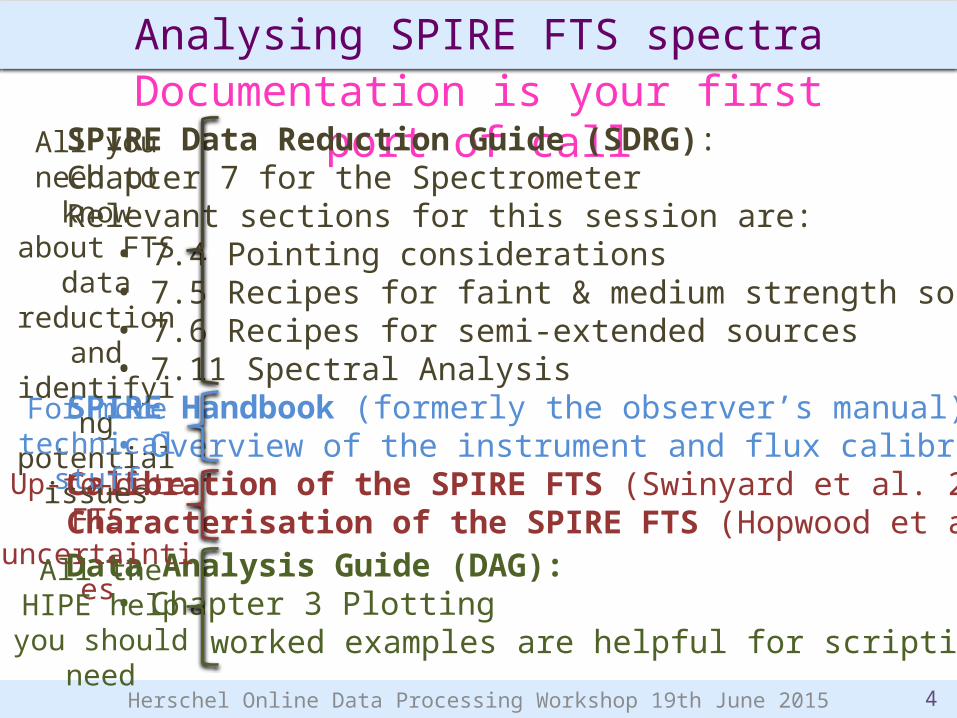
Documentation is your first port of callSPIRE Data Reduction Guide (SDRG): Chapter 7 for the SpectrometerRelevant sections for this session are:
• 7.4 Pointing considerations• 7.5 Recipes for faint & medium strength sources• 7.6 Recipes for semi-extended sources • 7.11 Spectral Analysis
SPIRE Handbook (formerly the observer’s manual)• Overview of the instrument and flux calibration
Calibration of the SPIRE FTS (Swinyard et al. 2014)Characterisation of the SPIRE FTS (Hopwood et al. 2015)Data Analysis Guide (DAG):
• Chapter 3 Plotting worked examples are helpful for scripting
Analysing SPIRE FTS spectra
All you need to know about
FTS data reduction and
identifying potential
issues
For more technical stuffUp-to-date FTS uncertainties
All the HIPE help you
should need
Herschel Online Data Processing Workshop 19th June 2015
• Examining FTS data for potential problems• Understanding where problems may originate• Correcting your data
• Background subtraction• Pointing offset: SECT• Partially extended: SECT• (Droopy SLWC3)
• SECT: a closer look• Spectral line fitting• Noise estimate• Comparison with the photometer
5
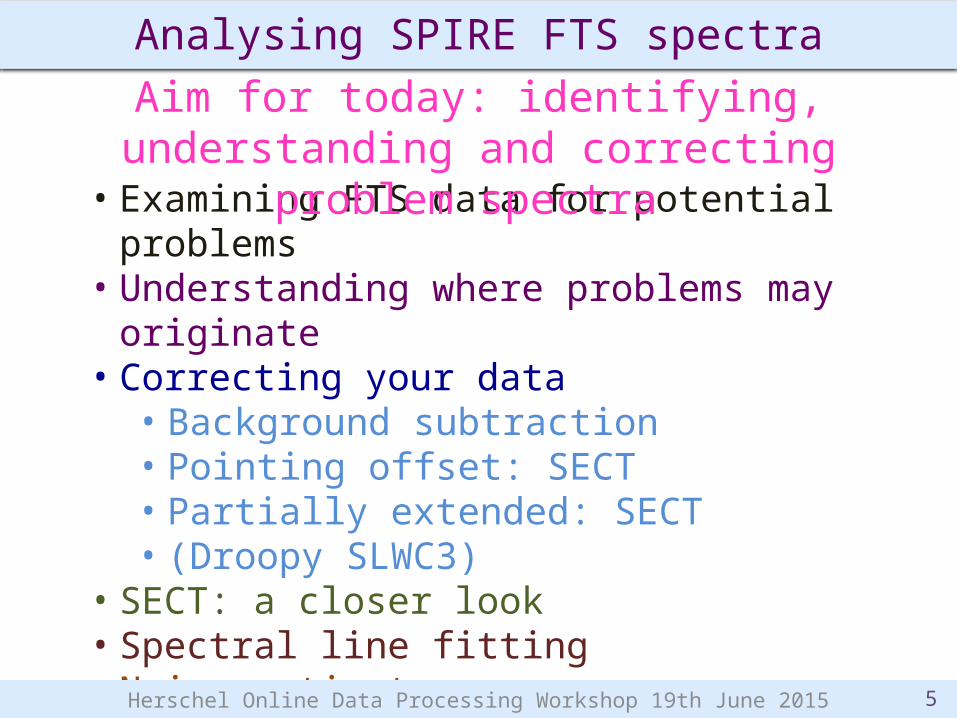
Aim for today: identifying, understanding and correcting problem spectra
Analysing SPIRE FTS spectra
Herschel Online Data Processing Workshop 19th June 2015
• Examining FTS data for potential problems• Understanding where problems may originate• Correcting your data
• Background subtraction• Pointing offset: SECT• Partially extended: SECT• (Droopy SLWC3)
• SECT: a closer look• Spectral line fitting• Noise estimate• Comparison with the photometer
6
Aim for today: identifying, understanding and correcting problem spectra
Analysing SPIRE FTS spectra
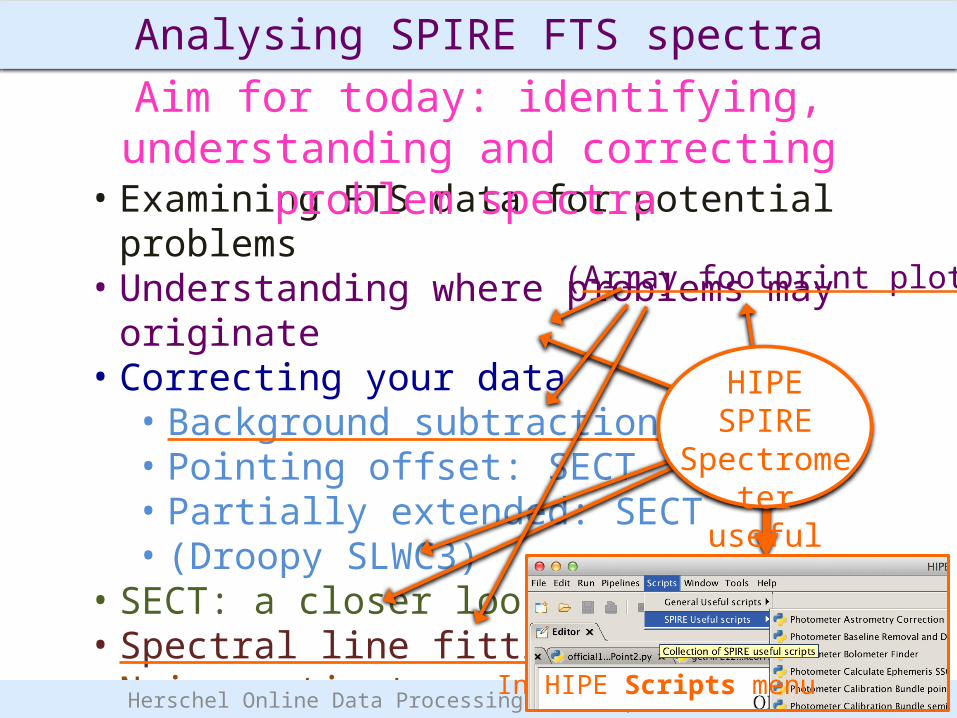
HIPE SPIRE Spectrometer useful scripts
In HIPE Scripts menu
(Array footprint plot)
Herschel Online Data Processing Workshop 19th June 2015 7
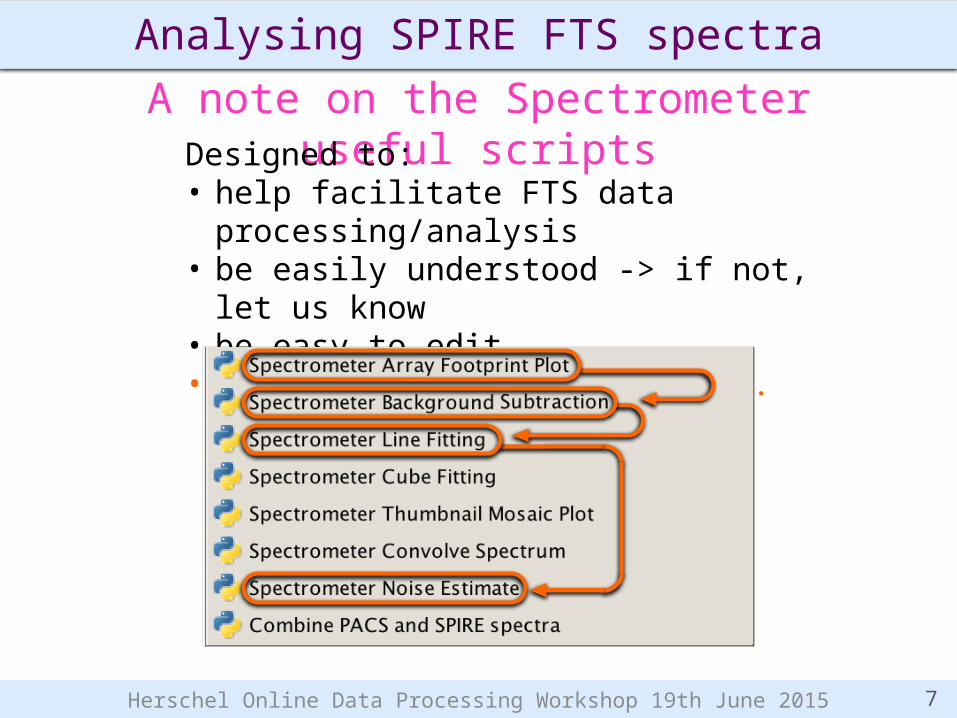
A note on the Spectrometer useful scriptsAnalysing SPIRE FTS spectra
Designed to:• help facilitate FTS data processing/analysis• be easily understood -> if not, let us know• be easy to edit• to compliment each other e.g.
Herschel Online Data Processing Workshop 19th June 2015 8
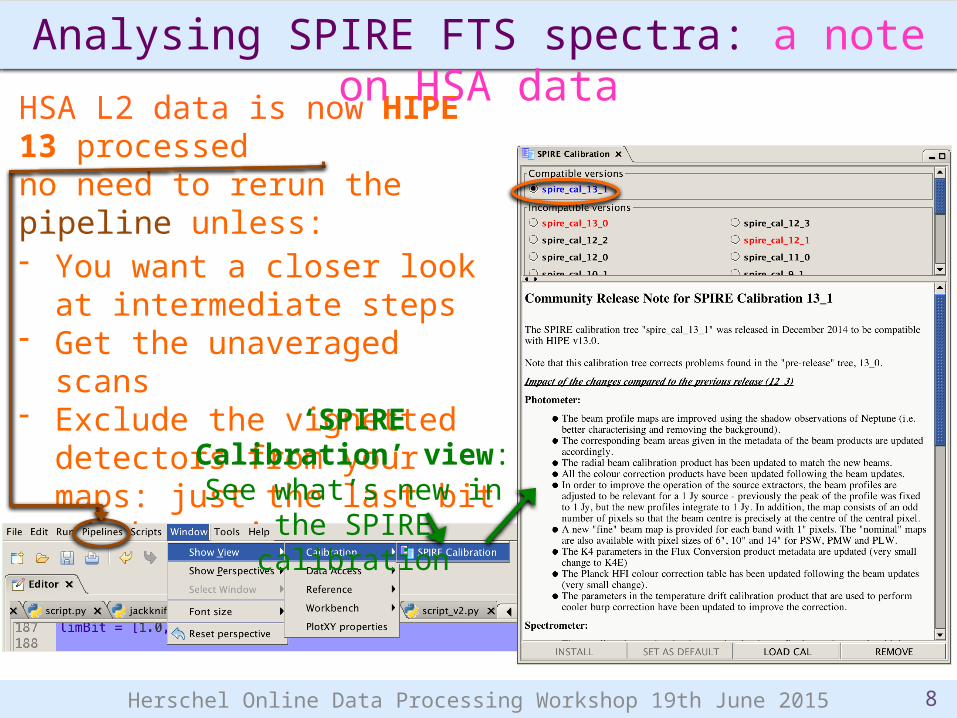
HSA L2 data is now HIPE 13 processedno need to rerun the pipeline unless:- You want a closer look at
intermediate steps- Get the unaveraged scans- Exclude the vignetted detectors
from your maps: just the last bit of the script
‘SPIRE Calibration’ view:See what’s new in the
SPIRE calibration
Analysing SPIRE FTS spectra: a note on HSA data

Herschel Online Data Processing Workshop 19th June 2015 9
HSA L2 data is now HIPE 13 processedno need to rerun the pipeline unless:- You want a closer look at
intermediate steps- Get the unaveraged scans- Exclude the vignetted detectors
from your maps: just the last bit of the script
‘SPIRE Calibration’ view:See what’s new in the
SPIRE calibration
Analysing SPIRE FTS spectra: a note on HSA data
Herschel Online Data Processing Workshop 19th June 2015 10
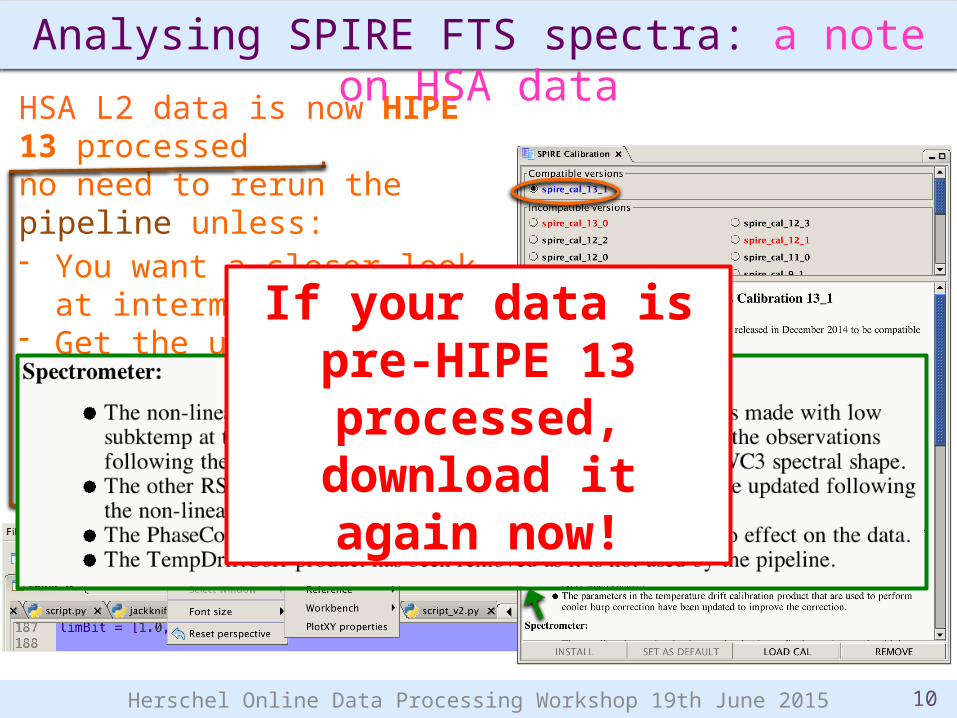
HSA L2 data is now HIPE 13 processedno need to rerun the pipeline unless:- You want a closer look at
intermediate steps- Get the unaveraged scans- Exclude the vignetted detectors
from your maps: just the last bit of the script
‘SPIRE Calibration’ view:See what’s new in the
SPIRE calibration
Analysing SPIRE FTS spectra: a note on HSA data
If your data is pre-HIPE 13 processed, download
it again now!
Herschel Online Data Processing Workshop 19th June 2015 11
Examining FTS dataDownloading an observation straight from the HSA into HIPE:
e.g. observation = getObservation(1342197486, useHsa=True)
Analysing SPIRE FTS spectra
Check out the Summary information
Herschel Online Data Processing Workshop 19th June 2015 12
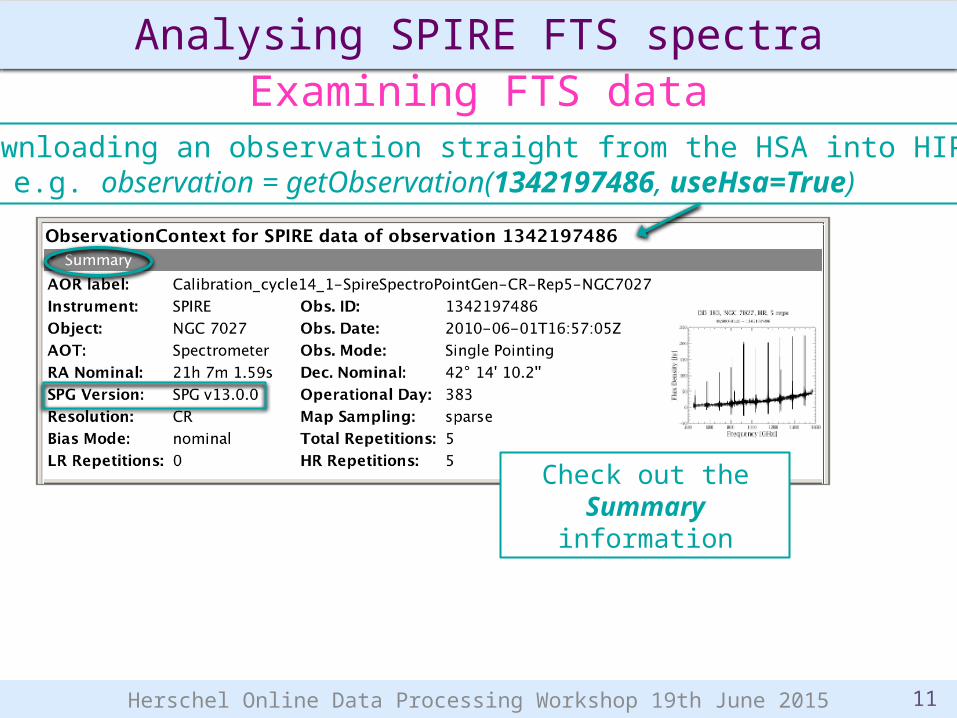
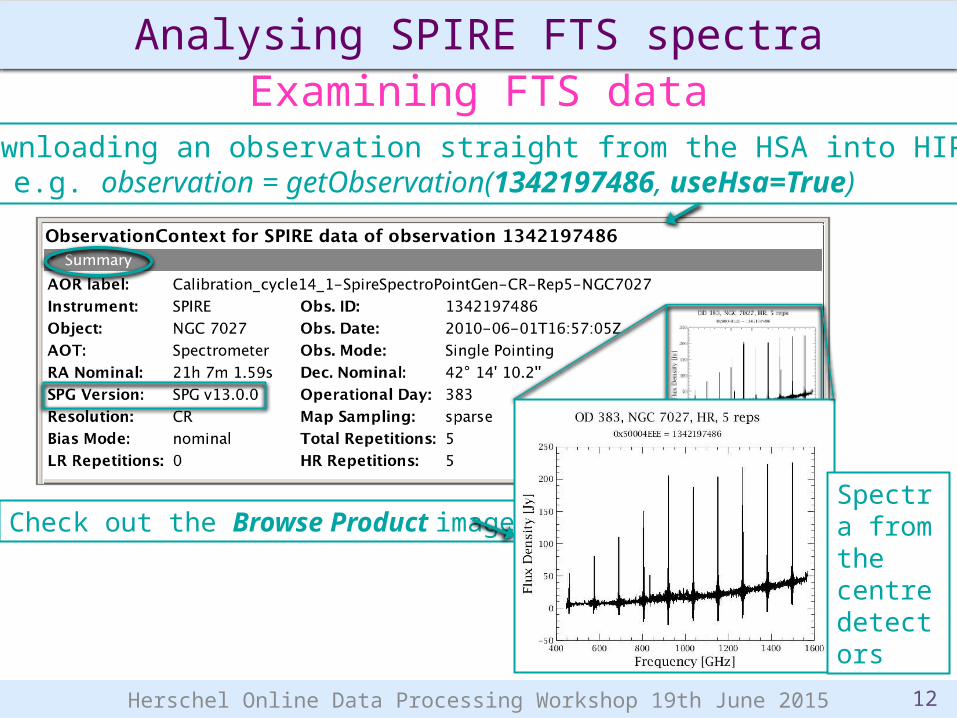
Examining FTS dataDownloading an observation straight from the HSA into HIPE:
e.g. observation = getObservation(1342197486, useHsa=True)
Analysing SPIRE FTS spectra
Check out the Browse Product imageSpectra from the centre detectors
Herschel Online Data Processing Workshop 19th June 2015 13
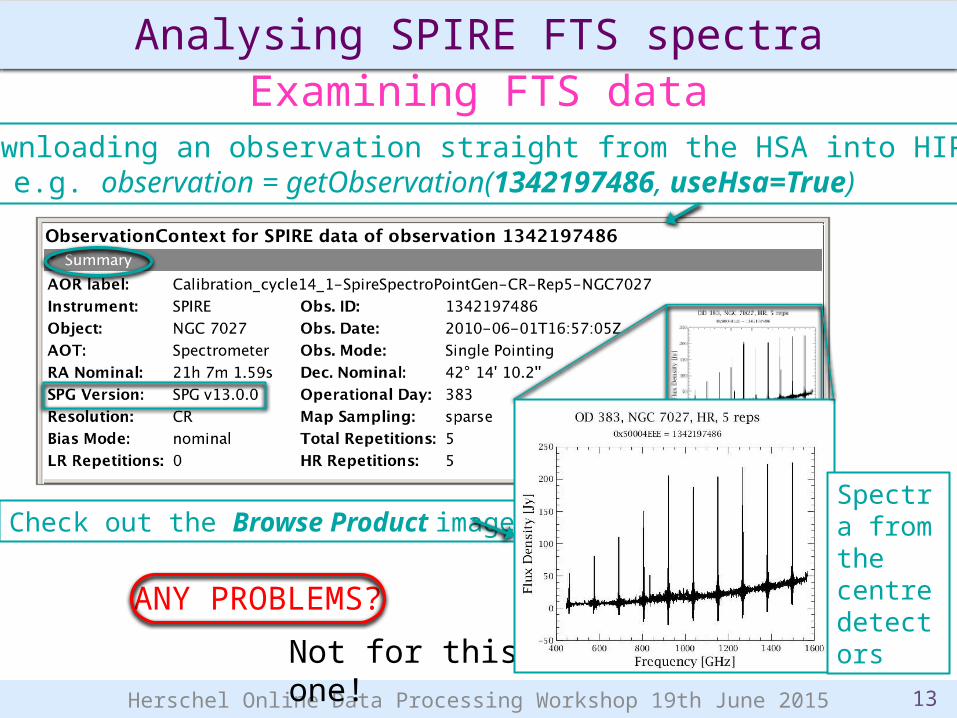
Examining FTS dataDownloading an observation straight from the HSA into HIPE:
e.g. observation = getObservation(1342197486, useHsa=True)
Analysing SPIRE FTS spectra
Check out the Browse Product image
ANY PROBLEMS?
Not for this one!
Spectra from the centre detectors
Herschel Online Data Processing Workshop 19th June 2015 14
See a problem -> documentation is your first port of callAnalysing SPIRE FTS spectra
SPIRE Data Reduction Guide (SDRG): Chapter 7 for the SpectrometerRelevant sections for this session are:
• 7.4 Pointing considerations• 7.5 Recipes for faint and medium strength sources• 7.6 Recipes for semi-extended sources • 7.11 Spectral Analysis
7.6.2 Does my spectrum need correcting?
Herschel Online Data Processing Workshop 19th June 2015 15
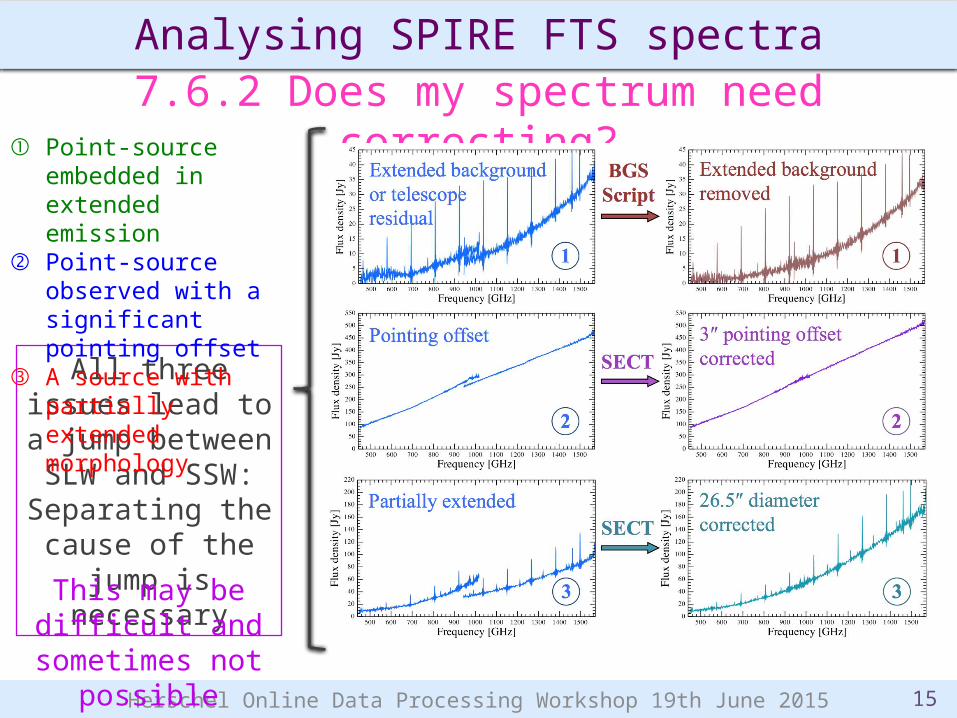
7.6.2 Does my spectrum need correcting?Analysing SPIRE FTS spectra
All three issues lead to a jump between
SLW and SSW:Separating the
cause of the jump is necessary
This may be difficult and sometimes not
possible
① Point-source embedded in extended emission
② Point-source observed with a significant pointing offset
③ A source with partially extended morphology
Herschel Online Data Processing Workshop 19th June 2015 16
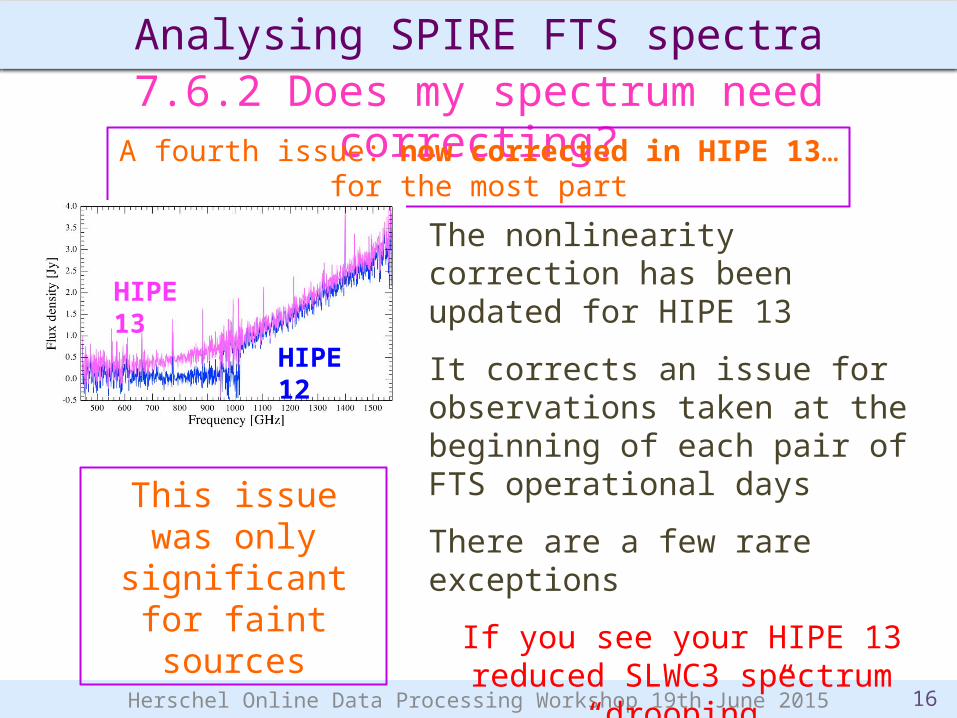
7.6.2 Does my spectrum need correcting?Analysing SPIRE FTS spectra
A fourth issue: now corrected in HIPE 13… for the most part
HIPE 12
HIPE 13
The nonlinearity correction has been updated for HIPE 13
It corrects an issue for observations taken at the beginning of each pair of FTS operational days
There are a few rare exceptions
If you see your HIPE 13 reduced SLWC3 spectrum “drooping”contact the helpdesk
This issue was only significant for faint
sources

Herschel Online Data Processing Workshop 19th June 2015 17
7.6.2 Does my spectrum need correcting?Analysing SPIRE FTS spectra
A fourth issue: now corrected in HIPE 13… for the most part
HIPE 12
HIPE 13
The nonlinearity correction has been updated for HIPE 13
It corrects an issue for observations taken at the beginning of each pair of FTS operational days
There are a few rare exceptions
If you see your HIPE 13 reduced SLWC3 spectrum “drooping”contact the helpdesk
This issue was only significant for faint
sources

Herschel Online Data Processing Workshop 19th June 2015 18
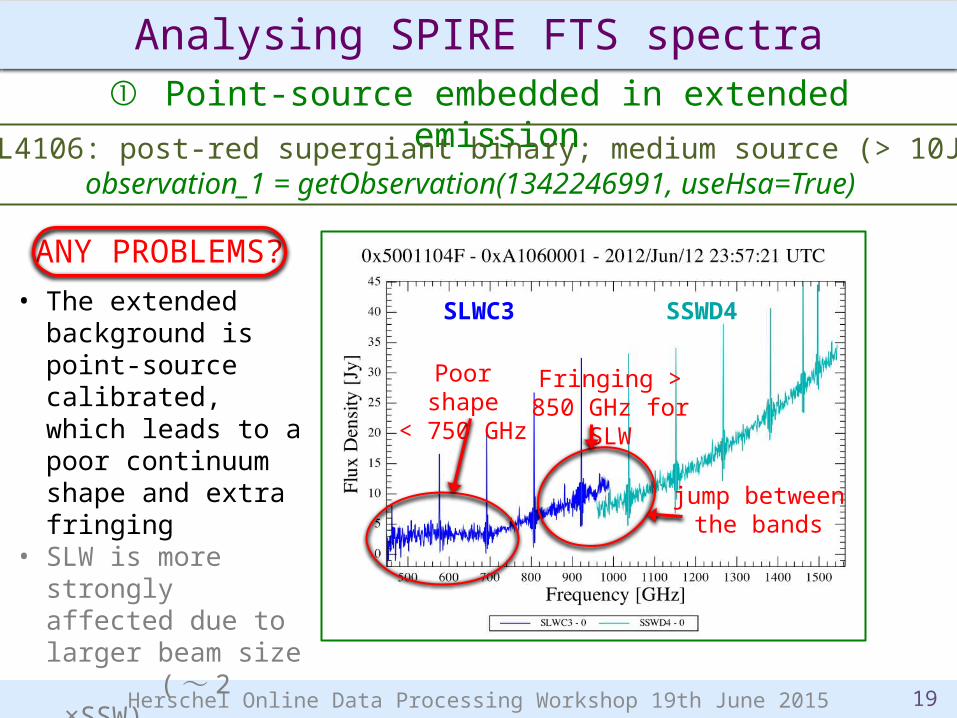
AFGL4106: post-red supergiant binary; medium source (> 10Jy)observation_1 = getObservation(1342246991, useHsa=True)
Analysing SPIRE FTS spectra
Check out the browse product image
ANY PROBLEMS?
① Point-source embedded in extended emission
Herschel Online Data Processing Workshop 19th June 2015 19
Analysing SPIRE FTS spectra① Point-source embedded in extended emission
Poor shape< 750 GHz
jump between the bands
SLWC3 SSWD4
Fringing > 850 GHz for SLW
• The extended background is point-source calibrated, which leads to a poor continuum shape and extra fringing
• SLW is more strongly affected due to larger beam size
(~ 2 ×SSW)• Large-scale continuum
shape can be corrected
AFGL4106: post-red supergiant binary; medium source (> 10Jy)observation_1 = getObservation(1342246991, useHsa=True)
ANY PROBLEMS?
Herschel Online Data Processing Workshop 19th June 2015 20
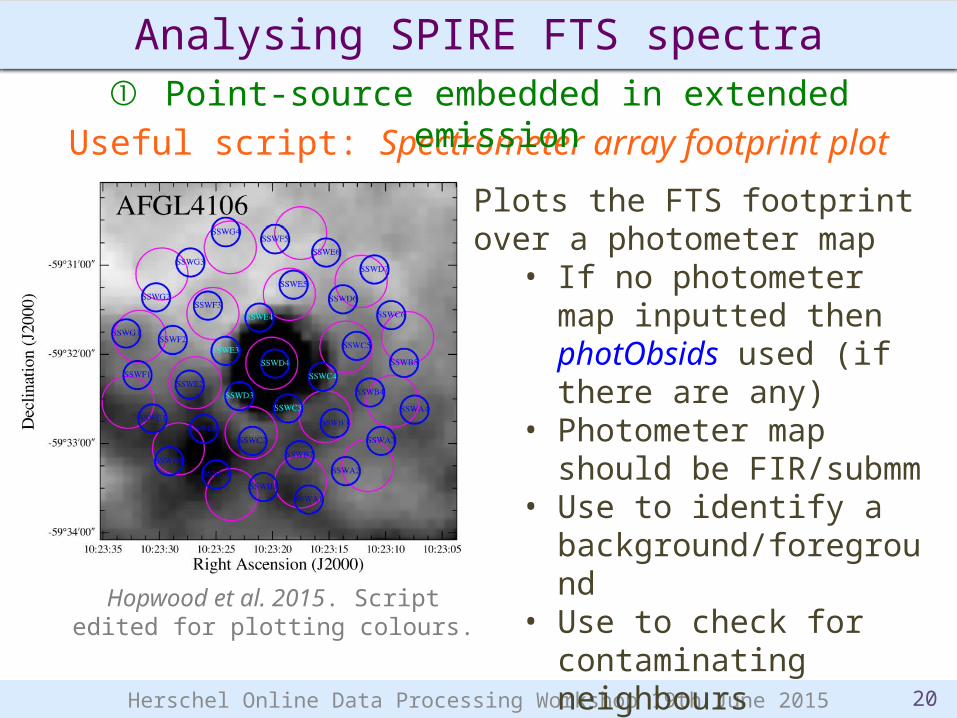
Useful script: Spectrometer array footprint plot
Hopwood et al. 2015. Script edited for plotting colours.
Analysing SPIRE FTS spectra① Point-source embedded in extended emission
Plots the FTS footprint over a photometer map
• If no photometer map inputted then photObsids used (if there are any)
• Photometer map should be FIR/submm
• Use to identify a background/foreground
• Use to check for contaminating neighbours
Herschel Online Data Processing Workshop 19th June 2015 21
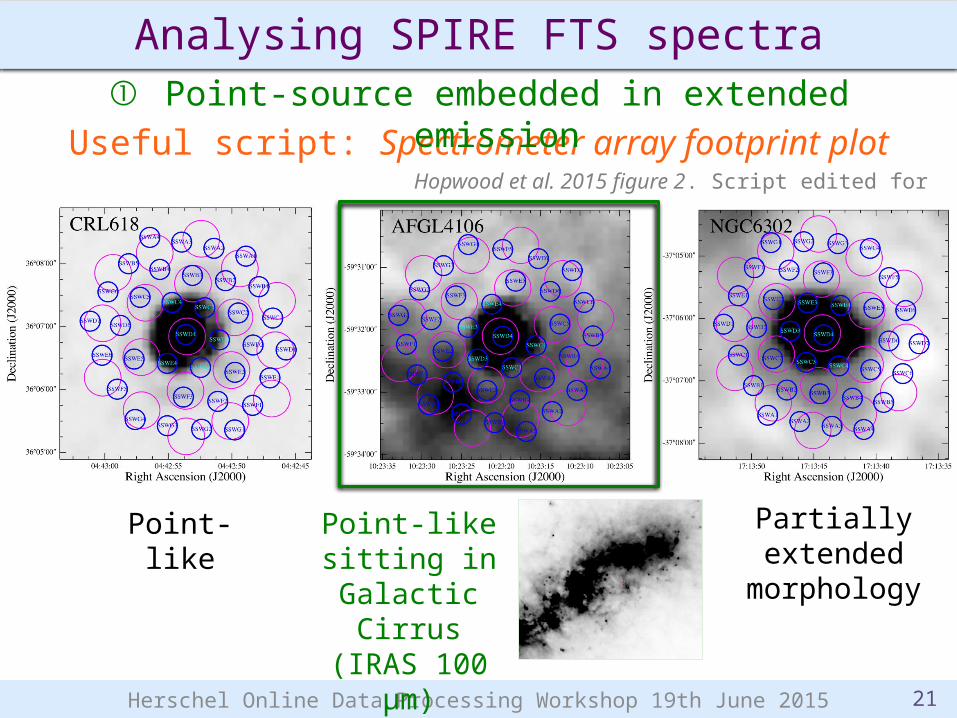
Useful script: Spectrometer array footprint plotHopwood et al. 2015 figure 2. Script edited for plotting colours.
Analysing SPIRE FTS spectra① Point-source embedded in extended emission
Point-like Partially extended morphology
Point-like sitting in Galactic
Cirrus(IRAS 100 µm)

Herschel Online Data Processing Workshop 19th June 2015 22
SLW 1st ring
SSW 2nd ring
Analysing SPIRE FTS spectra
MENTION LOST FLUX
① Point-source embedded in extended emissionUseful script: Spectrometer
background subtraction
AFGL4106

Herschel Online Data Processing Workshop 19th June 2015 23
SLW 1st ring
Analysing SPIRE FTS spectra① Point-source embedded in extended emission
SSW 2nd ring
Shape improved< 750 GHz
Jump between the
bands is corrected
Fringing > 850 GHz for SLW still there
Useful script: Spectrometer background subtraction
AFGL4106
Herschel Online Data Processing Workshop 19th June 2015 24
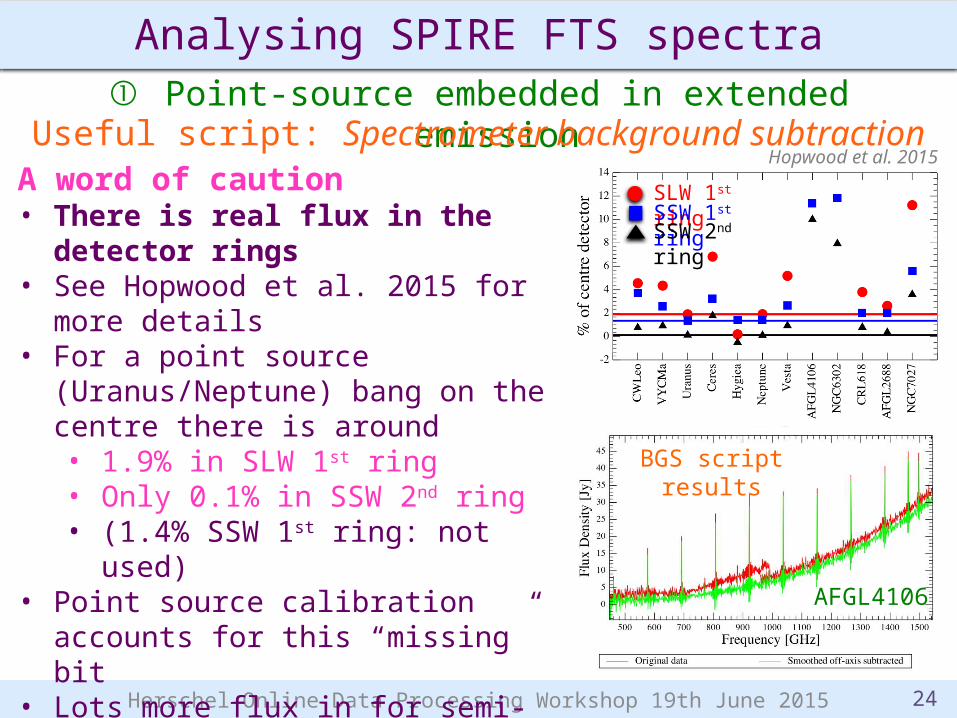
Analysing SPIRE FTS spectra① Point-source embedded in extended emission
Useful script: Spectrometer background subtractionA word of caution• There is real flux in the detector rings• See Hopwood et al. 2015 for more details• For a point source (Uranus/Neptune) bang
on the centre there is around• 1.9% in SLW 1st ring• Only 0.1% in SSW 2nd ring• (1.4% SSW 1st ring: not used)
• Point source calibration accounts for this “missing” bit
• Lots more flux in for semi-extended sources
• For AFGL4106 the results are worth the loss: fitting is easier
Hopwood et al. 2015
BGS script results
SLW 1st ringSSW 1st ringSSW 2nd ring
AFGL4106
Herschel Online Data Processing Workshop 19th June 2015 25
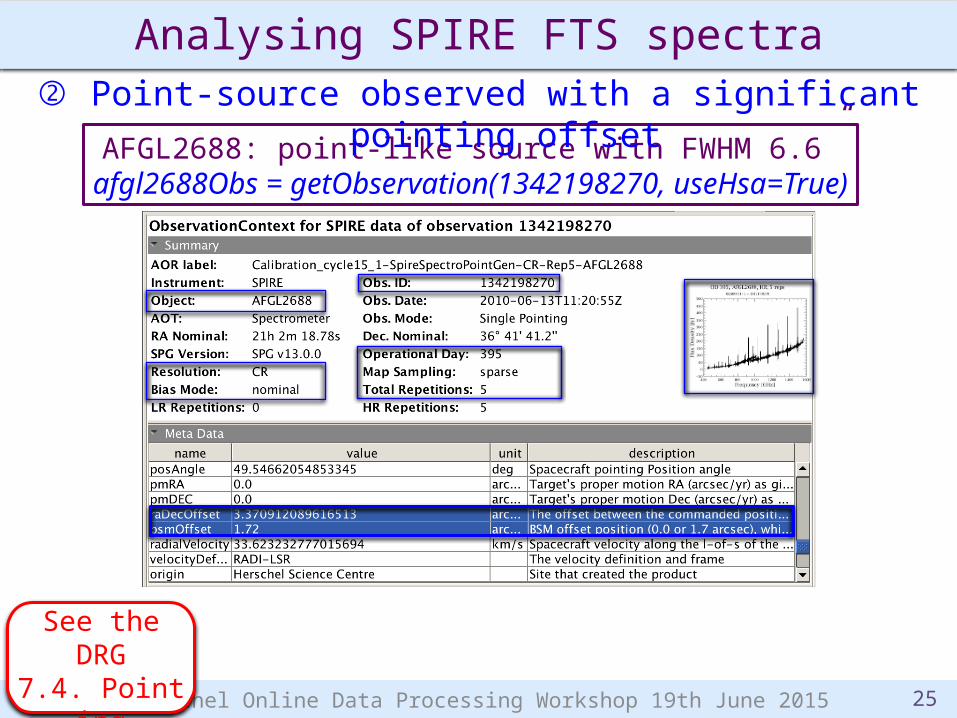
AFGL2688: point-like source with FWHM 6.6”afgl2688Obs = getObservation(1342198270, useHsa=True)
Analysing SPIRE FTS spectra② Point-source observed with a significant pointing offset
See the DRG 7.4. Pointing
Considerations

Herschel Online Data Processing Workshop 19th June 2015 26
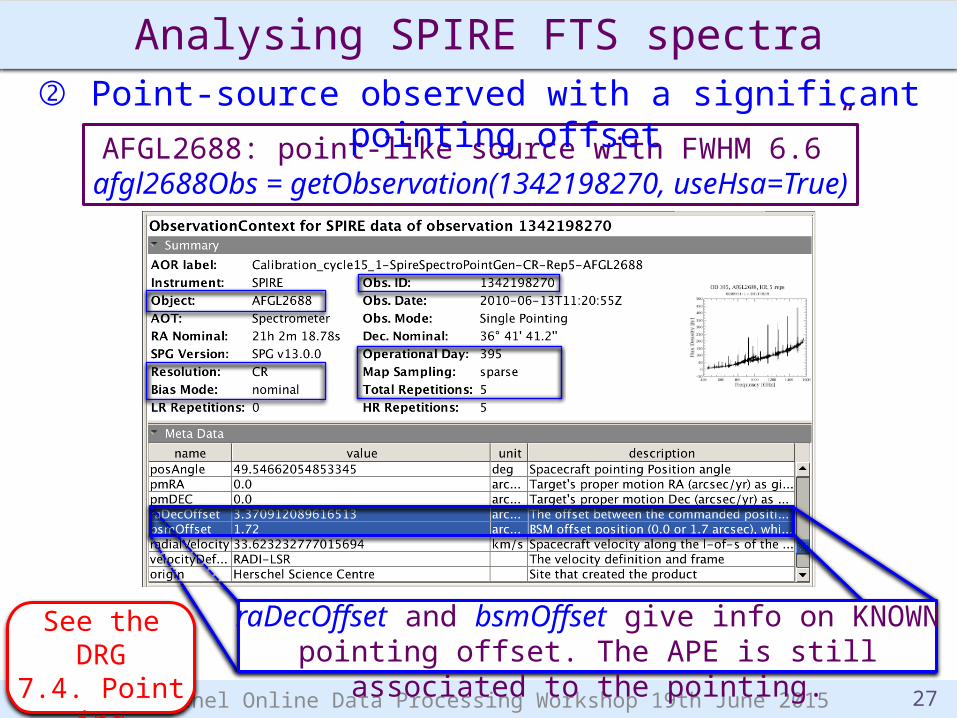
AFGL2688: point-like source with FWHM 6.6”afgl2688Obs = getObservation(1342198270, useHsa=True)
Analysing SPIRE FTS spectra② Point-source observed with a significant pointing offset
See the DRG 7.4. Pointing
Considerations
Jump between the bands
In this case the jump must be due to a pointing offset
Herschel Online Data Processing Workshop 19th June 2015 27
AFGL2688: point-like source with FWHM 6.6”afgl2688Obs = getObservation(1342198270, useHsa=True)
Analysing SPIRE FTS spectra② Point-source observed with a significant pointing offset
raDecOffset and bsmOffset give info on KNOWN pointing offset. The APE is still associated to the pointing.
See the DRG 7.4. Pointing
Considerations
Herschel Online Data Processing Workshop 19th June 2015 28
Analysing SPIRE FTS spectra② Point-source observed with a significant pointing offset
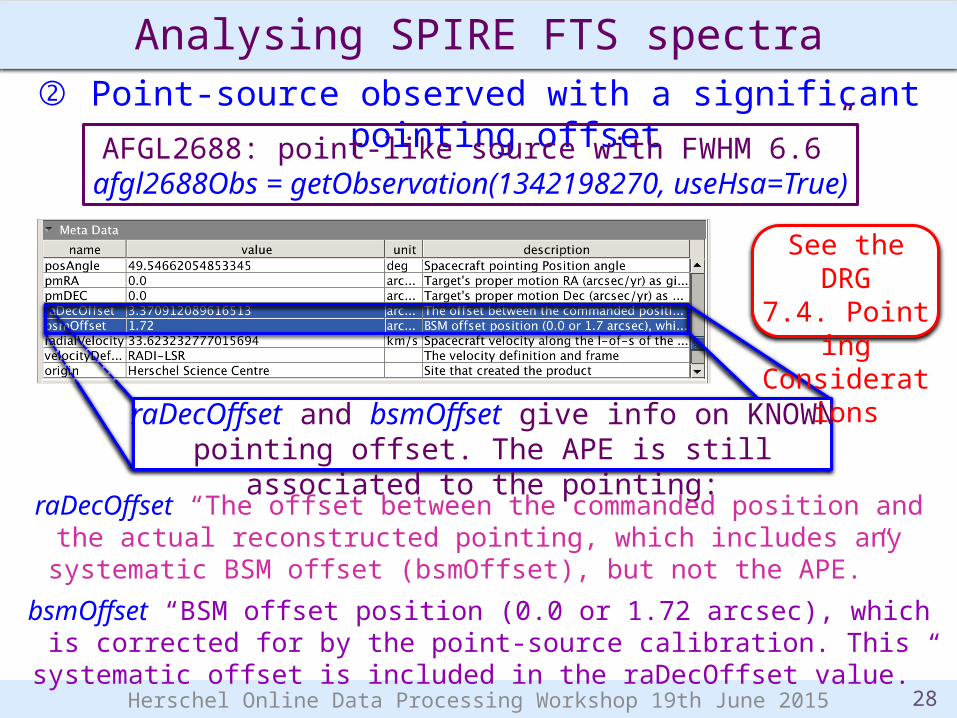
raDecOffset and bsmOffset give info on KNOWN pointing offset. The APE is still associated to the pointing:
See the DRG 7.4. Pointing
Considerations
raDecOffset “The offset between the commanded position and the actual reconstructed pointing, which includes any systematic BSM offset (bsmOffset), but
not the APE.”
bsmOffset “BSM offset position (0.0 or 1.72 arcsec), which is corrected for by the point-source calibration. This systematic offset is included in the raDecOffset value.”
AFGL2688: point-like source with FWHM 6.6”afgl2688Obs = getObservation(1342198270, useHsa=True)
Herschel Online Data Processing Workshop 19th June 2015 29
Analysing SPIRE FTS spectra② Point-source observed with a significant pointing offset
See the DRG 7.4. Pointing
Considerations
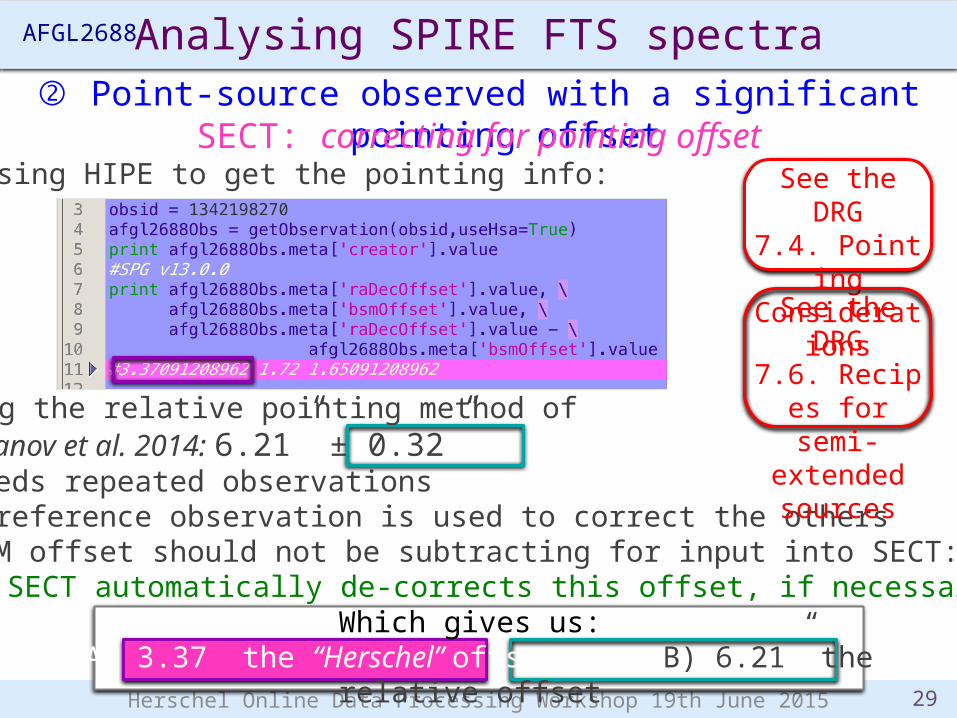
A. Using HIPE to get the pointing info:SECT: correcting for pointing offset
B. Using the relative pointing method of Valtchanov et al. 2014: 6.21” ± 0.32”
- Needs repeated observations- A reference observation is used to correct the others- BSM offset should not be subtracting for input into SECT:
- SECT automatically de-corrects this offset, if necessary
See the DRG 7.6. Recipes for semi-extended
sources
Which gives us: A) 3.37” the “Herschel” offset B) 6.21” the relative offset
AFGL2688
Herschel Online Data Processing Workshop 19th June 2015 30
Analysing SPIRE FTS spectra② Point-source observed with a significant pointing offset
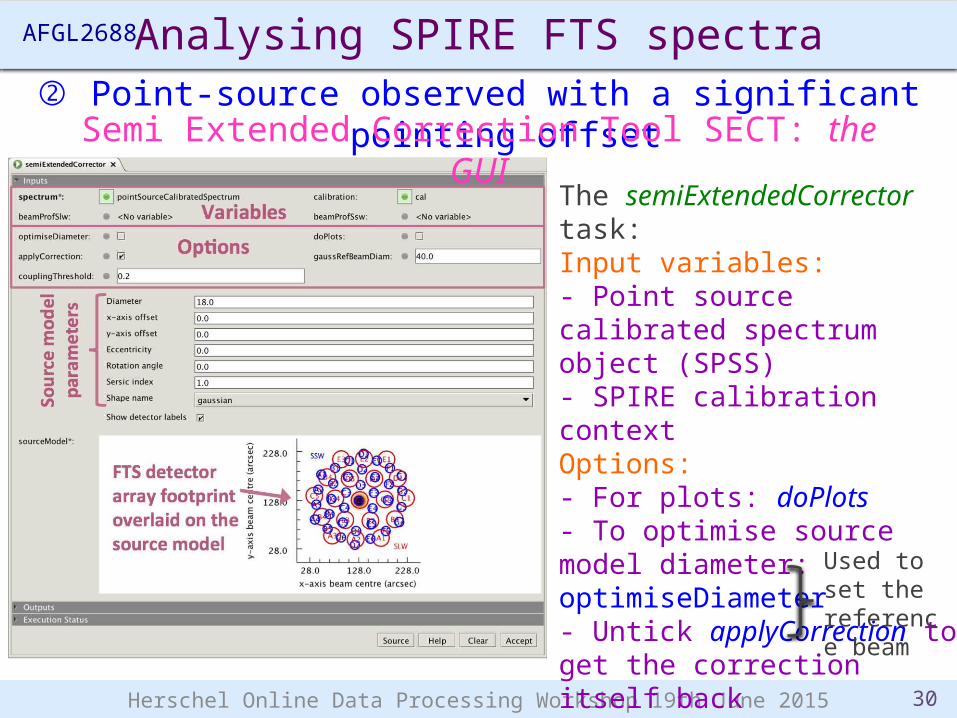
Semi Extended Correction Tool SECT: the GUI
The semiExtendedCorrector task:Input variables: - Point source calibrated spectrum object (SPSS)- SPIRE calibration contextOptions:- For plots: doPlots- To optimise source model diameter: optimiseDiameter- Untick applyCorrection to get the correction itself back
- gaussRefBeamDiam- couplingThreshold
Used to set the reference beam
AFGL2688
Herschel Online Data Processing Workshop 19th June 2015 31
Analysing SPIRE FTS spectra② Point-source observed with a significant pointing offset
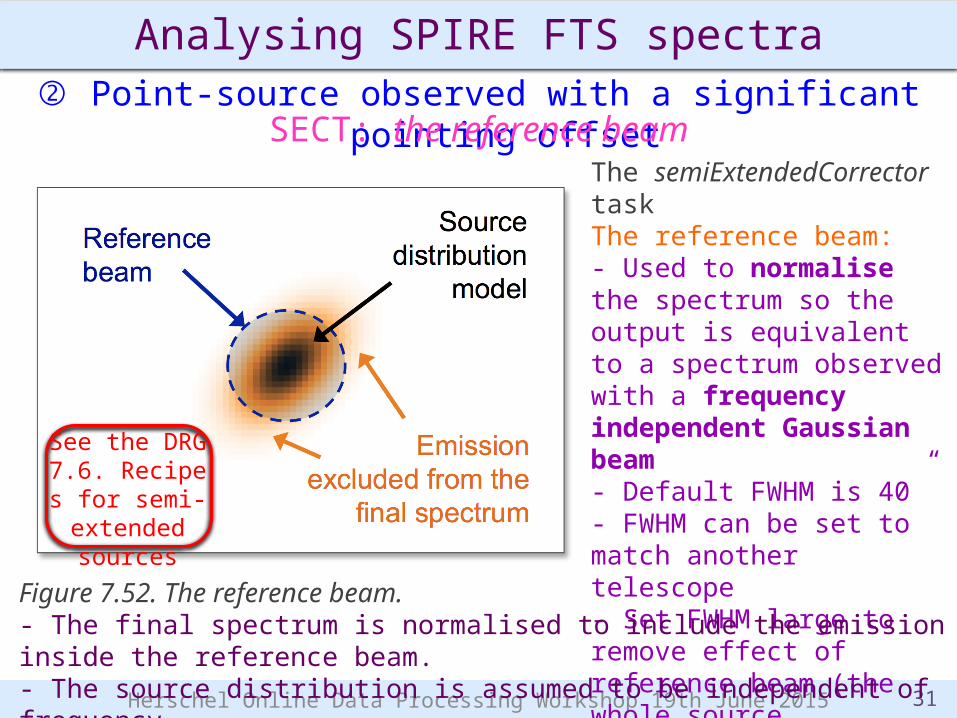
The semiExtendedCorrector taskThe reference beam: - Used to normalise the spectrum so the output is equivalent to a spectrum observed with a frequency independent Gaussian beam- Default FWHM is 40”- FWHM can be set to match another telescope- Set FWHM large to remove effect of reference beam (the whole source distribution is within the beamFigure 7.52. The reference beam.
- The final spectrum is normalised to include the emission inside the reference beam.- The source distribution is assumed to be independent of frequency.
SECT: the reference beam
See the DRG 7.6. Recipes for semi-extended
sources
Herschel Online Data Processing Workshop 19th June 2015 32
Analysing SPIRE FTS spectra② Point-source observed with a significant pointing offset
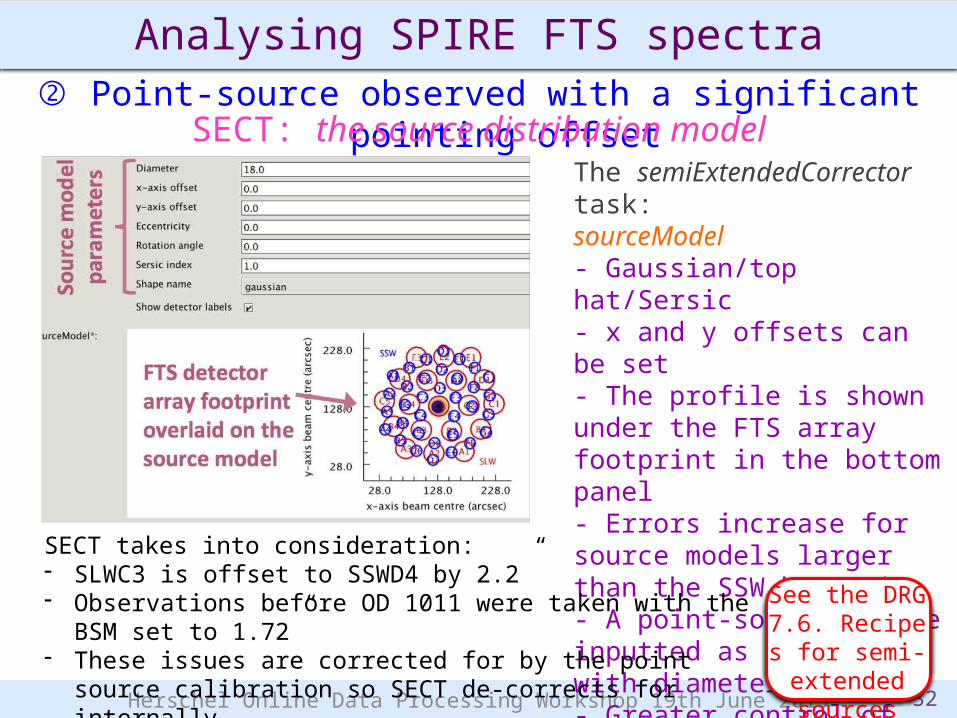
The semiExtendedCorrector task:sourceModel - Gaussian/top hat/Sersic- x and y offsets can be set- The profile is shown under the FTS array footprint in the bottom panel- Errors increase for source models larger than the SSW beam size- A point-source can be inputted as a Gaussian with diameter 0.01”- Greater control of SECT can be achieved with a script
SECT: the source distribution model
SECT takes into consideration:- SLWC3 is offset to SSWD4 by 2.2”- Observations before OD 1011 were taken with the BSM set to 1.72”- These issues are corrected for by the point source calibration so SECT
de-corrects for internally
See the DRG 7.6. Recipes for semi-extended
sources
Herschel Online Data Processing Workshop 19th June 2015 33
Analysing SPIRE FTS spectra② Point-source observed with a significant pointing offset
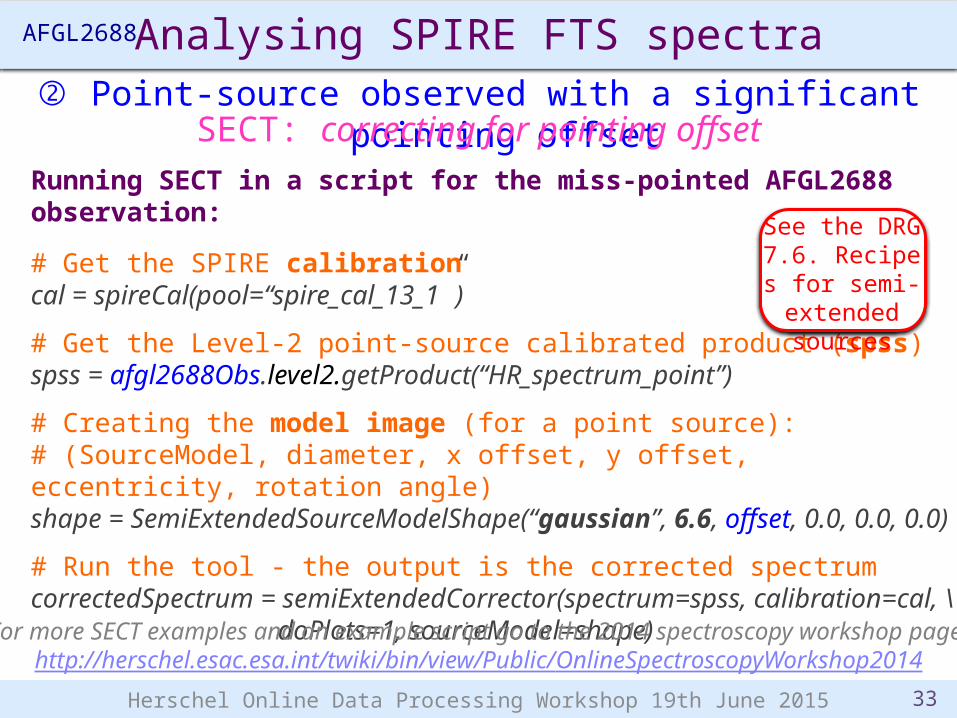
Running SECT in a script for the miss-pointed AFGL2688 observation:
# Get the SPIRE calibrationcal = spireCal(pool=“spire_cal_13_1”)
# Get the Level-2 point-source calibrated product (spss)spss = afgl2688Obs.level2.getProduct(“HR_spectrum_point”)
# Creating the model image (for a point source):# (SourceModel, diameter, x offset, y offset, eccentricity, rotation angle)shape = SemiExtendedSourceModelShape(“gaussian”, 6.6, offset, 0.0, 0.0, 0.0)
# Run the tool - the output is the corrected spectrumcorrectedSpectrum = semiExtendedCorrector(spectrum=spss, calibration=cal, \ doPlots=1, sourceModel=shape)
SECT: correcting for pointing offset
See the DRG 7.6. Recipes for semi-extended
sources
AFGL2688
For more SECT examples and an example script go to the 2014 spectroscopy workshop page:http://herschel.esac.esa.int/twiki/bin/view/Public/OnlineSpectroscopyWorkshop2014
Herschel Online Data Processing Workshop 19th June 2015 34
Analysing SPIRE FTS spectra② Point-source observed with a significant pointing offset
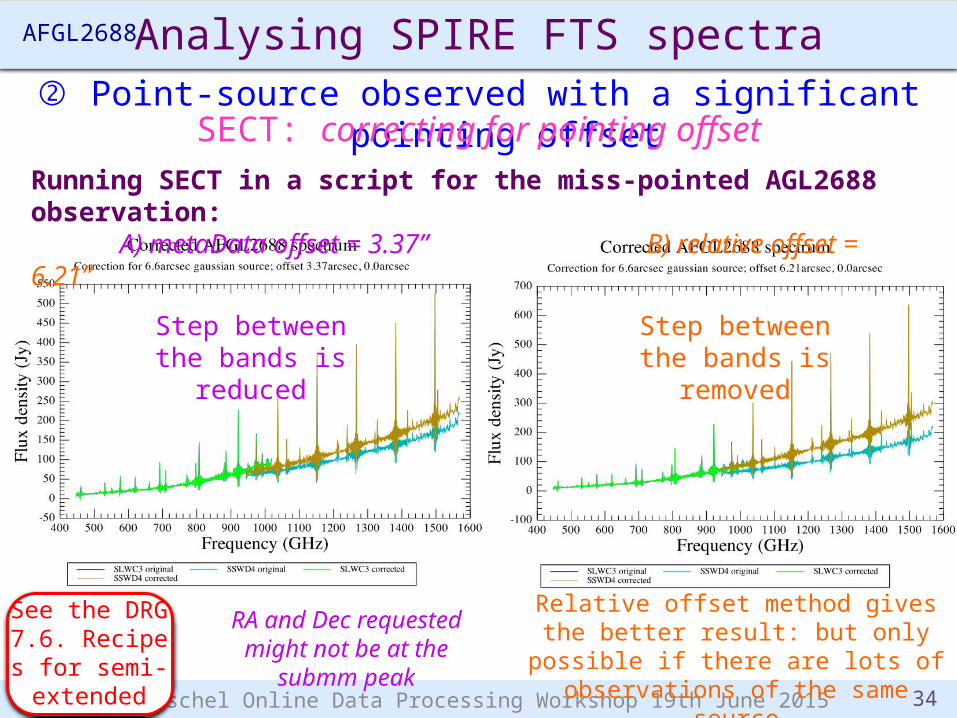
SECT: correcting for pointing offsetRunning SECT in a script for the miss-pointed AGL2688 observation:
A) metaData offset = 3.37” B) relative offset = 6.21”
See the DRG 7.6. Recipes for semi-extended
sources
Relative offset method gives the better result: but only possible if there are lots of
observations of the same source
Step between the bands is reduced
Step between the bands is removed
AFGL2688
RA and Dec requested might not be at the submm peak
Herschel Online Data Processing Workshop 19th June 2015 35
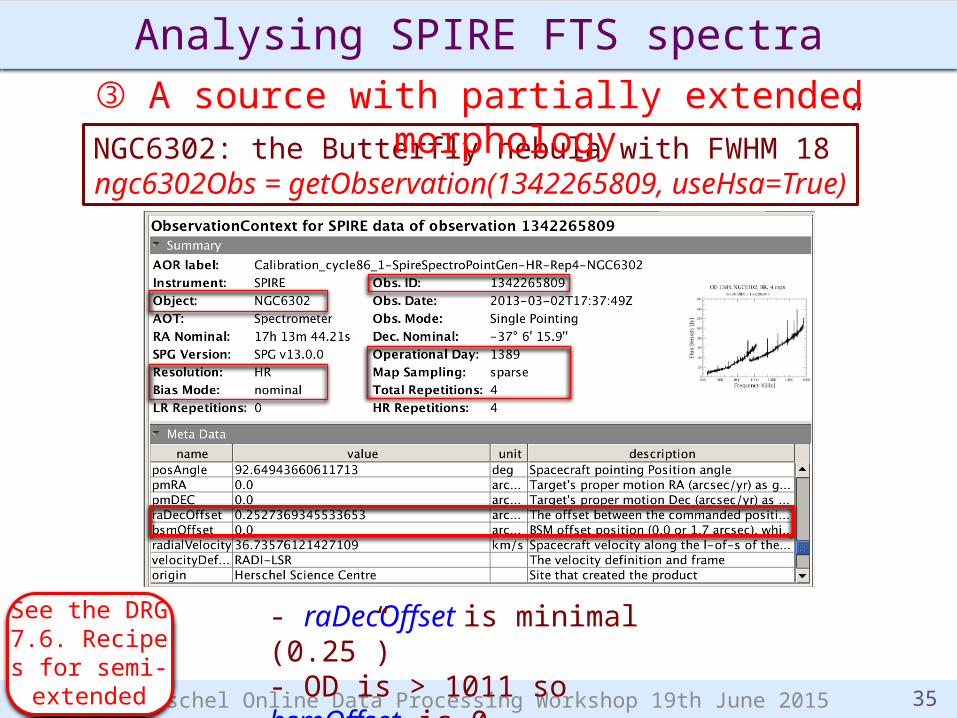
NGC6302: the Butterfly nebula with FWHM 18”ngc6302Obs = getObservation(1342265809, useHsa=True)
Analysing SPIRE FTS spectra③ A source with partially extended morphology
- raDecOffset is minimal (0.25”)- OD is > 1011 so bsmOffset is 0
See the DRG 7.6. Recipes for semi-extended
sources
Herschel Online Data Processing Workshop 19th June 2015 36
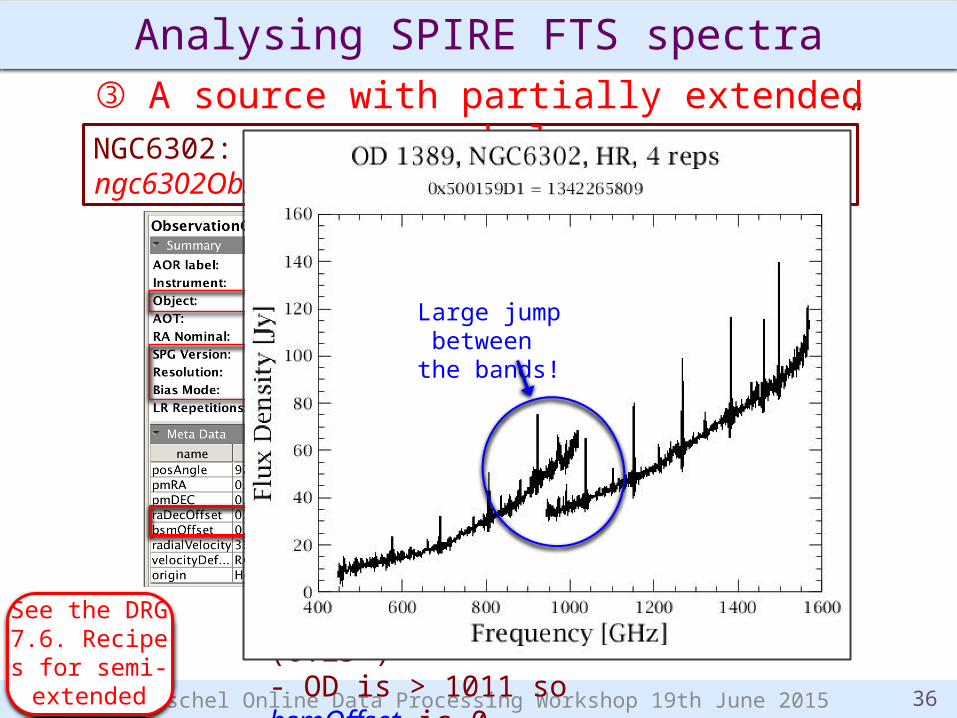
NGC6302: the Butterfly nebula with FWHM 18”ngc6302Obs = getObservation(1342265809, useHsa=True)
Analysing SPIRE FTS spectra③ A source with partially extended morphology
- raDecOffset is minimal (0.25”)- OD is > 1011 so bsmOffset is 0
See the DRG 7.6. Recipes for semi-extended
sources
Large jump between the bands!
Herschel Online Data Processing Workshop 19th June 2015 37
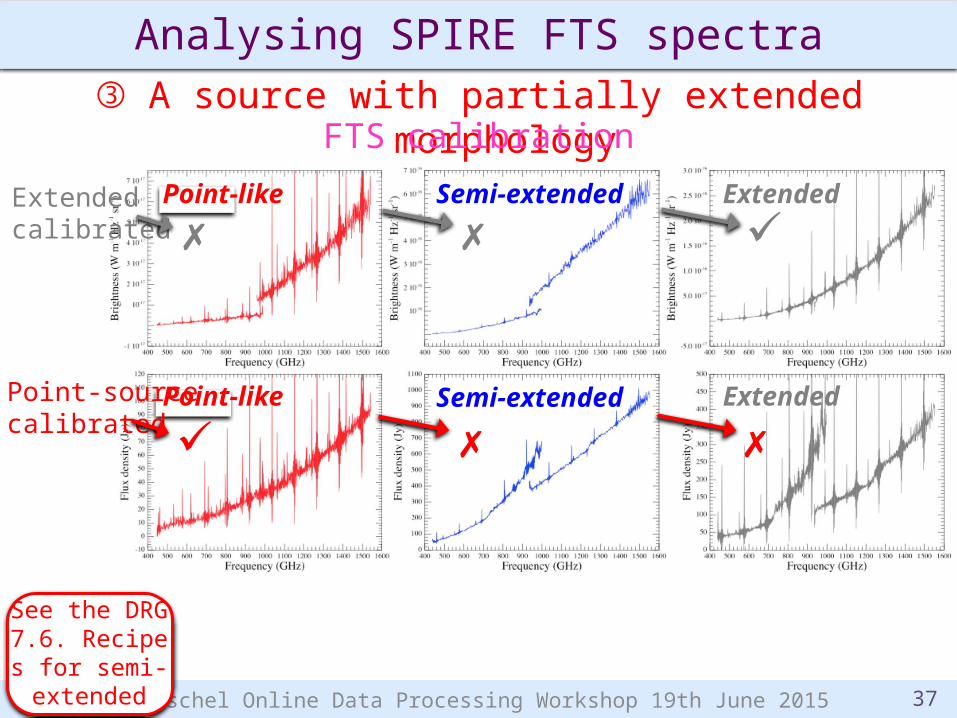
Analysing SPIRE FTS spectra③ A source with partially extended morphology
FTS calibration
Extended calibrated
Point-source calibrated ✓
✓✗✗
✗✗
Semi-extended ExtendedPoint-like
Semi-extended ExtendedPoint-like
See the DRG 7.6. Recipes for semi-extended
sources

Herschel Online Data Processing Workshop 19th June 2015 38
Analysing SPIRE FTS spectra③ A source with partially extended morphology
FTS calibration
Extended calibrated
Point-source calibrated ✓
✓✗✗
✗✗
Semi-extended ExtendedPoint-like
Semi-extended ExtendedPoint-like
See the DRG 7.6. Recipes for semi-extended
sources
NGC6302
Point-source calibrated spectra for a semi-extended source
Herschel Online Data Processing Workshop 19th June 2015 39
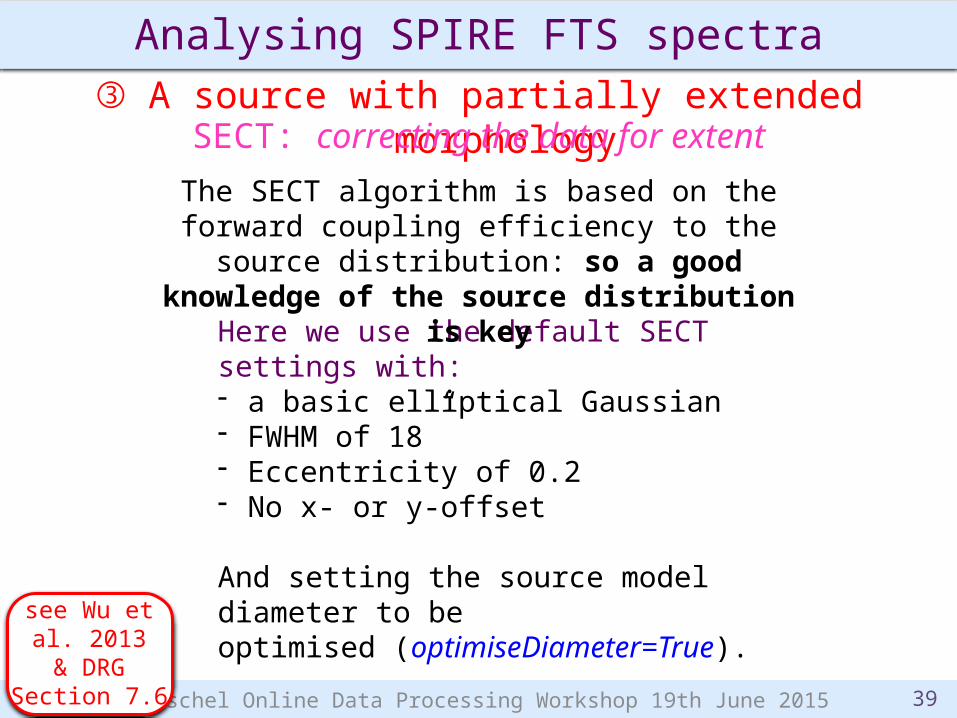
Here we use the default SECT settings with:- a basic elliptical Gaussian- FWHM of 18”- Eccentricity of 0.2- No x- or y-offset
And setting the source model diameter to be optimised (optimiseDiameter=True).
Analysing SPIRE FTS spectra③ A source with partially extended morphology
see Wu et al. 2013
& DRG Section 7.6
SECT: correcting the data for extent
The SECT algorithm is based on the forward coupling efficiency to the source distribution: so a good
knowledge of the source distribution is key

Herschel Online Data Processing Workshop 19th June 2015 40
Analysing SPIRE FTS spectra③ A source with partially extended morphology
see Wu et al. 2013
& DRG Section 7.6
SECT: the plots
if applyCorrection = 0 the correction is outputted (instead of the corrected data)
SECT plots the correction applied
NGC6302
Herschel Online Data Processing Workshop 19th June 2015 41
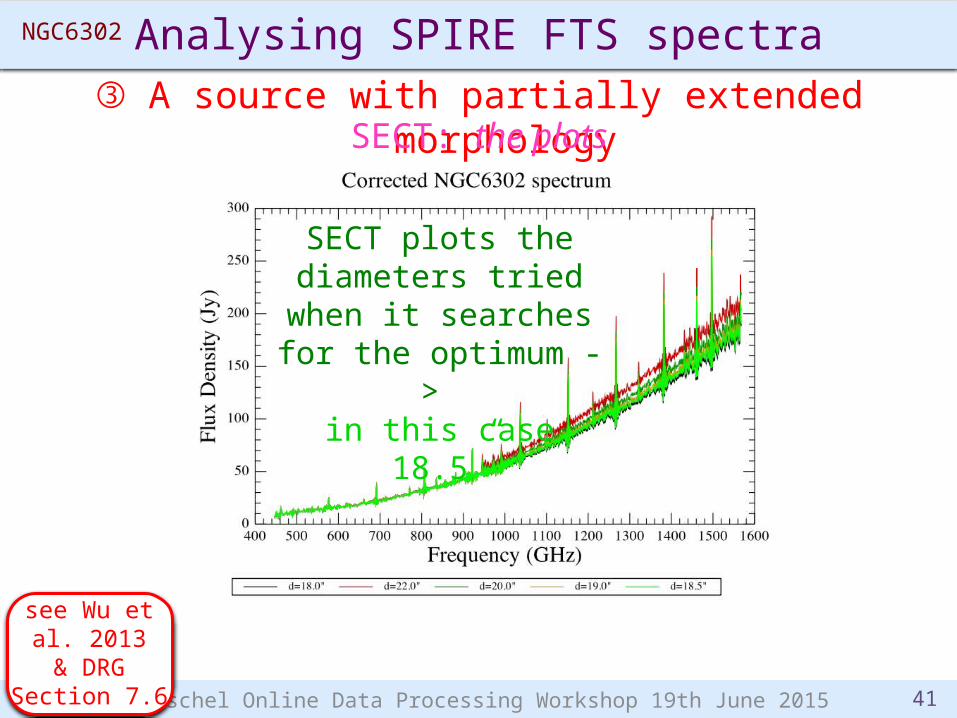
Analysing SPIRE FTS spectra③ A source with partially extended morphology
see Wu et al. 2013
& DRG Section 7.6
SECT: the plots
NGC6302
SECT plots the diameters tried when it searches for
the optimum -> in this case 18.5”
Herschel Online Data Processing Workshop 19th June 2015 42
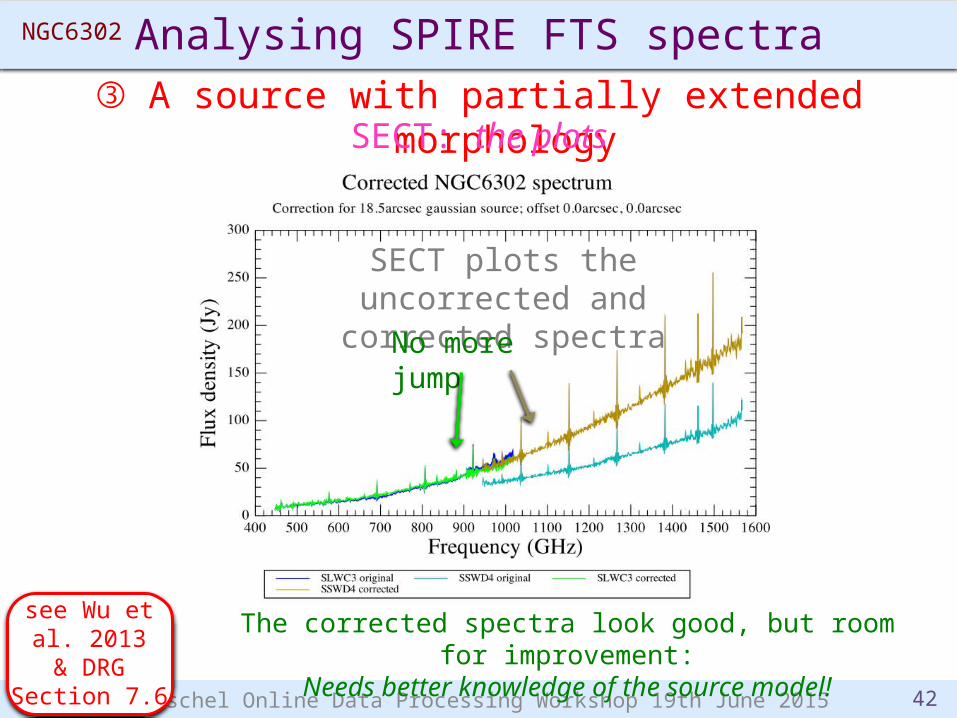
Analysing SPIRE FTS spectra③ A source with partially extended morphology
see Wu et al. 2013
& DRG Section 7.6
SECT: the plots
SECT plots the uncorrected and corrected spectra
NGC6302
No more jump
The corrected spectra look good, but room for improvement:Needs better knowledge of the source model!
Herschel Online Data Processing Workshop 19th June 2015 43
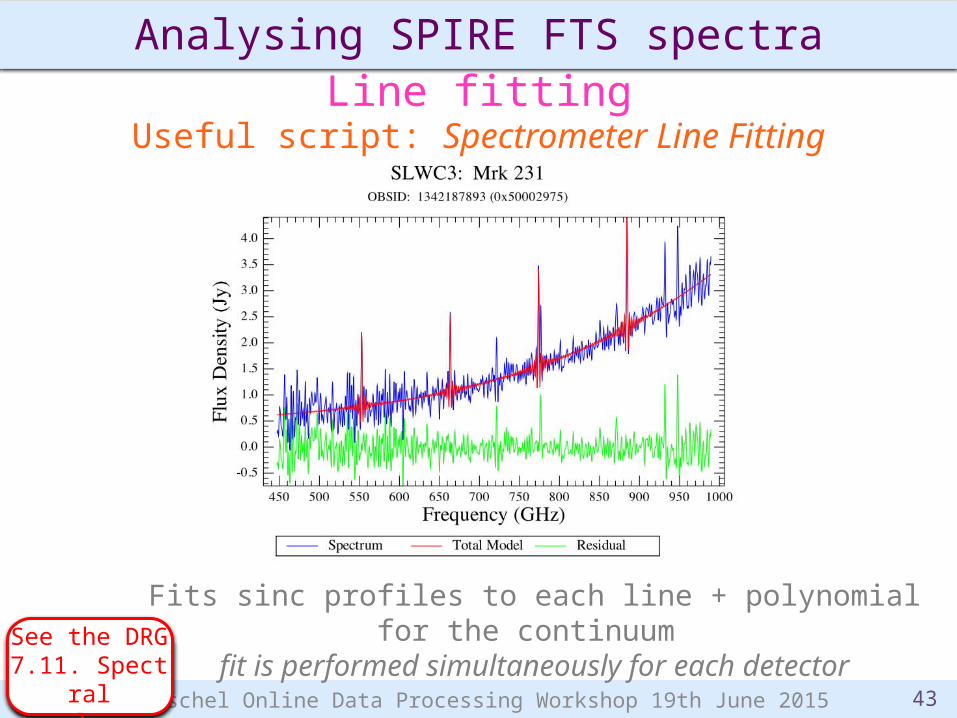
Fits sinc profiles to each line + polynomial for the continuum fit is performed simultaneously for each detector
Analysing SPIRE FTS spectraLine fitting
See the DRG 7.11. Spectral
analysis
Useful script: Spectrometer Line Fitting
Herschel Online Data Processing Workshop 19th June 2015 44
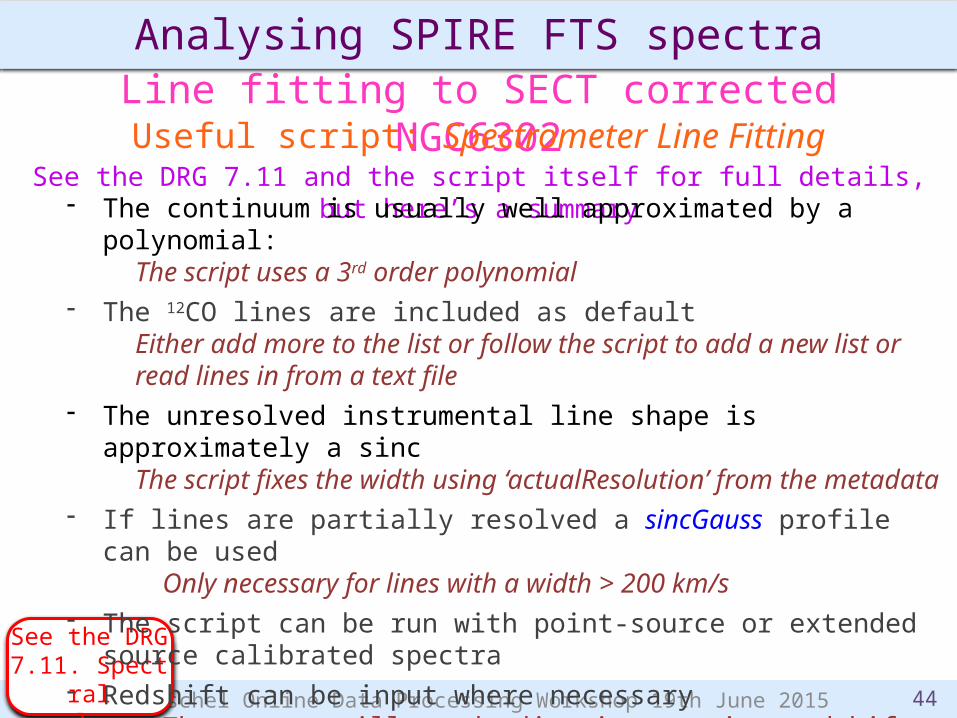
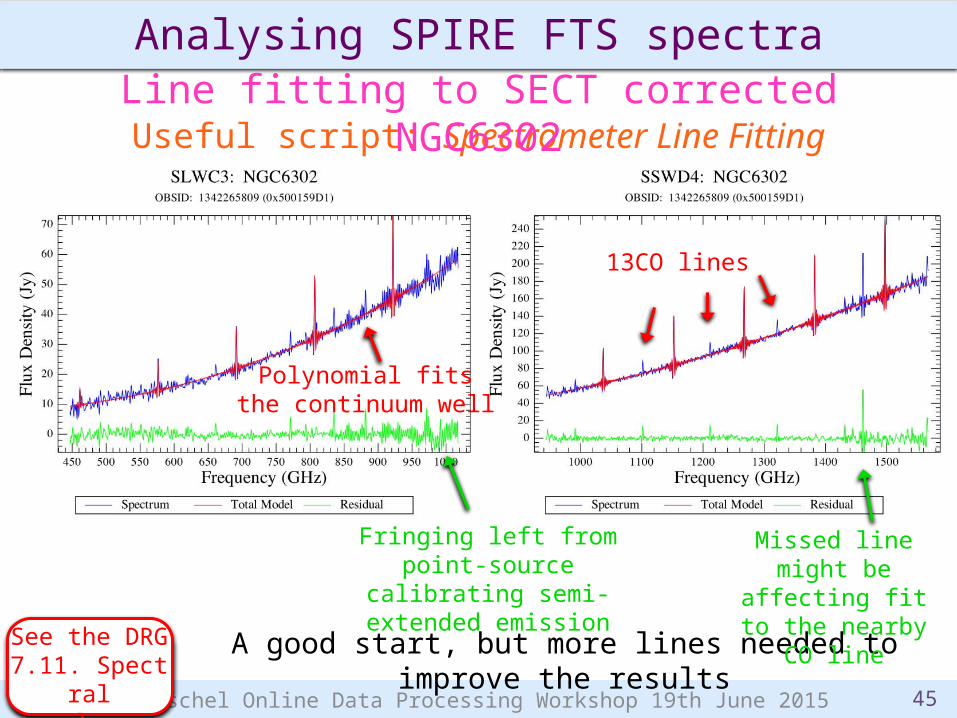
Analysing SPIRE FTS spectraLine fitting to SECT corrected NGC6302
See the DRG 7.11. Spectral
analysis
See the DRG 7.11 and the script itself for full details, but here’s a summary- The continuum is usually well approximated by a polynomial:
The script uses a 3rd order polynomial- The 12CO lines are included as default
Either add more to the list or follow the script to add a new list or read lines in from a text file- The unresolved instrumental line shape is approximately a sinc
The script fixes the width using ‘actualResolution’ from the metadata- If lines are partially resolved a sincGauss profile can be used
Only necessary for lines with a width > 200 km/s- The script can be run with point-source or extended source calibrated spectra- Redshift can be input where necessary
The output will need adjusting to give redshift, but the script tells you how!
Useful script: Spectrometer Line Fitting
Herschel Online Data Processing Workshop 19th June 2015 45
Analysing SPIRE FTS spectra
See the DRG 7.11. Spectral
analysis
A good start, but more lines needed to improve the results
Fringing left from point-source calibrating semi-
extended emission
Missed line might be affecting fit to the
nearby CO line
Polynomial fits the continuum well
13CO lines
Useful script: Spectrometer Line FittingLine fitting to SECT corrected NGC6302
Herschel Online Data Processing Workshop 19th June 2015 46
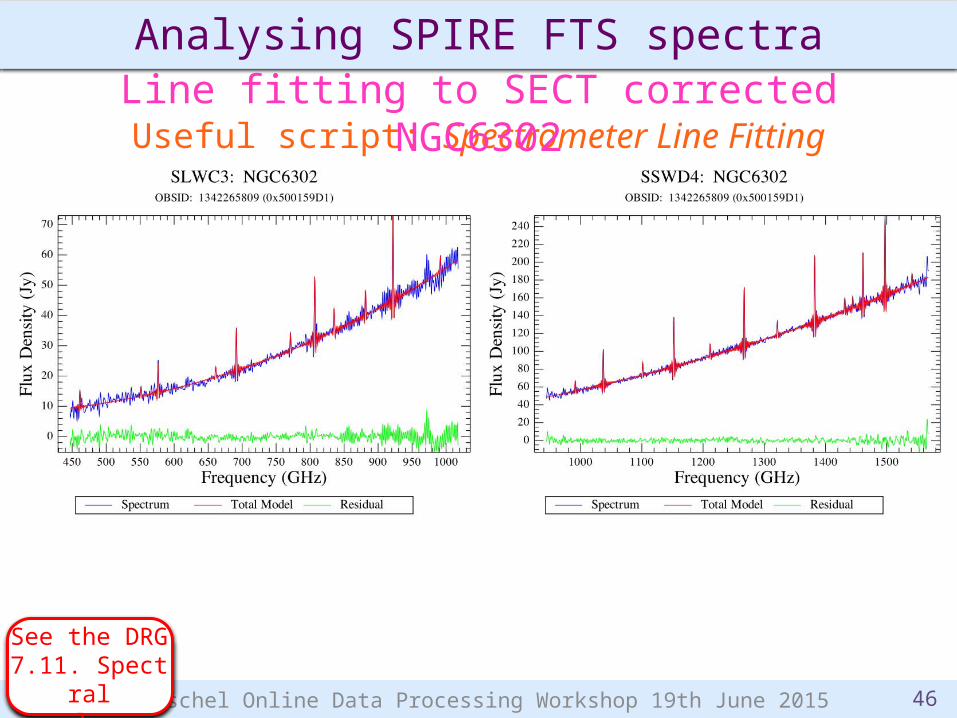
Analysing SPIRE FTS spectra
See the DRG 7.11. Spectral
analysis
Useful script: Spectrometer Line FittingLine fitting to SECT corrected NGC6302
Herschel Online Data Processing Workshop 19th June 2015 47
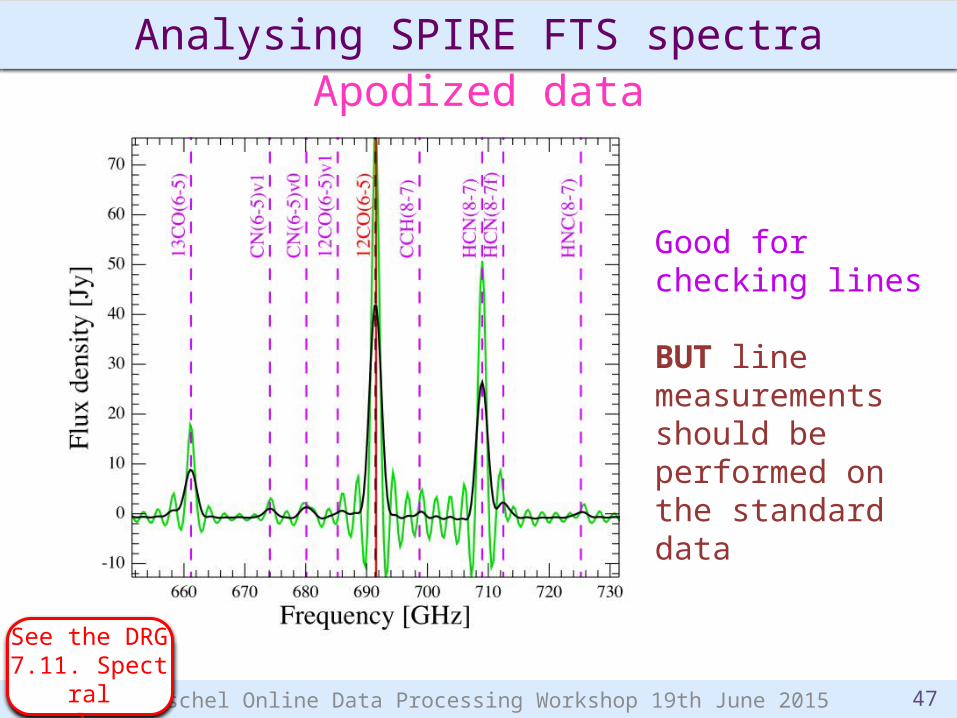
Good for checking lines
BUT line measurements should be performed on the standard data
Analysing SPIRE FTS spectraApodized data
See the DRG 7.11. Spectral
analysis
Herschel Online Data Processing Workshop 19th June 2015 48
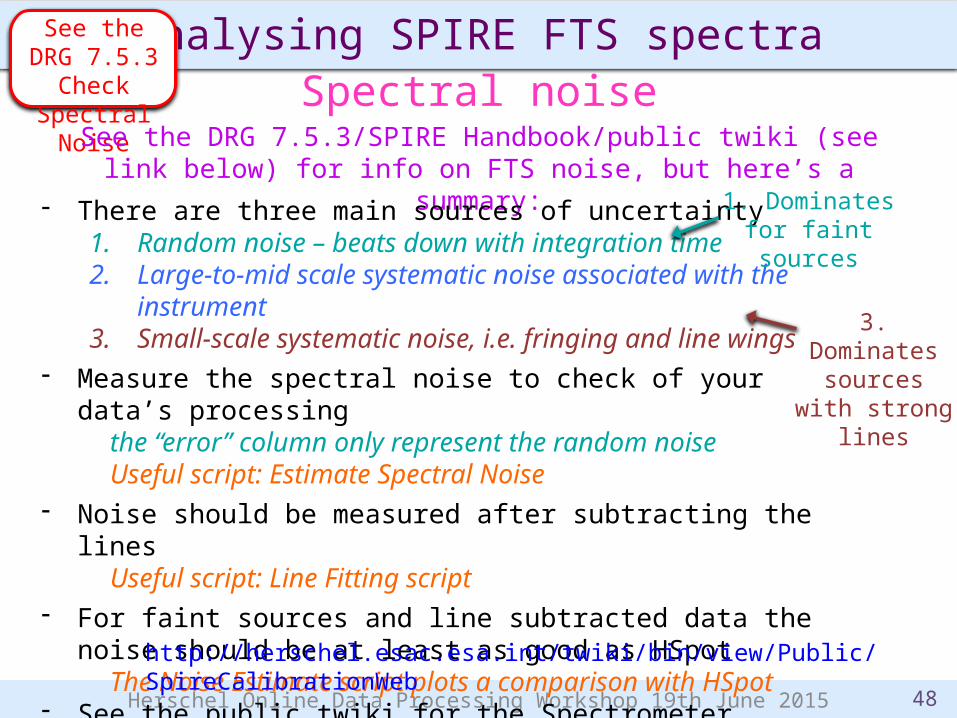
Analysing SPIRE FTS spectraSpectral noise
See the DRG 7.5.3 Check
Spectral Noise
See the DRG 7.5.3/SPIRE Handbook/public twiki (see link below) for info on FTS noise, but here’s a summary:
- There are three main sources of uncertainty1. Random noise – beats down with integration time2. Large-to-mid scale systematic noise associated with the instrument3. Small-scale systematic noise, i.e. fringing and line wings
- Measure the spectral noise to check of your data’s processing the “error” column only represent the random noise Useful script: Estimate Spectral Noise
- Noise should be measured after subtracting the lines Useful script: Line Fitting script
- For faint sources and line subtracted data the noise should be at least as good as HSpot
The Noise Estimate script plots a comparison with HSpot- See the public twiki for the Spectrometer uncertainties
1. Dominates for faint sources
3. Dominates sources with strong lines
http://herschel.esac.esa.int/twiki/bin/view/Public/SpireCalibrationWeb

Herschel Online Data Processing Workshop 19th June 2015 49
Analysing SPIRE FTS spectra
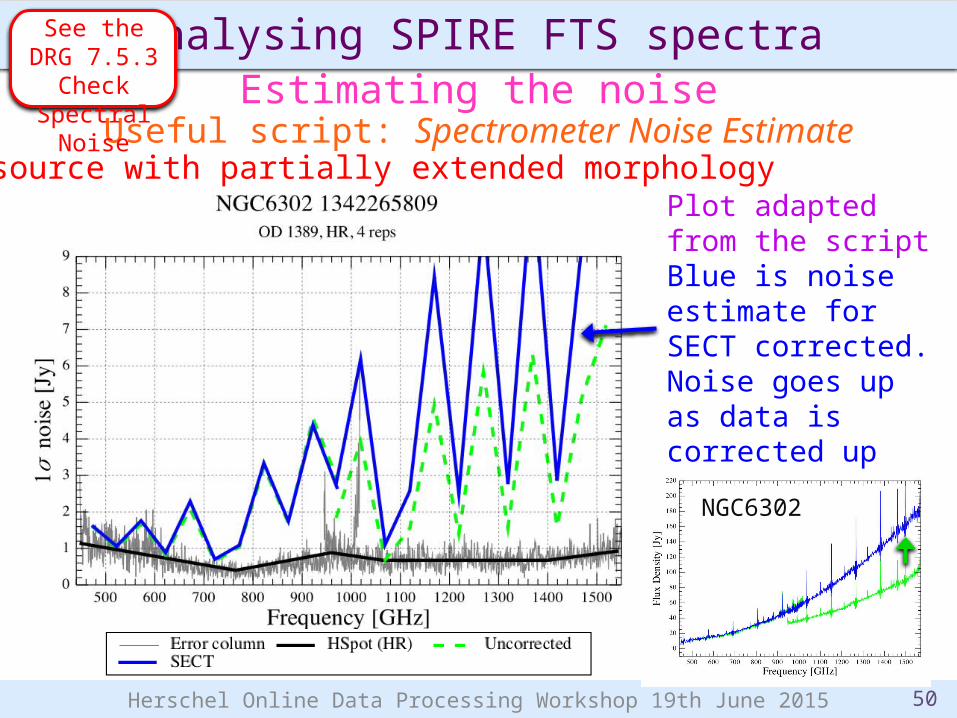
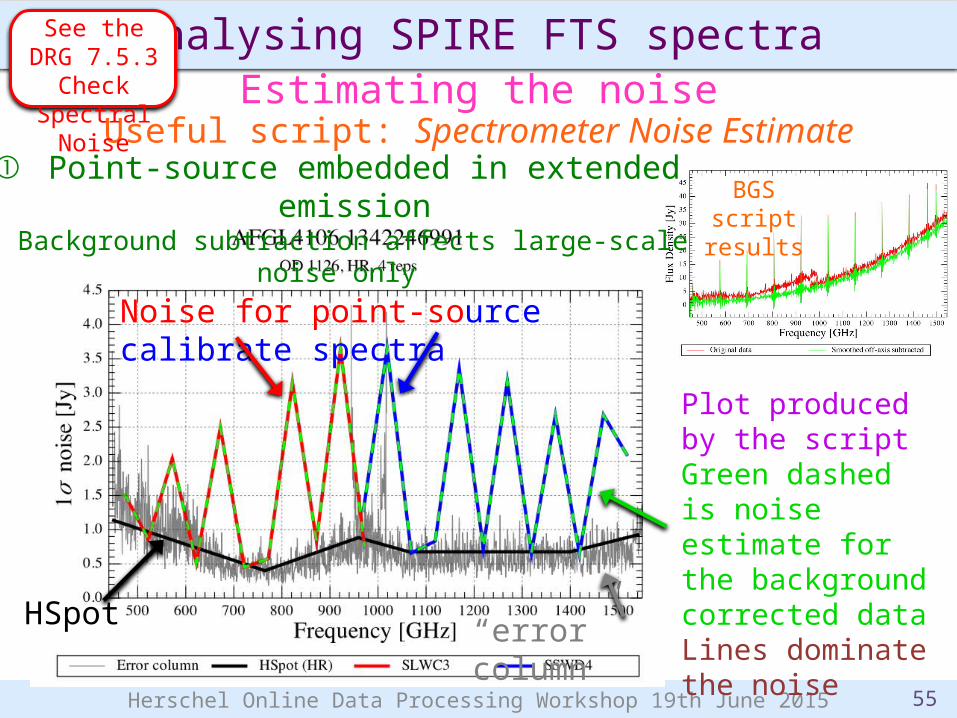
Useful script: Spectrometer Noise Estimate
See the DRG 7.5.3 Check
Spectral Noise
Plot adapted from the scriptGreen dashed is noise estimate for the data straight from the archiveLines dominate the noise
③ A source with partially extended morphology
NGC6302
Estimating the noise
Herschel Online Data Processing Workshop 19th June 2015 50
Analysing SPIRE FTS spectra
Useful script: Spectrometer Noise Estimate
See the DRG 7.5.3 Check
Spectral Noise
Plot adapted from the scriptBlue is noise estimate for SECT corrected.Noise goes up as data is corrected upLines dominate the noise
NGC6302
③ A source with partially extended morphology
Estimating the noise

Herschel Online Data Processing Workshop 19th June 2015 51
Analysing SPIRE FTS spectra
Useful script: Spectrometer Noise Estimate
See the DRG 7.5.3 Check
Spectral Noise
Plot adapted from the scriptOrange is noise estimate for the SECT corrected and 12CO line fitted and subtracted dataStill lines in there
NGC6302
③ A source with partially extended morphology
Estimating the noise
Herschel Online Data Processing Workshop 19th June 2015 52
Analysing SPIRE FTS spectra
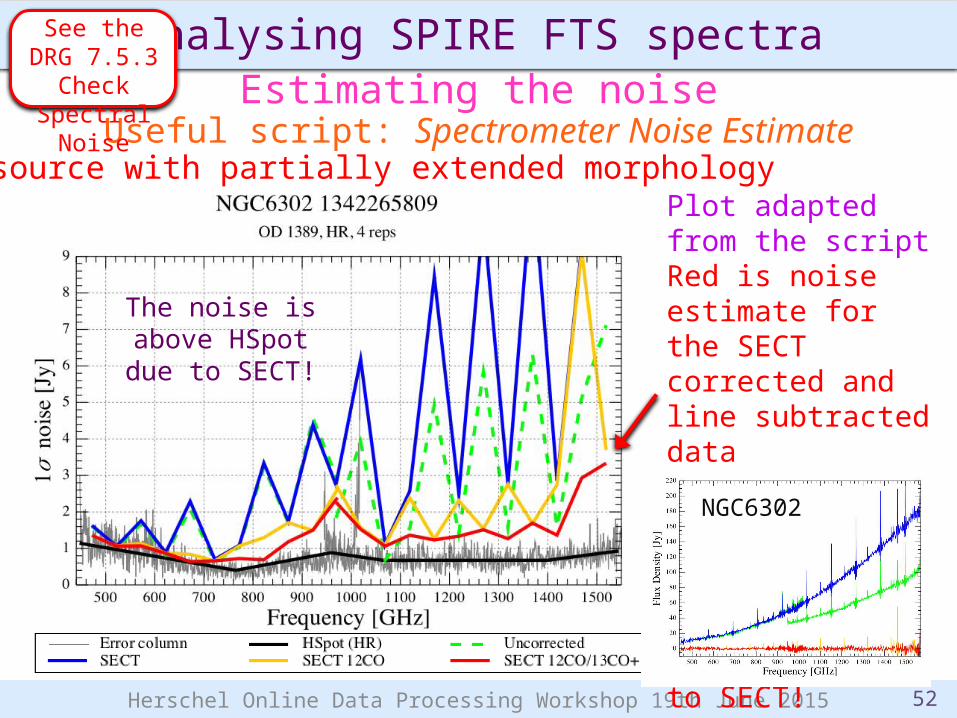
Useful script: Spectrometer Noise Estimate
See the DRG 7.5.3 Check
Spectral Noise
Plot adapted from the scriptRed is noise estimate for the SECT corrected and line subtracted dataMost significant lines are removedThe noise is above HSpot due to SECT!
Estimating the noise
The noise is above HSpot due to SECT!
NGC6302
③ A source with partially extended morphology
Herschel On-Line Spectroscopy Data Processing Workshop 24 April 2014 53
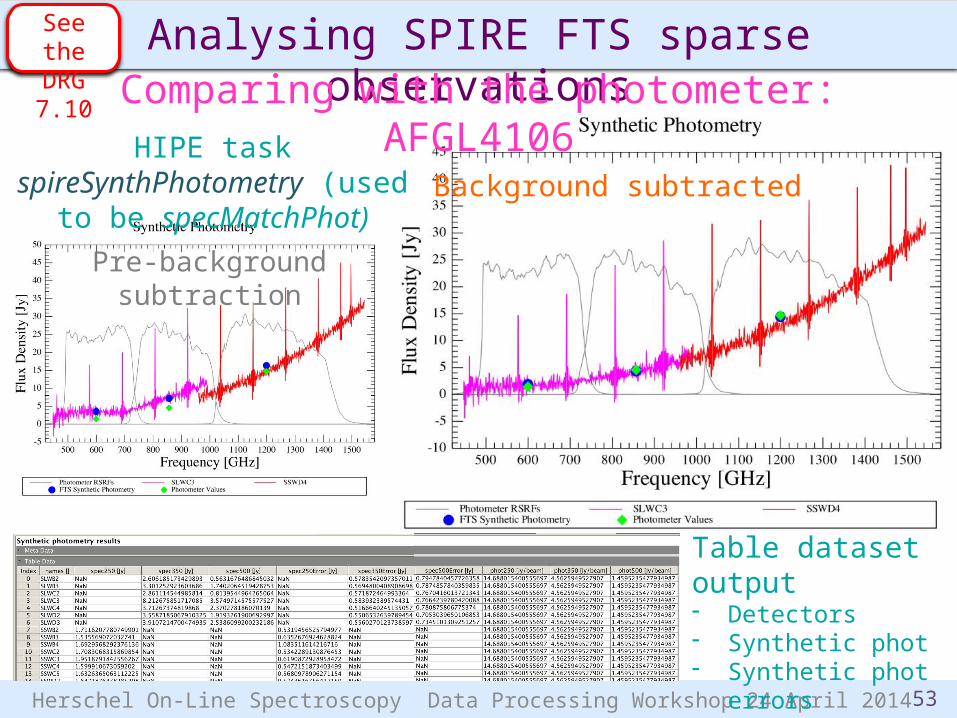
Analysing SPIRE FTS sparse observations
HIPE task spireSynthPhotometry (used to be specMatchPhot)
Pre-background subtraction
Table dataset output- Detectors- Synthetic phot- Synthetic phot errors- Photometer phot
Background subtracted
Comparing with the photometer: AFGL4106
See the DRG 7.10
Herschel Online Data Processing Workshop 19th June 2015 54
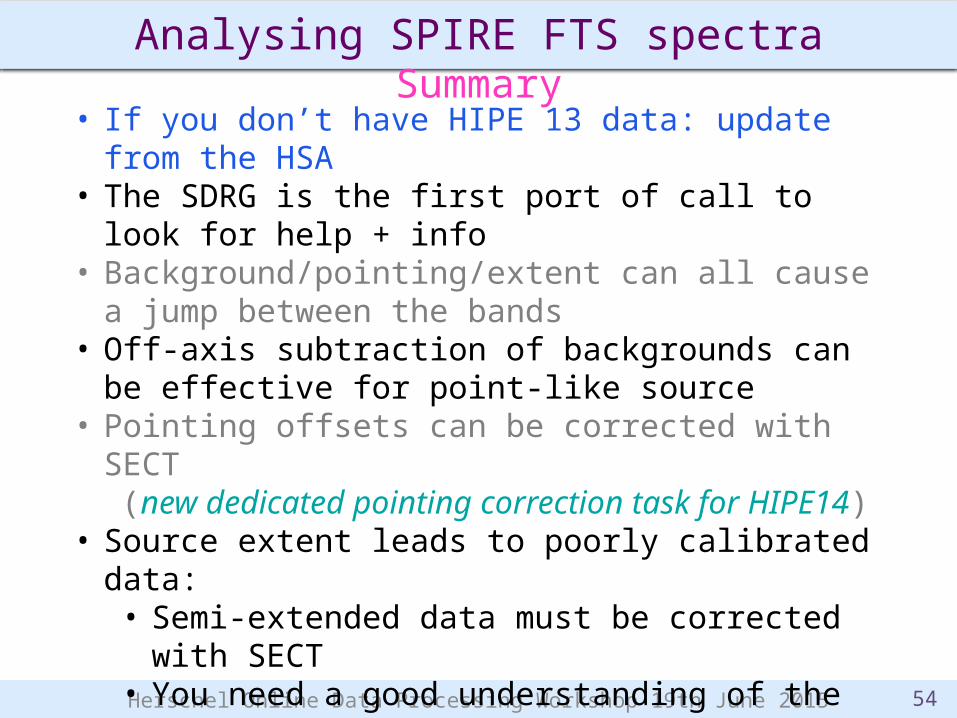
Summary• If you don’t have HIPE 13 data: update from the HSA• The SDRG is the first port of call to look for help + info• Background/pointing/extent can all cause a jump between
the bands• Off-axis subtraction of backgrounds can be effective for
point-like source• Pointing offsets can be corrected with SECT
(new dedicated pointing correction task for HIPE14)• Source extent leads to poorly calibrated data:
• Semi-extended data must be corrected with SECT• You need a good understanding of the source
• Fit all lines (sinc) and continuum simultaneously • Useful scripts provide a handy workflow within HIPE• The best place to inspect, diagnose, correct and analyse
your FTS data is in HIPE!
Analysing SPIRE FTS spectra
Herschel Online Data Processing Workshop 19th June 2015 55
Analysing SPIRE FTS spectra
Useful script: Spectrometer Noise Estimate
See the DRG 7.5.3 Check
Spectral Noise
① Point-source embedded in extended emission- Background subtraction affects large-scale noise only
Plot produced by the scriptGreen dashed is noise estimate for the background corrected dataLines dominate the noise
HSpot “error” column
Noise for point-source calibrate spectra
BGS script results
Estimating the noise
Herschel Online Data Processing Workshop 19th June 2015 56
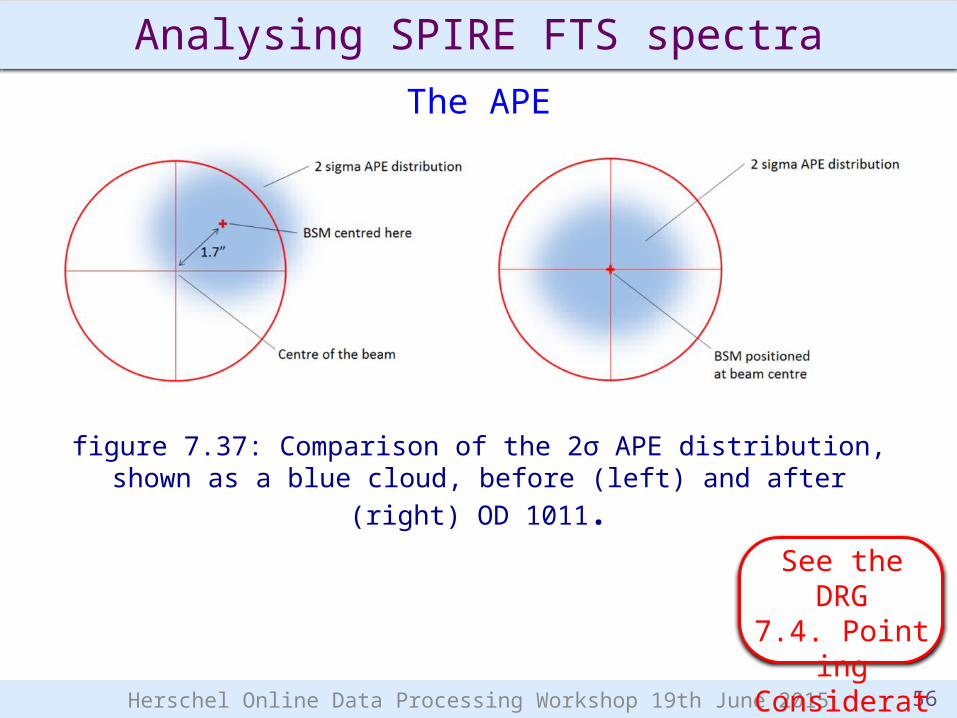
Analysing SPIRE FTS spectraThe APE
See the DRG 7.4. Pointing
Considerations
figure 7.37: Comparison of the 2σ APE distribution, shown as a blue cloud, before (left) and after (right) OD 1011.