analysing the homogeneity of air temperature,...
TRANSCRIPT

ANALYSING THE HOMOGENEITY OF AIR TEMPERATURE, RELATIVE AIR HUMIDITY, PRECIPITATION AND WIND DATA
SERIES USING “CLIMATOL” AND METEOROLOGICAL METADATA
G. S. TUDORACHE1,2, Nicoleta IONAC1, A. DUMITRESCU2,
Ancuța MANEA2
ABSTRACT – Analysing the homogeneity of air temperature, relative air humidity, precipitation and wind data series using ‘Climatol’ and meteorological metadata. Errors are inherent in all measurement activity, and meteorology is no exception. Homogenization of climatological series to eliminate disturbances often contained in them, due to changes in the conditions of observations, is a mandatory process to increase the reliability of studies of climate variability derived from their analysis. The “Climatol” R package is devoted to the problem of homogenizing climatological data series in order to remove the perturbations produced e.g. by changes in the conditions of observation or in the nearby environment, to allow the series to reflect the climatic variations. As it is known, changes in the location of meteorological observatories, changes in instrumentation (from classic equipment to automated sensors) or in shelters intended to protect sensors from solar radiation, or even changes in the environment (land uses, new constructions, etc.) are alterations that can not be attributed to changes in the climate. Such information regarding this changes are known as “metadata”. In this paper the “Climatol” method was used for air temperature, relative air humidity, precipitation and wind daily data homogenization for the period since 1961 till 2015 at Cluj-Napoca, Oradea, Satu Mare and Vlădeasa 1800 meteorological stations. With the help of metadata, the results were validated and changes in statistical parameters of meteorological data string were identified, for the analysed meteorological parameters, due to the relocation of the meteorological platforms, changes of the meteorological equipment and changes of the measuring methodology.
Keywords: homogenization, Climatol method, meteorological metadata, station history
1. INTRODUCTION The homogenization process of climatological data series is a practice that
should not be overlooked and necessary to ensure the quality of the meteorological data used in various studies and analyzes. The “Climatol” Package developed
1Faculty of Geography, University of Bucharest, 1 Nicolae Bălcescu Blvd., Sector 1, 010041, Bucharest, Romania, [email protected], [email protected]
2 Romanian National Meteorological Administration, 97 Bucuresti-Ploiești St., Sector 1, 013686, Bucharest, Romania, e-mail: [email protected] , [email protected], [email protected]
50

especially for R statistical software helps in the process for climatological data series homogenization by reducing disturbances caused by various changes in measurement conditions (eg meteorological platform relocation, installing of Automatic Weather Station (A.W.S.), changes of measuring equipment). Implemented functionalities include the comparison of each original series with a reference one (computed as a weighted average of normalized values of the other series), and the visual inspection of graphs of the data and their anomalies (Guijarro, 2011; Pastor, 2004; Pastor, 2015).
Internationally the issue of datasets homogenization has been approached in many scientific papers in various domains (Alexandersson, 1997; Beaulieu et al., 2008; Easterling, D. R., Peterson et al., 1996; Lanzante et al., 2003; Štěpánek et al., 2009; Zhen, 2009), due to the importance of the quality of the data used in their studies and specific applications. In this paper, the “Climatol” method was used for the homogenization of daily mean air temperature, relative humitidy, wind speed and precipitation data series, in the 1961-2015 period for Cluj Napoca, Oradea, Satu Mare and Vlădeasa 1800 meteorological stations.
Running “CLIMATOL” method result in four files that include: homogenized data, homogenized data the program has operated with estimates to replace missing data, messages about the process of homogenization and diagnostic graphs generated from the process of homogenization. With the help of metadata, the results were validated and changes in statistical parameters of meteorological data string were identified, both for wind and precipitation, due to the relocation of the meteorological platforms, changes of the meteorological equipment and changes of the measuring methodology.
2. WIND SPEED DAILY DATA HOMOGENIZATION (1961-2015) In order apply the “Climatol” method for daily data homogenization for all
four meteorological stations, the program had to be initialized according to the user guide (Guijarro, 2011), as follows:
- For the clustering method, `ward` was used (after all the types included in the program were tested);
- `Tol` (Tolerance factor to split several series at a time) - tolerance factor was set at 0.02 (it`s allowed a rate of 2% for each reference data set);
- For the `Wd`, matrix (0,0,100) was used, meaning the distance at which reference data will have half of the percentage of those located at a distance 0;
- The type of normalization `std` was assigned with value 3; - Distant points tolerance `dz.max`(Threshold of outlier tolerance - outlier
detection) for daily data was assigned with value 7 and for monthly data with value 5;
- `SNHT`(The Standard Normal Homogeneity Test) for daily values was set to value 15 and for monthly data was set to value 25.
51

After running “Climatol”, graphs are generated for each identified “break” (data anomaly) by the program and later analyzed by comparing them with known historical metadata, managing to identify 70% of them. The comparison result reveals most of the perturbations reasons are equipment changes (Fig. 2), measuring device replacements (Fig. 1) and changes of the meteorological platform (Fig. 3). One of the main identified reasons for data series disturbances was the installation of Automatic Weather Stations (Fig. 1, 2, 3, 4), after year 2000, and thus the wind vane ( light plate and heavy plate), anemometer or anemograph replacement with high precision measuring sensors (ultrasonic sensor).
The following graphs reveal disturbances identified at the four meteorological stations and explained using known metadata, found in station files under “station history” chapter or using other sources of information.
Fig. 1. Graph examples showing the breaks resulted from the process of wind speed data
homogenization for Cluj Napoca meteorological station (1961-2015 period)
Fig. 2. Graph examples showing the breaks resulted from the process of wind speed data
homogenization for Oradea meteorological station (1961-2015 period)
2001 – The classic equipment is replaced by a Automatic Wheather Station
1971 – Wind vane is replaced
1993 – Wind vane is replaced
2002 – The classic equipment is replaced by a Automatic Wheather Station
1976 – Installing of a Automatic Weather Station M-2 (U.R.S.S.)
52
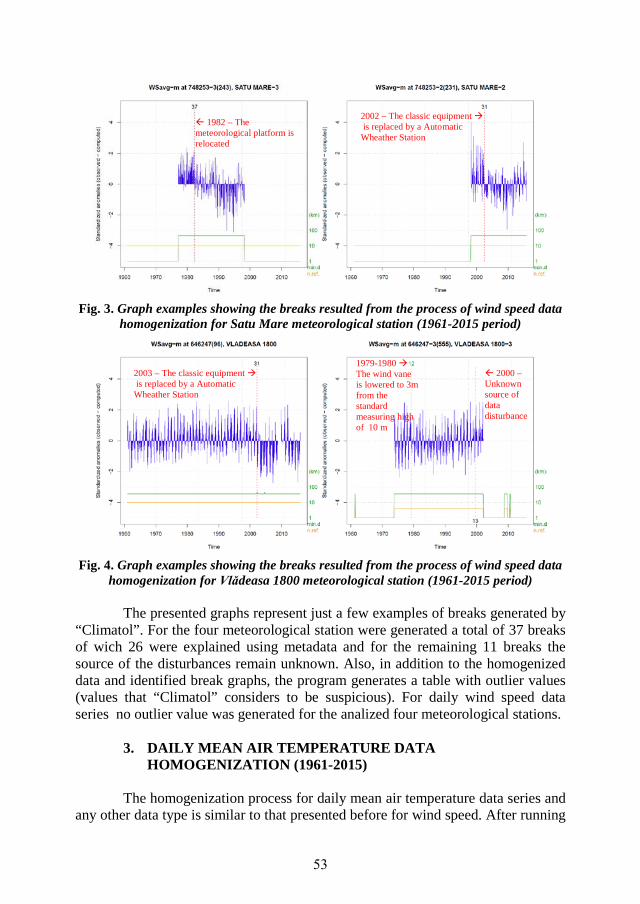
Fig. 3. Graph examples showing the breaks resulted from the process of wind speed data
homogenization for Satu Mare meteorological station (1961-2015 period)
Fig. 4. Graph examples showing the breaks resulted from the process of wind speed data
homogenization for Vlădeasa 1800 meteorological station (1961-2015 period)
The presented graphs represent just a few examples of breaks generated by “Climatol”. For the four meteorological station were generated a total of 37 breaks of wich 26 were explained using metadata and for the remaining 11 breaks the source of the disturbances remain unknown. Also, in addition to the homogenized data and identified break graphs, the program generates a table with outlier values (values that “Climatol” considers to be suspicious). For daily wind speed data series no outlier value was generated for the analized four meteorological stations.
3. DAILY MEAN AIR TEMPERATURE DATA
HOMOGENIZATION (1961-2015) The homogenization process for daily mean air temperature data series and
any other data type is similar to that presented before for wind speed. After running
1982 – The meteorological platform is relocated
2002 – The classic equipment is replaced by a Automatic Wheather Station
2003 – The classic equipment is replaced by a Automatic Wheather Station
1979-1980 The wind vane is lowered to 3m from the standard measuring high of 10 m
2000 – Unknown source of data disturbance
53

“Climatol” for daily mean air temperature data were generated a total of seven breaks of which six were explained. Among the identified reasons for the disturbances it can be observed: the meteorological platform relocation , changes of meteorological equipment and a particular case at Vlădeasa 1800 meteorological
station in 2014 when the A.W.S. during a thunderstorm was struck by lightning resulting in total malfunction of the sensors and the computer inside the station bulding (Fig. 5).
Also, the process generated six outlier values for Oradea meteorological station and another ten for Satu Mare meteorological station (Table 1). The values were compared to the archive records (TM-1 register from the four meteorological stations) and concluded that they were largely the extreme values. Thus, can be observed an inability of the ‘CLIMATOL’ method to accept certain values, especially extreme data. This is one of the weaknesses of the homogenization process, outliers that do not fit into the algorithms for processing 90% on the data series.
Table 1. Suspicious daily mean air temperature values (outlier values) identified in 1961-
2015 period for Oradea and Satu Mare meteorological station by ‘Climatol’
Meteorological station name Date
Measured data at the meteorological station
(°C)
Suggested value by Climatol
(°C)
Outlier compared to archive records (TM-1 register)
Oradea December 25, 1963 -6.8 -2.2 Measured data is corect
Oradea January 5, 1964 -11.3 -6.8 Measured data is corect
Oradea January 6, 1964 -12 -7.3 Measured data is corect
Oradea January 13, 1964 -16.9 -12 Measured data is corect
Oradea January 21, 1964 -17.3 -12 Measured data is corect
Oradea January 30, 1966 -9.8 -4.6 Measured data is corect
Satu Mare January 29, 1961 -18.4 -12.3 Measured data is corect
Satu Mare December 24, 1961 -20.9 -14.8 Measured data is corect
Satu Mare January 4, 1964 -13.1 -7.1 Measured data is corect
Satu Mare January 13, 1964 -22 -15.8 Measured data is corect
Satu Mare January 21, 1964 -17.6 -11.3 Measured data is corect
Satu Mare February 10, 1965 -18.8 -12.3 Measured data is corect
Satu Mare January 8, 1969 -14.8 -8.3 Measured data is corect
Satu Mare January 17, 1982 -19.9 -13.9 Measured data is corect
Satu Mare February 28, 1985 -14.8 -7.4 Measured data is corect
Satu Mare February 8, 2012 -16.6 -9.9 Measured data is corect
2014 – A.W.S. struck by lightning
Fig. 5. Graph showing the break resulted from the process of homogenization for Vlădeasa 1800 meteorological station (1961-2015 period) revealing the lightning case
54

4. DAILY RELATIVE AIR HUMIDITY DATA
HOMOGENIZATION (1961-2015) Running the program for daily relative air humidity dataset yielded a total
of 29 breaks, of which 18 (62%) were explained using known metadata (Fig. 6 and 7). From the graphs analysis can be concluded that among the main reasons of the disturbances in the data series remains the changes of measuring equipment used for relative air humidity measurements. Like in the case of daily wind speed data homogenization, no outlier values were generated.
Fig. 6. Graph examples showing the breaks resulted from the homogenization process for
Cluj Napoca and Oradea meteorological stations (1961-2015 period)
Fig. 7. Graph examples showing the breaks resulted from the homogenization process for
Satu Mare and Vlădeasa 1800 meteorological stations (1961-2015 period)
2001 – The classic equipment is replaced by a A.W.S.
1984 – The meteorological platform is resized and reorganized
2003 – The classic equipment is replaced by a A.W.S.
1962 – The meteorological platform equipped with meteorological instruments
1996 – Methodological changes in station activities
55

5. DAILY PRECIPITATION DATA HOMOGENIZATION (1961-2015) From the process of daily precipitation data homogenization for all four
meteorological stations resulted in 13 breaks of which 11 were explained (85%). But what stands out, after the comparison, is that the biggest influence over the data series disturbances came from A.W.S. installation and none from meteorological platform relocation (Fig. 8).
Fig. 8. Graph examples showing the breaks resulted from the homogenization process for
Cluj Napoca and Oradea meteorological stations (1961-2015 period)
After running “Climatol” for daily precipitation data (1961-2015 period) resulted in 11 outlier values for Cluj Napoca meteorological station, 15 outlier values for Oradea meteorological station and 5 outlier values for Satu Mare meteorological station.
After comparing these values to the TM-1 register values resulted that 67% of these were corect extreme values. Thus, in the case of Cluj Napoca seven of these were incorrect values uploaded in the electronic database (Table 2).
Table 2. Suspicious daily mean air temperature values (outlier values) identified in 1961-
2015 period for Cluj Napoca meteorological station by ‘Climatol’
Meteorological station name Date
Measured data at the meteorological station
(°C)
Suggested value by Climatol
(°C)
Outlier compared to archive records (TM-1 register)
Cluj Napoca May 29, 1962 15.8 0.2 Measured data is corect Cluj Napoca July 15, 1966 13.7 0 Measured data is corect Cluj Napoca July 15, 1968 1.4 0.1 Measured data is corect Cluj Napoca July 29, 1969 81.6 0.8 Measured data is corect Cluj Napoca July 1, 1970 27.4 0.8 4.8 is the correct value Cluj Napoca August 16, 1970 15.5 0.2 5.6 is the correct value Cluj Napoca June 11, 1972 40 1.5 12.0 is the correct value Cluj Napoca August 3, 1974 39.4 2.3 12.8 is the correct value Cluj Napoca June 11, 1981 14.5 0.4 0.1 is the correct value Cluj Napoca July 27, 1982 50.2 2.7 8.4 is the correct value Cluj Napoca June 14, 1989 63.2 2.6 158 is the correct value
1967 – The meteorological platform is relocated
1982 – The meteorological platform is relocated
1969 – The meteorological platform is fenced with metal panels
1962 – Unknown source for data disturbance
56
6. CONCLUSIONS
The “Climatol” method avoids the use of regression techniques with the
advantage of being more robust, simpler and allows the use of data from nearby meteorological stations when there is no common observation period. With the help of metadata, approximately 90% of the results were validated and changes in statistical parameters of meteorological data series were identified, for wind speed, mean air temeperature, relative humidity and precipitation, due to the relocation of the meteorological platforms, changes of the meteorological equipment, changes of the measuring methodology and even malfunction particular cases (A.W.S. struck by lightning). The outlier values generated by “Climatol” help to identify incorrect values in the database and thus contributing to a higher quality of the data. “Climatol” program is yet to be improved for a better processing of the extreme data, but it can not be overlooked the huge contribution in the homogenization process.
REFERENCES
1. Alexandersson, H., & Moberg, A. (1997). Homogenization of Swedish
temperature data. Part I: Homogeneity test for linear trends. International Journal of climatology, 17(1), 25-34.
2. Beaulieu, C., Seidou, O., Ouarda, T. B., Zhang, X., Boulet, G., & Yagouti, A. (2008). Intercomparison of homogenization techniques for precipitation data. Water Resources Research, 44(2).
3. Easterling, D. R., Peterson, T. C., & Karl, T. R. (1996). On the development and use of homogenized climate datasets. Journal of climate, 9(6), 1429-1434.
4. Guijarro, J. (2011). User guide to Climatol: An R package for homogenization of climatological series. Balearic Islands, Spain.
5. Lanzante, J. R., Klein, S. A., & Seidel, D. J. (2003). Temporal homogenization of monthly radiosonde temperature data. Part I: Methodology. Journal of Climate, 16(2), 224-240.
6. Pastor, J.A.G. (2004), CLIMATOL: software libre para la depuración y homogeneización de datos climatológicos. IV Congreso De La Asociación Española De Climatología, Santander, 2-5 De Noviembre De 2004 ,493-502.
7. Pastor, J. A. G. (2015). Automatización de la homogeneización de series climáticas: nuevas funciones del paquete Climatol 3.0. Clima, sociedad, riesgos y ordenación del territorio, 153-160.
8. Štěpánek, P., Zahradníček, P., & Skalák, P. (2009). Data quality control and homogenization of air temperature and precipitation series in the area of the Czech Republic in the period 1961–2007. Advances in Science and Research, 3(1), 23-26.
9. Zhen, L., & Zhong-Wei, Y. (2009). Homogenized daily mean/maximum/minimum temperature series for China from 1960-2008. Atmospheric and Oceanic Science Letters, 2(4), 237-243.
57