analysis and distribution of the rainfall monitoring ... · analysis and distribution of the...
TRANSCRIPT

Analysis and Distribution of the Rainfall Monitoring Networkin a Brazilian Pantanal Region
Marcia Ferreira Cristaldo1, Celso Correia de Souza2, Leandro de Jesus1,Carlos Roberto Padovani3, Paulo Tarso Sanches de Oliveira4, Hevelyne Henn da Gama Viganó5
1Departamento da Computação, Instituto Federal de Educação, Ciência e Tecnologia
de Mato Grosso do Sul, Aquidauana, MS, Brasil.2Universidade Anhanguera UNIDERP, Campo Grande, MS, Brasil.
3Departamento de Geoprocessamento, Empresa Brasileira de Pesquisa Agropecuária,
Corumbá, MS, Brasil.4Faculdade de Engenharias, Arquitetura e Urbanismo e Geografia,
Universidade Federal de Mato Grosso do Sul, Campo Grande, MS, Brasil.5Departamento de Matemática, Instituto Federal de Educação,
Ciência e Tecnologia de Mato Grosso do Sul, Campo Grande, MS, Brasil.
Received in May 15, 2015 – Accepted in March 10, 2017
Abstract
To better understand drought and flood dynamics in the Pantanal is crucial an adequate hydrometeorological monitoringnetwork. However, few studies have investigated whether the current monitoring systems are suitable in this region.Here, we analyzed the hydrometeorological monitoring network of the Aquidauana region, composed of pluviometric,meteorological and fluviatile gauging stations. We obtained data of all hydrometeorological gauges available in this re-gion to compare with the World Meteorological Organization (WMO) recommendation. We found that although thenumber of stations in operation is satisfactory when compared with that established by the WMO, the network is not sat-isfactory in the operating stations because of lack of maintenance, thus creating a need for additional stations. This factwas also observed when analyzing the meteorological network. Using remote sensing data may be possible to fill thesedata gap. However, to improve the knowledge on hydrological processes in this region is still necessary to install addi-tional ground-based stations.Keywords: pluviometric stations, rainfall density, Aquidauana.
Análise e Distribuição da Rede de Monitoramento de Chuvasna Região do Pantanal Brasileiro
Resumo
Para entender melhor a dinâmica de seca e inundação no Pantanal é fundamental uma rede de monitoramentohidrometeorológico adequada. No entanto, poucos estudos têm investigado se os atuais sistemas de monitoramento sãoadequados nesta região. Aqui, analisamos a rede de monitoramento hidrometeorológico da região de Aquidauana,composta por estações pluviométricas, meteorológicas e fluviais. Obtivemos dados de todos os medidores hidro-meteorológicos disponíveis nesta região para comparação conforme a recomendação da Organização MeteorológicaMundial (OMM). Constatou-se que, embora o número de estações em operação seja satisfatório quando comparado como estabelecido pela OMM, a densidade da rede não é satisfatória nas estações de operação por falta de manutenção,criando assim a necessidade de estações adicionais. Esse fato também foi observado na análise da rede meteorológica. Ouso de dados de sensoriamento remoto pode ser possível para preencher essa lacuna de dados. No entanto, para melhoraro conhecimento sobre os processos hidrológicos nesta região ainda é necessário instalar estações terrestres adicionais.Palavras-chave: estação pluviométrica, densidade de chuva, Aquidauana.
Revista Brasileira de Meteorologia, v. 32, n. 2, 199-205, 2017 rbmet.org.brDOI: http://dx.doi.org/10.1590/0102-77863220007
Artigo
Autor de correspondência: Marcia Ferreira Cristald, [email protected], mferreiracristaldo@gmail.

1. Introduction
The water crisis throughout the world, and particu-larly in Brazil, has brought up discussions regarding theconscious use of natural resources. Other existing water re-serves in the country are being considered, as Brazil hassome of the largest rivers in the world and houses much ofthe Guarani Aquifer System – one of the largest under-ground reserves of fresh water that could possibly be one ofthe solutions for a good part of the country’s water supply(Oliveira et al., 2016).
Proper management of potential water reserves avail-able in the world requires knowledge of the fluviatile andpluviometric systems. This monitoring becomes a key ac-tivity to subsidize the management of water resources. Onthe other hand, the historical data series resulting from suchactivity allow monitoring weather and climate over theyears, supporting projects of research on water resources.
Thus, the gathering of information necessary for hy-drology is accomplished through hydrometeorological sta-tion networks, whose importance of data series is propor-tional to their temporal extent. In Brazil, many stationshave recorded data for more than a hundred years, such asthe pluviometric station of Morro Velho (Minas GeraisState) and the fluviatile gauging station of the River Negroin Manaus, with data recorded from 1855 and 1902, respec-tively. The first activities of hydrological data collectionperformed in an organized manner, however, date back tothe early 20th century, more precisely, 1920, when the Com-mission of Hydraulic Forces Studies built stations ad-dressed to specific studies of hydraulic use, aiming at hy-droelectric power. The register of hydrometric stations inthe country started around 1968 by the former DNAEE(National Department of Water and Power) with publica-tions of the first inventory of fluviatile and pluviometricstations (Ishihara, 2014).
According to the ANA (National Water Agency), theNational Basic Hydro-meteorological Network has 2,527pluviometric stations that measure rainfall at a given point.By means of an ambitious project, ANA is planning the na-tional hydro-meteorological network from those in opera-tion and in partnership with the various agencies andinterested states (Ana, 2015). In 1997 the PCBAP (Conser-vation Plan of the Upper Paraguay Basin) in 1997 started astudy on the pluviometric stations: they totaled 214 sta-tions, 22 of which deactivated. Therefore, at the time of thesurvey 192 stations were operating in the region (Tucci,2012).
The area investigated in the present study is insertedwithin the BAP – Upper Paraguay Basin – (which is the flu-vial channel of the River Aquidauana). The Aquidauana ba-sin has a significant importance for the sub-basin of theRiver Miranda, a tributary of the River Paraguay in theState of Mato Grosso do Sul. Located by the homonymousriver, the city of Aquidauana began its process of urban de-velopment along its banks. The urban territorial expansion
led to significant changes in the natural landscape, showingmany current social and environmental problems; flood is acase in point. The frequent occurrence of either flood ordrought results in severe losses of livestock and crops. Theinundation interrupts land transportation, and the dryweather accelerates the river erosion because of the heavyuncontrolled river traffic (Willink et al., 2009).
It is therefore extremely important to find a suitablemethod of flood forecasting to help plan a sustainable so-cioeconomic management system for local development.However, it is necessary to analyze the conditions of themeteorological data provided by the pluviometric andfluviatile networks in operation so that a suitable methodol-ogy for forecasting weather events can be developed. De-spite to the importance of this evaluation, few studies haveinvestigated whether the current monitoring systems aresuitable in this region
The objectives of this study are to analyze the raingauges network distribution in the region of Aquidauanaand to check whether the current installed ground-basedstations are sufficient to monitor the region.
2. Area of Study
The Aquidauana basin is bordered by the River Para-ná basin to the south and east; by the River Negro basin tothe north; and by the River Miranda basin, of which it is atributary, to the west (Fig. 1). The basin is divided into twodistinct areas: the northern part, that is drained by the upperreaches of the River Aquidauana itself, coated with quartzsands that have high susceptibility to erosion; and thesouthern part, drained by the tributaries of the left bankdownstream the Salobra brook, predominated by silt andclay soils. A large part of this area houses pastures for cattleand potentially irrigable agricultural areas.
200 Cristaldo et al.
Figure 1 - River Aquidauana Basin, with pluviometric stations marked inred and the fluviatile ones marked in green.

The River Aquidauana (Fig. 1) has a privileged loca-tion; its natural resources pose a great potential for tourismand a good reserve for fisheries. Covering 286 km in thestudy area, the River Aquidauana is the main tributary ofthe River Miranda and one of BAPs main streams. It startsin the surroundings of Serra de Maracaju, in the plateaus ofSão Gabriel do Oeste county, altitude of 715 m, crossingplateaus and reaching the city of Aquidauana at an altitudeof 133 m, with its mouth in the River Miranda at 90 m.
3. Methodology
The Hydro System was used in this work as a sourceof information on pluviometric and fluviatile stations in theAquidauana region, made available online by the ANA viathe HidroWeb System.
The HidroWeb system allows, among other things, a)managing a hydro-meteorological database stored in a rela-tional database; b) entering data by agencies that operate ahydro-meteorological network; c) analyzing the consis-tency of fluviatile data and its handling; d) generating his-torical data series of limnimetric quotas; and e) calculatingthe basic statistical functions necessary for determining theperiods of maximum ebb-tide and flood. This system car-ries two types of hydro-meteorological data: inventory data(rivers and stations), and historical data series (daily mea-surements of quotas and rain). The data are grouped into ba-sic processing units called records (Ana, 2015).
To analyze data generated by rainfall and river flownetworks of the Aquidauana region, we used spreadsheets
with data from the operation period of each station. Thespreadsheets were subdivided interspersing the operatingperiods of the stations, given the long data series of somestations. It was possible to adopt a classification criterion ofannual records for complete or incomplete information be-cause of yearly data for most series of records.
3.1. Distribution and density of pluviometric stations
To analyze the distribution and density of pluviomet-ric stations in the basin, we used the methodology recom-mended by the World Meteorological Organization(WMO), according to the following criteria: (a) interna-tional experience; (b) the main objectives of the desired ac-curacy, and (c) the dominant meteorological characteristicsin the region (Wmo, 1994).
By systematizing in tables the information made a-vailable by the stations we have tried to establish a profileof spatial and sectorial distribution of the rainfall networkin the region. The criterion is based on groups defined bythe WMO considering population density. It is based on theinternational experience of a large number of countries andcovers a broad spectrum of different demographic, geo-graphic, morphological and climate conditions. Such net-work is not ideal but the method suggests a lower limit for anetwork with reasonable density. A rainfall network withreasonable density should be within the confidence groups.Fig. 2 shows a graph of relative population density plottedagainst the density of the pluviometric stations in operation.
Analysis and Distribution of the Rainfall Monitoring Network in a Brazilian Pantanal Region 201
Figure 2 - Relative density of pluviometric networks according to the WMO. Source: Wmo (1994).
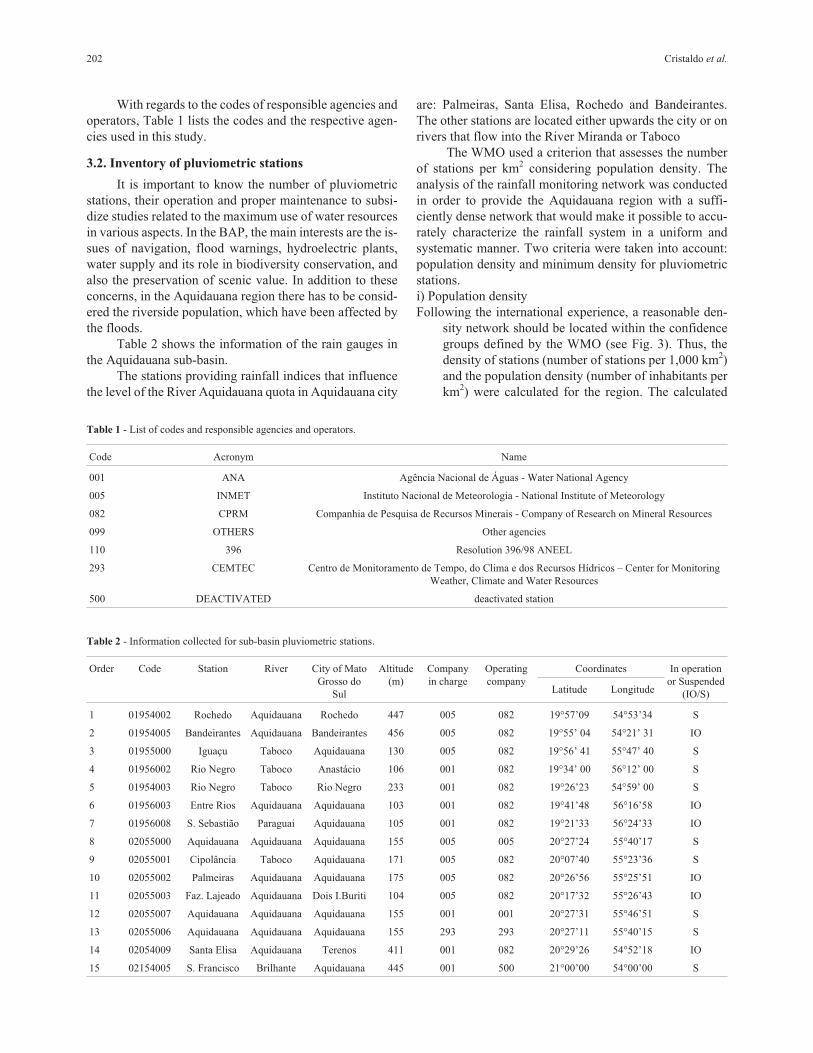
With regards to the codes of responsible agencies andoperators, Table 1 lists the codes and the respective agen-cies used in this study.
3.2. Inventory of pluviometric stations
It is important to know the number of pluviometricstations, their operation and proper maintenance to subsi-dize studies related to the maximum use of water resourcesin various aspects. In the BAP, the main interests are the is-sues of navigation, flood warnings, hydroelectric plants,water supply and its role in biodiversity conservation, andalso the preservation of scenic value. In addition to theseconcerns, in the Aquidauana region there has to be consid-ered the riverside population, which have been affected bythe floods.
Table 2 shows the information of the rain gauges inthe Aquidauana sub-basin.
The stations providing rainfall indices that influencethe level of the River Aquidauana quota in Aquidauana city
are: Palmeiras, Santa Elisa, Rochedo and Bandeirantes.The other stations are located either upwards the city or onrivers that flow into the River Miranda or Taboco
The WMO used a criterion that assesses the numberof stations per km2 considering population density. Theanalysis of the rainfall monitoring network was conductedin order to provide the Aquidauana region with a suffi-ciently dense network that would make it possible to accu-rately characterize the rainfall system in a uniform andsystematic manner. Two criteria were taken into account:population density and minimum density for pluviometricstations.i) Population densityFollowing the international experience, a reasonable den-
sity network should be located within the confidencegroups defined by the WMO (see Fig. 3). Thus, thedensity of stations (number of stations per 1,000 km2)and the population density (number of inhabitants perkm2) were calculated for the region. The calculated
202 Cristaldo et al.
Table 1 - List of codes and responsible agencies and operators.
Code Acronym Name
001 ANA Agência Nacional de Águas - Water National Agency
005 INMET Instituto Nacional de Meteorologia - National Institute of Meteorology
082 CPRM Companhia de Pesquisa de Recursos Minerais - Company of Research on Mineral Resources
099 OTHERS Other agencies
110 396 Resolution 396/98 ANEEL
293 CEMTEC Centro de Monitoramento de Tempo, do Clima e dos Recursos Hídricos – Center for MonitoringWeather, Climate and Water Resources
500 DEACTIVATED deactivated station
Table 2 - Information collected for sub-basin pluviometric stations.
Order Code Station River City of MatoGrosso do
Sul
Altitude(m)
Companyin charge
Operatingcompany
Coordinates In operationor Suspended
(IO/S)Latitude Longitude
1 01954002 Rochedo Aquidauana Rochedo 447 005 082 19°57’09 54°53’34 S
2 01954005 Bandeirantes Aquidauana Bandeirantes 456 005 082 19°55’ 04 54°21’ 31 IO
3 01955000 Iguaçu Taboco Aquidauana 130 005 082 19°56’ 41 55°47’ 40 S
4 01956002 Rio Negro Taboco Anastácio 106 001 082 19°34’ 00 56°12’ 00 S
5 01954003 Rio Negro Taboco Rio Negro 233 001 082 19°26’23 54°59’ 00 S
6 01956003 Entre Rios Aquidauana Aquidauana 103 001 082 19°41’48 56°16’58 IO
7 01956008 S. Sebastião Paraguai Aquidauana 105 001 082 19°21’33 56°24’33 IO
8 02055000 Aquidauana Aquidauana Aquidauana 155 005 005 20°27’24 55°40’17 S
9 02055001 Cipolância Taboco Aquidauana 171 005 082 20°07’40 55°23’36 S
10 02055002 Palmeiras Aquidauana Aquidauana 175 005 082 20°26’56 55°25’51 IO
11 02055003 Faz. Lajeado Aquidauana Dois I.Buriti 104 005 082 20°17’32 55°26’43 IO
12 02055007 Aquidauana Aquidauana Aquidauana 155 001 001 20°27’31 55°46’51 S
13 02055006 Aquidauana Aquidauana Aquidauana 155 293 293 20°27’11 55°40’15 S
14 02054009 Santa Elisa Aquidauana Terenos 411 001 082 20°29’26 54°52’18 IO
15 02154005 S. Francisco Brilhante Aquidauana 445 001 500 21°00’00 54°00’00 S
values for density of the stations were then comparedwith those recommended by the method to check theminimum density of the network.
ii) Minimum density for pluviometric stationsThe density of stations (area of km2 by number of stations)
was calculated for the region and compared with theminimum recommended by the Wmo (1994) (Ta-ble 3).
4. Results and Discussion
The hydrographic region of Mato Grosso do Sul oc-cupies an area of 173,874.68 km2, corresponding to 48% ofthe BAP. The Upper Paraguay Basin comprises an area cor-responding to half of the state. In the surrounding highlands(above altitude of 200 m) lie the sources of the main rivers
that make up the great plain, an area below altitude of200 m, with low drainage capacity, hence subject to majorflooding (Ishihara, 2014).
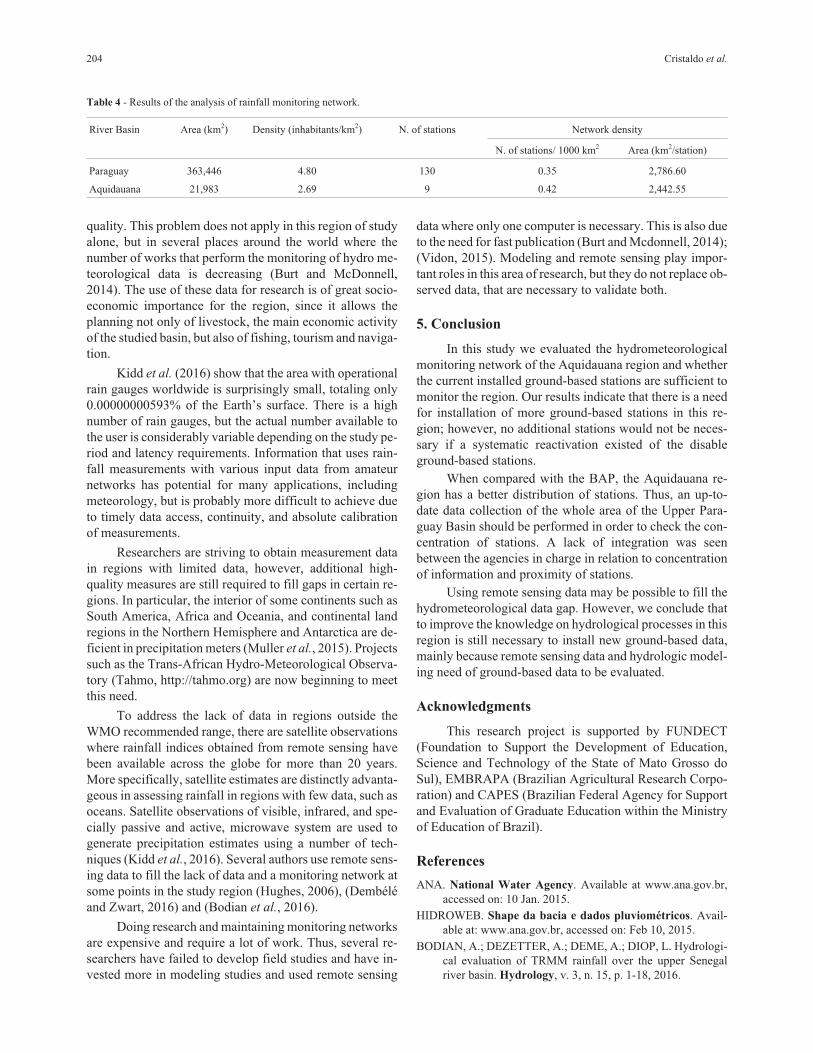
The studied area is located on the Miranda basin, thatbelongs to the BAP, specifically the upper sub-basin of theRiver Aquidauana, with an area of 21,983.00 km2 and apopulation of 46,998 inhabitants in 2014 (Ibge, 2015). Thepopulation density is 2.69 in habitants/km2. To calculatethe number of stations per km2, the nine operating stationsin the area were considered, excluding the deactivated sta-tions and those with missing data. Table 4 shows the resultsof this analysis.
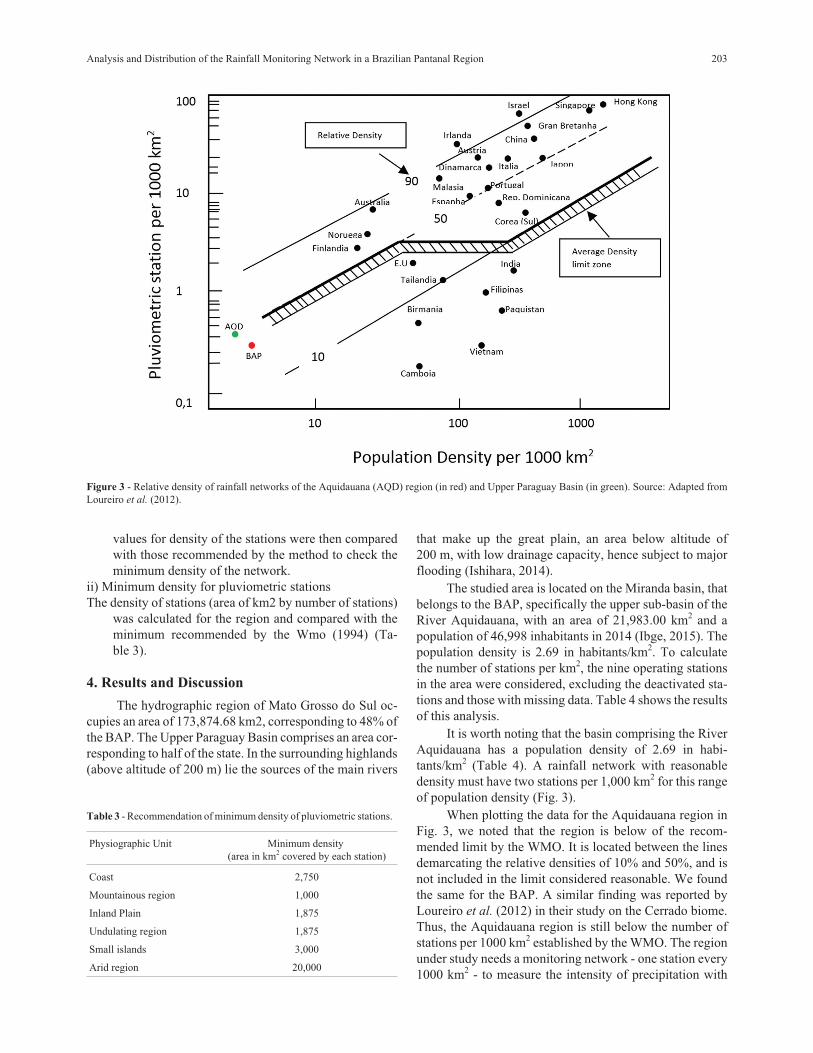
It is worth noting that the basin comprising the RiverAquidauana has a population density of 2.69 in habi-tants/km2 (Table 4). A rainfall network with reasonabledensity must have two stations per 1,000 km2 for this rangeof population density (Fig. 3).
When plotting the data for the Aquidauana region inFig. 3, we noted that the region is below of the recom-mended limit by the WMO. It is located between the linesdemarcating the relative densities of 10% and 50%, and isnot included in the limit considered reasonable. We foundthe same for the BAP. A similar finding was reported byLoureiro et al. (2012) in their study on the Cerrado biome.Thus, the Aquidauana region is still below the number ofstations per 1000 km2 established by the WMO. The regionunder study needs a monitoring network - one station every1000 km2 - to measure the intensity of precipitation with
Analysis and Distribution of the Rainfall Monitoring Network in a Brazilian Pantanal Region 203
Figure 3 - Relative density of rainfall networks of the Aquidauana (AQD) region (in red) and Upper Paraguay Basin (in green). Source: Adapted fromLoureiro et al. (2012).
Table 3 - Recommendation of minimum density of pluviometric stations.
Physiographic Unit Minimum density(area in km2 covered by each station)
Coast 2,750
Mountainous region 1,000
Inland Plain 1,875
Undulating region 1,875
Small islands 3,000
Arid region 20,000
quality. This problem does not apply in this region of studyalone, but in several places around the world where thenumber of works that perform the monitoring of hydro me-teorological data is decreasing (Burt and McDonnell,2014). The use of these data for research is of great socio-economic importance for the region, since it allows theplanning not only of livestock, the main economic activityof the studied basin, but also of fishing, tourism and naviga-tion.
Kidd et al. (2016) show that the area with operationalrain gauges worldwide is surprisingly small, totaling only0.00000000593% of the Earth’s surface. There is a highnumber of rain gauges, but the actual number available tothe user is considerably variable depending on the study pe-riod and latency requirements. Information that uses rain-fall measurements with various input data from amateurnetworks has potential for many applications, includingmeteorology, but is probably more difficult to achieve dueto timely data access, continuity, and absolute calibrationof measurements.
Researchers are striving to obtain measurement datain regions with limited data, however, additional high-quality measures are still required to fill gaps in certain re-gions. In particular, the interior of some continents such asSouth America, Africa and Oceania, and continental landregions in the Northern Hemisphere and Antarctica are de-ficient in precipitation meters (Muller et al., 2015). Projectssuch as the Trans-African Hydro-Meteorological Observa-tory (Tahmo, http://tahmo.org) are now beginning to meetthis need.
To address the lack of data in regions outside theWMO recommended range, there are satellite observationswhere rainfall indices obtained from remote sensing havebeen available across the globe for more than 20 years.More specifically, satellite estimates are distinctly advanta-geous in assessing rainfall in regions with few data, such asoceans. Satellite observations of visible, infrared, and spe-cially passive and active, microwave system are used togenerate precipitation estimates using a number of tech-niques (Kidd et al., 2016). Several authors use remote sens-ing data to fill the lack of data and a monitoring network atsome points in the study region (Hughes, 2006), (Dembéléand Zwart, 2016) and (Bodian et al., 2016).
Doing research and maintaining monitoring networksare expensive and require a lot of work. Thus, several re-searchers have failed to develop field studies and have in-vested more in modeling studies and used remote sensing
data where only one computer is necessary. This is also dueto the need for fast publication (Burt and Mcdonnell, 2014);(Vidon, 2015). Modeling and remote sensing play impor-tant roles in this area of research, but they do not replace ob-served data, that are necessary to validate both.
5. Conclusion
In this study we evaluated the hydrometeorologicalmonitoring network of the Aquidauana region and whetherthe current installed ground-based stations are sufficient tomonitor the region. Our results indicate that there is a needfor installation of more ground-based stations in this re-gion; however, no additional stations would not be neces-sary if a systematic reactivation existed of the disableground-based stations.
When compared with the BAP, the Aquidauana re-gion has a better distribution of stations. Thus, an up-to-date data collection of the whole area of the Upper Para-guay Basin should be performed in order to check the con-centration of stations. A lack of integration was seenbetween the agencies in charge in relation to concentrationof information and proximity of stations.
Using remote sensing data may be possible to fill thehydrometeorological data gap. However, we conclude thatto improve the knowledge on hydrological processes in thisregion is still necessary to install new ground-based data,mainly because remote sensing data and hydrologic model-ing need of ground-based data to be evaluated.
Acknowledgments
This research project is supported by FUNDECT(Foundation to Support the Development of Education,Science and Technology of the State of Mato Grosso doSul), EMBRAPA (Brazilian Agricultural Research Corpo-ration) and CAPES (Brazilian Federal Agency for Supportand Evaluation of Graduate Education within the Ministryof Education of Brazil).
References
ANA. National Water Agency. Available at www.ana.gov.br,accessed on: 10 Jan. 2015.
HIDROWEB. Shape da bacia e dados pluviométricos. Avail-able at: www.ana.gov.br, accessed on: Feb 10, 2015.
BODIAN, A.; DEZETTER, A.; DEME, A.; DIOP, L. Hydrologi-cal evaluation of TRMM rainfall over the upper Senegalriver basin. Hydrology, v. 3, n. 15, p. 1-18, 2016.
204 Cristaldo et al.
Table 4 - Results of the analysis of rainfall monitoring network.
River Basin Area (km2) Density (inhabitants/km2) N. of stations Network density
N. of stations/ 1000 km2 Area (km2/station)
Paraguay 363,446 4.80 130 0.35 2,786.60
Aquidauana 21,983 2.69 9 0.42 2,442.55
BURT, T.P.; MCDONNELL, J.J. Whither field hydrology? Theneed for discovery science and outrageous hydrological hy-potheses. Water Resources Research, v. 51, n. 10,p. 5919-5928, 2015.
DEMBÉLÉ, M.; ZWART, J.S. Evaluation and comparison of sat-ellite-based rainfall products in Burkina Faso, West Africa.International Journal of Remote Sensing, v. 37, n. 17,p. 3995-4014, 2016.
HUGHES, D.A. Comparasion of satellite rainfall data with obser-vations from gauging station networks. Journal of Hydrol-
ogy, v. 327, n. 10, p. 399-410, 2006.
IBGE. Brazilian Institute of Geography and Statistics. Avail-able at < http://cidades.ibge.gov.br/xtras/perfil.php?codmun= 500110, accessed on: Feb 13, 2015.
ISHIHARA, J.H.; FERNANDES, L.L.; DUARTE, A. M.;DUART, A.RR.C.; PONTE, M.X.; LOUREIRO, G. E.Quantitative and Spatial Assessment of Precipitation in theBrazilian Amazon. Brazilian Journal of Water Resources,v.19, n. 1, p. 29-39, 2014.
KIDD, C.; BECKER, A.; HUFFMAN, J.G.; MULLER, L.C.;JOE, P.; SKOFRONICK-JACKSON, G.; KIRSCHBAUM,B.D. So, How Much of the Earth’s Surface is Covered byRain Gauges?. American Meteorological Society, v. 10, n.1, p. 69-78, 2016.
LOUREIRO, G.E.; VIEIRA, A.S.A.; MIRANDA, H.K.S. Análiseda Rede Pluviométrica da Região Hidrográfica Tocantins-Araguaia e sua Otimização. Brazilian Journal of Water
Resources, v. 21, n. 2, p.1-9, 2012.OLIVEIRA, P.T.S.; LEITE, M.B.; MATTOS, T.; NEARING,
M.A.; SCOTT, R.L.; WENDLAND, E. Groundwater re-charge decrease with increased vegetation density in the bra-zilian cerrado. Ecohydrol, v. 10, n. 1, p. 1-8, 2016.
MULLER, C.L.; CHAPMAN, L.; JOHNSTON, S.; KIDD, C.;ILLINGWORTH, S.; FOODY, G.; OVEREEM, A.;LEIGH, R.R. Crowdsourcing for climate and atmosphericsciences: Current status and future potential. Int. J.Climatol, v. 35, n. 11, p. 3185-3203, 2015.
WMO. World Meteorological Organization. Genebra: WMO,n. 168, ed. 5, 1994.
TUCCI, C.E.M.; COLLISHONN, W. Coupled Hydrologic-Hydraulic Modeling of the Upper Paraguay River Basin.Journal of Hydrologic Engineering. Reston, v. 17, n. 3, p.635-646, 2012.
WILLINK, W.P.; CHERNOFF, B.; ALONSO. E.L.;MONTAMBAULT, R.J.; LOURIVAL, R. A Biological As-sessment of the Aquatic Ecosystems of the Pantanal, MatoGrosso do Sul, Brasil. Washington: RAP Bulletin of Bio-
logical Assessment, n. 18, p. 93-98, 2009.
This is an Open Access article distributed under the terms of the Creative Commons AttributionNon-Commercial License which permits unrestricted non-commercial use, distribution, andreproduction in any medium provided the original work is properly cited.
Analysis and Distribution of the Rainfall Monitoring Network in a Brazilian Pantanal Region 205