analysis and forecast of employment and building …
TRANSCRIPT

ANALYSIS AND FORECAST OF EMPLOYMENT AND BUILDING SPACE DEMAND AND STRATEGIC POLICY
RECOMMENDATIONS FOR GREATER AIRPARK STUDY AREA
A Report to
The City of Scottsdale
from
GRUEN GRUEN + ASSOCIATES Urban Economists, Market Strategists & Land Use/Public Policy Analysts
C1252
March 2009

ANALYSIS AND FORECAST OF EMPLOYMENT AND BUILDING SPACE DEMAND AND STRATEGIC POLICY
RECOMMENDATIONS FOR GREATER AIRPARK STUDY AREA
A Report to
The City of Scottsdale
from
GRUEN GRUEN + ASSOCIATES Urban Economists, Market Strategists & Land Use/Public Policy Analysts
C1252
March 2009
APPLYING KNOWLEDGE CREATING RESULTS
ADDING VALUE
© Copyright 2009 Gruen Gruen + Associates. Do not reproduce without written permission from Gruen Gruen + Associates.

i
TABLE OF CONTENTS
Chapter Page ES EXECUTIVE SUMMARY AND RECOMMENDATIONS.............................................1 INTRODUCTION AND PURPOSE .....................................................................................1 THE STRUCTURE OF THE EMPLOYMENT BASE OF THE GREATER AIRPARK STUDY AREA AND CITY OF SCOTTSDALE ......................1 CHARACTERISTICS OF LAND USE AND BUILT SPACE WITHIN GREATER AIRPARK STUDY AREA.................................................2 Summary of Make-up and Status of Land Development ...........................................2 Growth in Supply of Built Space ....................................................................................2 Shifts in Make-up of Building Space Inventory............................................................3 FINDINGS AND CONCLUSIONS DRAWN FROM SURVEYS AND INTERVIEWS .............................................................3 SURVEYS......................................................................................................................................3 INTERVIEWS .............................................................................................................................5 Competitive Office Market..............................................................................................5 Competitive Market for Flex-type Uses.........................................................................5 Comparative Advantages .................................................................................................5 Primary Disadvantages .....................................................................................................6 FORECAST OF THE STRUCTURE AND SIZE OF THE EMPLOYMENT BASE OF THE GREATER AIRPARK STUDY AREA ...................6 CITY OF SCOTTSDALE EMPLOYMENT FORECAST ................................................7 GREATER AIRPARK STUDY AREA EMPLOYMENT FORECAST: 2007-2020 ....7 Services................................................................................................................................8 Finance, Insurance and Real Estate................................................................................8 Retail Trade ........................................................................................................................8 Manufacturing ....................................................................................................................9 Construction.......................................................................................................................9 Wholesale Trade ................................................................................................................9 Information ........................................................................................................................9 Transportation and Warehousing ...................................................................................9 Proportion of Total Greater Airpark Study Area Employment ................................9 FORECAST BUILDING SPACE DEMAND AND LAND REQUIREMENTS........10 Distribution of Employment by Economic Sector into Type of Building Space...10 Forecast Employment-Induced Building Space Demand ..........................................10 Forecast of Land Needed to Accommodate Forecast Building Space Demand ....11
ii
TABLE OF CONTENTS, Continued
Chapter Page STRATEGIC CONCLUSIONS AND RECOMMENDATIONS....................................13 CONCLUSIONS FROM 1999 GG+A REPORT STILL VALID AND IMPORTANT TODAY......................................................................13 PLANNING POLICY SHOULD ENCOURAGE RELATIVELY HIGH-DENSITY HOUSING INTEGRATED INTO DIFFERENTIATED MIXED-USE DEVELOPMENTS.....................................14 PLANNING POLICY SHOULD ENCOURAGE ASSEMBLAGE OF INEFFICIENT, SMALL PARCELS AND REPLACEMENT OF OBSOLETE .. STRUCTURES IN CORE OF GREATER AIRPARK STUDY AREA..........................14 AUGMENT THE STRENGTH AND DIVERSITY OF IDENTIFIED MIXED-USE ACTIVITY CENTERS ........................15 ENHANCE WESTWORLD AND BETTER LINK RECREATIONAL RESOURCES IN BELL ROAD AREA TO EACH OTHER AND TO OTHER ACTIVITY CENTERS WITHIN GREATER AIRPARK STUDY AREA ....................15 IMPROVE INFRASTRUCTURE, INCLUDING BROADBAND ACCESS ................16 STUDY HOW TO PRESERVE BENEFITS INDUCED BY AUTOMOTIVE DEALERSHIPS..............................................................16 CITY-OWNED LAND..............................................................................................................16 ADDITIONAL POLICY IMPLICATIONS..........................................................................17 I INTRODUCTION AND DESCRIPTION OF STUDY AREA ......................................19 INTRODUCTION AND PURPOSE .....................................................................................19 STUDY AREA .............................................................................................................................19 WORK COMPLETED ..............................................................................................................21 REPORT ORGANIZATION ..................................................................................................21 II THE STRUCTURE OF THE EMPLOYMENT BASE OF THE GREATER AIRPARK STUDY AREA AND CITY OF SCOTTSDALE ......................23 SUMMARY…………………………………………………………………………...23 COMPOSITION OF GREATER AIRPARK EMPLOYMENT ......................................24

iii
TABLE OF CONTENTS, Continued
Chapter Page GREATER AIRPARK EMPLOYMENT TRENDS: 1995-2007.......................................26 Shift in Composition of Greater Airpark Employment Base: 1995 to 2007 ...........28 THE GREATER AIRPARK’S POSITION WITHIN THE SCOTTSDALE EMPLOYMENT BASE...................................................29 City of Scottsdale Employment Trends: 1995-2007....................................................30 Proportion of Scottsdale Employment Comprised by Greater Airpark Study Area: 1995-2007 ..............................................31 III CHARACTERISTICS OF LAND USE AND BUILT SPACE WITHIN GREATER AIRPARK STUDY AREA .......................33 INTRODUCTION......................................................................................................................33 SUMMARY…………………………………………………………………………...33 LAND USE CHARACTERISTICS .........................................................................................34 BUILDING SPACE SUPPLY TRENDS WITHIN GREATER AIRPARK STUDY AREA................................................................37 Office Space Supply Conditions .....................................................................................37 Retail Space Supply Conditions.......................................................................................38 Industrial Space Supply Conditions................................................................................39 New Construction and Absorption Trends ..................................................................40 DENSITY CHARACTERISTICS OF EXISTING SUPPLY.............................................41 SHIFT IN COMPOSITION OF BUILDING SPACE INVENTORY ...........................44 IV FINDINGS AND CONCLUSIONS DRAWN FROM SURVEYS AND INTERVIEWS .............................................................44 SUMMARY…………………………………………………………………………...44 HOSPITALITY SURVEY .........................................................................................................44 EMPLOYER SURVEY ..............................................................................................................45 SCOTTSDALE AREA CHAMBER OF COMMERCE AIRPARK BUSINESS NEEDS SURVEY..................................................45 FINDINGS AND CONCLUSIONS DRAWN FROM INTERVIEWS..........................46

iv
TABLE OF CONTENTS, Continued
Chapter Page THE PRIMARY MARKET AREA FOR OFFICE SPACE...............................................46 GEOGRAPHIC ORIGINS OF OFFICE SPACE USERS.................................................48 TYPES OF OFFICE SPACE USERS ATTRACTED .........................................................48 COMPETITIVE POSITION OF GREATER AIRPARK STUDY AREA FOR ATTRACTING OFFICE SPACE USERS......................................48 Primary Comparative Advantages ..................................................................................48 Primary Disadvantages .....................................................................................................49 THE PRIMARY MARKET AREA FOR FLEX SPACE....................................................49 GEOGRAPHIC ORIGINS OF FLEX TYPE SPACE USERS.........................................50 TYPES OF FLEX TYPE SPACE USERS ATTRACTED..................................................50 COMPETITIVE POSITION OF AIRPARK AREA FOR ATTRACTING FLEX TYPE SPACE USERS ..............................................50 Primary Comparative Advantages ..................................................................................50 Primary Disadvantages .....................................................................................................50 V FORECAST OF THE STRUCTURE AND SIZE OF THE EMPLOYMENT BASE OF THE GREATER AIRPARK STUDY AREA ...................51 INTRODUCTION......................................................................................................................51 SUMMARY…………………………………………………………………………...51 FORECAST OF CITY OF SCOTTSDALE EMPLOYMENT BY LAND USE...........52 FORECAST OF CITY OF SCOTTSDALE EMPLOYMENT BY ECONOMIC SECTOR......................................................................53 FORECAST OF GREATER AIRPARK STUDY AREA EMPLOYMENT: 2007-2020........................................................................55 Services................................................................................................................................57 Finance, Insurance and Real Estate................................................................................57 Retail Trade ........................................................................................................................58 Manufacturing ....................................................................................................................58 Construction.......................................................................................................................58 Wholesale Trade ................................................................................................................59 Information ........................................................................................................................59 Transportation and Warehousing ...................................................................................59

v
TABLE OF CONTENTS, Continued
Chapter Page SHIFT IN SHARE OF EMPLOYMENT BASE..................................................................59 VI FORECAST DEMAND FOR BUILDING SPACE AND THE AMOUNT OF LAND NEEDED TO ACCOMMODATE FORECAST DEMAND FOR SPACE....62 INTRODUCTION......................................................................................................................62 SUMMARY…………………………………………………………………………...62 SPACE USAGE CHARACTERISTICS OF GREATER AIRPARK BUSINESSES ....63 Historical Perspective .......................................................................................................63 Current Spatial Implications ............................................................................................63 BUILDING SPACE DEMAND FORECAST......................................................................65 POTENTIAL FUTURE SUPPLY OF SPACE .....................................................................66 ESTIMATE OF THE AMOUNT OF LAND POTENTIALLY ABSORBED BY FORECAST DEMAND FOR BUILDING SPACE............................68

vi
LIST OF TABLES
Table Page II-1 Comparison of Share of Industry Employment in 2007........................................................25 II-2 Greater Airpark Study Area Employment by Sector: 1995-2007 .........................................26 II-3 Number of Business Establishments With Five or More Employees in Airpark Study Area .....................................................................28 II-4 Shift in Percentage of Total Employment Within Greater Airpark Study Area: 1995-2007 ......................................................................29 II-5 City of Scottsdale Employment by Sector: 1995-2007 ...........................................................30 II-6 Shift in Percentage of Total Employment Within City of Scottsdale: 1995-2007 .............31 II-7 Share of Total Scottsdale Employment Comprised by Greater Airpark Study Area: 1995-2007 .........................................................32 III-1 Land Use Within Greater Airpark Study Area.........................................................................35 III-2 Office Space Supply Trends in Greater Airpark Study Area: 1999-2008 ............................37 III-3 Retail Space Supply Trends in Greater Airpark Study Area: 1999-2008 .............................38 III-4 Industrial/Flex Space Supply Trends in Greater Airpark Study Area: 1999-2008.............39 III-5 Construction and Space Absorption Trends Within Study Area: 1999-2008.....................40 III-6 Average Floor-Area-Ratios and Employment Densities for Existing Buildings Within Greater Airpark Study Area .................................41 III-7 Estimated Amount and Distribution of Building Space by Type of Building in Greater Airpark Study Area: 1995-2007 ...............................43 III-8 Proportion of Total Scottsdale Supply Comprised by Greater Airpark ..............................41 IV-1 Competing Office Supply Locations .........................................................................................47 V-1 Employment Forecast by Land Use for the City of Scottsdale: 2005-2030........................53 V-2 Forecast of City of Scottsdale Employment by Sector: 2007-2020......................................54 V-3 Components of Greater Airpark Employment Growth: 1995-2007 ...................................55 V-4 Forecast of Greater Airpark Employment: 2007 – 2020 .......................................................56 V-5 Projected Share of Greater Airpark Employment Comprised by Each Sector..................60

vii
LIST OF TABLES, Continued
Table Page V-6 Projected Shift in Proportion of Total Scottsdale Employment Comprised by Greater Airpark: 2007-2020...................................61 VI-1 Distribution of Greater Airpark Employment by Type of Building Space.........................64 VI-2 Projected Net Additional Workforce and Space Demand Within the Greater Airpark: 2007-2020.................................................65 VI-3 Future Supply of Space in Greater Airpark Study Area .........................................................67 VI-4 Estimated Amount of Land Necessary to Accommodate Forecast Building Space Demand in Greater Airpark Study Area: 2007-2020...................................68 VI-5 Estimated Relationship Between Land Supply and Land Demand in Greater Airpark Study Area: 2007-2020…………………………………...69
LIST OF MAPS
Map Page I-1 Greater Airpark Study Area ........................................................................................................20 III-1 Vacant Land by Ownership Type ..............................................................................................36
LIST OF FIGURES
Figure Page
II-1 Share of Greater Airpark Employment Base Comprised by Industry Group: 1995-2007…………………………………………………………..23
III-1 Amount of New Building Space Delivered in Past 10 Years. . . . . . . . . . . . . . . . . . . . .. 34 V-1 Historical and Forecast Greater Airpark Employment Growth………………………52
viii
ACKNOWLEDGEMENTS While the authors take 100 percent responsibility for the content and conclusions of the study, the report could not have been prepared without the assistance of many others. It is not possible to cite all of those who have offered data and insights but we would like to thank the City of Scottsdale staff and the following individuals which provided data and participated in interviews. Moshe Barr, President, Advanced International Systems Andrew Bourne, CEO, Waypoint Technologies Robert Foster, General Manager, Fairmont Scottsdale Ken Gerard, Chief Financial Officer, Interface, Inc. Donn House, Managing Director, Hampton Group Jim Keeley, Founding Director, Colliers International Rick Kidder, President, Scottsdale Area Chamber of Commerce Debra Kuffner, Chief Operating Officer, Scottsdale Area Chamber of Commerce Mark Linsalata, Principal, Lee & Associates Bob Mayhew, Vice President, DMB Associates Scott Nelson, Vice President of Development, Westcor Mike Pacheco, Real Estate Director, Van Tuyl Auto Investment Group Tim Phillips, Associate, Lee & Associates Ulrike Sailer, Director of Global Business Development and Strategy, American Museum of Natural History Rachel Sacco, President and CEO, Scottsdale CVB Peter Wolff, Executive Vice President, Wolff Companies City of Scottsdale Staff Robert Cafarella, Preservation Director Brian Dygert, General Manager, WestWorld Laurel Edgar, Revitalization Manager Kroy Ekblaw, Executive Assistant of Strategic Projects Jennifer Graves, Economic Development Specialist Scott Gray, Aviation Director, Scottsdale Airport Harry Higgins, Senior Planner Mark Hunsberger, Revitalization Specialist Kathy O’Connor, Tourism Development Manager Erin Perreault, Principal Planner Bryan Sarchi, Planner Harold Stewart, Acting General Manager, Economic Vitality Mary Troyan, Planner Maricopa Association of Governments Rita Walton, Socioeconomic Modeling Analyst

ANALYSIS AND FORECAST OF EMPLOYMENT AND BUILDING SPACE DEMAND AND STRATEGIC POLICY RECOMMENDATIONS FOR GREATER AIRPARK STUDY AREA
GRUEN GRUEN + ASSOCIATES PAGE 1
EXECUTIVE SUMMARY AND RECOMMENDATIONS
INTRODUCTION AND PURPOSE In 1999, Gruen Gruen + Associates (GG+A) conducted an analysis and forecast of the economic base of Scottsdale with a particular emphasis on the combined Airpark and Sonoran Regional Core character areas. In late 2008 the City of Scottsdale retained GG+A to conduct economic base analysis and prepare new forecasts of employment by economic sector and potential building space demand by type of land use for the Greater Airpark Study Area. GG+A was also asked to identify the strategic policy implications for the preparation of the Greater Airpark Community Area Plan. This report presents the results of the analysis, forecasts, and strategic recommendations. THE STRUCTURE OF THE EMPLOYMENT BASE OF THE GREATER AIRPARK STUDY AREA AND CITY OF SCOTTSDALE Total private sector employment within the Greater Airpark Study Area grew by 112 percent over the past twelve years, increasing by approximately 22,500 jobs from 20,000 in 1995 to 42,500 jobs in 2007. This represents a high compounded average annual growth rate of approximately 6.5 percent. Economic sectors comprising much of the employment growth include finance, insurance and real estate, professional and business services, and retail trade. Collectively, these sectors accounted for 14,500 additional jobs or 65 percent of total employment growth that occurred between 1995 and 2007. The number of business establishments (with five or more employees) in the Greater Airpark Study Area grew from 1995 through 2007 by approximately 500 or 64 percent, from 774 establishments in 1995 to 1,268 establishments in 2007. The number of establishments increased the most in the professional and business service sectors, retail trade, and finance, insurance and real estate sectors. Since 1995, the number of wholesale trade establishments declined and since 2000 the number of manufacturing establishments declined. Over the past 12 years, the employment base in the Greater Airpark Study Area has shifted such that industries concentrated in the production and trade of goods no longer constitute as significant of a component of the economic base. In 1995, the Greater Airpark Study Area accounted for approximately 18 percent of all employment within the City of Scottsdale. Today, more than one in every four jobs, or 28 percent of the total jobs within the City of Scottsdale, are located within the Study Area. All but two industry sectors (leisure and hospitality and agriculture, mining and utilities) within the Greater Airpark comprise a larger share of their respective employment within the City than they did in 1995.

ANALYSIS AND FORECAST OF EMPLOYMENT AND BUILDING SPACE DEMAND AND STRATEGIC POLICY RECOMMENDATIONS FOR GREATER AIRPARK STUDY AREA
GRUEN GRUEN + ASSOCIATES PAGE 2
CHARACTERISTICS OF LAND USE AND BUILT SPACE WITHIN GREATER AIRPARK STUDY AREA Summary of Make-up and Status of Land Development The Greater Airpark Study Area includes a total of approximately 5,530 acres of land (including roadways and open space). Non-residential commercial land uses account for approximately 3,300 acres or 60 percent of the total land area. The primary non-residential land uses within the Study Area are approximately 60 percent built-out. The vast majority of undeveloped vacant land consists of “mixed-use neighborhoods” under the General Plan, generally encompassing most State-owned land both north and south of the Loop 101. The mixed-use neighborhood classification includes residential uses. A total of approximately 1,344 acres of non-residential commercial land within the Study Area is currently vacant. The three primary General Plan land use designations of commercial, employment and office make up only 1,817 developed acres and 423 acres of vacant land. Of the nearly 130 acres of land categorized as office under the General Plan, over 96 percent has been built-out so that less than five acres of land classified as office is currently vacant. Of the nearly 1,506 acres of land classified under the General Plan as employment, nearly 76 percent of the land is built-out so that 367 acres of vacant land is available for development of employment (industrial and office) uses. Of the 602 acres of land classified under the General Plan as commercial, 91.5 percent of the land is built-out so that 51 acres of vacant land is available for use. The historical Airpark “core” area (south of Frank Lloyd Wright) contains less than 105 acres of available land, most of which is located in small non-contiguous sites. Growth in Supply of Built Space The supply of office space within the Greater Airpark Study Area has grown by more than 4.4 million square feet since 1999, representing a 160 percent increase over the past ten years. The current inventory of office space is estimated to approximate 7.2 million square feet, 23 percent or 1.7 million square feet of which is reported to be currently vacant. The supply of retail space within the Greater Airpark Study Area has grown by approximately 1.5 million square feet since 1999, representing a 76 percent increase over the past ten years. The current inventory of space approximates 3.5 million square feet. The retail vacancy rate has increased from nearly zero in 1999 and 2000 to approximately six percent in 2008 The supply of flex/industrial space (including warehouse with office and warehouse with retail uses) within the Greater Airpark Study Area currently approximates 6.4 million square feet. Compared to office and retail uses, the industrial space supply has grown less substantially over the past ten years increasing by approximately 1,360,000 square feet or 27

ANALYSIS AND FORECAST OF EMPLOYMENT AND BUILDING SPACE DEMAND AND STRATEGIC POLICY RECOMMENDATIONS FOR GREATER AIRPARK STUDY AREA
GRUEN GRUEN + ASSOCIATES PAGE 3
percent. From 1999 through 2008, the industrial vacancy rate increased from a relatively low 7.7 percent to approximately 14 percent as the amount of vacant space increased by a half million square feet. Approximately 9.4 million square feet of office, retail, and industrial space has been built within the Greater Airpark Study Area over the past ten years. Office space has comprised the majority of new construction activity, representing 57 percent of all building space added between 1999 and 2008. Shifts in Make-up of Building Space Inventory Smaller warehouse-flex buildings have historically been the predominant type of commercial building space located within the Greater Airpark Study Area. Just as the employment base shifted to professional and financial service sectors in recent years, so has the composition of building space. In 1995, warehouse-flex buildings represented nearly 43 percent of all building space located within the Study Area while traditional warehouse and industrial building uses accounted for an additional 22 percent of the total inventory. Office buildings, totaling less than 1.2 million square feet of space, represented only 19 percent of all building space in 1995. In 2007, office buildings represented approximately 34 percent of all building space within the Study Area. In 2007, warehouse-flex space comprised a smaller proportion than office, or 29 percent of all space within the Study Area. FINDINGS AND CONCLUSIONS DRAWN FROM SURVEYS AND INTERVIEWS SURVEYS The review of a 2008 Scottsdale Area Chamber of Commerce survey and interviews indicates the continued validity of findings of surveys GG+A designed and analyzed in its 1999 report. Findings and conclusions from the analysis of the 1999 hotel survey included the following:
• The hotels indicated that the percentage of total visitors that are estimated to fly in and out of the Scottsdale Airport averages 3.1 percent;
• Special events including NASCAR, Barrett Jackson Car Auction, Spring Training,
PGA Golf, and the Arabian Horse Show are important to generating hotel room night demand; and
• Of the employees of hotels north of Cactus Road, 72 percent reside in Phoenix and
17 percent in Scottsdale.

ANALYSIS AND FORECAST OF EMPLOYMENT AND BUILDING SPACE DEMAND AND STRATEGIC POLICY RECOMMENDATIONS FOR GREATER AIRPARK STUDY AREA
GRUEN GRUEN + ASSOCIATES PAGE 4
Findings and conclusions drawn from the 1999 employer survey included the following:
• The primary reason firms decide to locate in the Study Area relates to proximity to desirable residential areas in north Scottsdale and quality of life factors;
• Markets and customers served typically are outside of the Study Area;
• Businesses operated out of a diverse set of building types, and performed a wide
variety of functions;
• About 69 percent of the firms in the sample leased or subleased their facilities, while 31 percent owned their facilities;
• Employee density ratios averaged 800 square feet per employee overall and 1,388
gross square feet per on-site wholesale/retail trade employee, 573 square feet for services firms and 554 square feet per employee for manufacturing firms; and
• About one-half of the employees working in the Airpark and Sonoran Regional Core
character areas resided in the City of Phoenix, while 31 percent resided in the City of Scottsdale and five percent each in the cities of Glendale and Mesa.
Findings drawn from a 2008 Scottsdale Area Chamber of Commerce survey include the following:
• Approximately 83 percent of employees live outside of the City of Scottsdale with approximately 40 percent of commuters originating from residences in the East Valley, 40 percent from Phoenix, and about 20 percent from the West Valley;
• Compared to GG+A survey findings in 1999, a higher proportion of employees live
outside of Scottsdale than 10 years ago; • Accessibility to labor is a key requirement and advantage;
• Transportation and traffic issues are of primary importance with 63 percent of
respondents indicating a preference for improved public transportation options, including an increase in bus routes and the frequency of bus service, dedicated street car/trolley service, and dedicated bus rapid transit lines along Highway 101. Approximately 65 percent of respondents indicated the expansion of the freeway system as important to the growth of their businesses;
• Approximately 81 percent of respondents identified as important improvements in
telecommunications and broadband Internet access and other infrastructure;

ANALYSIS AND FORECAST OF EMPLOYMENT AND BUILDING SPACE DEMAND AND STRATEGIC POLICY RECOMMENDATIONS FOR GREATER AIRPARK STUDY AREA
GRUEN GRUEN + ASSOCIATES PAGE 5
• Approximately 49 percent of respondents indicated increasing options for workforce
housing as important to the growth of their businesses; and
• Factors influencing the location decision included: the image of Scottsdale and quality of life advantages; accessibility of the location; and proximity to residences of the decision-makers.
INTERVIEWS Competitive Office Market The market area within which office space in the Greater Airpark Study Area typically competes for office users includes:
• The Study Area; • Desert Ridge (Freeway 101 and Tatum) west of the Study Area; • The Deer Valley/Interstate 17 corridor; • The Kierland area; and • The Alter Group Riverwalk and Opus Group Pima Center located on land of the
Salt River Pima-Maricopa Indian Community along Loop 101. Competitive Market for Flex Uses For flex space, including high-technology manufacturing and combinations of assembly and services, the primary market area includes the Study Area as well as Deer Valley to the west, Tempe and Mesa to the south, and the Salt River Pima-Maricopa Indian Community lands. Comparative Advantages The following comparative advantages apply to the Study Area:
• Accessibility to Freeway Loop 101, Sky Harbor Airport, and Scottsdale Airport; • Proximity to housing locations of decision-makers and a large commute shed,
providing excellent access to a large labor base, including affordable housing in northeast Phoenix1;
• Proximity to a large base of high-quality support services and amenities, including
lodging and dining options;
1 According to MAG, the population of the northeast region of Phoenix (generally north of Bell Road and east of Cave Creek Road) is projected to grow by more than double (122%) between 2010 and 2030 increasing by approximately 113,000 persons. The number of dwelling units is projected to grow by 130 percent or approximately 47,000 during this same period.

ANALYSIS AND FORECAST OF EMPLOYMENT AND BUILDING SPACE DEMAND AND STRATEGIC POLICY RECOMMENDATIONS FOR GREATER AIRPARK STUDY AREA
GRUEN GRUEN + ASSOCIATES PAGE 6
• A prestigious image in a safe and secure environment offering “quality of life” advantages; and
• A location within an agglomeration or “critical mass” that helps businesses attract
and retain labor and operate cost effectively and productively. Primary Disadvantages The primary disadvantages of the Study Area, especially the traditional Airpark core, relate to a limited supply of available land for development; and traffic congestion due in part to the physical orientation of the Scottsdale Airport, which impedes east-west vehicular traffic flows. A perceived constraint relates to the entitlement process, and the potential for higher costs and uncertainty due to “last-minute” project negotiations and requests. In addition, the interviews suggest that infrastructure for telecommunications, broadband access, and transportation could be enhanced. For those types of industrial users that employ lower skilled workers, access to labor is a particular disadvantage. Land and building space rental costs are too high to support warehousing activities. The consideration of advantages and disadvantages indicates the outflow of smaller, lower margin wholesaler and industrial users and inflow of high technology users can be expected. Many flex space uses will include a high component of office space and research and development functions. FORECAST OF THE STRUCTURE AND SIZE OF THE EMPLOYMENT BASE OF THE GREATER AIRPARK STUDY AREA Maricopa County Association of Governments projects that Scottsdale’s employment base will grow by approximately 70,000 jobs over the 25-year period between 2005 and 2030 increasing at an average annual rate of 1.3 percent. Between 2005 and 2020, total Scottsdale employment is projected to grow at an average annual rate of approximately 1.7 percent. Office land uses are projected to experience the highest rate of employment growth, increasing by approximately 33,400 jobs at an average annual growth rate of 1.8 percent. Industrial land uses are projected to grow at 1.0 percent annually, increasing by approximately 5,500 jobs. A significant difference exists between the global economic conditions that prevailed over the last 10 years and the major global recessionary conditions that exist today. In December 2008, the United States lost more jobs than in any prior December since 1945 and the gross domestic products of many countries are declining or increasing at a slower rate. While we expect that the recession will end and growth will resume, the scale of the recession may

ANALYSIS AND FORECAST OF EMPLOYMENT AND BUILDING SPACE DEMAND AND STRATEGIC POLICY RECOMMENDATIONS FOR GREATER AIRPARK STUDY AREA
GRUEN GRUEN + ASSOCIATES PAGE 7
alter the relative rate of growth of many sectors as consumers and investors adjust their behavior. Therefore, particularly as relates to fast-growing sectors such as finance, insurance and real estate, we are less certain about the timing and rates of growth shown in the present forecast than was the case in the forecast we prepared 10 years ago. We believe Maricopa County Association of Governments will adjust its forecasts after the 2010 Census and that following the revised forecast, it will be worthwhile to review the forecasts presented in this report. CITY OF SCOTTSDALE EMPLOYMENT FORECAST Based on a projected annual growth rate of 1.7 percent, total Scottsdale employment is forecast to increase by approximately 38,000 jobs from 157,000 in 2007 to 195,000 in 20202. Office-using industry sectors such as finance, insurance, and real estate, professional services, and information are forecast to experience the highest rate of growth while retail sectors such as retail trade, personal services, and hospitality are projected to experience the lowest rates of growth. The projections for the City indicate the employment base will continue to shift away from sectors related to the production, movement and sale of goods towards the financial and service-related industries. The professional service and finance, insurance and real estate sectors are forecast to grow by approximately 16,400 jobs, representing approximately 38 percent of the employment base in 2020. The retail trade sector is projected to grow at 1.2 percent annually, increasing by approximately 3,000 jobs over the next 13 years. At projected annual growth rates of 1.4 to 1.5 percent, the construction, manufacturing, wholesale trade and transportation and distribution sectors are forecast to grow collectively by approximately 6,300 jobs between 2007 and 2020. Education and health services employment is projected to grow at an annual rate of 1.8 percent, increasing from a current base of approximately 18,900 jobs to 23,700 jobs by 2020. Leisure and hospitality employment is projected to grow modestly at 1.4 percent annually, increasing by approximately 3,900 jobs between 2007 and 2020. GREATER AIRPARK STUDY AREA EMPLOYMENT FORECAST: 2007-2020 Total Greater Airpark Study Area employment is projected to grow at an annual rate of 2.1 percent between 2007 and 2020, increasing by approximately 13,000 jobs or 31 percent. Employment in many economic sectors, especially construction and in many segments of finance, insurance and real estate and services, may have decreased since 2007. These sectors could experience a decrease in employment from 2008 through 2010. It will therefore take some time to catch up to where employment was in 2007.
2 Total industry employment within the City of Scottsdale (currently estimated at 157,000 jobs) is lower than presented in MAG’s socioeconomic projections because (a) it does not include “work-at-home” employment, and (b) our review of MAG’s employer database indicates that some businesses actually located west of Scottsdale Road in Phoenix (for example) are described as being within the City of Scottsdale. The historical and current employment estimates by industry sector for the City of Scottsdale presented in this report do not include these businesses.

ANALYSIS AND FORECAST OF EMPLOYMENT AND BUILDING SPACE DEMAND AND STRATEGIC POLICY RECOMMENDATIONS FOR GREATER AIRPARK STUDY AREA
GRUEN GRUEN + ASSOCIATES PAGE 8
Services A key factor in the retention, expansion, and attraction of new businesses relates to the desirable quality of life that makes decision-makers want to work as well as live in Scottsdale. The large hospitality sector, including eating and drinking establishments and recreational facilities, contributes significantly to the quality of life advantage. The hospitality industry thus indirectly contributes to the growth of professional and business services. We forecast that the employment base will continue to evolve in favor of services. We predict, however, that Scottsdale and the Greater Airpark, in particular, will continue to experience faster job growth than population growth by drawing workers and serving markets well beyond the City’s boundaries. We project an average annual growth rate for professional and business services and education and health services of 3.25 percent. We project that other (personal) services will grow modestly at 1.5 percent annually, although still representing a very small component of the employment base by 2020 given the limited household population within the Greater Airpark. The growth rate assumptions equate to a projected addition of 6,200 jobs in the professional and business services, education and health services, and other services sector by 2020. Consistent with historical growth, we project that employment in the leisure and hospitality sector will continue to grow slowly, at 0.5 percent annually, resulting in approximately 200 added jobs by 2020. Finance, Insurance and Real Estate While the Airpark’s comparative advantages are significant for the finance, insurance and real estate sector, we believe the rate of growth of future employment in the sector will decline and that office space available near but outside of the Study Area will reduce the amount of employment captured within the Study Area. While much lower than the nearly 12 percent annual growth rate from 1995 through 2007, we still, however, project for the finance, insurance and real estate sector a strong annual employment growth rate of 3.25 percent over the longer-term. This growth rate results in an estimated increase of 3,200 jobs between 2007 and 2020 for the largest percentage growth of 52 percent (and second largest source of projected job growth). Retail Trade Historically, retail employment has grown by 7.2 percent annually. With residential growth slowing, the growth of retail supply competition outside the Study Area, and the increase in etailing, we forecast a 2.0 percent annual growth rate in employment for the retail sector. The retail trade sector is projected to grow by approximately 1,700 jobs or 29 percent. Manufacturing We project that the manufacturing base will continue to expand, but at a much lower rate than has historically been the case. At a one percent annual growth rate between 2007 and 2020, manufacturing employment is forecast to increase by approximately 700 jobs or 14

ANALYSIS AND FORECAST OF EMPLOYMENT AND BUILDING SPACE DEMAND AND STRATEGIC POLICY RECOMMENDATIONS FOR GREATER AIRPARK STUDY AREA
GRUEN GRUEN + ASSOCIATES PAGE 9
percent. Construction From 1995 through 2007, construction employment increased at an annual rate of 5.5 percent. It will take time for construction jobs to rebound from recent losses due to an increase in vacant existing space, curtailment in housing development, and other effects of the current recession. Construction employment is forecast to grow by only 330 jobs by 2020. Wholesale Trade The number of wholesale trade establishments has declined in the Study Area and historical employment growth of one percent is one of the slowest growing sectors. The interviews suggest wholesale trade firms will tend to locate in lower cost locations closer to labor sources. We forecast an average annual growth rate in wholesale trade employment of 0.5 percent. Information Information employment grew robustly from 1995 through 2000, but has since declined. The decline in this sector in more recent history has been largely attributable to several of the largest information businesses leaving the Study Area. Three large businesses in this sector – VODAVI Communication Systems (94 employees), Cox Communications (108 employees), and Tech USA (200 employees) – all relocated from the Study Area to other locations in Phoenix between 2000 and 2007. We forecast a growth rate of two percent annually. This projection results in approximately 300 added jobs in the information sector by 2020. Transportation and Warehousing Transportation and warehousing employment grew robustly off a low base until 2005, but has since declined significantly. We forecast annual employment growth of 1.5 percent. This reflects the finding that transportation and warehousing activities are likely to experience higher growth outside of Scottsdale. The transportation and warehousing employment that remains in Scottsdale is likely to be concentrated in the Study Area. Proportion of Total Greater Airpark Study Area Employment Professional and business services are forecast to increase by 3.8 percentage points to comprise approximately 27 percent of total Airpark Area employment in 2020. Finance, insurance and real estate employment is forecast to increase by 2.3 percentage points to nearly 17 percent of total employment. Retail employment is estimated to comprise the third largest source of employment at 13.8 percent. This represents virtually no change in the

ANALYSIS AND FORECAST OF EMPLOYMENT AND BUILDING SPACE DEMAND AND STRATEGIC POLICY RECOMMENDATIONS FOR GREATER AIRPARK STUDY AREA
GRUEN GRUEN + ASSOCIATES PAGE 10
share of employment in 2007. While forecast to decline as a share of total Study Area employment by 1.5 percentage points, manufacturing employment is forecast to comprise the fourth largest source of total employment at 10.1 percent in 2020. Construction employment is forecast to experience the largest downward shift of 2.1 percentage points to 9.4 percent. Leisure and hospitality employment is forecast to shift downward by 1.3 percentage points to 6.0 percent of total employment. Health and education services employment is forecast to increase by 0.6 percentage points to approximately 4.1 percent of total employment in 2020. Wholesale trade is forecast to decline by 1.2 percentage points to 5.2 percent of total employment. Information, transportation and warehousing, and other services are forecast to each approximate 2.3 to 2.7 percent of total Study Area employment in 2020. FORECAST BUILDING SPACE DEMAND AND LAND REQUIREMENTS Distribution of Employment by Economic Sector into Type of Building Space Office building uses within the Greater Airpark Study Area are currently estimated to house the largest percentage of the workforce at approximately 42 percent of the total employment. Retail building uses are estimated to include approximately 15 percent of total employment within the Greater Airpark. Nearly three-quarters of retail trade workers are currently estimated to utilize retail space. Another 14 percent of retail employment utilizes warehouse-flex space. The overall distribution of employment by space has shifted such that the percentage of the total employment base working in warehouse-flex space has declined to approximately 26 percent (from an estimated 53 percent in 1995). Industry sectors in which a considerable percentage of employees continue to work in warehouse-flex space include information (56%), manufacturing (55%), wholesale trade (45%), and construction (38%). A smaller but still significant share of service employees also work in warehouse-flex space. Approximately one-quarter of professional service employment, for example, is located in warehouse-flex space. Forecast Employment-Induced Building Space Demand For the period 2007 to 2020 approximately 7,190 office-space using workers are estimated to be added to the Greater Airpark Study Area employment base. This forecast employment growth is estimated to produce total gross demand of approximately 2.1 million square feet of additional office space. However, given the currently high office vacancy rate within the Study Area of approximately 23 percent, some of the future space demand will be met by existing supply alternatives. Approximately 1.7 million square feet of office space is reportedly vacant within the Study Area. We assume, for purposes of estimating the demand for new office space, that approximately 40 percent or 720,000 square feet of the existing vacant space must be absorbed before demand for additional new office product will be stimulated. This would equate to a decline in the office vacancy rate from a current 23 percent to approximately 13 percent. If absolute employment decreases significantly further, an increase in vacant space can be expected to occur and net new demand will be delayed.

ANALYSIS AND FORECAST OF EMPLOYMENT AND BUILDING SPACE DEMAND AND STRATEGIC POLICY RECOMMENDATIONS FOR GREATER AIRPARK STUDY AREA
GRUEN GRUEN + ASSOCIATES PAGE 11
As vacancies rise, rents will decrease and this will push out the time in which rents will rise to the point of supporting feasible new development. Net office space demand (gross space demand less absorption of existing space required to bring vacancy rate down to 13 percent) from 2007 through 2020 is forecast to approximate 1,362,000 square feet, or on average approximately 114,000 square feet annually. Approximately 1,830 retail-space using workers are projected to be added to the Greater Airpark Study Area employment base between 2007 and 2020. Because of the currently still low retail vacancy rate of 6.3 percent with approximately 220,000 square feet of space available, we perhaps optimistically assume all future demand for retail space will need to be met by new space. At an average employment density of 750 square feet per worker, the projected workforce growth results in total retail space demand 1,443,000 square feet. Average annual retail space demand is forecast to approximate 120,000 square feet. A total of approximately 3,660 industrial, warehouse, and flex space workers are projected to be added between 2007 and 2020. This forecast employment growth produces gross space demand of 1.3 million square feet of flex space, 127,000 square feet of industrial space and 331,000 square feet of warehouse space. Approximately 886,000 square feet of industrial space is reportedly vacant within the Greater Airpark for a vacancy rate of approximately 14 percent. While the current industrial vacancy rate and supply of available space is approximately four to six percent greater than has been historically the case, some of the existing industrial space is not likely to capture future space demand given its age and obsolescence. Assuming approximately 250,000 square feet of currently vacant industrial space is absorbed before new space is demanded (which equates to a decline in the vacancy rate from a current 14 percent to 10 percent), total net demand for all types of flex space is forecast to approximate 1.5 million square feet from 2007 to 2020. The demand forecast will not occur in such a linear fashion. The forecast above represents an average estimate over a longer period of time. As described in the body of the report, the office space capacity associated with already approved major development projects alone is comparable to the amount of forecast office space demand through 2020. The retail components of these mixed-use developments represent over one-half of retail space demand forecast through 2020. Forecast of Land Needed to Accommodate Forecast Building Space Demand Using the office space demand forecast of nearly 1.4 million square feet of space subject to a floor area ratio of 0.35 provides an estimate of the land needed to serve potential office space demand of 89 acres over the 12-year forecast. This represents the amount of land required to accommodate future office space demand at a density representative of existing development in the Study Area3. Should a higher floor-area ratio more typical of a higher-density environment be used, the amount of land needed to house office space would decrease. For example, corporate headquarter facilities or other major office uses would typically locate in multi-story office buildings having floor-area ratios substantially higher
3 Chapter III describes the density ratios estimated to apply to existing development within the Study Area.

ANALYSIS AND FORECAST OF EMPLOYMENT AND BUILDING SPACE DEMAND AND STRATEGIC POLICY RECOMMENDATIONS FOR GREATER AIRPARK STUDY AREA
GRUEN GRUEN + ASSOCIATES PAGE 12
than 0.35. Higher floor-area ratios of 0.5, 0.75 or even 1.0 would be achieved in more typical three to six story suburban office building configurations. A 0.5 average floor-area ratio would equate to 63 acres of land to accommodate forecast net office space demand. At a floor area ratio of 0.25, the forecast net retail space demand will require approximately 133 acres of land over the 12-year period. Should a higher floor area ratio of 0.35 be permitted or encouraged, forecast retail space demand would require approximately 95 additional acres of land. The demand forecast for industrial, warehouse, and flex space of approximately 1.5 million square feet, subject to floor area ratios of 0.30 to 0.35, indicates that approximately 102 acres of land will be required to accommodate future industrial space demand. At higher densities of 0.4 to 0.5, approximately 72 acres of industrial land would be required to accommodate forecast demand growth. Overall, an adequate amount of land exists to serve forecast demands beyond 2020. Land currently designated employment under the General Plan and zoned for industrial uses (I-1) can be expected to be developed in many cases for office uses. In addition, commercial uses can be expected to be developed on land not designated exclusively for commercial use. As indicated previously, a shortage of vacant land exists in the traditional core Airpark area, while ample land capacity exists north of the Central Arizona Project Canal.

ANALYSIS AND FORECAST OF EMPLOYMENT AND BUILDING SPACE DEMAND AND STRATEGIC POLICY RECOMMENDATIONS FOR GREATER AIRPARK STUDY AREA
GRUEN GRUEN + ASSOCIATES PAGE 13
STRATEGIC CONCLUSIONS AND RECOMMENDATIONS CONCLUSIONS FROM 1999 GG+A REPORT STILL VALID AND IMPORTANT TODAY The 1999 GG+A report included the following conclusions:
1. In order to avoid physical and economic obsolescence, it will be important for the city to encourage the appropriate scale and type of development. If development is too small or inappropriately designed to be viable past 2020, future owners will not have the economic strength to properly maintain either the physical structures or the activities they contain.
2. Over the time period of this study, there will be a shift from the
dominance of the lower intensity mixed use warehouse structure to more traditional suburban office buildings. . . . It will be important to encourage somewhat higher intensity development, which should include connectedness between buildings, the integration of support retail and services, and transportation management techniques such as bike routes and car pooling and/or shuttle service for nearby services. (page 5)
Accordingly, we supplement the original conclusions and recommendations as follows. OVERRIDING ECONOMIC DEVELOPMENT OBJECTIVE Wide concurrence exists among those we interviewed that Scottsdale’s positive image or cachet is being challenged by adjoining communities (both the City of Phoenix and Salt River Pima-Maricopa Indian Community) which are “piggybacking” on the “Scottsdale brand” and creating intense competition for users of space and for consumers. Many developments located on the Phoenix side of Scottsdale Road and on Indian Community land advertise their projects as located in Scottsdale. The City’s five-year strategic tourism plan also recognizes that Scottsdale is being challenged as a tourism destination. 3. The overriding economic development objective should be to maintain the positive
image and unique cachet of the Greater Airpark Study Area. This will require adopting land use and transportation policies that facilitate clustered networks or nodes of economic and social activity that encourage innovation and productivity efficiencies by leading-edge services, technology and other businesses. Policies also need to encourage the linkage of workplaces with shopping, recreational and residential uses.

ANALYSIS AND FORECAST OF EMPLOYMENT AND BUILDING SPACE DEMAND AND STRATEGIC POLICY RECOMMENDATIONS FOR GREATER AIRPARK STUDY AREA
GRUEN GRUEN + ASSOCIATES PAGE 14
PLANNING POLICY SHOULD ENCOURAGE RELATIVELY HIGH-DENSITY HOUSING INTEGRATED INTO MIXED-USE DEVELOPMENTS 4. Given the intense competition for office and retail uses that can be expected along
with traffic concerns, encourage relatively high-density housing integrated into mixed-use developments at locations such as along Loop 101 interchanges and other locations which will (a) facilitate efficient, higher density development patterns, (b) allow the private market to replace obsolete building space, and (c) reduce reliance on the automobile. Higher-density housing will provide comparative advantages to office-using businesses and buttress the viability of retail and service establishments, while reducing traffic congestion.
5. Planning policies should encourage mixed-use developments that create harmonious and user-friendly environments with appropriate design and use covenants with built-in flexibility to permit responsiveness to shifting or unforeseen market demands. For example, multiple uses could be permitted provided that design characteristics conform to pre-determined standards related to development orientation, parking locations and amounts, and site and building design.
6. Setback and floor-area ratio requirements and height limitations more typically associated with a low density, separate land use suburban development pattern should be reviewed and revised to reflect the evolution of the Study Area to a more urban environment.
7. Given the supply competition in Phoenix and on the lands of the Indian Community, design, height, amenities and product development commensurate with the image of a premier office agglomeration should be incorporated into site planning, landscaping, parking, and access areas with signage that takes advantage of the unique visibility and highway identity of Loop 101 locations. Planning policies should facilitate new office development responding uniquely well to the preferences and needs of office space users including corporate and regional headquarters and professional, business, and technical service firms.
PLANNING POLICY SHOULD ENCOURAGE ASSEMBLAGE OF INEFFICIENT, SMALL PARCELS AND REPLACEMENT OF OBSOLETE STRUCTURES IN CORE OF GREATER AIRPARK STUDY AREA 8. The core part of the Greater Airpark Study Area includes some smaller parcels and
obsolete industrial space (e.g., to the south of the Scottsdale Airport). The core has evolved so that low-margin, low-intensity industrial uses no longer represent the highest and best use of land and urban resources. Therefore, planning policy should encourage the assemblage of small, inefficient parcels and the replacement of obsolete industrial structures in the core of the Greater Airpark Study Area.

ANALYSIS AND FORECAST OF EMPLOYMENT AND BUILDING SPACE DEMAND AND STRATEGIC POLICY RECOMMENDATIONS FOR GREATER AIRPARK STUDY AREA
GRUEN GRUEN + ASSOCIATES PAGE 15
AUGMENT THE STRENGTH AND DIVERSITY OF IDENTIFIED MIXED-USE ACTIVITY CENTERS The 1999 GG+A report concluded that “the scale of population growth in the area suggests the viability of a new regional center with a competitive mix of retail stores and other attractions”. Since that report, among other regional-serving retail developments, the Scottsdale Quarter project located at Scottsdale Road and Butherus Drive and the One Scottsdale project located at the northeast corner of Scottsdale Road and Loop 101 have commenced development. The approximately 435,000-square-foot urban lifestyle center Kierland Commons has been developed on the Phoenix side of Scottsdale Road at Greenway Parkway and the first retail phase of the mixed-use CityNorth project at 56th Street and Deer Valley Drive off Loop 101 in northeast Phoenix has opened. Nordstrom’s and Bloomingdales have been announced as anchors of a subsequent phase of this development. In addition, the one million-square-foot Palisene regional mall across the street from One Scottsdale on the Phoenix side of Scottsdale Road and Loop 101 is proposed to open in 2011-12. Market demand is not likely to support much more regional-serving retail uses than those already planned and under construction and it will be challenging for all of the existing properties and planned projects to build-out in the time frames the developers originally anticipated. . 9. Accordingly, given the abundance of existing and planned regional-serving retail
uses, rather than encouraging additional regional-serving retail developments, policy actions should be directed to augmenting the strength and diversity of the mixed-use activity nodes which have already gained entitlement (e.g., Loop 101 and Scottsdale Road and Loop 101 and Bell Road).
10. The development review and building permit process should be evaluated and “re-
engineered” to be more predictable, based on a clear planning policy framework and appropriate regulations uniformly applied, in order to alleviate the potential for higher costs and uncertainty associated with unanticipated project negotiations and requests.
ENHANCE WESTWORLD AND BETTER LINK RECREATIONAL RESOURCES IN BELL ROAD AREA TO EACH OTHER AND TO OTHER ACTIVITY CENTERS WITHIN THE GREATER AIRPARK STUDY AREA 11. The Greater Airpark Community Area Plan should identify opportunities to better
link the recreational resources in the Bell Road area such as Westworld, the TPC Desert Golf Course and the planned Desert Discovery Center. An exciting way-finding system and, ideally trail system, should tie these resources together. Trail and green space connections to development nodes elsewhere in the Study Area should be made whenever practicable. Connecting commerce and recreational assets through more pedestrian friendly green spaces will highlight Scottsdale’s reputation as a special place for recreation and health and will be mutually reinforcing and help

ANALYSIS AND FORECAST OF EMPLOYMENT AND BUILDING SPACE DEMAND AND STRATEGIC POLICY RECOMMENDATIONS FOR GREATER AIRPARK STUDY AREA
GRUEN GRUEN + ASSOCIATES PAGE 16
differentiate the Study Area. IMPROVE INFRASTRUCTURE, INCLUDING BROADBAND ACCESS
12. Given the evolution of the Greater Airpark Study Area to higher-order office space,
research and development and high technology manufacturing, improve the infrastructure to at a minimum keep pace with development and the needs of space users. Infrastructure will need to accommodate the requirements of higher-intensity mixed-use developments.
13. Enhance the availability and quality of broadband access, especially on the east side
of the Study Area. 14. Improving traffic conditions and transportation linkages will also be critical to
accomplish. STUDY HOW TO PRESERVE BENEFITS INDUCED BY AUTOMOTIVE DEALERSHIPS 15. The major downward shift in sales at automotive dealerships suggests the advisability
of studying how to best position Scottsdale to benefit from future automotive dealership sales and to assure their viability. For example, the City should study whether it would be advantageous to support legislation that bases sales tax on the location of the residence of the automobile buyer as opposed to location of the automobile dealership.
16. If automotive dealerships are intended and likely to remain at locations such as Frank
Lloyd Wright Boulevard within the Study Area, a specialized zoning district and signage ordinances should be created to reflect the differences between automotive dealership uses and general commercial uses.
CITY-OWNED LAND 17. The City should evaluate future uses for its 80-acre land parcel at the northeast
corner of Bell Road and 94th Street to improve the magnetism of WestWorld (which is planning to improve its facilities and offerings to be “best in class”, including adding a permanent multi-purpose events center on the site) and associated activities as well as improve the competitive strength of the adjoining Epicenter project. For example, shared parking and shuttle system opportunities could be explored that (a) provide a central location for auxiliary parking for the visitor-related uses and activities if, in the future, State of Arizona land along Hayden Road becomes unavailable for WestWorld and major events; and (b) reduce the amount of expensive underground parking needed to accommodate office and hotel space planned for the Epicenter project.

ANALYSIS AND FORECAST OF EMPLOYMENT AND BUILDING SPACE DEMAND AND STRATEGIC POLICY RECOMMENDATIONS FOR GREATER AIRPARK STUDY AREA
GRUEN GRUEN + ASSOCIATES PAGE 17
18. Given the significant existing and proposed supply of office space, regional-serving
retail space, and hotel uses sought for the Epicenter site, support uses such as restaurants, coffee shops and convenience services that also appeal to visitors (and residents) should also be considered for a portion of City-owned land. In addition, multi-family uses should also be incorporated. Multi-family uses will improve the competitiveness of the Epicenter development and support retail and other commercial uses in the vicinity of the site.
19. Given that existing properties and projects including Scottsdale Quarter, Silverstone,
One Scottsdale, Terra Verde, and Epicenter alone (see Table VI-3) can support much more demand for office space than forecast through 2020, the City might wish to use its land to further its tourism development objectives. For example, it might explore operating a branch of the American Museum of Natural History on the site. This would require conducting pre-architectural planning and programming and negotiating an agreement with the American Museum of Natural History for the Musuem to license and provide rotating exhibits and other content that the City would operate and maintain. Another example of a tourism use option to consider includes the provision of venue space for performing arts and other visitor and user events that cannot be accommodated by the planned enhancement of WestWorld and that are too large for existing hotels to provide through their facilities.
ADDITIONAL POLICY IMPLICATIONS The recommendations and findings reflect evolving market conditions, and the estimates of future development in the Airpark are tempered by the amount of vacant built space and the conditions in place as the current down market recuperates. Within the overall parameters of the projected demand for commercial property, the City may choose to prioritize or emphasize certain types of development to achieve specific objectives. For instance, if the City decides to emphasize increasing sales tax and other revenues related to visitor and shopper activity in the area, there may need to be policy and investment decisions to support visitor attractions and venues that drive business and sales tax receipts, such as are described relating to the City’s 80 acre parcel. The same could be true for retail as new retailing concepts emerge in the marketplace. Support for the policies could be reflected in the Area Plan and later in the General Plan. Given the market conditions and demand forecasts, we believe it would be worthwhile to undertake a fiscal analysis of the emerging Scottsdale economy for at least the next 5-10 years. This fiscal analysis should include both long term revenue and expense forecasts and an identification of the interactions and relationships between potential changes in revenues and expenses. Without this framework, it will be difficult to identify comprehensive policy recommendations directed toward insuring Scottsdale long-term fiscal health and high-quality service provision. The projection of revenues to pay for City services is especially important in understanding how to view land use and economic development planning for

ANALYSIS AND FORECAST OF EMPLOYMENT AND BUILDING SPACE DEMAND AND STRATEGIC POLICY RECOMMENDATIONS FOR GREATER AIRPARK STUDY AREA
GRUEN GRUEN + ASSOCIATES PAGE 18
the community. This would provide an important framework as the City organizes its economic vitality strategy and commits to future growth through the General Plan. Other identifiable measures may require policy deliberations and decisions regarding the Airpark. These could include the timing and priority of infrastructure improvements, the role of the Airport and the techniques the City may use to encourage or support development and revitalization of portions of the Airpark Area. Beyond the recommendations contained within its pages, this report is intended to serve as a foundation on which to build further policy and program considerations. Additional evaluation of the needs and potential of the Airpark should be ongoing and build on the work of this report.

ANALYSIS AND FORECAST OF EMPLOYMENT AND BUILDING SPACE DEMAND AND STRATEGIC POLICY RECOMMENDATIONS FOR GREATER AIRPARK STUDY AREA
GRUEN GRUEN + ASSOCIATES PAGE 19
CHAPTER I
INTRODUCTION AND DESCRIPTION OF STUDY AREA INTRODUCTION AND PURPOSE The City of Scottsdale retained Gruen Gruen + Associates (GG+A) to conduct economic base analysis and prepare forecasts of employment by economic sector and potential building space demand by type of land use for the Greater Airpark Study Area. GG+A was also asked to identify the strategic policy implications for the preparation of the Greater Airpark Community Area Plan. This report presents the results of the analysis, forecasts, and strategic recommendations. STUDY AREA The Greater Airpark Study Area (sometimes referred to as “Greater Airpark” or “Study Area”) is consistent with the boundaries of the Greater Airpark Community Planning Area with the exception that it also includes City and State-owned land to the east adjoining Bell Road and 94th Street. Map 1 shows the boundaries of the Study Area, which are generally delineated by Scottsdale Road to the west, Thompson Peak Parkway to the north, the power line corridor and WestWorld to the northeast, Loop 101 and 90th Street to the east and Thunderbird Road to the south. The Study Area encompasses the historic Airpark core, the area north of the canal and west of Loop 101, and an area (primarily vacant land) north of Loop 101 and south of Thompson Peak Parkway.

ANALYSIS AND FORECAST OF EMPLOYMENT AND BUILDING SPACE DEMAND AND STRATEGIC POLICY RECOMMENDATIONS FOR GREATER AIRPARK STUDY AREA
GRUEN GRUEN + ASSOCIATES PAGE 20
MAP I-1: GREATER AIRPARK STUDY AREA

ANALYSIS AND FORECAST OF EMPLOYMENT AND BUILDING SPACE DEMAND AND STRATEGIC POLICY RECOMMENDATIONS FOR GREATER AIRPARK STUDY AREA
GRUEN GRUEN + ASSOCIATES PAGE 21
WORK COMPLETED To accomplish the study objectives, GG+A completed the following primary tasks:
1. Conducted field research, reviewed past surveys, and conducted interviews with planners and economic development specialists, tourism experts, managers of hotels and event facilities, real estate brokers and retail, office, and industrial space developers and property owners as well as representatives of businesses operating in the Greater Airpark. We directed these interviews toward gaining information and insights needed to define the relevant primary market areas, to obtain insights about visitor markets and opportunities, and to identify: (a) the likely origins and types of prospective users, (b) the alternative locations prospective users will consider, and (c) the relative advantages and disadvantages of the Greater Airpark for office, retail and industrial uses;
2. Studied office, retail, and industrial space supply conditions;
3. Completed an econometric analysis of employment change and shifts in the share of
employment by economic sector over time and between areas within the local and regional economies in order to (a) derive a profile of the economic structure and economic base of Scottsdale and the Study Area and their relative positions in the regional economy; (b) prepare projections of employment growth by economic sector; and (c) identify potential opportunities and constraints by economic sector.
4. Forecast the demand for office, retail, and industrial space in the Greater Airpark
based on (a) a synthesis of the shift-share employment forecast, supply trends, and interviews; (b) an analysis of space usage characteristics of Greater Airpark businesses and worker to building space density ratios by economic sector and land use, and (c) a comparison to the estimated supply of building to forecast demand;
5. Converted the forecast of building space demand by type of land into estimates of
land needed to accommodate the forecast building space demand based on the use of alternative floor-area assumptions; and
6. Synthesized the tasks summarized above to identify the strategic implications for a
planning policy and regulatory framework for the Greater Airpark Community Area Plan.
REPORT ORGANIZATION Chapter II reviews the structure of the employment base of the Greater Airpark Study Area and City of Scottsdale. Chapter III summarizes an analysis of the characteristics of land use and built space within

ANALYSIS AND FORECAST OF EMPLOYMENT AND BUILDING SPACE DEMAND AND STRATEGIC POLICY RECOMMENDATIONS FOR GREATER AIRPARK STUDY AREA
GRUEN GRUEN + ASSOCIATES PAGE 22
the Study Area. Chapter IV describes the results of GG+A’s past hospitality survey and employer survey and a recent Scottsdale Area Chamber of Commerce Survey of Greater Airpark employers as well as interviews conducted during the study. Chapter V presents a forecast of the structure and size of the employment base of the Study Area. Chapter VI presents an estimate of the amount of demand for building space and the amount of land needed to accommodate forecast demand for building space by type of land use. It also reviews the future supply of space under construction, planned and proposed within the Study Area.

ANALYSIS AND FORECAST OF EMPLOYMENT AND BUILDING SPACE DEMAND AND STRATEGIC POLICY RECOMMENDATIONS FOR GREATER AIRPARK STUDY AREA
GRUEN GRUEN + ASSOCIATES PAGE 23
CHAPTER II
THE STRUCTURE OF THE EMPLOYMENT BASE OF THE GREATER AIRPARK STUDY AREA AND CITY OF SCOTTSDALE
SUMMARY Over the past twelve years, the employment base in the Study Area has shifted such that industries concentrated in the production and trade of goods no longer constitute as significant of a component of the local economic base.
FIGURE II-1 Share of Greater Airpark Employment Base Comprised by Industry Group: 1995-2007
41%
13%8%
17%
21%
1995
32%
14%14%
24%
16%
2007
Agriculture/Mining, Construction, Manufacturing, Wholesale Trade
Retail Trade
Finance, Insurance & Real Estate
Professional & Business Services
Other Services (Information, Education, Healthcare, Leisure, Hospitality, Personal Services)
Sources: City of Scottsdale; Maricopa Association of Governments; Gruen Gruen + Associates.

ANALYSIS AND FORECAST OF EMPLOYMENT AND BUILDING SPACE DEMAND AND STRATEGIC POLICY RECOMMENDATIONS FOR GREATER AIRPARK STUDY AREA
GRUEN GRUEN + ASSOCIATES PAGE 24
Total private sector employment within the Greater Airpark Study Area grew by 112 percent over the past twelve years, increasing by approximately 22,500 jobs from 20,000 in 1995 to 42,500 jobs in 2007. This represents a high average annual growth rate of approximately 6.5 percent. Economic sectors comprising much of the employment growth included finance, insurance and real estate (“FIRE”), professional and business services, and retail trade. Economic sectors that serve a more important role in the economic base of the Greater Airpark than they do throughout the City and the larger metropolitan area include:
• Finance, Insurance and Real Estate; • Professional Services; • Manufacturing; • Retail Trade; • Construction; • Wholesale Trade; and • Information.
COMPOSITION OF GREATER AIRPARK EMPLOYMENT Comparing employment by industry sector provides a basic snapshot of the composition of the economic base in the City of Scottsdale, the Phoenix Metropolitan Statistical Area and the Study Area and the differences among the geographic areas. Table II-1 presents a comparison of the percentage of all employment in the Study Area in 2007 with employment in the City of Scottsdale and the Phoenix Metropolitan Statistical Area.

ANALYSIS AND FORECAST OF EMPLOYMENT AND BUILDING SPACE DEMAND AND STRATEGIC POLICY RECOMMENDATIONS FOR GREATER AIRPARK STUDY AREA
GRUEN GRUEN + ASSOCIATES PAGE 25
TABLE II-1
Comparison of Share of Industry Employment in 2007
Industry Sector
Phoenix Metro Employment1
%
City of Scottsdale Employment
%
Greater Airpark Employment
%Agriculture, Mining & Utilities 0.6 0.2 0.1Construction 8.8 6.6 11.5Manufacturing 7.2 8.1 11.6Wholesale Trade 4.7 3.7 6.3Retail Trade 12.2 11.9 13.9Transportation & Warehousing 3.0 1.1 2.4Information 1.6 1.9 2.6Finance, Insurance & Real Estate 8.0 13.8 14.4Professional & Business Services 17.0 22.3 23.5Education & Health Services 10.7 12.0 3.5Leisure & Hospitality 9.8 12.8 7.3Other Services 3.7 3.6 3.0Government 12.6 2.0 0.0Total 100.0 100.0 100.01 Phoenix Metropolitan Statistical Area includes all of Maricopa and Pinal Counties.
Sources: Arizona Department of Commerce; Maricopa County Association of Governments; City of Scottsdale; Gruen Gruen + Associates.
The economic base of the Phoenix metropolitan area is relatively evenly distributed. Professional services (17 percent), retail trade (12 percent), and government (13 percent) constitute the three largest employment sectors in the Phoenix metropolitan area. The City of Scottsdale’s economic base, however, is more concentrated in the professional and financial service sectors. These two sectors (professional services and finance, insurance and real estate) comprise just over 36 percent of Scottsdale’s employment base. These sectors also comprise nearly 38 percent of the Greater Airpark’s employment base. While the Study Area generally reflects the structure of Scottsdale’s economic base, several sectors comprise smaller or larger shares of the employment base. In addition to the professional and financial service sectors, other economic sectors that serve a more important role in the economic base of the Greater Airpark than they do throughout the City and the larger metropolitan area include:
• Manufacturing; • Retail Trade; • Construction; • Wholesale Trade; and • Information.

ANALYSIS AND FORECAST OF EMPLOYMENT AND BUILDING SPACE DEMAND AND STRATEGIC POLICY RECOMMENDATIONS FOR GREATER AIRPARK STUDY AREA
GRUEN GRUEN + ASSOCIATES PAGE 26
The manufacturing sector accounts for approximately 11.6 percent of all employment within the Greater Airpark Study Area, while accounting for only seven and eight percent of employment throughout the metropolitan area and City of Scottsdale. Similarly, construction employment within the Study Area is estimated to account for approximately 11.5 percent of all jobs, while representing a smaller share of the employment base across the region. Differences in employment among the wholesale trade, retail trade, and information sectors are less pronounced, but these economic sectors account for larger shares of employment in the Study Area than they do within the City of Scottsdale and Phoenix metropolitan area as a whole. Employment in the health and educational sector and the hospitality sector is lower as a proportion of total employment in the Study Area than in the City of Scottsdale and Phoenix metropolitan area as a whole. Public sector jobs account for nearly 13 percent of the employment base of the Phoenix metropolitan area while government jobs within the Greater Airpark are virtually non-existent, accounting for less than one-tenth of one percent of the employment base. GREATER AIRPARK EMPLOYMENT TRENDS: 1995-2007 This section reviews shifts in industry employment within the Greater Airpark Study Area from 1995 through 2007 and summarizes changes that have occurred in the composition of the Study Area employment base during this same period. Table II-2 shows employment by sector for the Study Area from 1995 to 2007.
TABLE II-2 Greater Airpark Study Area Employment by Sector: 1995-20071
Change 1995-2007
Industry Sector
1995 #
2000 #
2005 #
2007 # # %
Average Annual
Growth Rate
Agriculture, Mining & Utilities 93 33 51 45 -48 -51.6 -5.9Construction 2,578 2,569 3,178 4,904 2,326 90.2 5.5Manufacturing 2,620 4,100 4,205 4,913 2,293 87.5 5.4Wholesale Trade 2,388 2,399 2,782 2,682 294 12.3 1.0Retail Trade 2,555 5,774 6,143 5,909 3,354 131.3 7.2Transportation & Warehousing 553 871 1,990 1,030 477 86.3 5.3Information 519 1,746 1,172 1,086 567 109.2 6.3Finance, Insurance & Real Estate 1,580 1,873 4,498 6,101 4,521 286.1 11.9Professional & Business Services 3,355 6,666 9,592 9,986 6,631 197.6 9.5Education & Health Services 406 749 937 1,484 1,078 265.5 11.4Leisure & Hospitality 2,760 2,525 3,196 3,095 335 12.1 1.0Other Services 628 1,270 984 1,257 629 100.2 6.0Total Private Sector 20,035 30,575 38,728 42,492 22,457 112.1 6.51 Historical data from MAG’s employer database includes only business establishments with five or more employees. The estimates of historical employment have been adjusted, based on the U.S. Census Bureau’s Zip Code Business Pattern report, to account for employment in firms with fewer than five employees.
Sources: Maricopa Association of Governments; City of Scottsdale; Gruen Gruen + Associates.

ANALYSIS AND FORECAST OF EMPLOYMENT AND BUILDING SPACE DEMAND AND STRATEGIC POLICY RECOMMENDATIONS FOR GREATER AIRPARK STUDY AREA
GRUEN GRUEN + ASSOCIATES PAGE 27
The Study Area is one of the largest employment centers in the region. Total private sector employment within the Greater Airpark Study Area grew by 112 percent over the past twelve years, increasing by approximately 22,500 jobs from 20,000 in 1995 to 42,500 jobs in 2007. This represents a high average annual growth rate of approximately 6.5 percent. Economic sectors comprising much of the employment growth include finance, insurance and real estate (“FIRE”), professional and business services, and retail trade. Collectively, these sectors accounted for 14,500 additional jobs or 65 percent of total employment growth that occurred between 1995 and 2007. All private sector sectors (with the exception of agriculture, mining and utilities) experienced positive employment growth over the past twelve years. The FIRE sector experienced the largest percentage increase (286 percent), growing at an average annual rate of approximately 12 percent. Between 2005 and 2007 alone, the FIRE sector added approximately 1,600 jobs. Large financial, insurance and real estate companies that located (or grew) in the Study Area during the two-year period included: Metris Companies (340 jobs) First Magnus Financial (100 jobs) Nautilus Insurance (120 jobs) Concord Mortgage (90 jobs) Kahala Corporation (75 jobs) Preferred Medical Claim Solutions (50 jobs) Skanco International (50 jobs) Centuron Management (35 jobs) Employment in the professional and businesses services sector increased by 6,631 jobs or at an annual growth rate of 9.5 percent over the 12-year period. Between 2000 and 2007, professional and business service employment grew by approximately 3,200 jobs or 50 percent. Large professional and business service establishments that moved to (or grew) within the Study Area during this period included: DHL (875 jobs, now closed) Go Daddy Software (600 jobs) Natural Data Inc. (325 jobs) JDA Software (grew by 185 jobs) Pegasus Solutions (260 jobs) iCrossing, Inc. (140 jobs) Education and health services (while still representing a small share of the Greater Airpark employment base) grew by 266 percent or 11.4 percent annually. The wholesale trade and leisure and hospitality sectors experienced comparatively low rates of employment growth, increasing at an annual rate of one percent. All other private sector industries, however, experienced annual growth rates upwards of five percent from 1995 to 2007. The traditional industrial uses such as manufacturing and transportation grew between 1995 and 2000. Larger growth occurred in the retail trade and service sectors, particularly professional and business services. Since 2000, significant job growth continued in the professional service and FIRE sectors. Consistent with strong employment growth, Table II-3 shows that the number of business establishments (with five or more employees) in the Greater Airpark grew from 1995 through 2007 by approximately 500 or 64 percent, from 774 establishments in 1995 to 1,268

ANALYSIS AND FORECAST OF EMPLOYMENT AND BUILDING SPACE DEMAND AND STRATEGIC POLICY RECOMMENDATIONS FOR GREATER AIRPARK STUDY AREA
GRUEN GRUEN + ASSOCIATES PAGE 28
establishments in 2007.
TABLE II-3
Number of Business Establishments With Five or More Employees in Airpark Study AreaChange 1995-2008
Industry Sector 1995
#2000
#2005
#2007
# # %Agriculture, Mining & Utilities 6 2 5 3 -3 -50.0Construction 83 95 111 146 63 75.9Manufacturing 107 143 145 137 30 28.0Wholesale Trade 145 137 140 133 -12 -8.3Retail Trade 74 146 168 155 81 109.5Transportation & Warehousing 16 21 26 27 11 68.8Information 23 46 39 42 19 82.6Finance, Insurance & Real Estate 73 72 96 150 77 105.5Professional & Business Services 153 217 255 291 138 90.2Education & Health Services 25 27 35 55 30 120.0Leisure and Hospitality 37 57 75 68 31 84.0Other Services 32 58 51 61 29 90.6Total Private Sector 774 1,021 1,146 1,268 494 63.8
Sources: City of Scottsdale; Maricopa County Association of Governments; Gruen Gruen + Associates.
The number of establishments increased the most (and by at least 77 establishments) in the professional and business service sectors, retail trade, and FIRE sectors. Professional and business services led the growth in the number of businesses, increasing by 138 businesses to comprise over 28 percent of the growth in the number of businesses from 1995 through 2008 and 23 percent of all business establishments in the Greater Airpark Study Area. The number of businesses in the retail trade sector grew rapidly so that by 2008, these businesses accounted for 12 percent of all businesses, up from almost 10 percent of the establishments in 1995. The number of wholesale trade establishments, however, declined and the manufacturing sector experienced an increase from 1995 through 2000 but has since experienced a small decline in the number of manufacturing establishments. Shift in Composition of Greater Airpark Employment Base: 1995 to 2007 As summarized above, the professional and financial service and retail trade sectors currently represent the majority (51.8 percent) of the Greater Airpark Study Area employment base. Over the past twelve years, the employment base has shifted such that industries concentrated in the production and trade of goods no longer constitute as significant of a component to the local economic base. Table II-4 shows the percentage of total Greater Airpark private sector employment comprised by each industry sector in 1995 and 2007.

ANALYSIS AND FORECAST OF EMPLOYMENT AND BUILDING SPACE DEMAND AND STRATEGIC POLICY RECOMMENDATIONS FOR GREATER AIRPARK STUDY AREA
GRUEN GRUEN + ASSOCIATES PAGE 29
TABLE II-4
Shift in Percentage of Total Employment Within Greater Airpark Study Area: 1995-2007
Industry Sector
1995 %
2007 %
Shift 1995-2007 Percentage Points
Agriculture, Mining & Utilities 0.5 0.1 -0.4 Construction 12.9 11.5 -1.3 Manufacturing 13.1 11.6 -1.5 Wholesale Trade 11.9 6.3 -5.6 Retail Trade 12.8 13.9 1.2 Transportation & Warehousing 2.8 2.4 -0.3 Information 2.6 2.6 0.0 Finance, Insurance & Real Estate 7.9 14.4 6.5 Professional & Business Services 16.7 23.5 6.8 Education & Health Services 2.0 3.5 1.5 Leisure and Hospitality 13.8 7.3 -6.5 Other Services 3.1 3.0 -0.2 Total Private Sector 100.0 100.0 0.0
Sources: City of Scottsdale; Maricopa County Association of Governments; Gruen Gruen + Associates.
In 1995, the manufacturing, construction, and wholesale trade sectors comprised roughly 38 percent of all employment within the Greater Airpark. In 2007, the share of employment comprised by these sectors approximates 29 percent, representing a downward shift of approximately nine percentage points. Wholesale trade employment experienced the largest decline as a proportion of total employment, from 11.9 percent of total employment in 1995 to 6.3 percent of total employment in 2007. Between 1995 and 2007, the professional and financial service sectors grew by more than 13 percentage points, from 24.6 percent of total employment to 37.9 percent of total employment. Retail trade employment increased by over one percentage point, from 12.8 percent to 13.9 percent of total employment. Education and health services employment increased over the 12 year period by 1.5 percentage points to a still relatively small 3.5 percent of total employment. Between 1995 and 2007, the leisure and hospitality sector became less significant, decreasing as a share of total employment by approximately 6.5 percentage points from 13.8 percent of total employment to 7.3 percent of total employment. THE GREATER AIRPARK’S POSITION WITHIN THE SCOTTSDALE EMPLOYMENT BASE This section reviews historical employment trends for the City of Scottsdale as a whole and compares industry shifts that have occurred in the City as a whole to those within the Greater Airpark Study Area. This section also provides a framework from which to assess future growth within the Study Area as it relates to the larger Scottsdale economic base. In 1995, the Study Area accounted for approximately 18 percent of all employment within the

ANALYSIS AND FORECAST OF EMPLOYMENT AND BUILDING SPACE DEMAND AND STRATEGIC POLICY RECOMMENDATIONS FOR GREATER AIRPARK STUDY AREA
GRUEN GRUEN + ASSOCIATES PAGE 30
City of Scottsdale. In 2007, 28 percent of jobs within the City of Scottsdale are located within the Study Area. City of Scottsdale Employment Trends: 1995-2007 Table II-5 shows employment by sector within the City of Scottsdale from 1995 through 20074.
TABLE II-5
City of Scottsdale Employment by Sector: 1995-20071 Change
1995-2007 Industry Sector
1995 #
2000 #
2005 #
2007 # # %
Average Annual
Growth Rate
Agriculture, Mining & Utilities 555 386 496 275 -280 -50.5 -5.7Construction 7,568 8,070 8,947 10,332 2,764 36.5 2.6Manufacturing 10,879 10,296 12,136 12,797 1,918 17.6 1.4Wholesale Trade 5,342 5,408 5,260 5,826 484 0.9 0.7Retail Trade 14,743 18,529 19,221 18,674 3,931 26.7 2.0Transportation & Warehousing 1,632 1,921 3,600 1,704 72 0.4 0.4Information 3,677 3,554 5,200 3,058 -619 -16.8 -1.5Finance, Insurance & Real Estate 14,837 13,489 19,386 21,678 6,841 46.1 3.2Professional & Business Services 16,388 20,302 27,706 34,962 18,574 113.3 6.5Education & Health Services 15,635 20,175 14,142 18,880 3,245 20.8 1.6Leisure & Hospitality 16,002 19,944 19,964 20,183 4,181 26.1 2.0Other Services 4,028 5,044 5,223 5,621 1,593 39.5 2.8Total Private Sector 111,286 127,118 141,281 153,990 42,704 38.4 2.71 Historical data from MAG’s employer database includes only business establishments with five or more employees. The estimates of historical employment have been adjusted, based on the U.S. Census Bureau’s Zip Code Business Pattern report, to account for employment in firms with fewer than five employees.
Sources: Maricopa Association of Governments; City of Scottsdale; Gruen Gruen + Associates. Between 1995 and 2007, private sector employment within the City of Scottsdale is estimated to have grown at an average annual rate of approximately 2.7 percent, increasing by almost 43,000 jobs from 111,300 jobs in 1995 to 154,000 jobs in 2007. Professional and financial service sector jobs grew most rapidly, while most other sectors grew at average annual rates between one and three percent. Employment in the professional and business services sector increased by 18,600, or 113 percent, during the 12-year period representing an average annual growth rate of 6.5 percent. The FIRE sector also experienced a high rate of growth, increasing by approximately 6,800 jobs at an average annual rate of 3.2 percent. Employment in the information and agricultural, mining, and utility sectors is estimated to have declined slightly over the past twelve years, while the wholesale trade and transportation and warehousing sectors experienced minimal growth totaling fewer than 600 added jobs. Manufacturing employment increased by approximately 2,000 jobs (or 18
4 Employment data was collected and aggregated for businesses within the municipal boundary of the City of Scottsdale (not for all establishments with a Scottsdale “mailing address”).

ANALYSIS AND FORECAST OF EMPLOYMENT AND BUILDING SPACE DEMAND AND STRATEGIC POLICY RECOMMENDATIONS FOR GREATER AIRPARK STUDY AREA
GRUEN GRUEN + ASSOCIATES PAGE 31
percent) at an average annual growth rate of 1.4 percent. Construction employment increased by approximately 2,800, or 37 percent, from 7,800 jobs in 1995 to 10,300 jobs in 2007 representing an average growth rate of 2.6 percent. Retail trade and leisure and hospitality sector employment each grew at two percent annually, collectively increasing by approximately 8,100 jobs between 1995 and 2007. Table II-6 summarizes the shift in the composition of the Scottsdale employment base by industry sector (industry employment as a percentage of total employment) that occurred over the past twelve years.
TABLE II-6
Shift in Percentage of Total Employment Within City of Scottsdale: 1995-2007 Industry Sector
1995 %
2007 %
Shift 1995-2007 Percentage Points
Agriculture, Mining & Utilities 0.5 0.2 -0.3 Construction 6.8 6.7 -0.1 Manufacturing 9.8 8.3 -1.5 Wholesale Trade 4.8 3.8 -1.0 Retail Trade 13.2 12.1 -1.1 Transportation & Warehousing 1.5 1.1 -0.4 Information 3.3 2.0 -1.3 Finance, Insurance & Real Estate 13.3 14.1 0.7 Professional & Business Services 14.7 22.7 8.0 Education & Health Services 14.0 12.3 -1.8 Leisure and Hospitality 14.4 13.1 -1.3 Other Services 3.6 3.7 0.0 Total Private Sector 100.0 100.0 0.0
Sources: City of Scottsdale; Maricopa County Association of Governments; Gruen Gruen + Associates.
Scottsdale also had a high increase (eight percentage points to nearly 23 percent of total employment) in the proportion of its employment base comprised by the professional and business services sector, indicating that substantial growth in this sector has not been confined to the Greater Airpark area alone. Proportion of Scottsdale Employment Comprised by Greater Airpark Study Area: 1995-2007 Table II-7 shows the share of total private sector employment within the City of Scottsdale comprised by employment in the Greater Airpark Study Area.

ANALYSIS AND FORECAST OF EMPLOYMENT AND BUILDING SPACE DEMAND AND STRATEGIC POLICY RECOMMENDATIONS FOR GREATER AIRPARK STUDY AREA
GRUEN GRUEN + ASSOCIATES PAGE 32
TABLE II-7
Share of Total Scottsdale Employment Comprised by Greater Airpark Study Area: 1995-2007
1995 %
2000 %
2005 %
2007 %
Shift Percentage Points
Agriculture, Mining & Utilities 17 9 10 16 -1Construction 34 32 36 47 13Manufacturing 24 40 35 38 14Wholesale Trade 45 44 53 46 1Retail Trade 17 31 32 32 15Transportation & Warehousing 34 45 55 60 26Information 14 49 23 36 22Finance, Insurance & Real Estate 11 14 23 28 17Professional & Business Services 20 33 35 29 9Education & Health Services 3 4 7 8 5Leisure & Hospitality 17 13 16 15 -2Other Services 16 25 19 22 6Total Private Sector 18 24 27 28 10
Sources: Maricopa Association of Governments; City of Scottsdale; Gruen Gruen + Associates.
The employment base of the Greater Airpark Study Area has historically grown faster than employment in the City of Scottsdale as a whole. Accordingly, the Study Area has increasingly represented a larger component of Scottsdale’s economic base. In 1995, the 20,000 jobs located within the Study Area represented just less than 18 percent of all employment within the City. In 2000, employment in the Study Area comprised 24 percent of the City’s total employment base. In 2005, this share had increased to approximately 27 percent. By 2007, the Study Area is estimated to have increased to comprise 28 percent of all Scottsdale private sector employment. All but two industry sectors (leisure and hospitality and agriculture, mining and utilities) within the Greater Airpark now comprise a larger share of their respective employment within the City than they did in 1995. As a share of total Citywide employment, employment in transportation and warehousing in the Greater Airpark Study Area increased by 26 percentage points to comprise 60 percent of total employment. Employment in the information sector located in the Study Area increased by 22 percentage points to 36 percent of total employment. FIRE employment in the Study Area increased by 17 percentage points from 11 percent to 28 percent of total Citywide employment. Retail trade employment in the Study Area shifted by 16 percentage points to comprise 42 percent of total employment in Scottsdale. Employment in the manufacturing sector in the Study Area increased by 14 percentage points to 38 percent of total employment. Employment in the construction sector increased by 13 percentage points to comprise 47 percent of Citywide employment.

ANALYSIS AND FORECAST OF EMPLOYMENT AND BUILDING SPACE DEMAND AND STRATEGIC POLICY RECOMMENDATIONS FOR GREATER AIRPARK STUDY AREA
GRUEN GRUEN + ASSOCIATES PAGE 33
CHAPTER III
CHARACTERISTICS OF LAND USE AND BUILT
SPACE WITHIN GREATER AIRPARK STUDY AREA INTRODUCTION In conjunction with the rapid growth in employment has been significant growth in building space to house employees. This chapter reviews the land use characteristics of the Greater Airpark Study Area and trends in the supply of commercial building space to identify historical relationships between the growth of the employment base and the development of additional office, retail and industrial space. Also presented in this chapter are estimates of density (both physical space density and employment density) which are subsequently utilized to estimate the amount and type of future building space and land required to accommodate the expanding employment base. SUMMARY The Greater Airpark Study Area includes a total of approximately 5,530 acres of land (including roadways and open space). The primary non-residential land uses within the Study Area are approximately 60 percent built-out. The vast majority of undeveloped vacant land is anticipated to consist of “mixed-use neighborhoods” under the General Plan, generally encompassing most State-owned land north and south of the Loop 101. A total of approximately 1,344 acres of non-residential commercial land within the Study Area is currently vacant. The historical Airpark “core” area (south of Frank Lloyd Wright) contains less than 105 acres of available land, most of which is located in small non-contiguous sites. Just as office space-using employment sectors have grown more substantially than other industry sectors, the supply of office space has increased considerably more than other uses over the past 10 years.

ANALYSIS AND FORECAST OF EMPLOYMENT AND BUILDING SPACE DEMAND AND STRATEGIC POLICY RECOMMENDATIONS FOR GREATER AIRPARK STUDY AREA
GRUEN GRUEN + ASSOCIATES PAGE 34
FIGURE III-1
Amount of New Building Space Delivered in Past 10 Years
0
200,000
400,000
600,000
800,000
1,000,000
1,200,000
1999 2000 2001 2002 2003 2004 2005 2006 2007 2008
# SQ
UARE
FEET DELIVERED
YEAR
Industrial
Office
Retail
Sources: CoStar; Gruen Gruen + Associates.
On average, approximately 696,000 square feet of space (of all types) has been absorbed each year over the past ten years within the Study Area. Office space absorption has averaged approximately 368,000 square feet of space each year, while annual retail and industrial absorption has been lower at 237,000 square feet and 168,000 square feet respectively. The composition of the Airpark space inventory has shifted from flex-warehouse uses to office uses. In comparison to space located elsewhere in the County, floor-area-ratios and employment densities within the Greater Airpark Study Area are relatively consistent with the exception of office space. The lower floor-area ratios for office space in the Study Area reflect the constraints imposed by zoning regulations. LAND USE CHARACTERISTICS According to information provided by the City of Scottsdale Planning Department, the Greater Airpark Study Area includes a total of approximately 5,530 acres of land (including roadways and open space). Non-residential commercial land uses account for approximately 3,300 acres or 60 percent of the total land area. As shown below in Table III-1, the primary non-residential land uses within the Study Area are approximately 60 percent built-out.

ANALYSIS AND FORECAST OF EMPLOYMENT AND BUILDING SPACE DEMAND AND STRATEGIC POLICY RECOMMENDATIONS FOR GREATER AIRPARK STUDY AREA
GRUEN GRUEN + ASSOCIATES PAGE 35
TABLE III-1
Land Use Within Greater Airpark Study Area General Plan Land Use Classification
Developed
# Acres
Vacant
# Acres
Total
# Acres
Percentage Build-out
%Commercial (retail) 551.0 51.2 602.2 91.5Employment (industrial) 1,140.7 367.0 1,507.7 75.7Mixed-Use Neighborhoods 0.0 886.3 886.3 0.0Office 124.8 4.7 129.6 96.4Resorts / Tourism 100.5 34.7 135.2 74.4Total 1,917.0 1,343.91 3,261.0 58.81 Total does not include City and State-owned land adjoining Bell Road and 94th Street. Under the General Plan these parcels are classified as public purpose and suburban neighborhood uses. Does not include land in the One Scottsdale project.
Sources: City of Scottsdale; Gruen Gruen + Associates. The vast majority of undeveloped vacant land is anticipated to consist of “mixed-use neighborhoods” under the General Plan, generally encompassing most State-owned land north and south of the Loop 101. A total of approximately 1,344 acres of non-residential commercial land within the Study Area is currently vacant. The three primary General Plan land use designations of commercial, employment, and office make up only 1,817 developed acres and 423 vacant acres. Map III-1 shows the amount and location of vacant land within the Greater Airpark Study Area by ownership type.

ANALYSIS AND FORECAST OF EMPLOYMENT AND BUILDING SPACE DEMAND AND STRATEGIC POLICY RECOMMENDATIONS FOR GREATER AIRPARK STUDY AREA
GRUEN GRUEN + ASSOCIATES PAGE 36
MAP III-1: VACANT LAND BY OWNERSHIP TYPE

ANALYSIS AND FORECAST OF EMPLOYMENT AND BUILDING SPACE DEMAND AND STRATEGIC POLICY RECOMMENDATIONS FOR GREATER AIRPARK STUDY AREA
GRUEN GRUEN + ASSOCIATES PAGE 37
Of the nearly 130 acres of land designated under the General Plan for office use, over 96 percent has been built-out so that less than five acres of office land is currently vacant. Of the nearly 1,507 acres of land classified under the General Plan as employment, nearly 76 percent of the land is built-out so that 367 acres of vacant land is available for development of industrial and office uses. Of the 602 acres of land classified under the General Plan for commercial uses, 91.5 percent of the land is built-out so that 51 acres of vacant land is available for commercial use. The historical Airpark “core” area (south of Frank Lloyd Wright) contains less than 105 acres of available land, most of which is located in small non-contiguous sites. BUILDING SPACE SUPPLY TRENDS WITHIN GREATER AIRPARK STUDY AREA We review below the office, retail, and industrial space supply trends within the Study Area over the past 10 years. Just as office space-using employment sectors have grown more substantially than other industry sectors, the supply of office space has increased considerably more than other uses over the past 10 years. According to CoStar, the supply of commercial space within the Greater Airpark totals 17.1 million square feet5. Office Space Supply Conditions Table III-2 shows the total amount of rentable space, vacant space, and annual rents per square foot for the Greater Airpark Study Area office market.
TABLE III-2
Office Space Supply Trends in Greater Airpark Study Area: 1999-2008 Total Rentable Space
# Square FeetVacant Space
# Square FeetVacancy Rate
%Annual Rent
$ Per Square Foot1
1999 2,773,570 273,424 9.9 22.642000 3,172,091 210,048 6.6 23.922001 3,772,783 786,974 20.9 24.862002 4,245,889 737,205 17.4 23.632003 4,389,847 531,828 12.1 23.992004 5,155,222 883,551 17.1 25.152005 5,287,870 528,637 10.0 26.822006 6,308,652 864,091 13.7 28.272007 6,896,952 1,336,993 19.4 28.572008 7,213,432 1,689,407 23.4 25.79Change 4,439,862 1,415,983 13.6 3.151 Average full service rents.
Sources: CoStar; Gruen Gruen + Associates. According to CoStar, the supply of office space within the Greater Airpark has grown by more than 4.4 million square feet since 1999, representing a 160 percent increase over the
5 CoStar data does not include owner-occupied buildings.

ANALYSIS AND FORECAST OF EMPLOYMENT AND BUILDING SPACE DEMAND AND STRATEGIC POLICY RECOMMENDATIONS FOR GREATER AIRPARK STUDY AREA
GRUEN GRUEN + ASSOCIATES PAGE 38
past 10 years. The current inventory of space is estimated at 7.2 million square feet, 23 percent or 1.7 million square feet of which is reported to be currently vacant. As the inventory of office space has increased substantially, the vacancy rate has also increased as absorption has not kept pace with new construction in recent years. The amount of vacant space increased by 1.4 million square feet while the vacancy rate increased by 13.6 percentage points between 1999 and 2008. Average annual full-service office space rents increased by approximately $3.15 per square feet since 1999, but decreased in the past year from a peak of $28.57 in 2007 to $25.79 per square foot. The primary office space developments, which delivered nearly all of the 4.4 million square feet of added office space over the past ten years, include the Perimeter Center, Perimeter Gateway, Raintree Corporate Center, McDowell Mountain Business Park, Bahia Office/Business Park, and the corporate headquarters office buildings for Vanguard and Dial. Nearly all new office space development occurring during the past ten years was concentrated along Loop 101 at two nodes: north of the Central Arizona Project canal near Bell Road and Princess Drive, and south of the canal adjoining Raintree Drive. Retail Space Supply Trends Table III-3 shows the total amount of space, vacant space, and annual rents per square foot for the Greater Airpark Study Area retail market.
TABLE III-3
Retail Space Supply Trends in Greater Airpark Study Area: 1999-2008 Total Rentable Space
# Square FeetVacant Space
# Square FeetVacancy Rate
%Annual Rent
$ Per Square Foot1
1999 1,971,023 0 0.0 N/A2000 2,312,050 500 0.0 N/A2001 2,494,665 3,500 0.1 N/A2002 2,646,057 4,000 0.2 N/A2003 2,919,262 48,320 1.7 34.872004 3,326,506 174,842 5.3 29.132005 3,369,094 48,450 1.4 30.352006 3,459,625 119,997 3.5 30.592007 3,470,625 89,590 2.6 33.772008 3,470,625 219,808 6.3 28.44Change 1,499,602 219,808 6.3 N/A1 Average triple net rents.
Sources: CoStar; Gruen Gruen + Associates. According to CoStar, the supply of retail space within the Study Area has grown by approximately 1.5 million square feet since 1999, representing a 76 percent increase over the past 10 years. The current inventory of space approximates 3.5 million square feet. The retail vacancy rate has increased from nearly zero in 1999 and 2000 to approximately six

ANALYSIS AND FORECAST OF EMPLOYMENT AND BUILDING SPACE DEMAND AND STRATEGIC POLICY RECOMMENDATIONS FOR GREATER AIRPARK STUDY AREA
GRUEN GRUEN + ASSOCIATES PAGE 39
percent in 2008. Annual triple-net rental rates for retail space have fluctuated from year-to-year but have decreased to a five-year low of $28.44 per square foot in 2008 from a high of $33.77 per square foot in 2007. Much of the retail space added within the past ten years is attributable to three projects. The 1.2 million-square-foot Scottsdale Promenade was developed between 1999 and 2005, and an 89,000-square-foot Kohl’s department store was added in 2003. The 105,000-square-foot Northsight Crossing neighborhood center was also built in 2003. These projects, all of which are located south of the canal, represent more than 90 percent of the retail space built over the past 10 years. Industrial Space Supply Trends Table III-4 shows the total amount of space, vacant space, and annual rents per square foot for the Greater Airpark Study Area industrial market.
TABLE III-4
Industrial/Flex Space Supply Trends in Greater Airpark Study Area: 1999-2008 Total Rentable Space
# Square FeetVacant Space
# Square FeetVacancy Rate
%Annual Rent
$ Per Square Foot1
1999 5,021,495 386,658 7.7 10.032000 5,116,292 365,327 7.1 10.432001 5,235,376 467,269 8.9 11.512002 5,287,112 500,718 9.5 10.962003 5,486,660 566,788 10.3 11.392004 5,794,238 576,679 10.0 11.282005 6,052,046 454,608 7.5 12.012006 6,274,860 640,335 10.2 12.542007 6,292,324 628,462 10.0 13.002008 6,380,534 885,900 13.9 12.68Change 1,359,039 499,242 6.2 2.651 Triple net rents. Represents average rents for flex space and warehouse/industrial space.
Sources: CoStar; Gruen Gruen + Associates. According to CoStar, the supply of industrial/flex space within the Study Area currently approximates 6.4 million square feet. Compared to office and retail uses, the industrial/flex space supply has grown less substantially over the past ten years, increasing by approximately 1,360,000 square feet or 27 percent. From 1999 through 2008, the industrial/flex vacancy rate increased from a relatively low 7.7 percent to approximately 14 percent as the amount of vacant space increased by a half million square feet. Industrial/flex space rents within the Study Area currently average $12.68 per square foot representing a $2.65 per square foot increase since 1999. Similar to office and retail uses, industrial/flex space rental rates peaked in 2007 at $13 per square foot. The supply trends and rental rates indicated above in Table III-4 represent both flex-type and industrial and warehouse buildings6. According to CoStar, annual rents for industrial and warehouse space within the Greater Airpark ($11 to $12 per
6 CoStar defines flex space as any building that includes at least 50 percent office space with the remainder used for industrial, research and development, and quasi-retail sales activities with at least one loading dock. Industrial and warehouse buildings include those whose primary use of space is for producing, assembling, storing or distributing goods.

ANALYSIS AND FORECAST OF EMPLOYMENT AND BUILDING SPACE DEMAND AND STRATEGIC POLICY RECOMMENDATIONS FOR GREATER AIRPARK STUDY AREA
GRUEN GRUEN + ASSOCIATES PAGE 40
square foot) are approximately $5 per square foot greater than traditional warehouse or industrial buildings throughout the region. Rental rates for flex space in the Study Area ($16 to $17 per square foot) are approximately $3.50 per square foot above the metro average for flex space. The majority of new flex space constructed over the past 10 years have been smaller buildings, primarily located on infill sites within the core Airpark Area south of the canal. Six flex buildings larger than 50,000 square feet were built between 1999 and 2008. Three flex buildings totaling approximately 204,000 square feet were built in 2002 in the Perimeter Center, while one flex building of approximately 60,000 square feet was built in the McDowell Mountain Business Park. New Construction and Absorption Trends Table III-5 summarizes the amount of new commercial space constructed within the Greater Airpark Study Area over the past 10 years and the volume of net absorption that also occurred during this period (i.e., net change in occupied building space).
TABLE III-5
Construction and Space Absorption Trends Within Study Area: 1999-2008 Office
# Square FeetRetail
# Square FeetIndustrial
# Square Feet Total
# Square FeetNew Space Constructed 2,498,257 1,814,973 783,389 5,096,6191999-2003 Net Absorption 2,052,587 1,898,815 429,344 4,380,746New Space Constructed 2,823,585 551,363 893,874 4,268,8222004-2008 Net Absorption 1,666,066 379,895 574,762 2,620,723New Space Constructed 532,184 236,634 167,726 936,544Annual
Average Net Absorption 367,864 227,869 100,411 696,144Sources: CoStar; Gruen Gruen + Associates.
According to CoStar, approximately 9.4 million square feet of office, retail, and industrial/flex space has been built within the Study Area over the past 10 years. Office space has comprised the majority of new construction activity, representing 57 percent of all building space added between 1999 and 2008. On average, approximately 696,000 square feet of space (of all types) has been absorbed each year over the past 10 years within the Study Area. Office space absorption has averaged approximately 368,000 square feet of space each year, while annual retail and industrial absorption has been lower at 237,000 square feet and 168,000 square feet respectively. New construction deliveries and net absorption were greater in 1999-2003 for both office and retail space, while a greater amount of industrial/flex space has been built and leased in the past 5 years as compared to the 1999 to 2003 period.

ANALYSIS AND FORECAST OF EMPLOYMENT AND BUILDING SPACE DEMAND AND STRATEGIC POLICY RECOMMENDATIONS FOR GREATER AIRPARK STUDY AREA
GRUEN GRUEN + ASSOCIATES PAGE 41
DENSITY CHARACTERISTICS OF EXISTING SUPPLY Table III-6 summarizes floor-area-ratio and employment density characteristics of different building types located within the Greater Airpark Study Area. The Maricopa County Association of Government’s 2007 employer database was geo-referenced and overlaid with a map of assessment parcels within the Study Area to produce the employment density estimates summarized below7.
TABLE III-6
Average Floor-Area-Ratios and Employment Densities for Existing Buildings Within Greater Airpark Study Area
Building Type
Average FAR
Average Employment Density # Square Foot per Worker
Single-story 0.26 301Two-story 0.33 244Three-story 0.54 313OFFICE1
Total 0.38 287Regional/community center 0.30 965Freestanding big-box 0.21 583RETAIL2 Total 0.27 814Industrial/manufacturing 0.38 543Warehouse 0.30 451Warehouse flex 0.33 470INDUSTRIAL3
Total 0.34 4841 Employment density calculation assumes a 17 percent office vacancy rate. 2 Employment density calculation assumes a four percent retail vacancy rate. 3 Employment density calculation assumes a nine percent industrial vacancy rate. Warehouse “flex” refers to space classified by the Maricopa County Assessor as a warehouse building with interior finish as office, retail or showroom space.
Sources: MAG 2007 Employer Database; City of Scottsdale; Maricopa County Assessor; Gruen Gruen + Associates.
The floor-area ratios for existing office space are estimated to range from 0.26 for single-story office buildings to 0.54 for three-story office buildings with an average of 0.38. This is a typical relatively low density suburban development pattern. The average density is 287 square feet per worker with the highest worker to space densities of 244 square feet per employee for two-story office space, and the lowest density of 313 square feet per employee for three-story office space. The floor–area ratios for retail space are estimated to average 0.27 with 814 square feet of space per employee. Big-box retail formats have relatively low
7 The estimates represent a random sample of more than 70 existing buildings, including more than five million square feet of building space, built between the years of 1974 and 2006 (for all of which parcel numbers and street addresses were verified to be consistent with the listing of business establishments compiled in MAG’s database). The primary commercial “building types” as classified by the Maricopa County Assessor include office (single and multi-story), retail, warehouse and industrial flex buildings (including a combination of warehouse space and office/retail/ showroom space).

ANALYSIS AND FORECAST OF EMPLOYMENT AND BUILDING SPACE DEMAND AND STRATEGIC POLICY RECOMMENDATIONS FOR GREATER AIRPARK STUDY AREA
GRUEN GRUEN + ASSOCIATES PAGE 42
floor-area ratios of 0.21 and an average employee density of one employee for every 583 square feet of space. The floor area ratio for regional and community center retail space is higher at 0.30, but the employment density ratio is lower at one worker for every 965 square feet of space. The floor-area ratios for industrial space are relatively low at an average of 0.34. The worker to space density is relatively high at one worker for every 458 square feet of space. This is due to non-industrial employees utilizing warehouse-flex space. In comparison to space located elsewhere in the County, floor-area-ratios and employment densities within the Greater Airpark Study Area are relatively consistent with the exception of office space. A building survey prepared by MAG in 2000 (summarized in the 2007 Socioeconomic Projections) indicates that floor-area-ratios for office buildings in the County averaged approximately 3.1 in 2000. While this density figure is much higher because it includes a number of high-rise office buildings (for example, the Camelback Esplanade) which are not found in the Greater Airpark, the survey indicated that floor-area-ratios for single and two-story office buildings were also higher than those found within the Greater Airpark. MAG estimated that single-story office building floor-area-ratios averaged approximately 0.40, while two-story office building floor-area-ratios approximated 0.77. By comparison, floor-area-ratios for single and two-story office buildings within the Greater Airpark are estimated to approximate 0.26 and 0.33 respectively. Employment densities for office buildings surveyed throughout the County in 2000 averaged approximately 325 square feet of space per employee. The low floor-area ratios found in the Greater Airpark Study Area reflect the constraints imposed by the current zoning regulations. The zoning regulations within the Greater Airpark permit in most cases a maximum height of 36 feet. Just west of the Study Area across Scottsdale Road in Phoenix, office uses are entitled up to 110 feet in height. The recently constructed Financial Center at Kierland (175,000 square feet) and Pinnacle at Kierland IV (210,000 square feet) office buildings include five to six stories at 60 to 86 feet in height8. Retail developments of various formats exhibited average floor-area-ratios ranging from approximately 0.23 to 0.27 in the 2000 MAG survey, similar to retail space found within the Study Area. Average employment densities ranged from approximately 770 to 1,400 square feet of retail space per employee, higher than employment densities estimated to currently apply to retail space within the Study Area. Floor-area-ratios for industrial uses averaged approximately 0.35 in the 2000 MAG survey of the County, also similar to existing industrial buildings within the Greater Airpark which currently average 0.33. Employment densities for industrial and warehouse uses in the 2000 survey were estimated to approximate 350 to 400 square feet of space per worker, while industrial and warehouse employment densities in the Greater Airpark are estimated to currently approximate 420 to 470 square feet of space per worker.
8 Building height data for the Pinnacle IV reported by its developer Furst Properties LLC.

ANALYSIS AND FORECAST OF EMPLOYMENT AND BUILDING SPACE DEMAND AND STRATEGIC POLICY RECOMMENDATIONS FOR GREATER AIRPARK STUDY AREA
GRUEN GRUEN + ASSOCIATES PAGE 43
SHIFT IN COMPOSITION OF BUILDING SPACE INVENTORY Table III-7 presents a more detailed summary of the supply of building space, by type of building, within the Greater Airpark Study Area. The data was extracted from a database maintained by the City of Scottsdale for commercial parcels located within the Airpark. Data from the Maricopa County Assessor was also used to identify the various building types that were aggregated into the categories below based on the County Assessor’s property use classifications.
TABLE III-7
Estimated Amount and Distribution of Building Space by Type of Building in Greater Airpark Study Area: 1995-2007
1995 2000 2005 2007Building Type # Sq. Ft. % # Sq. Ft. % # Sq. Ft. % # Sq. Ft. %Hotel/Resort 476,000 7.8 932,000 6.7 1,081,000 5.4 1,081,000 5.2Office 1,134,000 18.5 3,284,000 23.6 6,815,000 33.9 7,099,000 33.9Retail 571,000 9.3 2,526,000 18.2 3,521,000 17.5 3,653,000 17.4Industrial 262,000 4.3 413,000 3.0 513,000 2.6 513,000 2.4Warehouse 1,085,000 17.7 1,549,000 11.1 2,374,000 11.8 2,489,000 11.9Warehouse-Flex 2,606,000 42.5 5,208,000 37.4 5,787,000 28.8 6,113,000 29.2Total 6,134,000 100.0 13,913,000 100.0 20,091,000 100.0 20,947,000 100.0
Sources: City of Scottsdale; Maricopa County Assessor; Gruen Gruen + Associates. Smaller warehouse-flex buildings have historically been the predominant type of commercial building space located within the Greater Airpark. Just as the employment base shifted to professional and financial service sectors in recent years, so has the composition of building space. In 1995, warehouse-flex buildings represented nearly 43 percent of all building space located within the Greater Airpark while traditional warehouse and industrial building uses accounted for an additional 22 percent of the total inventory. Office buildings, totaling less than 1.2 million square feet of space, represented only 19 percent of all building space in 1995. In 2007, office buildings represented approximately 34 percent of all building space within the Greater Airpark Study Area. In 2007, warehouse-flex space comprised a smaller proportion than office, or 29 percent of all space within the Study Area. According to assessment records, approximately 40 percent of the growth in space or six million square feet of space occurred in the office space category. Approximately 3.1 million square feet of retail space was built between 1995 and 2007. Much of the growth in the retail inventory however occurred between 1995 and 2000. Similarly, the inventory of flex space grew substantially between 1995 and 2000, increasing by approximately 100 percent or 2.6 million square feet. Over the past seven years, however, the flex space inventory grew by only 900,000 square feet of space. By comparison, other competing supply locations such as Deer Valley have added more than a half million square feet of flex space in the past two years alone.

ANALYSIS AND FORECAST OF EMPLOYMENT AND BUILDING SPACE DEMAND AND STRATEGIC POLICY RECOMMENDATIONS FOR GREATER AIRPARK STUDY AREA
GRUEN GRUEN + ASSOCIATES PAGE 44
CHAPTER IV
FINDINGS AND CONCLUSIONS DRAWN FROM SURVEYS AND INTERVIEWS
SUMMARY
• The primary reason firms decide to locate in the Greater Airpark relates to proximity to desirable residential areas in north Scottsdale and quality of life factors;
• Compared to GG+A survey findings in 1999, a higher proportion of employees live
outside of Scottsdale than ten years ago;
Competition has become intense and other developments located near but outside the Scottsdale boundaries of the Study Area are capitalizing on the positive image of Scottsdale and competing for businesses that formerly would have focused their search in the Greater Airpark. Office space users attracted to the Study Area are concentrated in the finance, insurance and real estate sectors, professional, technical, medical and business service sectors. The Study Area has also emerged as a location for regional and corporate headquarters. Land and building prices are too high to support warehousing uses. The outflow of smaller, lower margin wholesaler and industrial users and inflow of high technology users can be expected. Many flex space uses will include a high component of office space and research and development functions. The primary disadvantages of the Study Area for office space and flex space users, especially the traditional Airpark core, relate to a limited supply of available land for office development; higher rental rates for comparable buildings; and traffic congestion due in part to the presence of the Scottsdale Airport, which impedes traffic flows. The traffic constraints have become severe enough to influence location decisions. HOSPITALITY SURVEY As part of the original (1999) analysis and forecast of the economic base of Scottsdale and the Greater Airpark, GG+A conducted a survey of hotels. Findings and conclusions from the analysis of the survey included the following:
• The hotels indicated that the percentage of total visitors that are estimated to fly in and out of the Scottsdale Airport average 3.1 percent;
• Special events including NASCAR, Barrett Jackson Car Auction, Spring Training,
PGA Golf, and the Arabian Horse Show are important to generating hotel room

ANALYSIS AND FORECAST OF EMPLOYMENT AND BUILDING SPACE DEMAND AND STRATEGIC POLICY RECOMMENDATIONS FOR GREATER AIRPARK STUDY AREA
GRUEN GRUEN + ASSOCIATES PAGE 45
night demand; and
• Of the employees of hotels north of Cactus Road, 72 percent reside in Phoenix and 17 percent in Scottsdale.
EMPLOYER SURVEY As part of the original (1999) analysis and forecast of the economic base of Scottsdale and the Greater Airpark, GG+A conducted a survey of 240 employers located in the Greater Airpark. Findings and conclusions drawn from the survey included the following:
• The primary reason firms decide to locate in the Greater Airpark relates to proximity to desirable residential areas in north Scottsdale and quality of life factors;
• Markets and customers served typically are outside of the Greater Airpark;
• Businesses operated out of a diverse set of building types, and performed a wide
variety of functions;
• About 69 percent of the firms in the sample leased or subleased their facilities, while 31 percent owned their facilities;
• Employee density ratios averaged 800 square feet per employee overall, and 1,388
gross square feet per on-site wholesale/retail trade employee, 573 square feet for services firms and 554 square feet per employee for manufacturing firms; and
• About one-half of the employees then working in the Airport/Sonoran Regional
Core character areas resided in the City of Phoenix, while 31 percent resided in the City of Scottsdale and five percent each in the cities of Glendale and Mesa. The three dominant labor market zip code areas that defined the primary labor market area included 85032, 85260, and 85254.
SCOTTSDALE AREA CHAMBER OF COMMERCE AIRPARK BUSINESS NEEDS SURVEY In May and June 2008, the Scottsdale Area Chamber of Commerce conducted a survey of businesses in the Greater Airpark Approximately 54 percent of the respondents are located in zip code area 85260, 16 percent are in zip-code area 85254, and 13 percent are in zip code area 85255. Zip code area 85260 is generally consistent with the Greater Airpark Study Area, while zip code 85254 is located west of Scottsdale Road in Phoenix. About 47 percent of the respondents are in business and professional services and in financial and insurance sectors.

ANALYSIS AND FORECAST OF EMPLOYMENT AND BUILDING SPACE DEMAND AND STRATEGIC POLICY RECOMMENDATIONS FOR GREATER AIRPARK STUDY AREA
GRUEN GRUEN + ASSOCIATES PAGE 46
Findings drawn from the Chamber of Commerce survey include the following:
• Approximately 83 percent of employees live outside of the City of Scottsdale with approximately 40 percent of commuters originating from residences in the East Valley, 40 percent from Phoenix, and about 20 percent from the West Valley;
• Compared to GG+A survey findings in 1999, a higher proportion of employees live
outside of Scottsdale than ten years ago;
• Accessibility to labor is a key requirement and advantage; • Transportation and traffic issues are of primary importance with 63 percent of
respondents indicating a preference for improved public transportation options, including an increase in bus routes and the frequency of bus service, dedicated street car/trolley service, and dedicated bus rapid transit lines along Highway 101. Approximately 65 percent of respondents indicated the expansion of the freeway system as important to the growth of their businesses;
• Approximately 81 percent of respondents identified as important improvements in
technology and other infrastructure. Improvements respondents desire relate to more reliable and available broadband access and telecommunication services and transportation infrastructure.
• Approximately 49 percent of respondents indicated increasing options for workforce
housing as important to the growth of their businesses; and
• Factors influencing the location decision included: the image of Scottsdale and quality of life advantages; accessibility of the location; and proximity to residences of the decision-makers.
FINDINGS AND CONCLUSIONS DRAWN FROM INTERVIEWS THE PRIMARY MARKET AREA FOR OFFICE SPACE Interviews with real estate brokers, office space developers, and office building owners and review of supply and tenanting trends suggest that the primary market area within which office space in the Greater Airpark Study Area typically competes for office users includes:
• The Study Area; • Desert Ridge (Freeway 101 and Tatum) west of the Study Area; • The Deer Valley/Interstate 17 corridor; • The Kierland area; and

ANALYSIS AND FORECAST OF EMPLOYMENT AND BUILDING SPACE DEMAND AND STRATEGIC POLICY RECOMMENDATIONS FOR GREATER AIRPARK STUDY AREA
GRUEN GRUEN + ASSOCIATES PAGE 47
• The Alter Group Riverwalk and the Opus Group Pima Center along Freeway Loop 101 on the lands of the Salt River Pima-Maricopa Indian Community.
As described below, supply competition has greatly increased since the completion of the original study. Office space developed on the Indian Community in the past five years totals approximately 1.7 million square feet. The Deer Valley/I-17 corridor has experienced approximately one million square feet of office space built within the past two years and its current inventory of office space totals 10.6 million square feet (about 50 percent larger than the Greater Airpark). The Kierland area has an office inventory of approximately 2.8 million square feet. Table IV-1 summarizes asking rental rates and the supply of space currently available in locations which compete with the Greater Airpark for office space tenants.
TABLE IV-1
Competing Office Supply Locations Submarket
Loop 101/ Salt River
Reservation
Kierland Commons
Area
Deer Valley/
I-17 Greater Airpark
Average Full Service Rents $27.10 $30.10 $24.30 $28.50Available Space 536,000 722,700 250,600 1,010,400Class A Current Vacancy Rate 52.8% 42.1% 6.6% 29.8%Average Full Service Rents $25.80 $26.50 $24.00 $26.30Available Space 152,200 139,700 1,830,600 868,500Class B Current Vacancy Rate 21.4% 13.0% 28.6% 24.4%
Sources: CoStar; City of Scottsdale; Gruen Gruen + Associates. Office projects adjoining Loop 101 located on Indian Community land (the Riverwalk Arizona and Pima Center) currently include approximately 1.7 million square feet of office space. All but 85,000 square feet of space within this submarket has been developed since 2004. Quoted full-service rental rates for Class A space average $27.10 per square foot. Full service rental rates for Class A office space in the Riverwalk Arizona and Pima Center developments are approximately $1.40-per-square-foot lower than full service rents within the Greater Airpark. Class B rental rates average approximately $25.80 per square foot, comparable to rents in the Greater Airpark. According to CoStar, 688,000 square feet of office space is available in this location. The Kierland Commons area just west of the Greater Airpark Study Area adjoining Scottsdale Road is reported to include approximately 2.8 million square feet of office space. Approximately 723,000 square feet of Class A office space is currently available. Class A office space rents are slightly higher than average rental rates in the Greater Airpark at approximately $30 per square foot. A much smaller inventory of Class B space is available in the Kierland Commons area. Class B office space rents in Kierland Commons approximate $26.50 per square foot, nearly the same rent as reported for Class B office space in the Greater Airpark.

ANALYSIS AND FORECAST OF EMPLOYMENT AND BUILDING SPACE DEMAND AND STRATEGIC POLICY RECOMMENDATIONS FOR GREATER AIRPARK STUDY AREA
GRUEN GRUEN + ASSOCIATES PAGE 48
The Deer Valley/I-17 Corridor office submarket has space available at substantially lower rental rates. Approximately one million square feet of space has been built in the past two years. Full service rental rates for Class A space in the Deer Valley submarket approximates $24.30 per square foot, or approximately $4.20 per square foot or 15 percent lower than the same space within the Greater Airpark. A limited amount of Class A space is currently available in the Deer Valley area. Class B rents in the Deer Valley submarket are approximately $2.30 per square foot lower than Greater Airpark Class B rental rates. The analysis of conditions of the office market inventory confirm the interview findings that competition has become intense and that other developments located near but outside the Scottsdale boundaries of the Study Area are capitalizing on the positive image of Scottsdale and competing for businesses that formerly would have focused their search in the Greater Airpark. GEOGRAPHIC ORIGINS OF OFFICE SPACE USERS A great deal of demand for office space originates from within the Study Area. For example, a representative of one firm we interviewed started out in approximately 1,200 square feet of office space on Raintree, then moved to a space on Redfield for three years and now has expanded to 2,200 square feet on Gelding. Office users have also been attracted from locations in Central Phoenix as well as from out-of-state. TYPES OF OFFICE SPACE USERS ATTRACTED Office space users attracted to the Study Area are concentrated in the finance, insurance and real estate sectors, professional, technical, medical and business service sectors. The Study Area has also emerged as a location for regional and corporate headquarters. For example, the Dial Corporation and Discount Tire selected the Study Area for their headquarters and Vanguard has a major regional facility in the Study Area. COMPETITIVE POSITION OF GREATER AIRPARK STUDY AREA FOR ATTRACTING OFFICE SPACE USERS To help forecast future office space demand and assess the competitive position of the Greater Airpark Study Area as a location for office space, we conducted research to identify the comparative advantages and disadvantages of the Study Area as a location for office space. Primary Comparative Advantages The following comparative advantages apply to the Study Area as an office location:
• Accessibility to Freeway Loop 101, Sky Harbor Airport, and Scottsdale Airport (The

ANALYSIS AND FORECAST OF EMPLOYMENT AND BUILDING SPACE DEMAND AND STRATEGIC POLICY RECOMMENDATIONS FOR GREATER AIRPARK STUDY AREA
GRUEN GRUEN + ASSOCIATES PAGE 49
Scottsdale Airport is desirable to high-income executives visiting Scottsdale for special events or business meetings);
• Proximity to housing locations of decision-makers and a large commute shed,
providing excellent access to a large labor base, including affordable housing in northeast Phoenix;
• Proximity to a large base of high-quality support services and amenities, including
lodging and dining options;
• A prestigious image in a safe and secure environment offering “quality of life” advantages; and
• A location within an agglomeration or “critical mass” that helps businesses attract
and retain labor and operate cost effectively and productively. Primary Disadvantages The primary disadvantages of the Study Area, especially the traditional Airpark core, relate to a limited supply of available land for office development; higher rental rates for comparable buildings; and traffic congestion due in part to the presence of the Scottsdale Airport, which impedes traffic flows. The traffic constraints have become severe enough to influence location decisions. Decision-makers which live in Paradise Valley, for example, tend to select locations in the western portion of the Study Area, while others which live in the DC Ranch area prefer locations on the east side of the Study Area. A perceived constraint relates to the entitlement process, and the potential for higher costs and uncertainty due to “last-minute” project negotiations and requests. In addition, the interviews suggest that infrastructure for telecommunications, broadband access, and transportation could be enhanced. THE PRIMARY MARKET AREA FOR FLEX SPACE For flex space, including high-technology manufacturing and combinations of assembly and services, the primary market area includes the Greater Airpark Study Area as well as Deer Valley to the west, Tempe and Mesa to the south and the Salt River Pima-Maricopa Indian Community lands. The interviews indicating the emergence of Deer Valley as a primary supply option is confirmed by the Deer Valley industrial submarket now containing approximately 15.1 million square feet, almost double the size of the Greater Airpark’s inventory.

ANALYSIS AND FORECAST OF EMPLOYMENT AND BUILDING SPACE DEMAND AND STRATEGIC POLICY RECOMMENDATIONS FOR GREATER AIRPARK STUDY AREA
GRUEN GRUEN + ASSOCIATES PAGE 50
GEOGRAPHIC ORIGINS OF FLEX TYPE SPACE USERS Much of the demand originates from the expansion of existing firms in the market area. Because of the positive image and strong brand, the Study Area also attracts out-of-state firms seeking to expand into the region. TYPES OF FLEX TYPE SPACE USERS ATTRACTED Land and building prices are too high to support warehousing uses. While the Deer Valley submarket has added about 1.4 million square feet of industrial and flex space over the past two years, the Greater Airpark has added only 106,000 square feet of this type of space during the same period. Users engaging in research and development, and combinations of manufacturing, distribution, and services or retailing are likely to comprise the bulk of user demand. The consideration of advantages and disadvantages indicate the outflow of smaller, lower margin wholesaler and industrial users and inflow of high technology users can be expected. Many flex space uses will include a high component of office space and research and development functions. COMPETITIVE POSITION OF AIRPARK AREA FOR ATTRACTING FLEX TYPE SPACE USERS Primary Comparative Advantages The advantages for flex space users are similar to those for office users described above. The base of amenities and quality of life advantages are key advantages. Primary Disadvantages The disadvantages for flex space users are similar to those for office users described above with higher costs and traffic congestion key disadvantages. For those types of industrial users that employ lower skilled workers, access to labor is a particular disadvantage.

ANALYSIS AND FORECAST OF EMPLOYMENT AND BUILDING SPACE DEMAND AND STRATEGIC POLICY RECOMMENDATIONS FOR GREATER AIRPARK STUDY AREA
GRUEN GRUEN + ASSOCIATES PAGE 51
CHAPTER V
FORECAST OF THE STRUCTURE AND SIZE OF THE
EMPLOYMENT BASE OF THE GREATER AIRPARK STUDY AREA INTRODUCTION This chapter presents GG+A’s forecast of the structure and size of the employment base of the Greater Airpark Study Area by economic sector. The results of the analysis of employment trends described in Chapter II, the land use characteristics and development trends described in Chapter III, results of surveys and interviews described in Chapter IV and the employment forecast presented in this chapter serve as inputs into the identification of the types of businesses likely to be attracted to the Airpark Area and our forecasts of the demand for office and other types of space presented in Chapter VI. To make the employment forecast for the Greater Airpark Study Area, we used an econometric technique called shift-share. The shift-share analysis assesses the local influence on industry growth and can indicate whether an industry appears to be thriving or declining in the local environment. Based on a synthesis of the employment trends, interviews, review of land use characteristics and real estate supply data, and the shift share analysis reviewed below, we identified those economic sectors that have a significant local effect resulting from factors that distinguish the Study Area from the larger regional economy. The shift-share methodology involves preparing a series of equations that predict the rate of employment growth in an economic sector of a local area such as the Greater Airpark Study Area, as a function of the predicted rate of growth in that sector in a larger area such as the City of Scottsdale. In order to complete the forecast of employment by economic sector for the Study Area, we used a projection of employment by land use (and not by economic sector) prepared by the Maricopa County Association of Governments (“MAG”) in 2007 for the City of Scottsdale as a whole. Based on analysis of past employment by economic sector and estimates of the primary types of space usage associated with various economic sectors, GG+A converted the MAG employment forecast by land use to a forecast of employment by economic sector. SUMMARY The economic sectors of business services, retail, finance, insurance and real estate, and education and health services have benefited from local factors within the Airpark Area economy that contributed more to the strong growth of these industries than regional changes within the City of Scottsdale. Total Greater Airpark employment is projected to grow at an annual rate of 2.1 percent between 2007 and 2020, increasing by approximately 13,000 jobs or 31 percent.

ANALYSIS AND FORECAST OF EMPLOYMENT AND BUILDING SPACE DEMAND AND STRATEGIC POLICY RECOMMENDATIONS FOR GREATER AIRPARK STUDY AREA
GRUEN GRUEN + ASSOCIATES PAGE 52
FIGURE V-1
Historical and Forecast Greater Airpark Employment Growth
0
10,000
20,000
30,000
40,000
50,000
60,000
1995 2000 2005 2010 2015 2020
# JOBS
Services Trade Goods Production/Movement TOTAL
Forecast Period
Source: Gruen Gruen + Associates
We forecast that the employment base will continue to evolve in favor of services, primarily in the professional and business services sector. We predict that Scottsdale and the Greater Airpark, in particular, will continue to experience faster job growth than population growth by drawing workers from and serving markets well beyond the City. We forecast growth in the FIRE sector will constitute the second largest source of projected job growth. Together, employment in the professional and business services and FIRE sectors will constitute 44 percent of the Study Area’s employment base by 2020, up from about 38 percent in 2007. FORECAST OF CITY OF SCOTTSDALE EMPLOYMENT BY LAND USE Table V-1 presents MAG’s forecast of employment by land use for the City of Scottsdale from 2005 through 2030.

ANALYSIS AND FORECAST OF EMPLOYMENT AND BUILDING SPACE DEMAND AND STRATEGIC POLICY RECOMMENDATIONS FOR GREATER AIRPARK STUDY AREA
GRUEN GRUEN + ASSOCIATES PAGE 53
TABLE V-1
Employment Forecast by Land Use for the City of Scottsdale: 2005-2030 Land Use
2005
#
2010
#
2020
#
2030
#
Change 2005-2030
#
Projected Growth Rate
%Retail 56,592 61,955 67,207 68,569 11,977 0.8Office 60,423 71,785 83,935 93,834 33,411 1.8Industrial 19,665 21,659 23,477 25,207 5,542 1.0Public 11,903 15,112 16,613 18,330 6,427 1.7Other1 33,041 37,549 41,587 46,061 13,020 1.3Total 181,624 208,060 232,819 252,001 70,377 1.31 “Other” employment is a residual of total estimated employment less employment identified within the four primary land use classifications. Thus, other employment generally includes jobs in the construction, hotel/resort, medical and utility sectors, in addition to work-at-home employment.
Sources: MAG, Projections 2007; Gruen Gruen + Associates. MAG projects that Scottsdale’s employment base will grow by approximately 70,000 jobs over the 25-year period increasing at an average annual rate of 1.3 percent.9 Between 2005 and 2020, total Scottsdale employment is projected to grow at an average annual rate of approximately 1.7 percent.10 Office land uses are projected to experience the highest rate of employment growth, increasing by approximately 33,400 jobs at an average annual growth rate of 1.8 percent. Industrial land uses are projected to grow at 1.0 percent annually, increasing by approximately 5,500 jobs. FORECAST OF CITY OF SCOTTSDALE EMPLOYMENT BY ECONOMIC SECTOR Table V-2 shows a forecast of city-wide employment by economic sector from 2007 to 2020. The forecast is based on MAG’s forecast of employment by land use as presented above in Table V-1. In order to translate projected growth by land use category into the appropriate
9 MAG projections by land use are based a combination of methodologies and top-down county-level controls. The base year employment estimate (2005) is based on MAG’s employer database, in which each employer was assigned a land use classification from an existing land use database compiled by MAG. These estimates were then adjusted to include construction and work-at-home employment and employers with fewer than five employees. The base year employment estimates were prepared for each Socioeconomic Analysis Zone (“SAZ”) and adjusted so that the sum of all zones was consistent with County level estimates. The future projections are based largely on physical factors (anticipated future land use, vacant land, etc) and building and worker density assumptions. The forecasts by land use are subsequently prepared for an “at build-out” condition. To adjust the build-out projections for timing and pace of projected growth and development, MAG employed a “sub-regional” employment forecast model (EMPAL, the EMPloyment Allocation Model). Taking into account the County-level projections, the EMPAL model was used to project the spatial distribution of employment by zone and by sector to ultimately allocate these projections to each Socioeconomic Analysis Zone. 10 For Maricopa County, MAG forecasts employment growth from 2005 to 2030 of 1.6 million for an average annual growth rate of 2.7 percent.

ANALYSIS AND FORECAST OF EMPLOYMENT AND BUILDING SPACE DEMAND AND STRATEGIC POLICY RECOMMENDATIONS FOR GREATER AIRPARK STUDY AREA
GRUEN GRUEN + ASSOCIATES PAGE 54
economic sectors, we utilized assumptions relating to the distribution of industry employment by land use. After redistributing 2007 industry sector employment into the appropriate land use categories, we applied the projected growth rates for each land use category to arrive at employment projections by industry sector.
TABLE V-2
Forecast of City of Scottsdale Employment by Sector: 2007-2020
2007 #
2020 #
Projected Growth Rate
2007-2020 %
Share of Total 2007
Employment %
Share of Total 2020
Employment %
Agriculture, Mining & Utilities 275 336 1.5 0.2 0.2Construction 10,332 12,612 1.5 6.6 6.5Manufacturing 12,797 15,340 1.4 8.1 7.9Wholesale Trade 5,826 6,984 1.4 3.7 3.6Retail Trade 18,674 21,674 1.2 11.9 11.1Transportation & Warehousing 1,704 2,043 1.4 1.1 1.0Information 3,058 3,966 2.0 1.9 2.0Finance, Insurance & Real Estate 21,678 28,090 2.0 13.8 14.4Professional & Business Services 34,962 44,973 2.0 22.3 23.1Education & Health Services 18,880 23,732 1.8 12.0 12.2Leisure & Hospitality 20,183 24,031 1.4 12.8 12.4Other Services 5,621 6,619 1.3 3.6 3.4Government 3,110 4,152 2.2 2.0 2.1Total 157,100 194,550 1.7 100.0 100.0
Sources: Maricopa Association of Governments; Gruen Gruen + Associates. Based on a projected annual growth rate of 1.7 percent, total Scottsdale employment is forecast to increase by approximately 38,000 jobs from 157,000 in 2007 to 195,000 in 202011. Office-using industry sectors such as FIRE, professional services, and information are forecast to experience the highest rate of growth while retail-using sectors such as retail trade, personal services and hospitality are projected to experience the lowest rates of growth. The projections for the City indicate the employment base will continue to shift away from sectors related to the production, movement and sale of goods towards the financial and service-related industries. The professional service and FIRE sectors are forecast to grow by approximately 16,400 jobs, representing approximately 38 percent of the employment base in 2020. The retail trade sector is projected to grow at 1.2 percent annually, increasing by approximately 3,000 jobs over the next 13 years. At projected annual growth rates of 1.4 to 1.5 percent, the construction, manufacturing, wholesale trade and transportation and distribution sectors are forecast to grow, collectively, by approximately
11 Total industry employment within the City of Scottsdale (currently estimated to approximate 157,000 jobs) is lower than presented in MAG’s socioeconomic projections because (a) it does not include “work-at-home” employment, and (b) our review of MAG’s employer database indicates that some businesses actually located west of Scottsdale Road in Phoenix (for example) are described as being within the City of Scottsdale. The historical and current employment estimates by industry sector for the City of Scottsdale presented in this report do not include these businesses.

ANALYSIS AND FORECAST OF EMPLOYMENT AND BUILDING SPACE DEMAND AND STRATEGIC POLICY RECOMMENDATIONS FOR GREATER AIRPARK STUDY AREA
GRUEN GRUEN + ASSOCIATES PAGE 55
6,300 jobs between 2007 and 2020. Education and health services employment is projected to grow at an annual rate of 1.8 percent, increasing from a current base of approximately 18,900 jobs to 23,700 jobs by 2020. Leisure and hospitality employment is projected to grow modestly at 1.4 percent annually, increasing by approximately 3,900 jobs between 2007 and 2020. FORECAST OF GREATER AIRPARK STUDY AREA EMPLOYMENT: 2007-2020 Table V-3 summarizes three “components of growth” derived from analysis of past employment trends for the Greater Airpark Study Area.
TABLE V-3
Components of Greater Airpark Employment Growth: 1995-2007 Industry
Change in Employment
#
Regional Component
#
Industry Mix
#
Competitive Component
#
Competitive Growth Rate
%Agriculture, Mining & Utilities -48 36 -83 -1 -0.10%Construction 2,326 989 -48 1,384 3.65%Manufacturing 2,293 1,005 -543 1,831 4.52%Wholesale Trade 294 916 -700 78 0.27%Retail Trade 3,354 980 -299 2,673 6.15%Transportation & Warehousing 477 212 -188 453 5.11%Information 567 199 -287 654 7.03%Finance, Insurance & Real Estate 4,521 606 122 3,792 10.74%Professional & Business Services 6,631 1,287 2,515 2,828 5.23%Education & Health Services 1,078 156 -72 994 10.86%Leisure & Hospitality 335 1,059 -338 -386 -1.25%Other Services 629 241 7 381 4.03%Total Private Sector 22,457 7,688 88 14,681 4.69%
Sources: Maricopa Association of Governments; City of Scottsdale; Gruen Gruen + Associates. The regional component refers to the number of jobs that would have been added between 1995 and 2007 due only to growth throughout the City of Scottsdale as a whole. If, for example, the Greater Airpark’s retail employment had been influenced by no other factor than the rate at which the total City employment grew, retailing in the Greater Airpark would have increased by 980 jobs. The industry mix indicates the employment growth within a particular industry that would have occurred if and only if employment in the Study Area employment were influenced by the share of total employment comprised by that particular industry throughout the larger City of Scottsdale base. Thus, if the manufacturing base within the Airpark were only affected by the share of total City-wide employment comprised by manufacturing businesses, then manufacturing jobs in the Study Area would have actually declined by 550.

ANALYSIS AND FORECAST OF EMPLOYMENT AND BUILDING SPACE DEMAND AND STRATEGIC POLICY RECOMMENDATIONS FOR GREATER AIRPARK STUDY AREA
GRUEN GRUEN + ASSOCIATES PAGE 56
The competitive component represents the largest share of the total employment change in the Greater Airpark Study Area. This measure represents the rate at which the industry is shifting to the Study Area from the City of Scottsdale as a whole. Industries with a positive competitive component are growing faster than the regional component represented by the City as a whole. The economic sectors with the largest competitive components during this period were the business services, retail, finance, insurance and real estate, and education and health services. This indicates that local factors within the Airpark Area economy contributed more to the strong growth of these industries than regional changes within the City. This also suggests that the Airpark Area provides a comparative advantage for these industries that is likely to continue to accelerate growth at a faster pace than the City-wide industry base. Other than the small agriculture and mining sector, only one industry, the leisure and hospitality sector, is growing slower than the sector is growing in the City as a whole. The industry sectors with the lowest competitive components during this ten year period were, in addition to the hospitality and agriculture and mining sectors, wholesale trade, construction, manufacturing, and personal service sectors. Table V-4 presents GG+A’s forecast of employment by economic sector for the Greater Airpark Study Area from 2007 to 2020.
TABLE V-4
Forecast of Greater Airpark Employment: 2007 - 20201 Industry
Actual 2007
Employment #
Forecast 2020
Employment #
Forecast Change
2007-2020 #
Forecast Change
2007-2020 %
Forecast Annual Growth Rate
2007-2020 %
Agriculture, Mining & Utilities 50 30 -20 -40 -3.8Construction 4,900 5,230 330 7 0.5Manufacturing 4,910 5,590 680 14 1.0Wholesale Trade 2,680 2,860 180 7 0.5Retail Trade 5,910 7,640 1,730 29 2.0Transportation & Warehousing 1,030 1,250 220 21 1.5Information 1,090 1,410 320 29 2.0Finance, Insurance & Real Estate 6,100 9,250 3,150 52 3.3Professional & Business Services 9,990 15,130 5,140 51 3.3Education & Health Services 1,480 2,250 770 52 3.3Leisure & Hospitality 3,100 3,300 200 6 0.5Other Services 1,260 1,530 270 21 1.5Total Private Sector 42,490 55,470 12,980 31 2.11 Figures are rounded.
Source: Gruen Gruen + Associates

ANALYSIS AND FORECAST OF EMPLOYMENT AND BUILDING SPACE DEMAND AND STRATEGIC POLICY RECOMMENDATIONS FOR GREATER AIRPARK STUDY AREA
GRUEN GRUEN + ASSOCIATES PAGE 57
Total Greater Airpark employment is projected to grow at an annual rate of 2.1 percent between 2007 and 2020, increasing by approximately 13,000 jobs or 31 percent. Services The synthesis of the surveys, interviews, and secondary data analysis indicate that a key factor in the retention, expansion, and attraction of new businesses relates to the desirable quality of life that makes decision-makers want to work as well as live in Scottsdale. The large hospitality sector, including eating and drinking establishments and recreational facilities, contributes significantly to the quality of life advantage. The hospitality industry thus indirectly contributes to the growth of professional and business services. We forecast that the employment base will continue to evolve in favor of services. Using the unadjusted annual growth rates produced by the shift-share analysis of 7.2 percent for professional and business services, 12.6 percent for educational and health services and 5.3 percent for other services would result in a projected 21,000 increase in the total number of jobs within these industry sectors. Although these projected annual growth rates are in fact lower than the annual rate of growth that occurred over the past twelve years within these sectors, the sheer magnitude of the number of jobs forecast using the unadjusted shift share model is unlikely to materialize. We predict, however, that Scottsdale and the Greater Airpark, in particular, will continue to experience faster job growth than population growth by drawing workers from and serving markets well beyond the City’s boundaries. We have adjusted the annual growth rate for professional and business services and education and health services to a still high 3.25 percent. We project that other (personal) services will grow modestly at 1.5 percent annually, although still representing a very small component of the employment base by 2020 given the limited household population within the Greater Airpark. The growth rate assumptions equate to a projected addition of 6,200 jobs in the professional and business services, education and health services, and other services sector by 2020. Consistent with historical growth, we project that employment in the leisure and hospitality sector will continue to grow slowly, at 0.5 percent annually, resulting in approximately 200 added jobs by 2020. Finance, Insurance and Real Estate The unadjusted shift-share model projects that employment in the FIRE sector will increase at a rate of 12.7 percent. While the Airpark’s comparative advantages are significant for the FIRE sector, we believe the rate of growth of future employment in the sector will decline and that office space available near but outside of the Greater Airpark (e.g., more than two million square feet of office space within and adjoining Kierland Commons) will reduce the amount of employment captured within the Greater Airpark. While much lower than the nearly 12 percent annual growth rate from 1995 through 2007, we still, however, project a strong employment annual growth rate of 3.25 percent over the longer-term. This growth rate results in an estimated increase of 3,200 jobs between 2007 and 2020 for the largest percentage growth of 52 percent (and second largest source of projected job growth).

ANALYSIS AND FORECAST OF EMPLOYMENT AND BUILDING SPACE DEMAND AND STRATEGIC POLICY RECOMMENDATIONS FOR GREATER AIRPARK STUDY AREA
GRUEN GRUEN + ASSOCIATES PAGE 58
Retail Trade The unadjusted shift-share model projects that retail trade employment will increase by 7.3 percent annually. Historically, retail employment has grown by 7.2 percent annually. With residential growth slowing, the growth of retail supply competition outside the Study Area, and the increase in etailing, we have adjusted the shift-share model forecast to a 2.0 percent annual growth rate. The retail trade sector is projected to grow by approximately 1,700 jobs or 29 percent. To put this future employment growth into perspective, a rough estimate of demand for retail goods and services indicates that between 2009 and 2020, total retail expenditure potential is projected to increase by approximately $820,000,000 within an approximately 20-minute-drive-time from the Greater Airpark. When this potential is added to the demand from the existing household and employment base, the total future demand can reasonably be expected to support the forecast retail employment12. Manufacturing The unadjusted shift-share model forecasts that manufacturing employment will grow at approximately six percent annually. From 1995 through 2007 manufacturing employment grew at a high rate of 5.4 percent, but most (65 percent) of the employment growth occurred between 1995 and 2000. Since 2000, manufacturing employment has increased at an annual rate of 2.6 percent within the Greater Airpark. The interviews suggest that quality of life advantages will keep some manufacturing companies in the Study Area despite higher occupancy costs and the need to import non-executive labor. The availability of newer, lower cost industrial space in the Deer Valley submarket and other supply options, the ability to relocate some production to lower cost-areas, and increasing labor productivity will cause the rate of employment growth to slow. We project that the manufacturing base will continue to expand, but at much lower rate than has historically been the case. At a one percent annual growth rate between 2007 and 2020, manufacturing employment is forecast to increase by approximately 700 jobs or 14 percent. Construction The unadjusted shift-share model projects construction employment growth of five percent. The model is influenced by the substantial growth of construction employment that occurred from 2005 through 2007 during the development boom (construction employment grew by more than 50 percent in this two-year period). Since 2005, an increase of 35 construction firms occurred in the Study Area. It will take time for construction jobs to rebound from recent losses. Given the significant spike in vacancy rates for a variety of land
12 The $820,000,000 expenditure estimate was derived from the following calculations:
(1) The 20-minute drive-time area will experience a net addition of approximately 39,000 households between 2009 and 2020 (according to MAG forecasts); and
(2) Assuming households will expend 20 percent of their income, which is estimated to currently average $105,000, on retail goods and services.
This expenditure potential, at one retail worker per every 750 square feet of space and a sales per square foot threshold of $300, would support 3,650 additional workers.

ANALYSIS AND FORECAST OF EMPLOYMENT AND BUILDING SPACE DEMAND AND STRATEGIC POLICY RECOMMENDATIONS FOR GREATER AIRPARK STUDY AREA
GRUEN GRUEN + ASSOCIATES PAGE 59
uses in the past year, the large number of vacant homes and curtailed housing developments, and reduction in land available for development in Scottsdale, employment growth is likely to moderate to closer to 0.5 percent per year. Construction employment is forecast to grow by only 330 jobs by 2020. Wholesale Trade The number of wholesale trade establishments has declined in the Study Area and historical employment growth of one percent is one of the slowest growing sectors. The interviews suggest wholesale trade firms will tend to locate in lower cost locations closer to labor sources. We have adjusted the shift-share model annual growth rate forecast of 1.6 percent to 0.5 percent. Information Information employment grew robustly from 1995 through 2000, but has since declined. The decline in this sector in more recent history has been largely attributable to several of the largest information businesses leaving the Study Area. Three large businesses in this sector – VODAVI Communication Systems (94 employees), Cox Communications (108 employees), and Tech USA (200 employees) – all relocated from the Study Area to other locations in Phoenix between 2000 and 2007. Although this sector represents a small share of overall employment, the results of the shift-share model indicate that over the long-term, information employment will grow. We have adjusted the results of the shift-share model downwards to reflect a more modest growth rate of two percent annually. This projection results in approximately 300 added jobs in the information sector by 2020. Transportation and Warehousing Transportation and warehousing employment grew robustly off a low base to 2005, but has since declined significantly. While employment in this sector in Scottsdale is likely to continue to be concentrated in the Study Area and the number of firms in the transportation and warehousing sector has increased in the Study Area, transportation and warehousing employment is likely to experience higher growth outside of Scottsdale. We adjust the shift-share model forecast of 5.5 percent to 1.5 percent. SHIFTS IN SHARE OF EMPLOYMENT BASE Table V-5 shows the share of total forecast Greater Airpark Study Area employment each economic sector is forecast to comprise by 2020.

ANALYSIS AND FORECAST OF EMPLOYMENT AND BUILDING SPACE DEMAND AND STRATEGIC POLICY RECOMMENDATIONS FOR GREATER AIRPARK STUDY AREA
GRUEN GRUEN + ASSOCIATES PAGE 60
TABLE V-5
Projected Share of Greater Airpark Employment Comprised by Each Sector1
1995
%2000
%
2007
%
Projected2020
%Shift 2007-2020
Percentage PointsAgriculture, Mining & Utilities 0.5 0.1 0.1 0.1 -0.1Construction 12.9 8.4 11.5 9.4 -2.1Manufacturing 13.1 13.4 11.6 10.1 -1.5Wholesale Trade 11.9 7.8 6.3 5.2 -1.2Retail Trade 12.8 18.9 13.9 13.8 -0.1Transportation & Warehousing 2.8 2.8 2.4 2.3 -0.2Information 2.6 5.7 2.6 2.5 0.0Finance, Insurance & Real Estate 7.9 6.1 14.4 16.7 2.3Professional & Business Services 16.7 21.8 23.5 27.3 3.8Education & Health Services 2.0 2.4 3.5 4.1 0.6Leisure & Hospitality 13.8 8.3 7.3 6.0 -1.3Other Services 3.1 4.2 3.0 2.7 -0.2Total Private Sector 100.0 100.0 100.0 100.0 0.01 Figures are rounded. Totals may not add due to rounding.
Sources: Maricopa Association of Governments; City of Scottsdale; Gruen Gruen + Associates. Under the employment forecast presented above, professional and business services are forecast to increase by 3.8 percentage points to comprise approximately 27 percent of total employment in 2020. FIRE is forecast to increase by 2.3 percentage points to nearly 17 percent of total employment. Retail employment is estimated to comprise the third largest source of employment at 13.8 percent. This represents virtually no change in the share of employment in 2007. While forecast to decline as a share of total Study Area employment by 1.5 percentage points, manufacturing employment is forecast to comprise the fourth largest source of total employment at 10.1 percent in 2020. Construction employment is forecast to experience the largest downward shift of 2.1 percentage points to just over nine percent. Leisure and hospitality employment is forecast to shift downward by 1.3 percentage points to 6.0 percent of total employment. Health and education services employment is forecast to increase by 0.6 percentage points to approximately 4.1 percent of total employment in 2020. Wholesale trade is forecast to decline by 1.2 percentage points to just over five percent of total employment. Information, transportation and warehousing, and other services are forecast to each approximate 2.3 to 2.7 percent of total Study Area employment in 2020. Table V-6 compares the projected shift in the proportion of total employment of each economic sector for the City of Scottsdale as a whole comprised by the Greater Airpark.

ANALYSIS AND FORECAST OF EMPLOYMENT AND BUILDING SPACE DEMAND AND STRATEGIC POLICY RECOMMENDATIONS FOR GREATER AIRPARK STUDY AREA
GRUEN GRUEN + ASSOCIATES PAGE 61
TABLE V-6
Projected Shift in Proportion of Total Scottsdale Employment Comprised by Greater Airpark: 2007-2020
Industry Sector
2007 %
2020 %
Shift 2007-2020 Percentage Points
Agriculture, Mining & Utilities 16 9 -7 Construction 47 41 -6 Manufacturing 38 36 -2 Wholesale Trade 46 41 -5 Retail Trade 32 35 3 Transportation & Warehousing 60 61 1 Information 36 35 -1 Finance, Insurance & Real Estate 28 33 5 Professional & Business Services 29 34 5 Education & Health Services 8 9 1 Leisure and Hospitality 15 14 -1 Other Services 22 23 1 Total Private Sector 28 29 1
Sources: City of Scottsdale; Maricopa County Association of Governments; Gruen Gruen + Associates.
Because we forecast a slightly higher employment growth rate in the Greater Airpark Study Area than employment growth for the City of Scottsdale as a whole between 2007 and 2020, the employment forecasts suggest that the share of employment in the Study Area will increase by approximately one percentage points to 29 percent of total Citywide employment.

ANALYSIS AND FORECAST OF EMPLOYMENT AND BUILDING SPACE DEMAND AND STRATEGIC POLICY RECOMMENDATIONS FOR GREATER AIRPARK STUDY AREA
GRUEN GRUEN + ASSOCIATES PAGE 62
CHAPTER VI
FORECAST DEMAND FOR BUILDING SPACE AND THE AMOUNT OF LAND NEEDED TO ACCOMMODATE FORECAST DEMAND FOR SPACE
INTRODUCTION The need for efficient workspace generates demand for building space. Firms within a specific economic sector do not use the same type of space for all their workers. For example, while most manufacturing firms primarily demand traditional industrial space, managers of manufacturing companies also use office space while products are typically stored in warehouse space. The amount of space demanded primarily depends upon: (a) the space usage characteristics of each industry; (b) the number of workers projected to be added to the employment base of that industry; and (c) the associated employment densities for each type of building space (number of square feet of space per employee). Thus, estimates of the amount and distribution of workers employed within each sector working in various types of building space can be combined with forecasts of employment and employment densities (worker to space ratios) to estimate the amount and type of building space that will be demanded in future years. SUMMARY Forecast demand for new space in the Greater Airpark between 2007 and 2020 is summarized as follows:
• An addition of 7,190 office-space using workers will demand new office space of approximately 1,362,000 square feet;
• An addition of 1,830 retail space using workers will demand new retail space of
approximately 1,443,000 square feet; and
• An addition of 3,660 industrial, warehouse, and flex space workers will demand new industrial space of approximately 1,500,000 square feet.
The office space capacity associated with the potential additional space from approved major projects in the Study Area alone is comparable to the amount of forecast office space demand through 2020. The retail components represent over one-half of retail space demand forecast through 2020. At current typical suburban floor-area ratio densities, demand for new space results in land demand of:
• 89 acres for office space;

ANALYSIS AND FORECAST OF EMPLOYMENT AND BUILDING SPACE DEMAND AND STRATEGIC POLICY RECOMMENDATIONS FOR GREATER AIRPARK STUDY AREA
GRUEN GRUEN + ASSOCIATES PAGE 63
• 133 acres for retail space; and • 102 acres for industrial, warehouse and flex space.
At higher density floor-area ratio densities, demand for new space results in land demand of:
• 63 acres for office space; • 95 acres for retail space; and • 72 acres for industrial space demand.
SPACE USAGE CHARACTERISTICS OF GREATER AIRPARK BUSINESSES Historical Perspective As summarized in GG+A’s prior analysis of the Airpark’s economic base (“Analysis and Forecast of the Economic Base of Scottsdale, June, 1999”), more than 50 percent of the Airpark’s workforce was estimated to be housed in warehouse-flex space in 1995 (which at the time was the predominant form of development in the area). An additional 16 percent of the workforce was housed in traditional industrial and warehouse facilities, while only seven percent of Airpark employees were estimated to work in retail space. In 1995, office buildings were estimated to include approximately 24 percent of the Airpark employment base. Industry sectors such as wholesale trade, healthcare, construction, and manufacturing housed their employees almost exclusively in warehouse-flex buildings. With the exception of only one industry sector, transportation, all industry sectors housed at least 30 percent of the workforce in warehouse-flex buildings. The most common office space-using business sectors such as FIRE and professional services utilized a relatively low proportion of true office space, with 63 percent and 43 percent of employment using office space respectively. Approximately 35 percent of the manufacturing base occupied industrial and warehouse space in 1995, while only ten percent of manufacturing employees utilized office space. Current Spatial Implications Just as the structure of the Greater Airpark employment base has shifted in favor of services and the FIRE sector and the composition of building space has shifted away from smaller multi-use warehouse-flex buildings, the relationship between the workforce and workspace has changed. Table VI-1 presents a current estimate of the distribution of employees by type of building space for the Greater Airpark. To convert the estimates of industry employment into building space categories, we relied upon data available from the City of Scottsdale, the Maricopa County Assessor, and MAG. MAG’s 2007 employer database was geo-referenced and overlaid with a map of existing parcels (with building use codes as determined by the County Assessor) within the Greater Airpark Study Area to produce the estimates of employment by type of building space summarized below.

ANALYSIS AND FORECAST OF EMPLOYMENT AND BUILDING SPACE DEMAND AND STRATEGIC POLICY RECOMMENDATIONS FOR GREATER AIRPARK STUDY AREA
GRUEN GRUEN + ASSOCIATES PAGE 64
TABLE VI-1
Distribution of Greater Airpark Employment by Type of Building Space
Percentage of Employment by Type of Building Space Industry Sector Office Retail1
Hotel / Resort Industrial Warehouse
Warehouse Flex Other2 Total
Agriculture, Mining & Utilities 9% 0% 0% 0% 0% 91% 0% 100%
Construction 47% 2% 0% 1% 12% 38% 0% 100%
Manufacturing 4% 1% 0% 28% 11% 55% 1% 100%
Wholesale Trade 32% 3% 0% 4% 16% 45% 0% 100%
Retail Trade 9% 73% 0% 0% 3% 14% 1% 100%
Transportation & Warehousing 34% 8% 0% 7% 2% 20% 29% 100%
Information 18% 2% 0% 1% 23% 56% 0% 100%
Finance, Insurance & Real Estate 88% 5% 0% 0% 2% 5% 0% 100%
Professional & Business Services 64% 3% 0% 0% 6% 26% 1% 100%
Education & Health Services 69% 10% 0% 0% 5% 16% 0% 100%
Leisure & Hospitality 5% 20% 46% 0% 0% 7% 22% 100%
Other Services 25% 33% 0% 0% 6% 28% 8% 100%
Total 42% 15% 3% 4% 7% 26% 3% 100%1 Includes automotive-related facilities (dealerships, gas stations) and restaurants. 2 Other includes buildings such as recreational facilities (golf courses, skating rinks, bowling alleys) and religious facilities, in addition to buildings (primarily hangers) located at the Scottsdale Airport.
Sources: City of Scottsdale; Maricopa County Association of Governments; Maricopa County Assessor; Gruen Gruen + Associates.
Office building uses within the Study Area are currently estimated to house the largest percentage of the workforce at approximately 42 percent of the total employment. Industry sectors in which more than 50 percent of employment is located in office buildings include FIRE (88%), education and health services (69%) and professional and business services (64%). A fairly substantial proportion of construction employment (47%), transportation and warehousing employment (34%) and wholesale trade employment (32%) are also located within office buildings. Approximately one-quarter of employment in the personal service sector is estimated to currently utilize office space. Retail building uses are estimated to include approximately 15 percent of total employment within the Greater Airpark. As would be expected, nearly three-quarters of retail trade workers are currently estimated to utilize retail space. One-third of other service employment (particularly personal service-related) is estimated to utilize retail space while approximately 20 percent of the leisure and hospitality employees work out of retail space.

ANALYSIS AND FORECAST OF EMPLOYMENT AND BUILDING SPACE DEMAND AND STRATEGIC POLICY RECOMMENDATIONS FOR GREATER AIRPARK STUDY AREA
GRUEN GRUEN + ASSOCIATES PAGE 65
The overall distribution of employment by space has shifted such that the percentage of the total employment base working in warehouse-flex space has declined to approximately 26 percent (from an estimated 53 percent in 1995). Industry sectors in which a considerable percentage of employees continue to work in warehouse-flex space include information (56%), manufacturing (55%), wholesale trade (45%), and construction (38%). A smaller but still significant share of service employees also work in warehouse-flex space. Approximately one-quarter of professional service employment, for example, is located in warehouse-flex space. BUILDING SPACE DEMAND FORECAST Table VI-2 presents the resulting estimates of the number of office, retail and industrial workers forecast to be added and the associated space demand between 2007 and 2020.
TABLE VI-2
Projected Net Additional Workforce and Space Demand Within the Greater Airpark: 2007-20201 Office Retail Industrial Warehouse Flex Total
Total Added Workers 7,194 1,827 219 699 2,739 12,6772
Employment Density (# Square Feet per Worker) 275 750 550 450 450 417
(average)Total Gross Space Demand (# Square Feet)3 2,082,000 1,443,000 127,000 331,000 1,297,000 5,280,000
Less Vacant Space (# Square Feet) 720,000 0 20,000 65,000 165,000 970,000
Net Space Demand (# Square Feet) 1,362,000 1,443,000 107,000 266,000 1,132,000 4,310,000
Net Annual Space Demand (# Square Feet) 114,000 120,000 9,000 22,000 94,000 359,0001 Figures are rounded. 2 Total does not include 302 hotel and other workers that are forecast to be added. 3 Space demanded has been increased by five percent to reflect frictional vacancy in the market.
Source: Gruen Gruen + Associates For the period 2007 to 2020 approximately 7,190 office-space using workers are estimated to be added to the Study Area employment base. This forecast employment growth is estimated to produce total gross demand of approximately 2.1 million square feet of additional office space. However, given the currently high office vacancy rate within the Greater Airpark of approximately 23 percent, some of the future space demand will be met by existing buildings. Approximately 1.7 million square feet of office space is reportedly vacant within the Study Area. We assume, for purposes of estimating the demand for new office space, that approximately 40 percent or 720,000 square feet of the existing vacant space must be absorbed before demand for additional new office product will be stimulated.

ANALYSIS AND FORECAST OF EMPLOYMENT AND BUILDING SPACE DEMAND AND STRATEGIC POLICY RECOMMENDATIONS FOR GREATER AIRPARK STUDY AREA
GRUEN GRUEN + ASSOCIATES PAGE 66
This would equate to a decline in the office vacancy rate from a current 23 percent to approximately 13 percent. Net office space demand (gross space demand less absorption of existing space required to bring vacancy rate down to 13 percent) from 2007 through 2020 is forecast to approximate 1,362,000 square feet, or on average approximately 114,000 square feet annually. Approximately 1,830 retail-space using workers are projected to be added to the Study Area employment base between 2007 and 2020. Because of the currently still low retail vacancy rate of six percent with only 200,000 square feet of space available, we perhaps optimistically assume all future demand for retail space will need to be met by new space. At an average employment density of 750 square feet per worker, the projected workforce growth results in total retail space demand of 1,443,000 square feet. Average annual retail space demand is forecast to approximate 120,000 square feet. A total of approximately 3,660 industrial, warehouse, and flex space workers are projected to be added between 2007 and 2020. This forecast employment growth produces gross space demand of 1.3 million square feet of flex space, 127,000 square feet of industrial space and 331,000 square feet of warehouse space. Approximately 886,000 square feet of industrial-type space is reportedly vacant within the Greater Airpark for a vacancy rate of approximately 14 percent. While the current industrial vacancy rate and supply of available space is approximately four to six percent greater than has been historically the case, some of the existing industrial space is not likely to capture future space demand given its age and obsolescence. Assuming approximately 250,000 square feet of currently vacant industrial space is absorbed before new space is demanded (which equates to a decline in the vacancy rate from a current 14 percent to 10 percent), total net demand for all types of industrial space is forecast to approximate 1.5 million square feet from 2007 to 2020. POTENTIAL FUTURE SUPPLY OF SPACE To put the building space demand forecast into context, Table VI-3 summarizes the supply of potential additional space from approved major projects.

ANALYSIS AND FORECAST OF EMPLOYMENT AND BUILDING SPACE DEMAND AND STRATEGIC POLICY RECOMMENDATIONS FOR GREATER AIRPARK STUDY AREA
GRUEN GRUEN + ASSOCIATES PAGE 67
TABLE VI-3
Future Supply of Space in Greater Airpark Study Area
Name Type Size Comments/Timing Scottsdale Quarter
Mixed use 1.2 million sq. ft. of retail, office, and residential space, 200 hotel rooms, 450 rental units
Under construction, phase 1 opening spring 2009
Silverstone Mixed use 160 acres 300,000 sq. ft. office/retail, 270 senior units
Planned but speculative at this point, no tenant commitments
One Scottsdale Mixed use Up to 1.8 million sq. ft. retail and office space 400 hotel rooms 1,100 residential units (entitled)
Expected opening 2011-2012
Epicenter Office 125 acres, 2+ million sq. ft. office space and support services
2010-2012 project start, expect 8-year build out
Terra Verde Office 18 acres, 300,000 sq. ft. Under construction Phase 1 building of 184,000 sq. ft.
Sources: GG+A Interviews; Project websites; City of Scottsdale. Scottsdale Quarter phase 1 is currently under construction with 260,000 square feet of retail and office space projected to open by spring 2009. Tenants will include restaurants and specialty and fashion retailers. Terra Verde at Bell Road and Loop 101 is currently under construction. The project is an 18-acre site surrounded by the TPC Golf Course on three sides. Three 3-story office buildings totaling 300,000 square feet will be added. Pulte Homes has recently signed a 96,000-square-foot lease for phase 1 which will deliver approximately 184,000 square feet of building space in the second quarter of 2009. The proposed Silverstone project is planned to include approximately 300,000 square feet of office and retail space and 270 senior assisted living units on approximately 160 acres. Approximately 47 acres of the site is also available for single family housing. The retail component is planned to consist of neighborhood-serving uses not totaling more than 85,000 square feet. No tenants have been identified at this point and the project timing is speculative. One Scottsdale is a planned mixed-use project just north and east of the Loop 101 and Scottsdale Road. The project is anticipated to include about 500,000 square feet of retail space, up to 1.3 million square feet of office space, 400 hotel rooms and 1,100 multi-family residential units. According to a project representative, expected opening of the project is
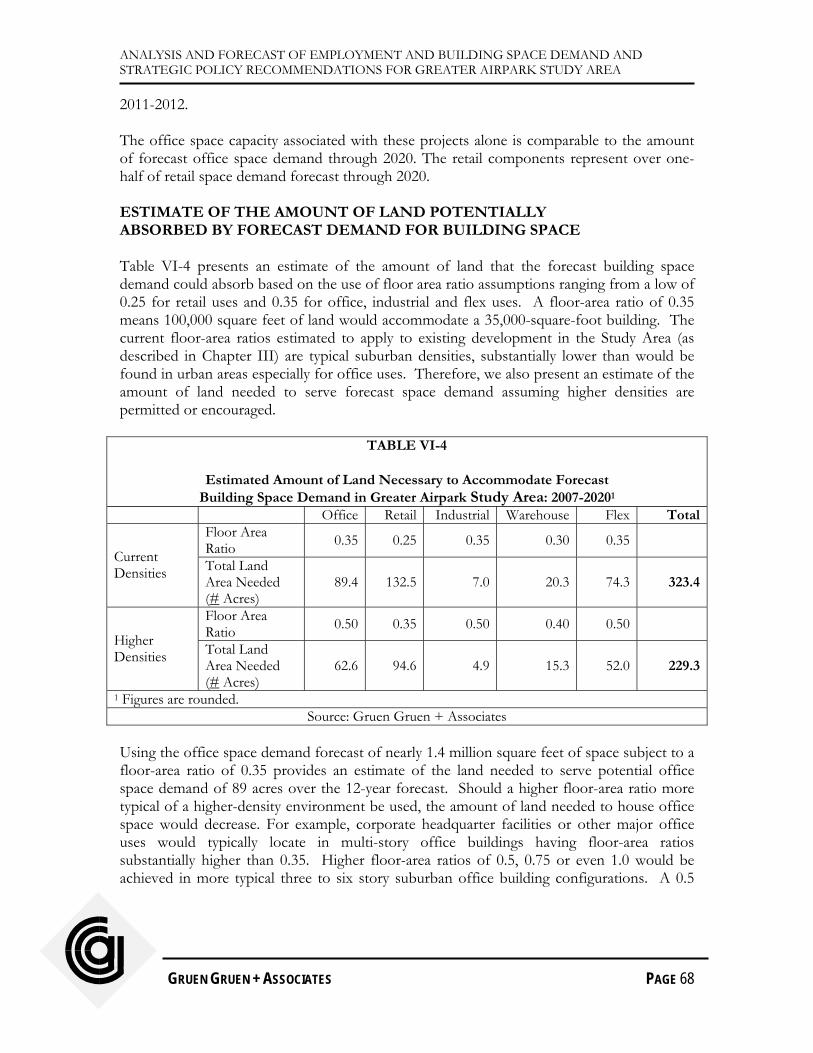
ANALYSIS AND FORECAST OF EMPLOYMENT AND BUILDING SPACE DEMAND AND STRATEGIC POLICY RECOMMENDATIONS FOR GREATER AIRPARK STUDY AREA
GRUEN GRUEN + ASSOCIATES PAGE 68
2011-2012. The office space capacity associated with these projects alone is comparable to the amount of forecast office space demand through 2020. The retail components represent over one-half of retail space demand forecast through 2020. ESTIMATE OF THE AMOUNT OF LAND POTENTIALLY ABSORBED BY FORECAST DEMAND FOR BUILDING SPACE Table VI-4 presents an estimate of the amount of land that the forecast building space demand could absorb based on the use of floor area ratio assumptions ranging from a low of 0.25 for retail uses and 0.35 for office, industrial and flex uses. A floor-area ratio of 0.35 means 100,000 square feet of land would accommodate a 35,000-square-foot building. The current floor-area ratios estimated to apply to existing development in the Study Area (as described in Chapter III) are typical suburban densities, substantially lower than would be found in urban areas especially for office uses. Therefore, we also present an estimate of the amount of land needed to serve forecast space demand assuming higher densities are permitted or encouraged.
TABLE VI-4
Estimated Amount of Land Necessary to Accommodate Forecast Building Space Demand in Greater Airpark Study Area: 2007-20201
Office Retail Industrial Warehouse Flex TotalFloor Area Ratio 0.35 0.25 0.35 0.30 0.35
Current Densities Total Land
Area Needed (# Acres)
89.4 132.5 7.0 20.3 74.3 323.4
Floor Area Ratio 0.50 0.35 0.50 0.40 0.50
Higher Densities Total Land
Area Needed (# Acres)
62.6 94.6 4.9 15.3 52.0 229.3
1 Figures are rounded. Source: Gruen Gruen + Associates
Using the office space demand forecast of nearly 1.4 million square feet of space subject to a floor-area ratio of 0.35 provides an estimate of the land needed to serve potential office space demand of 89 acres over the 12-year forecast. Should a higher floor-area ratio more typical of a higher-density environment be used, the amount of land needed to house office space would decrease. For example, corporate headquarter facilities or other major office uses would typically locate in multi-story office buildings having floor-area ratios substantially higher than 0.35. Higher floor-area ratios of 0.5, 0.75 or even 1.0 would be achieved in more typical three to six story suburban office building configurations. A 0.5

ANALYSIS AND FORECAST OF EMPLOYMENT AND BUILDING SPACE DEMAND AND STRATEGIC POLICY RECOMMENDATIONS FOR GREATER AIRPARK STUDY AREA
GRUEN GRUEN + ASSOCIATES PAGE 69
average floor-area ratio would equate to 63 acres of land to accommodate forecast office space demand. At a floor-area ratio of 0.25, the forecast net retail space demand will require approximately 133 acres over the 12-year period. Should a higher floor area ratio of 0.35 be permitted or encouraged, forecast retail space demand would require approximately 95 additional acres of land. The demand forecast for industrial, warehouse and flex-type space of approximately 1.5 million square feet, subject to floor-area ratios of 0.30 to 0.35, indicates that approximately 102 acres of land will be required to accommodate future industrial space demand. At higher densities of 0.4 to 0.5, approximately 72 acres of industrial land would be required to accommodate forecast demand growth. Table VI-5 presents the estimated relationship between the amount of vacant land as designated under the General Plan and the forecast of the amount of land demand by type of land use.
TABLE VI-5
Estimated Relationship Between Land Supply and Land Demand in Greater Airpark Study Area: 2007-2020
Land Use Type
Amount of Vacant Land Under General Plan
# Acres1Forecast Land Demand
# Acres
Surplus(Shortfall) in Land # Acres
Office 4.7 89.4 (84.7)Retail 51.2 132.5 (81.3)Industrial and Warehouse 27.3 Warehouse/Retail/Office Flex
36774.3
265.4
Total 422.92 323.4 99.51 Based on General Plan land use categories of office, retail (commercial) and industrial (employment). 2 Does not include 880 acres of vacant state land in Crossroads East (adjoining Loop 101) or City and State-owned land adjoining Bell Road and 94th Street.
Sources: City of Scottsdale; Gruen Gruen + Associates. Overall, an adequate amount of land exists to serve forecast demands beyond 2020. Land currently designated under the General Plan for industrial uses can be expected to be converted in many cases to office uses. In addition, retail uses can be expected to be developed on land not designated exclusively for retail use. As indicated previously, a shortage of vacant land exists in the traditional core Airpark area, while ample land capacity exists north of the Central Arizona Project Canal.

Gruen Gruen + Associates (GG+A) is a firm of economists, sociologists, statisticians and market, financial and fiscal analysts. Developers, public agencies, attorneys and others involved in real estate asset management utilize GG+A research and consulting to make and implement investment, marketing, product, pricing and legal support decisions. The firm's staff has extensive experience and special training in the use of demographic analysis, survey research, econometrics, psychometrics and financial analysis to describe and forecast markets for a wide variety of real estate projects and economic activities. Since its founding in 1970, GG+A has pioneered the integration of behavioral research and econometric analysis to provide a sound foundation for successful land use policy and economic development actions. GG+A has also pioneered the use of economic, social and fiscal impact analysis. GG+A impact studies accurately and comprehensively portray the effects of public and private real estate developments, land use plans, regulations, annexations and assessments on the affected treasuries, taxpayers, consumers, other residents and property owners. San Francisco: Deerfield: (415) 433-7598 (847) 317-0634 E-mail: [email protected] E-mail:[email protected]
www.ggassoc.com
APPLYING KNOWLEDGE, CREATING RESULTS, ADDING VALUE