analysis and modelling of trypanosomatidae family in vitro
TRANSCRIPT

Treball final de grau Enginyeria de Sistemes Biològics
Analysis and modelling of Trypanosomatidae family in vitro and ex vivo cultures
Chagas disease and leishmaniasis
Autora: Núria Pedrós Barnils
Directors: Daniel López Codina M. Cristina Riera Lizandra
10/ juny / 2015

The show must go on.

Analysis and modelling of Trypanosomatidae family in vitro and ex vivo cultures. Chagas disease and Leishmaniasis
1
Abstract
Chagas disease and leishmaniasis cause thousands of deaths every year in the South countries. Those diseases are caused by the protozoa Trypanosoma cruzi and Leishmania spp., respectively. Both protozoa belong to the family Trypanosomatidae and have a digenetic life cycle. That is to say that they live between a vertebrate host and an invertebrate vector through which they are transmitted (sand flies (Phlebotominae) in Leishmania spp. and bloodsucking (Triatomine) in Trypanosoma cruzi).
The main objective of this bachelor thesis is allowing the better understanding of Trypanosoma cruzi behaviour in in vitro and ex vivo cultures. As we could demonstrate that the behaviour of in vitro cultures of Leishmania spp. is pretty similar to Trypanosoma cruzi the understanding done with second will be useful for the first. In order to understand them, we have developed two mathematic models: a continuous model of the in vitro growth and an Individual-based Model of the ex vivo growth.
The experimental work of in vivo cultures of the two protozoa has been done in the parasitology lab of the Department of Health Microbiology and Parasitology of the Universitat de Barcelona. An experimental method has been designed in order to know the growing curve of the epimastigotes during 20-30 days (no infective, reproductive, extracellular form, of Trypanosoma cruzi and Leishmania spp.) obtaining results that show a bi-lineal growth in the growing phase of the curve. The ex vivo experimental work with Trypanosoma cruzi has been done in the School of Pharmacy of the Ouro Preto Federal University, Brazil. Information from an experimental method was taken to measure the number of infected eukaryotic cells out of the number of counted cells of the culture and the number of amastigotes (no infective, reproductive, intracellular form) in the infected cells for 72 hours. At last, in this case, the number of infected cells at 72 hours is maximum and the amastigotes number is maximum at 48 hours.
From the in vitro results we have developed a continuous model where we can mathematically demonstrate the bi-lineal growth of the cultures and that there is a growing limitation due to the diffusion, or the lack of diffusion, of oxygen in the medium. Likewise, we think about a molecule secreted to the medium that inhibits the growing of the protozoa population in order to control it and facilitate the co-existence between the guest and the parasite. From the ex vivo results we have developed an Individual-based Model that allows us to hypothesize two facts. Firstly, when the tripomastigotes (infective, no reproductive, extracellular form) of Trypanosoma cruzi infect the eukaryotic cells, there may be a change in the membrane composition that does not allow the other trypomastigotes to penetrate. Secondly, the complete growing cycle of the amastigotes may be larger than 72h, if not we ought to observe oscillations in their 72 hours behaviour.
In order to keep progressing in the understanding of these diseases, it is necessary to keep working with both models, as well as start working with in vivo models, since they are further similar at the protozoa’s behaviour in humans.

Analysis and modelling of Trypanosomatidae family in vitro and ex vivo cultures. Chagas disease and Leishmaniasis
2
Resum
La malaltia del Chagas i la leishmaniasis causen milers de morts anualment en els països del Sud. Aquestes malalties estan causades pels protozous Trypanosoma cruzi i Leishmania spp., respectivament. Ambdós protozous pertanyen a la família Trypanosomatidae i el seu cicle de vida és digenètic, és a dir, viuen entre un hoste vertebrat i un vector invertebrat mitjançant el qual es transmeten (flebòtoms (Phlebotominae) en el cas de Leishmania spp. i hemípters predadors (Triatomine) en el cas de Trypanosoma cruzi).
L’objectiu principal d’aquest treball de final de grau és avançar en la comprensió del comportament de cultius in vitro i ex vivo del protozou Trypanosoma cruzi. Com que hem pogut demostrar que el seu comportament en cultius in vitro és molt semblant al de Leishmania spp., aquesta comprensió realitzada amb T. cruzi ens serà d’ús per a Leishmania spp. Per fer-ho, s’han desenvolupat dos models matemàtics: un model continu dels creixements in vitro i un model basat en l’individu dels creixements ex vivo.
Els experiments in vitro amb els dos protozous s’han realitzat en el Departament de Microbiologia i Parasitologia Sanitàries de la Universitat de Barcelona. S’ha dissenyat un mètode experimental que mesura el perfil de creixement dels epimastigots durant 20-30 dies (forma no infectiva, reproductiva i extracel·lular tant de Trypanosoma cruzi com de Leishmania spp.) obtenint resultats que ens indiquen un clar comportament bilineal en la fase de creixement. Els experiments de creixement ex vivo amb Trypanosoma cruzi s’han realitzat a l’Escola de Farmàcia de la Universitat Federal de Ouro Preto (Brasil). S'ha utilitzat la informació d'un mètode experimental que mesura el nombre de cèl·lules eucariotes infectades en funció del nombre de cèl·lules contades del cultiu i el nombre d’amastigots (forma no infectiva, reproductiva, intracel·lular) presents en cada cèl·lula infectada durant 72 hores. En aquests cas s’ha observat que el nombre de cèl·lules infectades és màxim a les 72 hores i el nombre d’amastigots és màxim a les 48 hores.
A partir dels resultats in vitro hem construït un model continu on hem pogut demostrar matemàticament el creixement bilineal dels cultius i on la limitació de creixement es deu a la difusió, o manca d’ella, d’oxigen en el medi. També, podem suposar que hi ha algun metabòlit secretat per els protozous que inhibeix el seu propi creixement controlant el creixement poblacional i facilitant la coexistència amb el hoste. A partir dels resultats ex vivo hem construït un model basat en l’individu que ens ha permès hipotetitzar dos fets. Primerament, quan els tripomastigots (forma infectiva, no reproductiva, extracel·lular) de Trypanosoma cruzi infecten a les cèl·lules eucariotes, aquestes canvien la seva composició de membrana perquè no puguin entrar més protozous. La segona hipòtesi és que el cicle de creixement complet dels amastigots dura més de 72h perquè sinó observaríem oscil·lacions en les gràfiques que representen el seu nombre absolut per cèl·lula infectada.
Per seguir avançant en la comprensió d’aquestes malalties, cal seguir treballant amb ambdós models així com començar a treballar amb models in vivo i així aproximar-nos més al comportament en humans.

Analysis and modelling of Trypanosomatidae family in vitro and ex vivo cultures. Chagas disease and Leishmaniasis
3
Resumen
La enfermedad de Chagas i la leishmaniasis provocan miles de muertos anualmente en los países del Sud. Estas enfermedades son causadas por los protozoos Trypanosoma cruzi y Leishmania spp., respectivamente. Ambos protozoos pertenecen a la familia Trypanosomatidae y su ciclo de vida es digenético, es decir, viven entre un hospedador vertebrado y un vector invertebrado con el que se transmiten (flebotómidos (Phlebotominae) para Leishmania spp. y hemípteros predadores (Triatomine) para Trypanosoma cruzi).
El objetivo principal de este trabajo de final de grado es avanzar en la comprensión del comportamiento de cultivos in vitro y ex vivo del protozoo Trypanosoma cruzi. Como hemos podido demostrar que su comportamiento en cultivos in vitro es muy similar al de Leishmania spp., esta comprensión realizada con Trypanosoma cruzi nos será de uso para Leishmania spp. Para hacerlo, hemos desarrollado dos modelos matemáticos: un modelo continuo de los crecimientos in vitro y un modelo basado en el individuo de los crecimientos ex vivo.
Los experimentos in vitro de los dos protozoos se han realizado en el Departamento de Microbiología y Parasitología Sanitarias de la Universitat de Barcelona. Se ha diseñado un método experimental que mide el perfil de crecimiento de los epimastigotes durante 20-30 días (forma no infectiva, reproductiva y extracelular de T. cruzi y Leishmania spp.) obteniendo resultados que nos indican un claro comportamiento bilineal en la fase de crecimiento. Los experimentos de crecimiento ex vivo con Trypanosoma cruzi se han realizado en la Escuela de Farmacia de la Universidad Federal de Ouro Preto (Brasil). Se ha utilizado la información de un método experimental que mide el número de células eucariotas infectadas en función del número de células contadas del cultivo y el número de amastigotes (forma no infectiva, reproductiva, intracelular) presentes en cada célula infectada durante 72 horas. En este caso se ha observado que el número de células infectadas es máximo a las 72 horas y el número de amastigotes es máximo a las 48 horas.
A partir de los resultados in vitro hemos construido un modelo continuo donde hemos podido demostrar matemáticamente el crecimiento bilineal de los cultivos y donde la limitación de crecimiento se debe a la difusión, o falta de ella, de oxígeno en el medio. También, podemos suponer que hay algún metabolito secretado por los protozoos que inhibe su propio crecimiento controlando así el crecimiento poblacional y facilitando la coexistencia con el hospedador. A partir de los resultados ex vivo hemos construido un modelo basado en el individuo que nos ha permitido hipotetitzar dos hechos. Primeramente, cuando los tripomastigotes (forma infectiva, no reproductiva, extracelular) de Trypanosoma cruzi infectan a las células eucariotas, estas cambian su composición de membrada para que no puedan entrar más protozoos. La segunda hipótesis es que el ciclo de crecimiento completo de los amastigotes dura más de 72 horas porque si no observaríamos oscilaciones en las gráficas que representan su número absoluto por célula infectada.
Para seguir avanzando en la comprensión de estas enfermedades, es necesario seguir trabajando con ambos modelos, así como empezar a trabajar con modelos in vitro y así aproximarnos más al comportamiento en humanos.

Analysis and modelling of Trypanosomatidae family in vitro and ex vivo cultures. Chagas disease and Leishmaniasis
4
Index
Index of Figures 6
Index of Tables 8
Acknowledgements
9
1. Introduction
10
1.1. Chagas disease and Leishmaniasis
10
1.1.1. Chagas disease
10
1.1.2. Leishmaniasis
13
1.2. Biology
16
1.2.1. Trypanosomatidae family
16
1.2.2. Genus Trypanosoma
19
1.2.3. Trypanosoma cruzi
22
1.2.4. Genus Leishmania
25
1.2.5. Types of leishmaniasis and species of Leishmania
27
1.3. Research in Trypanosomatidae family
29
1.4. Modelling
30
1.4.1. The interest of modelling
30
1.4.2. Continuous models and Individual-based Models
32
1.4.3. Mathematical models of the Trypanosomatidae family
34
1.5. Framework
35
1.6. Objectives
36
1.7. Outline
37

Analysis and modelling of Trypanosomatidae family in vitro and ex vivo cultures. Chagas disease and Leishmaniasis
5
2. Experimental work
38
2.1. In vitro
38
2.1.1. Materials and methods
38
2.1.2. Results
41
2.1.3. Analysis of the results
46
2.1.4. Images analysis of Trypanosoma cruzi
48
2.2 Ex vivo
53
2.2.1 Materials and methods
53
2.2.2 Results
55
2.2.3 Analysis of the results
59
3. Models development
62
3.1. Continuous model of in vitro culture
62
3.2. Individual-based model of ex vivo culture
67
4. Conclusions
72
5. Perspectives
73
Bibliography
74
Appendix A. In vitro results
A1
Appendix B. Pre-conditioning and image analysis of Trypanosoma cruzi
B1
Appendix C. Ex vivo results C1
Appendix D. NetLogo code program D1

Analysis and modelling of Trypanosomatidae family in vitro and ex vivo cultures. Chagas disease and Leishmaniasis
6
Index of Figures Figure 1. Chagas disease distribution 10 Figure 2. Triatoma infestans 11 Figure 3. Geographical distribution of leishmaniasis 13 Figure 4. Lutuonyia longipalpis 14 Figure 5. The two different life cycles of Trypanosomatidae family 16 Figure 6. The body types of the genres of Trypanosomatidae family 17 Figure 7. Glossina fusca fusca 20 Figure 8. Trypanosoma cruzi 22 Figure 9. The life cycle of Trypanosoma cruzi 23 Figure 10. Leishmania braziliensis 25 Figure 11. The life cycle of Leishmania 26 Figure 12. Camera with the coverslip 39 Figure 13. Falcon 39 Figure 14. Rectangular flask 40 Figure 15. Fuchs-Rosenthal camera 40 Figure 16. Pipette Pasteur 40 Figure 17. Eppendorf 40 Figure 18. Micropipette 38 Figure 19. Laminar flux cabinet 40 Figure 20. Microscope 40 Figure 21. Slide 40 Figure 22. BMS Microscope 40 Figure 23. Growing curve of the strain 858 41 Figure 24. Growing curve of the strain 582 41 Figure 25. Growing curve of the strain 590 41 Figure 26. Growing curve of the strain 590 (2) 42 Figure 27. Growing curve of the strain Be-62 42 Figure 28. Growing curve of the strain Be-78 42 Figure 29. Growing curve of the strain 375-12-3 43 Figure 30. Growing curve of the strain 375-12-6 43 Figure 31. Growing curve of the strain 371-12-6 43 Figure 32. Growing curve of the strain 371-12-12 43 Figure 33. Growing curve of the strain 372-12 43 Figure 34. Growing curve of the strain 385-12-6 43 Figure 35. Growing curve of the strain 385-12-12 44 Figure 36. Growing curve of the strain 391-12 44 Figure 37. Growing curve of the Bolivia strain 44 Figure 38. Growing curve of the RAL strain 44 Figure 39. Growing curve of the GM strain 44 Figure 40. Growing curve of the MC strain 44 Figure 41. Growing curve of the Y strain 45 Figure 42. Growing curve of the Tulahén strain 45 Figure 43. Growing curve of Leishmania braziliensis 45 Figure 44. Growing curve of Leishmania major 45 Figure 45. Growing curve of Leishmania infantum 45 Figure 46. Bi-lineal growing phase of the strain BCN 582 of Trypanosoma cruzi 46 Figure 47. Bi-lineal growing phase of the strain 371-12-6 of Trypanosoma cruzi 46

Analysis and modelling of Trypanosomatidae family in vitro and ex vivo cultures. Chagas disease and Leishmaniasis
7
Figure 48. Bi-lineal growing phase of the Bolivia strain of Trypanosoma cruzi 46 Figure 49. Bi-lineal growing phase of Leishmania major 46 Figure 50. Model of the growing curve of T. cruzi epimastigotes and some L. spp. 47 Figure 51. Image of Trypanosoma cruzi culture with the contrast rose up 49 Figure 52. Image of Trypanosoma cruzi culture with the saturation reduced 49 Figure 53. Image of Trypanosoma cruzi culture with the saturation up to 100 50 Figure 54. Image of Trypanosoma cruzi culture transforming to binary 50 Figure 55. Image of Trypanosoma cruzi culture original and binary 50 Figure 56. Scales of the images 51 Figure 57. Different measurements to analyse the images 52 Figure 58. I Image of Trypanosoma cruzi culture with the measurements 52 Figure 59. Macro of the process to analyse the images 52 Figure 60. Falcon 54 Figure 61. Heater 54 Figure 62. Centrifuge 54 Figure 63. Freezer 54 Figure 64. Glass coverslip 54 Figure 65. Optical microscope 54 Figure 66. Infected cells/counted cells of ex vivo culture of the strain Be-62 55 Figure 67. Infected cells/counted cells of ex vivo culture of the strain Be-78 55 Figure 68. Infected cells/counted cells of ex vivo culture of the strain 375-12-3 55 Figure 69. Infected cells/counted cells of ex vivo culture of the strain 371-12-3 55 Figure 70. Infected cells/counted cells of ex vivo culture of the strain 371-12-6 56 Figure 71. Infected cells/counted cells of ex vivo culture of the strain 372-12-6 56 Figure 72. Infected cells/counted cells of ex vivo culture of the strain 375-12-6 56 Figure 73. Infected cells/counted cells of ex vivo culture of the strain 385-12-6 56 Figure 74. Infected cells/counted cells of ex vivo culture of the strain 371-12-12 56 Figure 75. Infected cells/counted cells of ex vivo culture of the strain 385-12-12 56 Figure 76. Num. of amastigotes/infected cells of ex vivo culture of the strain Be-62 57 Figure 77. Num. of amastigotes/infected cells of ex vivo culture of the strain Be-78 57 Figure 78. Num. of amastigotes/infected cells of ex vivo culture of the strain 375-12-3 57 Figure 79. Num. of amastigotes/infected cells of ex vivo culture of the strain 371-12-3 57 Figure 80. Num. of amastigotes/infected cells of ex vivo culture of the strain 371-12-6 57 Figure 81. Num. of amastigotes/infected cells of ex vivo culture of the strain 372-12-6 57 Figure 82. Num. of amastigotes/infected cells of ex vivo culture of the strain 375-12-6 58 Figure 83. Num. of amastigotes/infected cells of ex vivo culture of the strain 385-12-6 58 Figure 84. Num. of amastigotes/infected cells of ex vivo culture of the strain 371-12-12 58 Figure 85. Num. of amastigotes/infected cells of ex vivo culture of the strain 385-12-12 58 Figure 86. All the infected cells/counted cells of the ex vivo cultures and the average 59 Figure 87. All the num. of amastigotes/infected cells of the ex vivo cultures and average 60 Figure 88. Integral of the whole growing phase of the Ouro Preto strains 65 Figure 89. Model and experimental results of the growing curve of the strain 375-1-32 66 Figure 90. Flow charts of the model representing the ex vivo culture of T. cruzi 67 Figure 91. Interface of the NetLogo program when is initialized 69 Figure 92. Interface of the NetLogo program when is finished (after 72 time steps) 70

Analysis and modelling of Trypanosomatidae family in vitro and ex vivo cultures. Chagas disease and Leishmaniasis
8
Index of Tables
Table 1. The most important species of Leishmania 28 Table 2. Instructions to pre-condition Trypanosoma cruzi images 48 Table 3. Instructions to analyse Trypanosoma cruzi images 51 Table 4. Integral of the whole growing phase of Trypanosoma cruzi strains 64 Table 5. Parameters and variables of Trypanosoma cruzi growing curve model 66 Table 6. Subscripts and abbreviations of the flow chart 68

Analysis and modelling of Trypanosomatidae family in vitro and ex vivo cultures. Chagas disease and Leishmaniasis
9
Acknowledgements
Primerament vull agrair la oportunitat que el meu tutor, Daniel López, m’ha brindat al poder treballar en aquest projecte. Treballar amb ell, amb la Clara Prats i en Quim Valls ha estat un aprenentatge del què, el on i el perquè investigar. Gràcies a la Clara per la precisió i la gran capacitat de treball en equip. Gràcies al Quim per desenvolupar el model Netlogo amb tan delta de diraquisme. Gràcies al Dani pels coneixements, pel temps, per la confiança i pel paternalisme.
Gràcies a la Cristina Riera i a la Roser Fisa per haver-nos ajudat tant a comprendre el comportament dels protozous i haver-nos permès fer i acompanyat durant el procés dels cultius in vitro. Gràcies a la Diana Berenguer per la paciència. Gràcies Cristina pel riure.
Gràcies al Bernat Puig per desenvolupar la tècnica pel tractament d’imatges dels cultius in vitro. Gràcies per la perfecció i l’ambició.
Gràcies a Claudia Martins per compartir amb nosaltres els seus resultats tan en cultius in vitro com en cultius ex vivo.
S’obre el teló i les diferents notes que es composen i descomposen, cada ú de vosaltres, sonen..
Gràcies per ser un gran pare, sobretot en els moments crítics. Gràcies per la teva calma. Gràcies per la teva híper racionalitat.
Gràcies pel gran amor matern. Gràcies haver sigut tan valenta durant tants anys. Gràcies pel ja ets prou gran, busca’t la vida.
Gràcies per ser el meu pilar des que vam compartir les primeres notes musicals. Gràcies per l’evolució. Gràcies pels estius. Gràcies per ser família, present i futura.
Gràcies per l’amor al bàsquet. Gràcies per l’amor a l’ensenyament. Gràcies per l’amor a la senzillesa. Gràcies per compartir la teva gran família. Gràcies per la gran capacitat d’escoltar i estimar.
Gràcies per la sinceritat. Gràcies per la teva música. Gràcies pel cantar. Gràcies pel teu ballar la vida. Gràcies per la teva elegant feminitat. Gràcies per la teva gran amistat.
Gràcies per la rebel·lia adolescent i adulta. Gràcies per la muntanya. Gràcies per la filosofia. Gràcies per la claredat. Gràcies per buidar i omplir.
Gràcies per la facilitat en veure les mil perspectives. Gràcies per voler viure-les totes i cada una d’elles. Gràcies per un any de pluja. Gràcies pel sentir.
Gràcies pel poc a poc. Gràcies per la diferència. Gràcies per la maduresa i la innocència, juntes. Gràcies pel desig. Gràcies per l’amor incondicional.

Analysis and modelling of Trypanosomatidae family in vitro and ex vivo cultures. 1. Introduction Chagas disease and Leishmaniasis
10
1. Introduction 1.1 Chagas disease and Leishmaniasis 1.1.1 Chagas disease
Chagas disease, also known as American trypanosomiasis, is a potentially life-threatening illness caused by the protozoan parasite Trypanosoma cruzi and discovered in 1909 by the Brazilian physician Carlos Chagas (1879–1934). It is found mainly in endemic areas of 21 Latin American countries, where it is mostly vector-borne transmitted to humans by contact with faeces of triatomine bugs, known as 'kissing bugs', among other names, depending on the geographical area (WHO, 2015).
Chagas disease has been a scourge to humanity since antiquity and it is still a relevant social and economic problem in many Latin American countries. About 8 million people are estimated to be infected worldwide, mostly in Latin America (Aguilar-Garcia, 2010).
It is estimated that over 10.000 people die every year from clinical manifestations of Chagas disease, and more than 25 million people risk acquiring the disease.
Although Chagas disease occurs mainly in Latin America, in the past decades it has been increasingly detected in the United States of America, Canada, and many European and some Western Pacific countries. This is mainly due to population mobility between Latin America and the rest of the world (WHO, 2015). Figure 1 shows the distribution of Chagas disease in absolute numbers by 2009 (no more recentl map information has been found).
Figure 1. Chagas disease distribution, 2009. [From The Health Coach]
Chagas’ original report is unique in the history of medicine, in the sense that a single scientist described in great detail both the cycle of transmission (vector, hosts, and a novel infectious

Analysis and modelling of Trypanosomatidae family in vitro and ex vivo cultures. 1. Introduction Chagas disease and Leishmaniasis
11
organism) and the acute clinical manifestations of the first identified human case. Findings from paleoparasitology studies that recovered T. cruzi DNA from human mummies showed that Chagas disease afflicted man as early as 9000 years ago (Aguilar-Garcia, 2010).
Chagas disease presents itself in 2 phases. The initial, acute phase lasts until about 2 months after infection. During the acute phase, a high number of parasites circulate in the blood but in most cases symptoms are absent or mild. In less than 50% of people bitten by a triatomine bug, characteristic first visible signs can be a skin lesion or a purplish swelling of the lids of one eye, and they can present fever, headache, enlarged lymph glands, pallor, muscle pain, difficulty in breathing, swelling and abdominal or chest pain (WHO, 2015).
During the chronic phase, the parasites are hidden mainly inside the cardiac cells and digestive smooth muscle cells. At long term (20 years approximately) up to 30% of patients suffer from cardiac disorders and up to 10% suffer from digestive (typically enlargement of the oesophagus or colon), neurological or mixed alterations. In later years the infection can lead to sudden death or heart failure caused by progressive destruction of the cardiac tissue and its nervous system (WHO, 2015).
Transmission
Chagas disease may be transmitted to humans and to more than 150 species of domestic animals (eg. dogs, cats and guineapigs) and wild mammals (eg. rodents, marsupials and armadillos). This transmission is mainly done by bloodsucking reduviid bugs of the subfamily Triatominae, within three overlapping cycles: domestic, peridomestic and sylvatic (Aguilar-Garcia, 2010) .
Although more than 130 species of triatomine bugs have been identified, only a handful are competent vectors for Trypanosoma cruzi in the transmission to humans: Triatoma infestans, Rhodnius prolixus, and Triatoma dimidiata. The Figure 2 shows the main vector that transmits Chagas disease: Triatoma infestans.
Triatomines have five nymphal stages and adults of both sexes, all of which can harbour and transmit T. cruzi. The probability that a triatomine is infected with T. cruzi increases in accordance with the number of blood meals taken, so that older instars and adults tend to have the highest infection rates.
Chagas disease can be transmitted to humans also by non-vectorial mechanisms such as blood transfusion and vertically from mother to infant. The risk of acquisition of Chagas disease after transfusion of one unit of blood from an infected donor is less than 10–20% and depends on several factors (e.g., the concentration of parasites in the donor’s blood, the blood component transfused and sometimes the parasite strain).
The transmission risk seems to be higher for transfusion of platelets than for other blood components. Congenital transmission occurs in 5% of pregnancies or more in chronically
Figure 2. Triatoma infestans. The main vector that transmits Chagas disease

Analysis and modelling of Trypanosomatidae family in vitro and ex vivo cultures. 1. Introduction Chagas disease and Leishmaniasis
12
infected women in some regions of Bolivia, Chile, and Paraguay, and in 1–2% or less in most other endemic countries. These differences might be attributable to the strain of the parasite, the immunological status of infected mothers, placental factors and the different methodologies used for detection of congenital cases.
Transfusion-based and congenital transmissions are the main forms of infestation of humans in urban zones and in non-endemic countries. Transmission of infection from a chronically infected donor of a solid organ or bone marrow is also possible and has been well documented in Latin America.
In non-endemic regions, such as the USA and Canada and many parts of Europe, a few cases of infection mediated by transfusion and transplantation have been documented, but the actual number of cases might be substantially higher because of the large number of immigrants from endemic areas of Latin America.
Rarely, Chagas disease can be contracted by ingestion of food or liquid contaminated with T. cruzi or from accidents in laboratories that deal with live parasites. Orally transmitted Chagas disease is usually responsible for regional outbreaks of acute infection in areas devoid of insect vectors. Ingestion of contaminated food such as sugar cane juice, açaí fruit juice, or raw meat is generally associated with massive parasitic infestation, resulting in more severe acute clinical presentation and high mortality (Aguilar-Garcia, 2010) .
Challenges and guidelines against Chagas disease from the WHO
Currently, in order to prevent and control Chagas disease, the WHO is facing many challenges:
− Reduce the transmission of the disease by domestic vector. − Maintain and consolidate advances made in disease control. − Revert the emergence of Chagas disease in regions previously considered to be free of the
disease. − Control the persistence in regions where control had been in progress, such as the Chaco
region of Bolivia. − Combat the spread of the disease mainly due to increasing population mobility between
Latin America and the rest of the world. − Enhance access to diagnosis and treatment for millions of infected people.
In order to attain the goal of eliminate Chagas disease transmission and to provide health care for infected or ill patients, both in endemic and non-endemic countries, WHO aims to increase networking at the global level and reinforce regional and national capacities, focusing on:
− Strengthening world epidemiological surveillance and information systems. − Preventing transmission by blood transfusion and organ transplantation in endemic and
non-endemic countries. − Promoting the identification of diagnostic tests for screening and diagnosis of infections. − Expanding secondary prevention of congenital transmission and case management of
congenital and non-congenital infections. − Promoting consensus on adequate case management (WHO, 2015).

Analysis and modelling of Trypanosomatidae family in vitro and ex vivo cultures. 1. Introduction Chagas disease and Leishmaniasis
13
1.1.2 Leishmaniasis
Leishmaniasis is caused by a protozoa parasite from over 20 Leishmania species and is transmitted to humans by the bite of infected female phlebotomine sandflies. Over 90 sandfly species are known to transmit Leishmania parasites (WHO, Leishmaniasis, 2015).
The first description of the parasite responsible of the Leishmaniasis was in 1903 by Leishman, Donovan and Wright from visceral and cutaneous biopsies of sick people from India. Two years before, in 1901, Leishman identified certain organisms in smears taken from the spleen of a patient who had died from "dum-dum fever" (Dum Dum is an area close to Calcutta), but was not until then that a series of experimental infections were carried out to some volunteers patients who were infected to demonstrate the pathogen power of the new protozoan.
The disease affects some of the poorest people on the planet, and it is associated with malnutrition, population displacement, poor housing, a weak immune system and lack of resources. It is estimated that there are 1’3 million new cases and 20.000 to 30.000 deaths annually (Ezquerra, 2001). There are three main types of leishmaniasis (in section “1.2.5 Types of Leishmaniasis and species of Leishmania” it is widely explained): visceral leishmaniasis, mucocutaneous leishmaniasis and cutaneous leishmaniasis. Figure 3 shows the geographical distribution of the three types.
Figure 3. Geographical distribution of leishmaniasis. 1. Visceral leishmaniasis. 2. Mucocutaneous leishmaniasis. 3. Cutaneous leishmaniasis due to L. tropica and L. aethiopica. 4. Cutaneous leishmaniasis due to L. major.
(WHO, Leishmaniasis, 2015)

Analysis and modelling of Trypanosomatidae family in vitro and ex vivo cultures. 1. Introduction Chagas disease and Leishmaniasis
14
Transmission
Leishmania parasites are transmitted through the bites of infected female phlebotomine sandflies (Figure 4). About 70 animal species, including humans, have been found as natural reservoir hosts of Leishmania parasites.
The epidemiology of leishmaniasis depends on the characteristics of the parasite species and the local ecological characteristics of the transmission sites. Accordingly, there are five different areas where different Leishmaniasis is found:
− Mediterranean basin In the Mediterranean basin, visceral leishmaniasis is the main form of the disease. It occurs in rural areas, in villages of mountainous regions and also in some periurban areas, where Leishmania parasites live in dogs and other animals. − South-East Asia In South-East Asia, visceral leishmaniasis is the main form of the disease. Transmission generally occurs in rural areas below 600m above sea level, with a heavy annual rainfall, with a mean humidity above 70%, a temperature range of 15-38 °C, abundant vegetation, subsoil water and alluvial soil. The disease is more common in agricultural villages where houses are frequently constructed with mud walls and earthen floors, and cattle and other livestock live close to humans. − East Africa In East Africa, there are frequent outbreaks of visceral leishmaniasis in the northern acacia–balanite savanna and the southern savanna and forest areas where sandflies live around termite mounds. Cutaneous leishmaniasis occurs in the highlands of Ethiopia and other places in East Africa, where increased human–fly contact occurs in villages built on rock hills or river banks, the natural habitat of hyraxes. − Afro-Eurasia In Afro-Eurasia, cutaneous leishmaniasis is the main form of the disease. Agricultural projects and irrigation schemes can increase the prevalence of cutaneous leishmaniasis as people who have no immunity to the disease move in to work on the projects. Large outbreaks in densely populated cities also occur, especially during war and large-scale population migration. The parasites causing cutaneous leishmaniasis live mainly on humans or rodents. − Americas Kala-azar in the Americas is very similar to that found in the Mediterranean basin. The habit of keeping dogs and other domestic animals inside the house is thought to promote human infection. The epidemiology of cutaneous leishmaniasis in the Americas is complex, with
Figure 4. Lutzomyia longipalpis. Main leishmaniasis vector form Central and South
America

Analysis and modelling of Trypanosomatidae family in vitro and ex vivo cultures. 1. Introduction Chagas disease and Leishmaniasis
15
variations in transmission cycles, reservoir hosts, sandfly vectors, clinical manifestations and response to therapy, and multiple circulating Leishmania species in the same geographical area.
Strategies and work against Leishmaniasis from the WHO
The prevention and the control of leishmaniasis require a combination of intervention strategies because transmission occurs in a complex biological system involving the human host, parasite, sandfly vector and in some cases an animal reservoir host. Key strategies include: − The early diagnosis and effective case management reduces the prevalence of the disease
and prevents disabilities and death. Currently there are highly effective and safe anti-leishmanial medicines particularly for visceral leishmaniasis and access to these medicines has significantly improved.
− The vector control helps to reduce or interrupt transmission of disease by controlling sandflies, especially in domestic conditions. Control methods include insecticide spray, use of insecticide–treated nets, environmental management and personal protection.
− An effective disease surveillance is important. An early detection and treatment of cases can help to reduce transmission and helps monitor the spread and burden of disease.
− The control of reservoir hosts is complex and should be tailored to the local situation. − Social mobilization and strengthening partnerships (e.g., mobilization and education of the
community with effective behavioural change, partnership and collaboration with various stakeholders and other vector-borne disease control programs is critical.
In order to control the leishmaniasis, WHO is working on: − Supporting national leishmaniasis control programmes. − Raising awareness and advocacy on the global burden of leishmaniasis, and promoting
equitable access to health services for disease prevention and case management. − Developing evidence-based policy guidelines, strategies and standards for leishmaniasis
prevention and control, and monitoring their implementation. − Providing technical support to Member States to build sustainable, effective surveillance
system and epidemic preparedness and response. − Strengthening collaboration and coordination among partners, stakeholders and other
bodies. − Monitoring the global leishmaniasis situation, trends and measure progress in the disease
control, and financing. − Promoting research on effective leishmaniasis control including in the areas of safe,
effective and affordable medicines, diagnostic tools and vaccines; facilitates the dissemination of research findings (WHO, Leishmaniasis, 2015).
Analysis and modelling of Trypanosomatidae family in vitro and ex vivo cultures. 1. Introduction Chagas disease and Leishmaniasis
16
1.2 Biology
1.2.1 Trypanosomatidae family
The Trypanosomatidae family consists of seven common genera of monoflagellates parasitic in invertebrates (leeches and arthropods) and vertebrates (Osen, 1986).
The morphology of this protozoa’s body may be oval and without a flagellum (amastigote form) or elongate and slender with a single flagellum (choanomastigote form (Crithidia), promastigote form (Leptomonas), opisthomastigote form (Herpetomonas), epimastigote form (Blastocrithidia), trypomastigote form (Trypanosoma).
The flagellum may extend freely from the anterior end or run along the free margin of a delicate wavy membrane attached to the side of the body. In some cases, the flagellum terminates at the anterior end of the undulating membrane and in others it extends beyond as a free structure. The basal portion of the flagellar complex inside the body is the axoneme, a nine-fibered cylinder which terminates at the centriole. The distinct, darkly staining kinetoplast containing DNA is located near the base of the axoneme. A reservoir consisting of an invagination of the cuticle surrounds the axoneme along its full length; the flagellum emerges through the opening. A contractile vacuole empties into the reservoir from the side.
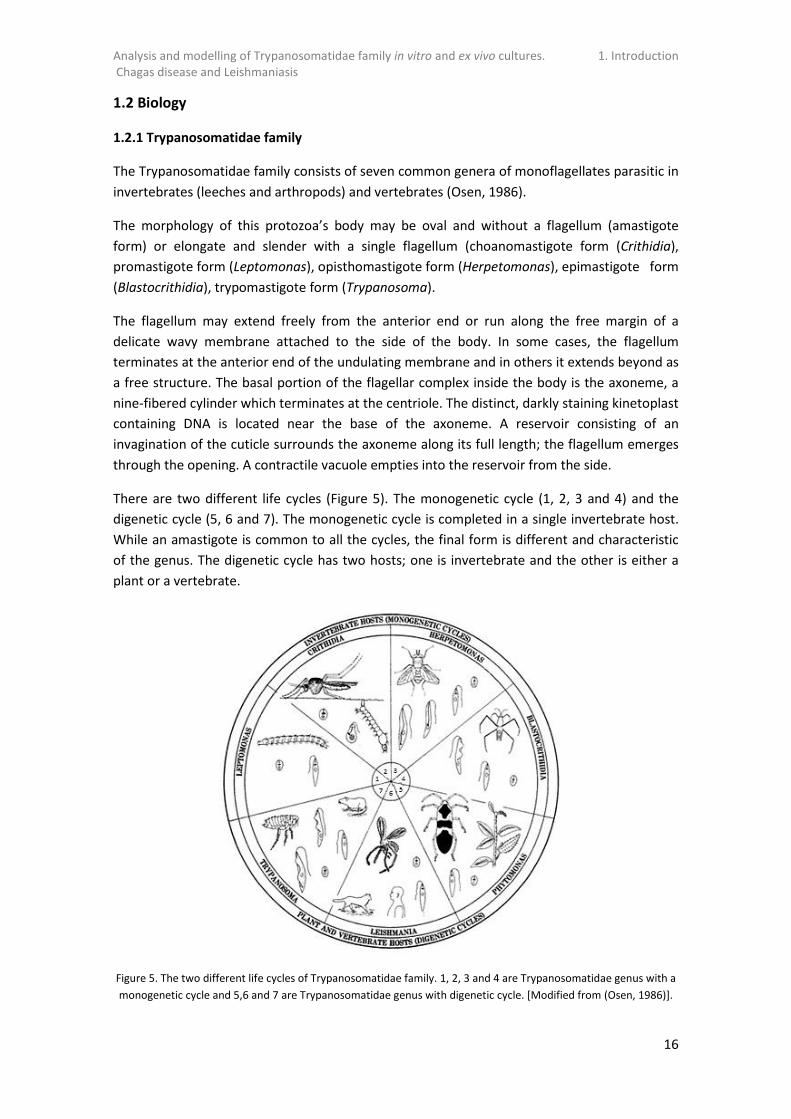
There are two different life cycles (Figure 5). The monogenetic cycle (1, 2, 3 and 4) and the digenetic cycle (5, 6 and 7). The monogenetic cycle is completed in a single invertebrate host. While an amastigote is common to all the cycles, the final form is different and characteristic of the genus. The digenetic cycle has two hosts; one is invertebrate and the other is either a plant or a vertebrate.
Figure 5. The two different life cycles of Trypanosomatidae family. 1, 2, 3 and 4 are Trypanosomatidae genus with a monogenetic cycle and 5,6 and 7 are Trypanosomatidae genus with digenetic cycle. [Modified from (Osen, 1986)].

Analysis and modelling of Trypanosomatidae family in vitro and ex vivo cultures. 1. Introduction Chagas disease and Leishmaniasis
17
There are six types of bodies based on the morphological features (Osen, 1986): amastigotes, promastigote, choanomastigote, opisthomastigote, epimastigote and trypomastigote. Figure 6 shows the six distinct body types, each one representing a genus.
Figure 6. The body types of the genres of Trypanosomatidae family. A is the amastigote form, B is the promastigote form, C is the choanomastigote form, D is the opisthomastigte form, E is the epimastigote form and F is the
trypomastigote form. [Modified from (Osen, 1986)].
The first form (A in Figure 6) is the amastigote form, formerly the leishmanial form. It is a small rounded or oval body without a flagellum. It occurs as one stage in all of the life cycles and is representative of the genus Leishmania.
The second one (Figure 6B) is the promastigote form. It is characteristic of the protozoa leptomonad and has a slender, spindle-shaped body with a free flagellum. The kinetoplast is near the anterior end of the body. There is no undulating membrane. This form represents the genus Leptomonas.
The third form (Figure 6C) is choanomastigotes. Under this form, the organisms are small, flagellated bodies with broad ends, a truncated anterior and a rounded posterior. The flagellum emerges from the funnel-shaped reservoir. There is no undulating membrane. The kinetoplast is anterior and lateral to the nucleus. This somewhat aberrant form is characteristic of the genus Crithindia and does not appear in the life cycle of any other genus.
The fourth form (Figure 6D) is opisthomastigote and represents the genus of Herpetomonas. The kinetoplast is posterior to the nucleus and the axoneme runs through almost the entire length of the body. There is no undulating membrane.
The fifth form (Figure 6E) is the epimastigote form, which has the kinetoplast near the anterior margin of the nucleus. A short undulating membrane is present. This form represents the genus Blastocrithidia.
The last form (Figure 6F) is the trypomastigote form, in which the kinetoplast is near the posterior end of the body and an undulating membrane runs the full length of the parasite.

Analysis and modelling of Trypanosomatidae family in vitro and ex vivo cultures. 1. Introduction Chagas disease and Leishmaniasis
18
There may or may not be a free flagellum. This form is characteristic of the genus Trypanosoma and does not appear in the life cycle of any other genus (Osen, 1986).
Trypanosomatids with a digenetic cycle
Trypanosomatids with a digenetic type of life cycle include an invertebrate as one host and a plant or a vertebrate as the other. Specifically, the genus Leishmania vectors are sandflies (Phlebotominae subgenera) and mammals as hosts. The genus Trypanosoma requires leeches or bloodsucking insects (Triatomines subfamily of the Reduviidae family) as the invertebrate hosts and vertebrates of various kinds as the alternate hosts.
Therefore, those trypanosomatids can parasitize bugs and plants or mammals and insects. Those who parasite the mammals are responsible of many diseases in man and his domestic mammals. The pathogenic species normally occur in tropical and semitropical regions, being limited by the distribution of their insect vectors. A few species that have dropped the insect vector from their life cycles are transmitted mechanically or by venereal contact (Osen, 1986).

Analysis and modelling of Trypanosomatidae family in vitro and ex vivo cultures. 1. Introduction Chagas disease and Leishmaniasis
19
1.2.2 Genus Trypanosoma
Trypanosoma is one of the seven genera of the family Trypanosomatidae (Osen, 1986). This genus has seven subgenera: Trypanosoma theileri (Megatrypanum), Trypanosoma lewisi (Herpetosoma), Trypanosoma cruzi (Schizotrypanum), Trypanosoma vivax (Duttonella), Trypanosoma congolense (Nannomonas), Trypanosoma suis (Pycnomonas) and Trypanosoma brucei (Trypanozoon).
The Trypanosoma are parasites of the blood, lymph, tissues, or cavities of all classes of vertebrates. The transmission of the infective stage from one vertebrate host to another may take place in several ways. These can include (Osen, 1986):
− Inoculative and contaminative means during feeding of the invertebrate vectors. − Mechanical transfer by vectors. − Transmission by venereal contact of two vertebrate hosts.
While taking blood meals, vectors, such as leeches feeding on fish and amphibians and tsetses on mammals and crocodiles, inject infective trypomastigotes directly into the host. In the case of bugs, keds, and fleas, which defecate while feeding, the trypomastigotes are voided with the feces, contaminating the area around the wound which they enter.
The stages occurring in the life cycle include four forms. They are the amastigote, promastigote, epimastigote and trypomastigote.
As mentioned, in their basic life cycle there are two hosts: a vertebrate and a bloodsucking invertebrate. Multiplication is by binary fission and budding. When the parasite is taken into the alimentary canal of the invertebrate vector, it undergoes a cyclic transformation through one or more stages such as amastigote, promastigote, epimastigote, and finally the trypomastigote. The first three forms are not infective to the vertebrate host; only the trypomastigote is the infective stage and is known as the metatrypanosome or a metacyclic trypanosome. They are small trypomastigotes that develop in the anterior part of the alimentary canal and salivary glands in leeches and tsetses and in the posterior part of the digestive tract of fleas, hippoboscid flies and bloodsucking bugs.
The trypanosomes of mammals are considered under the two major groups based on whether the metacyclic trypanosomes develop in the posterior or anterior stations of the vectors. Those two major groups are: section Stercoraria and section Salivaria (Osen, 1986).
Section Stercoraria
Metacyclic trypanosomes of this group develop in the rectum of the vectors and are discharged from the body through feces. Morphologically, the posterior end of the trypomastigotes from the blood is pointed and the kinetoplast is subterminal from the posterior end of the body. Biologically, the species of this group are characterized by the site of development, the manner of infection of the vertebrate host, and the place and the type of multiplication in the vertebrate host.

Analysis and modelling of Trypanosomatidae family in vitro and ex vivo cultures. 1. Introduction Chagas disease and Leishmaniasis
20
The metacyclic trypanosomes vectors are fleas, keds, hippoboscid flies and reduviid bugs. When metacyclic trypanosomes invade the vertebrate host, they do it through wounds made by the biting vectors, through abrasions on the skin, or via the intestinal mucosa when infected vectors are swallowed, entering the bloodstream from these various places of contact. The multiplication of the parasites in the mammalian host occurs in different forms and locations. Specifically Trypanosoma cruzi divides by binary fission of amastigotes inside reticuloendothelial cells such as macrophages in the liver, spleen, and bone marrow, and myocardial fibres (Osen, 1986).
Section Salivaria
The species of Salivaria are found primarily in tropical Africa. The distribution is predetermined for most species by the geographic distribution of the tsetses (Glossina spp.) which serve as the invertebrate vectors in whose bodies cyclic development takes place. There are different subgenus of the Glossina genus split into three groups of species based on a combination of distributional, behavioural, molecular and morphological characteristics: the savannah flies, the forest flies and the riverine flies (Hide, 1999). Figure 7 depicts the subgenus Glossina fusca fusca from the group forest flies.
Generally, the African species of trypanosomes are pathogenic to humans and their domestic mammals, causing severe disease and much mortality in both, but they are non-pathogenic to the wild reservoir hosts. The salivarian species form a compact group that is closely related morphologically and biologically.
Morphologically, these trypanosomes are characterized by a body that is blunt posteriorly and with the kinetoplast terminal or subterminal. The basic morphology of the trypomastigote in the blood of the mammal and the epimastigote in the midgut of the tsetse is similar.
In the forms from the bloodstream, the flagellum arises from the reservoir formed by an inpocketing of the pellicle at a point near the posterior end of the body. The flagellum extends along the side of the body, being attached through an accessory membrane of lattice-like structure.
Forms in the midgut, as well as in cultures, differ in some important and significant ways after transformation first to the epimastigotes and finally to the metacyclic trypanosomes. The kinetoplast is located far anterior from the end of the body. In addition to the large, highly convoluted anterior mitochondrion, an equally voluminous posterior one has been formed that extends to the hind end of the body. The presence of the posterior mitochondrion and dislocation of the kinetoplast may be associated with physiological requirements of the epimastigotes in the gut of tsetses. Upon transformation of the epimastigotes to the metacyclic trypanosomes, the posterior mitochondrion disappears and the kinetoplast
Figure 7. Glossina fusca fusca
Analysis and modelling of Trypanosomatidae family in vitro and ex vivo cultures. 1. Introduction Chagas disease and Leishmaniasis
21
together with axoneme and reservoir move posteriorly to the end of the body. The nucleus moves back from the anterior position occupied during this stage.
The role of the mitochondria may be associated with the physical requirements of the trypanosomes in their different hosts and are produced by the kinetoplast to meet these needs at specific times. It is postulated that the enlarged, double mitochondrion of the epimastigote might be associated with the greater demand of respiration in the tsetse gut, where the oxygen tension is low and with limited concentration of glucose. On the contrary, Trypomastigotes in the bloodstream with high oxygen tension and rich glucose content, do not require the same biochemical action and are able to function with the aid of the single, simple mitochondrion.
Biologically, cyclic development takes place only in tsetses. The metacyclic trypanosomes develop in the proboscis, salivary glands, or intestine. Infection of the vertebrate occurs when the metacyclic trypanosomes are injected with the saliva form the anterior station by the flies while sucking blood. Multiplication in the blood of the vertebrate host is done by simple binary fission of the trypomastigotes, the only stage present. All the species of trypanosomes can be transferred directly through the mouth parts of bloodsucking insects such as tabanid and stomoxys flies.
The section Salivaria is divided into three parts according to biological basis. They are the vivax group, the congolense group and the bruceievansi group. Each group is based on the location in the tsetses where cyclic development takes place.
The trypanosomes of the vivax and congolense groups infect the vertebrates through the injection of the metacyclic trypanosomes with the saliva of the feeding flies (inoculative means of infection). A similar means of infection occurs between the leech vectors and aquatic vertebrates such as fish and amphibians.
The trypanosomes of the bruceievansi group (species T. brucei, T. evansi and T. equiperdum) do not require an invertebrate host for their development and transfer. They are mechanically transmitted from one vertebrate to another mechanically by biting flies or through venereal contact. Therefore multiplication takes place in the bloodstream (Osen, 1986).

Analysis and modelling of Trypanosomatidae family in vitro and ex vivo cultures. 1. Introduction Chagas disease and Leishmaniasis
22
1.2.3 Trypanosoma cruzi
Trypanosoma cruzi (Figure 8) is subgenera of the genera Trypanosoma from the family Trypanosomatidae (Osen, 1986).
As it was mentioned before T. cruzi has a digenetic cycle so it has two hosts: an invertebrate and a vertebrate. The vertebrate common natural reservoir hosts are mainly humans but also include bats, opossums, raccoons, armadillos, dogs, cats, pigs and wood rats. The principal sites of T. cruzi in those hosts are blood, reticuloendothelial cells of the blood vessels, liver, spleen, lymph glands, bone marrow, the glial cells, and cardiac and skeletal muscles.
The invertebrate hosts include a number of species of reduviid bugs. The common ones in the tropics are Panstrongylus megistus, Triatoma infestans and Rhodnius prolixus (Osen, 1986).
The occurrence of T. cruzi in humans is dependent on the bites of infected bug vectors which acquire their infections from the wild reservoir mammalian hosts. In the tropics, the nocturnal bugs use the mud and thatched houses as habitats for resting during the days and for hunting at nights when they feed on the sleeping people. Infection occurs most commonly in rural and ghetto areas where poor housing provides a suitable habitat for the bugs.
The length of T. cruzi epimastigote and trypomastigote form is approximately 20µm (both when is slender and broad). The posterior end of the body is pointed, as shown in the Figure 8. The nucleus is located near the middle of the body, and the dark kinetoplast is so large that produce bulges on each side of the body. The undulating membrane is weakly developed, having two or three convolutions, and the flagellum is always free. The diameter of intracellular amastigotes is between 1’5 and 4µm and their shape is oval.
Figure 9 shows the life cycle of Trypanosoma cruzi. Upon entering the skin of the vertebrate host through punctures or abrasions of the skin, the metacyclic trypanosomes do not undergo multiplication in the blood. Instead of that they enter the reticuloendothelial cells of the liver, spleen, glial cells, and myocardial or the skeletal muscles and transform to amastigotes (by first going through the epimastigote stage). Inside the various cells the amastigotes multiply by binary fission, producing various individuals. When the destroyed cells rupture, the parasites are dumped into the blood, where they transform successively to promastigotes, epimastigotes and finally metacyclic trypomastigotes. Those trypomastigotes in the peripheral blood are infective to the arthropod vectors but they do not multiply.
When the blood is sucked up by reduviid bugs, the trypomastigotes start the cycle of development in the intestine. They first transform into epimastigotes in the midgut, where the
Figure 8. Trypanosoma cruzi (epimastigote morphological form) [From CDC (Centres for Disease Control and
Prevention)]

Analysis and modelling of Trypanosomatidae family in vitro and ex vivo cultures. 1. Introduction Chagas disease and Leishmaniasis
23
initial process of multiplication by binary fission occurs. By the end of 8 to 10 days of multiplication, the epimastigotes change to small metacyclic trypanosomes in the rectum of the bugs.
While feeding, preferably on the eyelids or lips, the bugs habitually defecate voiding feces that contain numerous metacyclic trypanosomes. Infection of the vertebrate host is by the contaminative process in which fecal matter enters the skin through punctures made by the biting bugs or through abrasions of the skin.
Figure 9. The life cycle of Trypanosoma cruzi showing the three morphological forms. Epimastigote and tripomastigote form in the invertebrate host (red arrows) and amastigote and tripomastigote in the vertebrate host
(blue arrows) [Modified from the CDC (Centres for Disease Control and Prevention)]
Pathology
Trypanosomiasis cruzi appears in an acute form especially in children and in a chronic stage mainly in adult humans. It apparently does not affect the other animals.
Early symptoms of the acute phase appear as swelling of one, usually or both eyelids where the metacyclic trypanosomes have entered the tissues at the site of the bug bites. The inflammatory swellings at the location of the bites are known as chagomas, named after Chagas, who discovered the organism and the disease it causes. Later, enlargement of the cervical and other lymph glands, liver, and spleen occurs. Anaemia, headache and fever are prevalent.

Analysis and modelling of Trypanosomatidae family in vitro and ex vivo cultures. 1. Introduction Chagas disease and Leishmaniasis
24
Upon reaching the tissues, the trypanosomes enter or are engulfed by different cells, where they transform into amastigotes and multiply. From here, they eventually enter and multiply in the major lymph nodes, liver, spleen, glial cells, macrophages and myocardium, as well as other tissues and organs. The destruction of the cells is the final result of infection.
The chronic form of the disease usually appears in adults and may vary at the different geographic areas. The damage in the chronical phase includes cardiac damage resulting in heart dysfunction, and enlargement of the esophagus and colon, causing impaired peristalsis. Additional manifestations involve parts that are affected such as nerve tissues and reticuloendothelial system (Osen, 1986).

Analysis and modelling of Trypanosomatidae family in vitro and ex vivo cultures. 1. Introduction Chagas disease and Leishmaniasis
25
1.2.4 Genus Leishmania
The members of this genus appear as minute, oval amastigotes in the cells of the reticuloendothelial system of the skin, bone marrow, liver, spleen, and lymph nodes of mammals and reptiles, and as spindle-shaped promastigotes in the alimentary canal of sand flies, the invertebrate vector, and in cultures (Osen, 1986).
Leishmania parasite, as it was mentioned before, is digenetic, so it performs part of its life cycle in the gastrointestinal tract of the invertebrate host in the flagellar form (promastigote, Figure 10) and in the vertebrate within mononuclear phagocytes, mainly macrophages in the amastigote form.
When a sandfly infested engorged blood from a vertebrate, it inoculates the promastigotes present in the proboscis. Once the parasite is in the skin capillaries of the vertebrate host, the macrophage engulfs the protozoan and encompasses it in a parasitophorous vacuole trying to remove it by a cascade of oxygen derived metabolites and the release of lysosomal hydrolases, discharges in the intravacuolar space. Nevertheless, Leishmania evades all these nonspecific macrophage immune responses to live and multiply inside the macrophage (Osen, 1986).
Therefore, the effectiveness of the immune response and the virulence of the protozoan are the determinants of the Leishmaniasis progression. If leishmanias survive, the circulating parasitized monocytes are engorged by other sandfly in which bowel the amastigotes are released and recovered the form of promastigotes. After several days, they reach their infectivity capacity in the vicinity of the proboscis being arranged to be inoculated. In this point the cycle is closed (Figure 11).
Figure 10. Leishmania braziliensis (promastigote form)

Analysis and modelling of Trypanosomatidae family in vitro and ex vivo cultures. 1. Introduction Chagas disease and Leishmaniasis
26
Figure 11. The life cycle of Leishmania showing the three morphological forms. Amastigotes inside the infected macrophages are transformed to promastigotes (red arrows) in the invertebrate host and promastigotes are
transformed to amastigote in the vertebrate host (blue arrows) [Modified from the CDC (Centers for Disease Control and Prevention]
It is generally accepted that Leishmania multiplication is asexual. It is performed by a longitudinal bipartition of promastigotes, except the metacyclic form which is a non-dividing form. The division starts in the nucleus, then in the basal body, then the scourge and the soma are shaped. The amastigotes can be divided either by bipartition or multiple divisions (Osen,1986).

Analysis and modelling of Trypanosomatidae family in vitro and ex vivo cultures. 1. Introduction Chagas disease and Leishmaniasis
27
1.2.5. Types of Leishmaniasis and species of Leishmania
The genus Leishmania is the responsible of Leishmaniasis. It occurs throughout the tropical and subtropical regions of the world, and its geographic distribution corresponds with that of the sand flies responsible for transmission among the reservoir hosts and between them and man (WHO, Leishmaniasis, 2015).
Leishmaniasis is caused by a protozoa parasite from over 20 Leishmania species and is transmitted to humans by the bite of infected female phlebotomine sandflies. The species of Leishmania that affect a higher number of mammals are shown in the Table 1.
Pathology
Over 90 sandfly species are known to transmit Leishmania parasites. There are 3 main forms of the disease:
− Visceral leishmaniasis (also known as kala-azar) is fatal if left untreated. It is characterized by irregular bouts of fever, weight loss, enlargement of the spleen and liver, and anaemia. It is highly endemic in the Indian subcontinent and in East Africa. An estimated 200 000 to 400 000 new cases of VL occur worldwide each year. Over 90% of new cases occur in 6 countries: Bangladesh, Brazil, Ethiopia, India, South Sudan and Sudan.
− Mucocutaneous leishmaniasis leads to partial or total destruction of mucous membranes of the nose, mouth and throat. Almost 90% of mucocutaneous leishmaniasis cases occur in the Plurinational State of Bolivia, Brazil and Peru-
− Cutaneous leishmaniasis is the most common form of leishmaniasis and causes skin lesions, mainly ulcers, on exposed parts of the body, leaving life-long scars and serious disability. About 95% of CL cases occur in the Americas, the Mediterranean basin, the Middle East and Central Asia. Over two thirds of new CL cases occur in 6 countries: Afghanistan, Algeria, Brazil, Colombia, Iran (Islamic Republic of) and the Syrian Arab Republic. An estimated 0.7 million to 1.3 million new cases occur worldwide annually (WHO, Leishmaniasis, 2015).

Analysis and modelling of Trypanosomatidae family in vitro and ex vivo cultures. 1. Introduction Chagas disease and Leishmaniasis
28
Table 1. The most important species of Leishmania (affect the major number of mammals), their clinical manifestation, their vector and their geographical distribution
Leishmania species
Clinical manifestation
Vector sand-fly species Disease
distribution Leishmania
infantum chagasi Visceral
Lutzomyia longipalpis, Lutzomyia evansi
Central and South America
Leishmania infantum
Visceral and cutaneous
Papatasi pernicious, Papatasi ariasi, Papatasi tobbi, Papatasi neglectus
Mediterranean Region
Leishmania donovani
Visceral Papatasi argentipes, Papatasi orientalis,
Papatasi Martini Africa and Asia
Leishmania tropica Cutaneous Papatasi sergenti Europe, Asia and
North Africa
Leishmania major Cutaneous
Papatasi papatasi, Papatasi duboscqi,
Papatasi salehi, Papatasi bergeroti
Africa and Asia
Leishmania braziliensis
Cutaneous and mucocutaneous
Lutzomyia intermedia, Lutzomyia whitmani, Lutzomyia migonei, Lutzomyia welcome, Lutzomyia ovallesi
South America
Leishmania amazonensis
Cutaneous and diffuse cutaneous
Lutzomyia flaviscutellata Central and South
America
Leishmania guyanensis
Cutaneous and mucocutaneous
Lutzomyia umbratilis, Lutzomyia anduzei, Lutzomyia whitmani
South America
Leishmania mexicana
Cutaneous and diffuse cutaneous
Lutzomyia olmeca olmeca, Lutzomyia shannoni, Lutzomyia diabolica
Central and South America
Leishmania panamensis
Cutaneous Lutzomyia gomezi Central and South
America Leishmania peruviana
Cutaneous Lutzomyia verrucarum South America

Analysis and modelling of Trypanosomatidae family in vitro and ex vivo cultures. 1. Introduction Chagas disease and Leishmaniasis
29
1.3 Research in Trypanosomatidae family
Research in Trypanosomatidae family of protozoa can be focused from three different scales. In this project, we will focus on Trypanosoma cruzi.
Firstly, in order to understand the protozoa’s behaviour itself, its different morphological forms are studied with in vitro cultures with the adequate medium. These cultures are used to obtain and study the different evolutive forms: epimastigotes, tripomastigotes and amastigotes. Secondly, in order to understand the protozoa’s behaviour on mammals, there is the clinical research. This point of the research is focused on the monitoring of patients infected with Trypanosoma cruzi. The detection of parasite blood is made by in vitro culture or PCR. Investigation of evolution of disease can be made in mice or other mammals experimentally infected by Trypanosoma cruzi. Thirdly, the epidemiology studies the global behaviour and incidence of the disease. For example, a bachelor thesis was done in order to design a data warehouse for the global WHO information and surveillance system to control/eliminate Chagas disease. Also there is a lot of social work that cooperate with the affected population, awareness their government about the importance of eliminate this disease in their countries.

Analysis and modelling of Trypanosomatidae family in vitro and ex vivo cultures. 1. Introduction Chagas disease and Leishmaniasis
30
1.4 Modelling
1.4.1 Interest of modelling
Scientific modelling aims to find interpret and validate approximate representations of the systems, defined by sets of elements and concepts whose characteristics and mechanisms describe the relationship between objects and mathematical operations. In this context, computational models play a key role in expanding the horizon of cognitive science because they allow more large capacity calculation and visualization in exploring the systems that surround us (Gomes-Neves & Duarte-Teodoro, 2010).
There are three technical uses of models in science. To explain those uses, Karplus (1983) provides a simple conceptual framework of systems that defines these three uses of models. The conceptual framework shows a single input (excitation) that arrives to a system object that produces a single output (response).
One technical use of models is to understand either a real, physical system or a logic system such as a scientific theory. In those cases the input and the output are given and from them the system object is inferred.
Another technical use is to predict the future or some state that is currently unknown. Here, the input and the system object are given and used to account for the observed responses so the output would be found.
And finally the model made by control, that is to say, to constrain or manipulate a system to produce a desirable condition. In this last case, the system object and the output are designed as the result of an input that wants to be exactly known (Haefner, 1996).
Classification of models
There are four forms of models (Haefner, 1996):
− Conceptual or Verbal: the descriptions are in a natural language. − Diagrammatic: made by graphical representations of the objects and relations. − Physical: a real, physical mock-up of a real system or object. − Formal: a mathematical model, usually using algebraic or differential equations.
The formal or mathematical models can be divided according to different criteria (Haefner, 1996).
Firstly, we can distinguish between empirical and mechanistic models. Empirical models are a mathematical representation of the system or its behaviour in a purely descriptive way. However, mechanistic models aim to reflect the structure and the relationships of the system, not just a purely description.
In many cases it is difficult to determine if a model is empirical or mechanistic, because in the same model we can find purely descriptive parts and mechanistic parts.

Analysis and modelling of Trypanosomatidae family in vitro and ex vivo cultures. 1. Introduction Chagas disease and Leishmaniasis
31
Secondly, we can classify models depending on the time consideration. If the time is not considered we talk about a static model and if is considered we talk about a dynamic model. Those who take into account the time, can consider time as a continuous or discrete variable. If the system can be solved algebraically the continuous variable will be used but if a numerical solution is needed, the time is treated as a discrete variable. This type of models will be explained more in detail in the next section.
Thirdly, models may incorporate or not an explicit representation of space. If we have an explicit representation of the space we are work with spatially heterogeneous models. Those models can be continuous or discrete. In the continuous spatially model every point in the space is different, instead in the discrete spatially model the space is represented as cells or blocks and each spatial cell is represented as spatially homogeneous. However, if we do not have explicit representation of space we work with spatially homogeneous models.
Finally, the model can allow or not random events. If the model allows them we are working with stochastic models. But if the model does not allow random events we are working with deterministic models, that is to say that all the input parameters are known (Haefner, 1996).
There are two strategies to study a system. We talk about “Top-down approach” when we model the system globally and the results of the modelling and simulations show how the different elements of the system interact between them. In this strategy continuous equations are mostly used (Ferrer et al., 2008).
We talk about the “Bottom-up approach” strategy when we model the behaviour of the different elements of the system and their interaction. Therefore the results are the behaviour patterns of the system globally.
Sometimes a system must be studied from different spatial scales because the study of one particular scale can be inferred to superior or inferior scales. Consequently those systems cannot be studied just through one strategy.

Analysis and modelling of Trypanosomatidae family in vitro and ex vivo cultures. 1. Introduction Chagas disease and Leishmaniasis
32
1.4.2. Continuous models and Individual-based Models
In this project we have used two types of models: continuous models and Individual-based Models –IbM- also known as Agent-based Models –AbM-).
Continuous models are mostly equation based approaches, which are the traditional way to quantify the functional relations between the characteristic variables of an observed system in science. This formalism simplifies and guides the raising, development and communication of the models, because it provides a familiar and structured framework and restricts the complexity of models to a coarse or averaged representation of real systems. Therefore, it is usually quite easy to compare population models with experimental observations and with other models. The comparison is feasible even between models designed to deal with different situations or systems.
Continuous models may synthesize experimental observations: being rapidly implemented, analysed and evaluated. They also provide criteria and indicators for assessing the quality of a given product and estimating the safety of a proposed process (Ferrer et al., 2009).
The basic drawback of the continuous approach lies in that the object under study (protozoa’s communities) is not the natural agent that causes the observed patterns (protozoa). Continuous models intrinsically ignore how the collective behaviour of a population specifically comes after the activity and interactions of individual microbes and may overlook important information in situations where the discrete nature of the system is relevant.
On the other hand there are the individual-based models defined by Grimm (1999) as “Simulation models that treat individuals as unique and discrete entities which have at least one property in addition to age that changes during the life cycle”. IbM was coined to name these discrete bottom-up approaches to biological communities in ecology during the 1970s. The term “spatially explicit IbM” refers to a model that includes a representation of the spatial configuration of the system to be represented.
IbMs are discrete models that consider rules (equations) governing variables that characterise each individual at each time step, and the state of the whole system is statistically inferred. The resulting collective behaviour of systems containing a statistical number of individuals is studied and compared to experimental observations, or to theoretical results obtained from population models. In contrast, continuous models work with differential equations applied on the variables that represent the state of the system at a certain moment and operate with finite differences between states set at discrete time steps (Ferrer et al., 2008). Models based on individuals are required when dealing with systems composed of distinguishable entities that behave according to different rules, and which depend on the state of the individual and on its local environment. They are particularly useful to check the validity of any proposed mechanism operating at an individual level whose outcome is assessed by the macroscopic observation of a community as a whole: IbMs allow the gradual introduction of complexity at an individual level and the staggered study of its global effects.
Analysis and modelling of Trypanosomatidae family in vitro and ex vivo cultures. 1. Introduction Chagas disease and Leishmaniasis
33
Phenomena which are not evident or self-contained in the input rules of the model are frequently observed. They are called emergent behaviours (Ferrer et al., 2009).

Analysis and modelling of Trypanosomatidae family in vitro and ex vivo cultures. 1. Introduction Chagas disease and Leishmaniasis
34
1.4.3 Mathematical models of the Trypanosomatidae family
There are different models existing in the Trypanosomatidae family field. The variety is wide, from molecular models which aim to model the interaction between the protozoans and the immunological system, in vitro cultures, in vivo cultures, organs, humans; to houses, ecosystems, region scale models and continental scale models. The equations presented in those models are mainly continuous equations.
We can find molecular scale models in many pharmacological thesis or articles. An example is the study of Cossy et al., (2001). In this paper they analyse the acute phase of the disease showing the dynamic competence between the parasite population and antibodies populations. They parameterize the main properties of the variables that affect the parasite-antibodies’ dynamics. Those variables are: parasites reproduction rate, antibodies creation rate, initial number of inoculated parasites and efficient rate of the antibodies against the parasites.
For their part, Rabinovich and Rossell (1976) aim to build a model which describes the main characteristics of the Chagas disease transmission. This study has its focus on the possible channels by which Trypanosoma cruzi arrives at man. Also, they expose the 26 parameters that the model is composed by and the continuous equations through they are connected.
There is a free available database on Internet called BibTri database (BIBliography on TRIatomines). This database has 6366 bibliographic references, all of them related to Chagas disease, especially to the insect vectors of the disease, the triatomines (Rabinovich, 2013).

Analysis and modelling of Trypanosomatidae family in vitro and ex vivo cultures. 1. Introduction Chagas disease and Leishmaniasis
35
1.5 Framework
The research group Computational Biology and Complex Systems (BIOCOM-SC, Universitat Politècnica de Catalunya-BarcelonaTech) has been researching in epidemiological diseases for years. They have worked with malaria, tuberculosis and now neglected tropical diseases. BIOCOM-SC aim to approach the mathematical modelling to the research on those diseases. To carry out this purpose, the modelling and simulation of different aspects of Chagas disease at different spatio-temporal scales (from in vitro cultures to epidemiological issues), a network with different organizations has been created. Firstly, the experimental culture research has been done with the Department of Health Microbiology and Parasitology of the Universitat de Barcelona under the supervision of the Dra. Cristina Riera and Dra. Roser Fisa. Both doctors have an extensive experience in Leishmania and they are currently working in Trypanosoma cruzi and Leishmania.
Also in this field of research, there was a collaboration with Claudia Martins Carneiro, parasitologist from the School of Pharmacy of the Ouro Preto Federal University, Brazil who provided us many valuable results of their in vitro and ex vivo cultures of Trypanosoma cruzi from their experimental work in the Laboratory of Clinical Research CIPHARMA of the School of Pharmacy.
This bachelor thesis contains the result of the work done with the mentioned professionals. Until now the research has been done with in vitro and ex vivo cultures, however the perspectives are to continue with the clinical research and epidemiological research.
The clinical research is going to be carried out with PROSICS (International Health Program of the Catalan Health Institute), headed by the physician Israel Molina. Finally, the epidemiological research is going to be done with the Department of Neglected Tropical Diseases (NTD) of the World Health Organization (WHO), leaded by Dr. Pedro Albajar.
“Analysis and modelling of Trypanosomatidae family in vitro and ex vivo cultures. Chagas disease and leishmaniasis” has been made in this framework with the major purpose of pave the way in the research and the understanding of Chagas disease from a mathematical modelling point of view.

Analysis and modelling of Trypanosomatidae family in vitro and ex vivo cultures. 1. Introduction Chagas disease and Leishmaniasis
36
1.6 Objectives
Analysis and modelling of Trypanosomatidae family in vitro and ex vivo cultures. Chagas disease and leishmaniasis is not a limited study that initiates and comes to an end with this document. This bachelor thesis is the beginning of a research line with different strategies that have been opened in order to explore many possibilities.
The objectives may seem quite unfocussed, but that is due to those amounts of possibilities that must be kept in mind. We started studying the simplest system, the epimastigots culture, having the willingness to progress to more complex systems, until we understand the behaviour of the parasite in humans or mammals. The similar life cycle observed between epimastigotes and amastigotes cultures of Trypanosoma cruzi and Leishmania spp. shows the interest to take advantage of the methodologies developed with T. cruzi to study Leishmania.
General objectives:
Allow for the better understanding of Trypanosoma cruzi behaviour in in vitro and ex vivo cultures.
Specific objectives:
1. Figure out which factors determine the kinetics of in vitro epimastigotes cultures.
2. Describe mathematically the behaviour of in vitro epimastigotes cultures.
3. Develop a continuous model of in vitro epimastigotes cultures.
4. Develop an image analysis technique in order to subsequently develop an Individual-based Model that will take into account the morphologic characteristics and changes of the epimastigots.
5. Develop an initial Individual-based Model of ex vivo amastigotes culture of Trypanosoma cruzi with the goal of progress in the understanding of the culture.
Analysis and modelling of Trypanosomatidae family in vitro and ex vivo cultures. 1. Introduction Chagas disease and Leishmaniasis
37
1.7 Outline
This bachelor thesis is divided in 5 chapters. The first chapter is the introduction and encompassed different information related to the diseases that are investigated in this study.
Firstly in the first section of this chapter, Chagas disease and leishmaniasis were presented in rough outlines. Straightaway in the second section of the chapter, the biology of the parasites that produce the diseases was exposed in a decreasing taxonomy order. In Trypanosoma cruzi the order was: Trypanosomatidae family, Trypanosoma genus and finally Trypanosoma cruzi subgenus. In Leishmaniasis spp. the order was: Trypanosomatidae family, Leishmania genus and Leishmania spp. subgenus.
In order to know in which scientific context the research is being done, the third section of the first chapter looked over the research from different scales done in the Trypanosomatidae family.
As it was mentioned in the objectives section (“1.6 Objectives”), the general objective of this bachelor thesis is to allow the better understanding of Trypanosoma cruzi behaviour in in vitro and ex vivo cultures. This objective is approached from the line of research of BIOCOM-SC, that is to say, the modelling. For this reason, the fourth section of the first chapter was a general introduction to the modelling and different mathematical models of the protozoa that we are studying.
The second chapter will show the experimental results of the experimental work. Those results are divided in two parts: In vitro culture results and ex vivo culture. A descriptive analysis of those results will be done in order to proceed with the mathematical modelling of the cultures.
The third chapter presents the models. On the one hand, the in vitro culture that contains the epimastigotes morphology of the protozoa was tackled with continuous models. On the other hand, the ex vivo culture that contains the amastigotes morphology of the protozoa was tackled with Individual-based Modelling.
Finally, the fourth and the fifth chapter describe the results and conclusions and the perspectives of the bachelor thesis, respectively.

Analysis and modelling of Trypanosomatidae family in vitro and ex vivo cultures. 2. Experimental work Chagas disease and Leishmaniasis
38
2. Experimental work
2.1 In vitro The experimental work that we did in vitro had the objective of seeing how different strains of Trypanosoma cruzi epimastigotes growth.
2.1.1 Material and methods
In the Department of Health Microbiology and Parasitology of the Universitat de Barcelona, we measured the growth of the epimastigote form of Trypanosoma cruzi during the period of a month. The strains of the Trypanosoma cruzi used are:
− Trypanosoma cruzi strain (BCN 585) genotype Tc II de Brazil. − Trypanosoma cruzi strain (BCN 585) Maracay, genotype Tc I Venezuela. − Trypanosoma cruzi strain (BCN 590) genotype Tc I Bolivia. The method used to monitor the growth was:
The epimastigotes were grown in a medium composed of LIT (Liver Infusion Tryptose) and 10% of FBS (Fetal Bovine Serum) in a 10 or 40mL flask (Figure 13) or an horizontal bottle (Figure 14) at 280C ± 1oC.
During 30 days, inter daily, a sample of the growth of the Trypanosoma cruzi culture was taken in order to measure the cell concentration and to quantify this growing.
The technique used to measure the growing curve was counting on the Fuchs-Rosenthal camera (Figure 15). This camera is characterized for having a large area of 16 mm2 divided in 16 large squares, each one is 1mm2. Each large square is subdivided into 16 small squares with 0.25 mm of edges and an area of 0.0625 mm2.
To prepare the counting of the cells from the culture we did the following steps:
Firstly, we diluted 100 µl with a Pasteur pipette (Figure 16) from the culture to an Eppendorf (Figure 17) with 1ml of formaldehyde 2% PBS.
Secondly, we dampened the margin in order to stick the coverslip on the camera (Figure 12). Then we homogenized the mixture and finally with the micropipette (Figure 18) of 100 µl we settled out on the camera a sample of the diluted culture. All this process was done in a laminar flow cabinet (Figure 19) to avoid contamination of our biological samples.
Figure 12. Fuchs-Rosenthal camera with the coverslip

Analysis and modelling of Trypanosomatidae family in vitro and ex vivo cultures. 2. Experimental work Chagas disease and Leishmaniasis
39
We counted the number of epimastigotes in a microscope (Figure 20). The counting was done in 16 little squares three times (in three different 16 small squares, so 3 big squares) (n1, n2, n3) we made the next calculation:
Nº cells =n1 + n2 + n3
3 ∗ 16∗ 𝑘𝑘 ∗ 𝑑𝑑𝑑𝑑𝑑𝑑𝑑𝑑𝑑𝑑𝑑𝑑𝑑𝑑𝑑𝑑 𝑓𝑓𝑓𝑓𝑓𝑓𝑑𝑑𝑑𝑑𝑓𝑓
Where:
• k = The conversion factor to obtain the data in ml/ large square (16 small squares) volume Therefore,
𝑘𝑘 =1000
0.0125= 80.000
• Dilution factor= it depends on the epimastigots concentration in the culture (in this case the dilution factor is 10).
At the same time 5 µl of samples were taken and extended onto the slide (Figure 21) where they were fixed (with glutaraldehid 0.25%) and tinted (with Giemsa 10%) and covered with a coverslip fixed with a histolytic fixative DPX.
In order to notice the evolution of the epimastigots morphology, different images were taken from all the slides by BMS Microscope (Figure 22) and Micrometrics SE premium program.
Figures 13, 14, 15, 16, 17, 18, 19, 20, 21 and 22 are the materials used in the experimental work.
Figure 13. Falcon [amex-vienna.at]
Figure 14. Rectangular flask [amazon.com]

Analysis and modelling of Trypanosomatidae family in vitro and ex vivo cultures. 2. Experimental work Chagas disease and Leishmaniasis
40
Figure 15. Fuchs-Rosenthal camera [laborchemiker.com.br]
Figure 16. Pipette Pasteur
[science-house.com]
Figure 17. Eppendorf
[biocompare.com]
Figure 18. Micropipette
[dutscher-scientific.co.uk]
Figure 19. Laminar flow cabinet
[laminarflows.co.uk]
Figure 20. Microscope [seoenterprises.com]
Figure 21. Slide
[scientificdevice.com]
Figure 22. BMS Microscope
[medicalexpo.com]

Analysis and modelling of Trypanosomatidae family in vitro and ex vivo cultures. 2. Experimental work Chagas disease and Leishmaniasis
41
2.1.2 Results Trypanosoma cruzi epimastigotes results
The experimental results that are firstly shown are from the experimental work carried out at the Department of Health Microbiology and Parasitology of the Universitat de Barcelona.
The tables with the results are appended in the Appendix A. The different growing curves are shown in Figures 23, 24 and 25.
BCN 858
Figure 23. Growing curve of the strain 858. Universitat
de Barcelona
BCN 582
Figure 24. Growing curve of the strain 582. Universitat
de Barcelona
BCN 590
Figure 25. Growing curve of the strain 590. Universitat
de Barcelona
In those firstly experiments, the epimastigots were fed with 10 mL of medium in a falcon.
However, in the second measurement of the epimastigots, showed in Figure 26, they were grown in a rectangular flask (Figure 14) with 40 mL of medium and culture. This volume difference is discussed in the section “2.1.3 Analysis of the results”.

Analysis and modelling of Trypanosomatidae family in vitro and ex vivo cultures. 2. Experimental work Chagas disease and Leishmaniasis
42
BCN 590 (2)
Figure 26. Growing curve of the strain 590 (2). Universitat de Barcelona
From the School of Pharmacy of the Ouro Preto Federal University of Brasil, Claudia Martins Carneiro provided us many valuable results of the growth of other Trypanosoma cruzi strains (Be- 62 and Be -78). These ones were done during the period of 20 days.
The name of many strains is ended with 12, 6 or 3, referring to the months that the protozoa were inside the mice where they were previously inoculated.
The tables with the results are appended in the Appendix A. The different growing curves are shown in Figures 27, 28, 29, 30, 31, 32, 33, 34, 35 and 36.
Be-62
Figure 27. Growing curve of the strain Be-62. Ouro
Preto
Be-78
Figure 28. Growing curve of the strain Be-78. Ouro Preto

Analysis and modelling of Trypanosomatidae family in vitro and ex vivo cultures. 2. Experimental work Chagas disease and Leishmaniasis
43
375-12-3
Figure 29. Growing curve of the strain 375-12-3. Ouro
Preto
375-12-6
Figure 30. Growing curve of the strain 375-12-6. Ouro
Preto
371-12-6
Figure 31. Growing curve of the strain 371-12-6. Ouro
Preto
371-12-12
Figure 32. Growing curve of the strain 371-12-12. Ouro
Preto
372-12
Figure 33. Growing curve of the strain 372-12. Ouro
Preto
385-12-6
Figure 34. Growing curve of the strain 385-12-6. Ouro
Preto

Analysis and modelling of Trypanosomatidae family in vitro and ex vivo cultures. 2. Experimental work Chagas disease and Leishmaniasis
44
385-12-12
Figure 35. Growing curve of the strain 385-12-12. Ouro
Preto
391-12
Figure 36. Growing curve of the strain 391-12. Ouro
Preto
Diaz (1996) in his thesis “Variabilidad intraespecífica en Trypanosoma cruzi y ensayo de nuevos métodos para el cribado farmacológico” did different measurements to many in vitro culture strains of epimastigots.The tables with the results are appended in the Appendix A. The different growing curves are shown in Figures 37, 38, 39, 40, 41 and 42.
Bolivia strain
Figure 37. Growing curve of Bolivia strain. Madrid
RAL strain
Figure 38. Growing curve of RAL strain. Madrid
GM strain
Figure 39. Growing curve of GM strain. Madrid
MC strain
Figure 40. Growing curve of MC strain. Madrid

Analysis and modelling of Trypanosomatidae family in vitro and ex vivo cultures. 2. Experimental work Chagas disease and Leishmaniasis
45
Y strain
Figure 41. Growing curve of Y strain. Madrid
Tulahuén strain
Figure 42. Growing curve of Tulahuén strain. Madrid
Leishmania results
In the Department of Health Microbiology and Parasitology of the Universitat de Barcelona, we also measured the growth of Leishmania epimastigotes form for 7 days. As is shown in the graphics, we stopped the measurement at the growth phase (not at the final phase as we did with Trypanosoma cruzi).
The tables with the results are appended in the Appendix A. The different growing curves are are shown in Figures 43, 44 and 45.
Leishmania braziliensis
Figure 43. Growing curve of Leishmania braziliensis.
Universitat de Barcelona
Leishmania major
Figure 44. Growing curve of Leishmania major.
Universitat de Barcelona
Leishmania infantum
Figure 45. Growing curve of Leishmania infantum.
Universitat de Barcelona

Analysis and modelling of Trypanosomatidae family in vitro and ex vivo cultures. 2. Experimental work Chagas disease and Leishmaniasis
46
2.1.3 Analysis of the results
We can observe that the growth of the different strains of Trypanosoma cruzi, Leishmania braziliensis and Leishmania major epimastigotes have a common pattern. The Figures 46, 47, 48 and 49 represent those common pattern in the growing phase in different samples. BCN 582 strain
Figure 46. Bi-linear growing phase of the strain BCN 582
of Trypanosoma cruzi. Universitat de Barcelona
371-12-6 strain
Figure 47. Bi-linear growing phase of the strain 371-12-6
of Trypanosoma cruzi. Ouro Preto Bolivia strain
Figure 48. Bi-linear growing phase of the Bolivia strain of
Trypanosoma cruzi. Madrid
Leishmania major
Figure 49. Bi-linear growing phase of Leishmania major. Universitat de Barcelona
This general common pattern is shown in Figure 50. After a latent phase (Ferrer, Prats, & López, 2008) with a slow and linear growth, we can observe a quicker and also linear growth (growing phase). Once reached the maximum value the population decrease linearly (decreasing phase) till a certain value (final phase). This certain value is wide variable between the different samples; in some cases the culture descends to significantly low values and in other cases it does not reach those low quantities. In section ”3.1 Continuous model of in vitro culture” the reasons why this occurs are hypothesized.

Analysis and modelling of Trypanosomatidae family in vitro and ex vivo cultures. 2. Experimental work Chagas disease and Leishmaniasis
47
Figure 50. Model of the growing curve of Trypanosoma cruzi epimastigotes and some Leishmania spp.
The growth phase was told to be exponential by much bibliography. But it can be observed that there is a bi-linear growth composed by a latent phase (with its own derivative) and a growing phase (with its own derivative).
The growth of the BCN 590 strain was done with two different medium conditions. If we observe the results of the first and the second measurement, we can notice that the amount of epimastigotes that the first measurement achieves is not achieved by the second measurement (from the last days of the first week the concentration of epimastigotes is widely higher in the first measurement than in the second measurement).
As it was previously mentioned, in the first measurement the epimastigots were fed with 10 mL of medium (the medium was composed of LIT (Liver Infusion Tryptose) with 10% of FBS (Fetal Bovine Serum) in a vertical flask.
This quantity of medium was not enough to make a correct counting of the number of epimastigotes correctly because each time that a sample was taken, a part of the mixture was removed. Therefore, the volume of the medium was been reduced and the concentration of the epimastigotes increased slightly constantly.
However, in the second measurement the epimastigotes were grown in a horizontal bottle and feed with 40 mL of medium and culture. Consequently, the epimastigotes were not limited by the nutrient and the sample that was taken from the mixture was not in danger to be modified by the high untrue concentration of epimastigots in a very low quantity of volume.
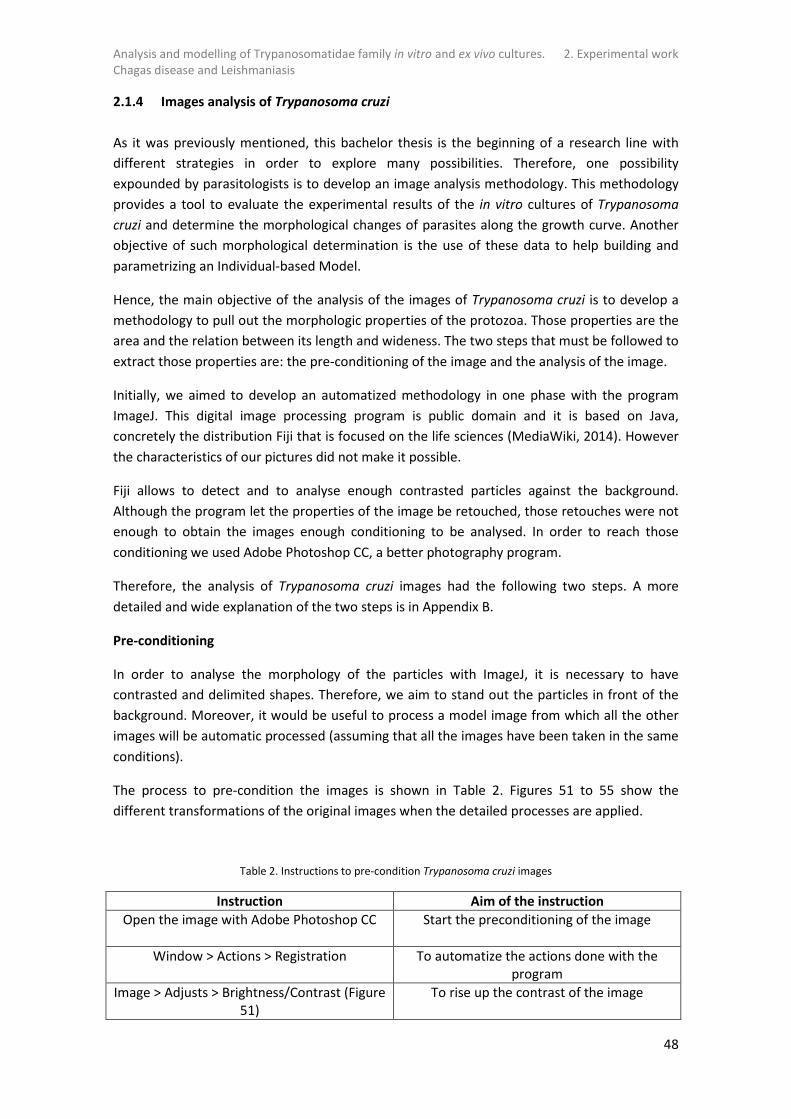
Analysis and modelling of Trypanosomatidae family in vitro and ex vivo cultures. 2. Experimental work Chagas disease and Leishmaniasis
48
2.1.4 Images analysis of Trypanosoma cruzi
As it was previously mentioned, this bachelor thesis is the beginning of a research line with different strategies in order to explore many possibilities. Therefore, one possibility expounded by parasitologists is to develop an image analysis methodology. This methodology provides a tool to evaluate the experimental results of the in vitro cultures of Trypanosoma cruzi and determine the morphological changes of parasites along the growth curve. Another objective of such morphological determination is the use of these data to help building and parametrizing an Individual-based Model.
Hence, the main objective of the analysis of the images of Trypanosoma cruzi is to develop a methodology to pull out the morphologic properties of the protozoa. Those properties are the area and the relation between its length and wideness. The two steps that must be followed to extract those properties are: the pre-conditioning of the image and the analysis of the image.
Initially, we aimed to develop an automatized methodology in one phase with the program ImageJ. This digital image processing program is public domain and it is based on Java, concretely the distribution Fiji that is focused on the life sciences (MediaWiki, 2014). However the characteristics of our pictures did not make it possible.
Fiji allows to detect and to analyse enough contrasted particles against the background. Although the program let the properties of the image be retouched, those retouches were not enough to obtain the images enough conditioning to be analysed. In order to reach those conditioning we used Adobe Photoshop CC, a better photography program.
Therefore, the analysis of Trypanosoma cruzi images had the following two steps. A more detailed and wide explanation of the two steps is in Appendix B.
Pre-conditioning
In order to analyse the morphology of the particles with ImageJ, it is necessary to have contrasted and delimited shapes. Therefore, we aim to stand out the particles in front of the background. Moreover, it would be useful to process a model image from which all the other images will be automatic processed (assuming that all the images have been taken in the same conditions).
The process to pre-condition the images is shown in Table 2. Figures 51 to 55 show the different transformations of the original images when the detailed processes are applied.
Table 2. Instructions to pre-condition Trypanosoma cruzi images
Instruction Aim of the instruction Open the image with Adobe Photoshop CC
Start the preconditioning of the image
Window > Actions > Registration To automatize the actions done with the program
Image > Adjusts > Brightness/Contrast (Figure 51)
To rise up the contrast of the image

Analysis and modelling of Trypanosomatidae family in vitro and ex vivo cultures. 2. Experimental work Chagas disease and Leishmaniasis
49
Image > Adjusts > Hue/Saturation To decolorize the background and enlighten
the particles (Figure 52 and Figure 53)
To have coloured particles and not coloured background
Selection > Color range (Figure 54) To have black coloured particles and white coloured background
Selection > Modify > Round To improve the selection Layer > New > Layer To avoid interference between original image
and selection Tool: Paint Bucket – Color white > Click
anywhere on the picture To paint the background
Selection > Invert To select the non-painted part (i.e. particles) Tool: Paint Bucket – Color black > Click
anywhere on the picture To paint the particles
Selection > Deselect (Figure 55) To deselect the selection Stop button on action panel To finalize and save the process we just
created File > Automate > Batch To condition the rest of the images
Figure 51. Image of Trypanosoma cruzi culture with the contrast rose up
Figure 52. Image of Trypanosoma cruzi culture with the saturation reduced

Analysis and modelling of Trypanosomatidae family in vitro and ex vivo cultures. 2. Experimental work Chagas disease and Leishmaniasis
50
Figure 53. Image of Trypanosoma cruzi culture with the saturation up to 100
Figure 54. Image of Trypanosoma cruzi culture transforming to binary
Figure 55. Image of Trypanosoma cruzi culture original and binary

Analysis and modelling of Trypanosomatidae family in vitro and ex vivo cultures. 2. Experimental work Chagas disease and Leishmaniasis
51
Analysis of the images
Once the pre-conditioning treatment has finished, the particles are well-contrasted and we are able to use ImageJ. Similarly as with Photoshop, this open-source program allows to record steps in a macro (a routine of steps that the program will reproduce automatically later).
The process to analyse the images is summarized in Table 3. Figures 56 to 59 show different images of the processing protocol.
Table 3. Instructions to analyse Trypanosoma cruzi images
Instruction Aim of the instruction Open a conditioned image on ImageJ Start the analysis process Plugins > Macros > Record To start recording our instructions Analyze > Set scale (Figure 56) To define metric system units in the image
(not pixels) Processes > Binary > Make binary To convert the image to binary mode Processes > Binary > Close To enclose all the particle area Processes > Binary > Fill holes To fill possible empty zones inside the
particle Analyze > Set measurements (Figure 57) To select the measurements we want from
the particles Analyse > Analyse particles To obtain the desired measurements Image > Overlay > Labels (Figure 58) To change the color font of the numbers Macro window > Cerate button > File > Save (Figure 59)
To save the macro, the list of instructions
Figure 56. Scales of the images

Analysis and modelling of Trypanosomatidae family in vitro and ex vivo cultures. 2. Experimental work Chagas disease and Leishmaniasis
52
Figure 57. Different measurements to analyse the images
Figure 58. Image of Trypanosoma cruzi culture with the measurements
Figure 59. Macro of the process to analyse the images
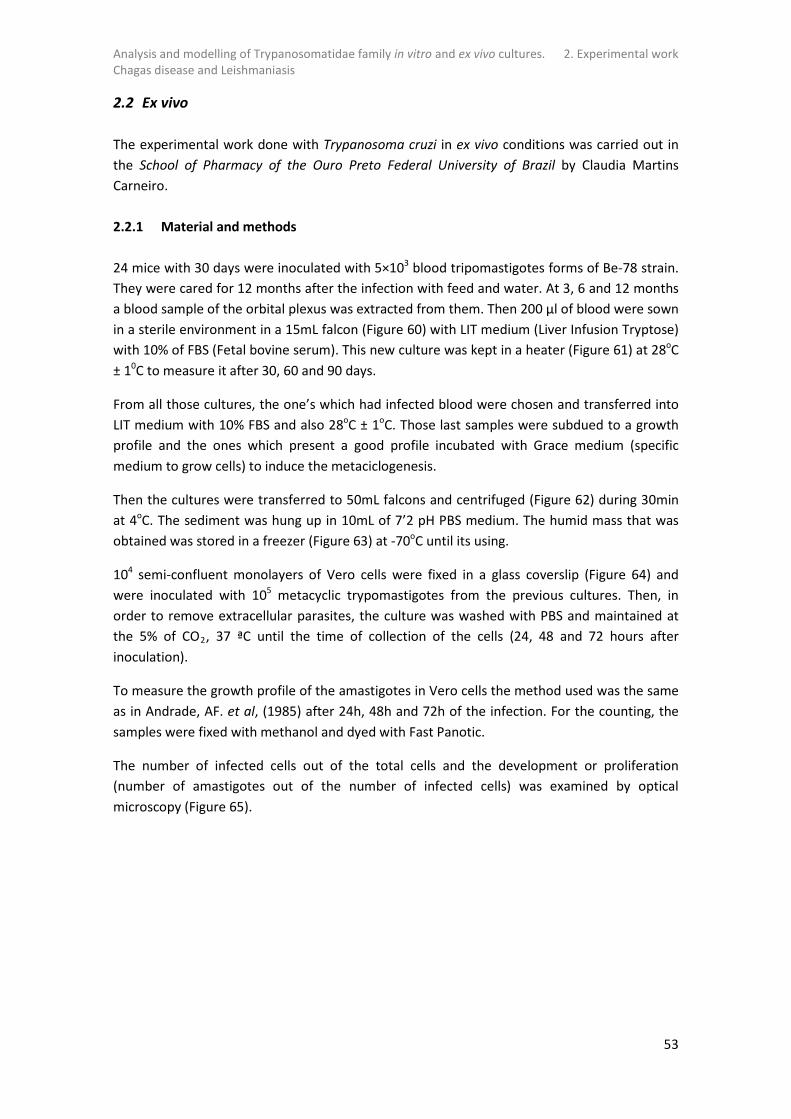
Analysis and modelling of Trypanosomatidae family in vitro and ex vivo cultures. 2. Experimental work Chagas disease and Leishmaniasis
53
2.2 Ex vivo The experimental work done with Trypanosoma cruzi in ex vivo conditions was carried out in the School of Pharmacy of the Ouro Preto Federal University of Brazil by Claudia Martins Carneiro. 2.2.1 Material and methods
24 mice with 30 days were inoculated with 5×10³ blood tripomastigotes forms of Be-78 strain. They were cared for 12 months after the infection with feed and water. At 3, 6 and 12 months a blood sample of the orbital plexus was extracted from them. Then 200 µl of blood were sown in a sterile environment in a 15mL falcon (Figure 60) with LIT medium (Liver Infusion Tryptose) with 10% of FBS (Fetal bovine serum). This new culture was kept in a heater (Figure 61) at 28oC ± 10C to measure it after 30, 60 and 90 days.
From all those cultures, the one’s which had infected blood were chosen and transferred into LIT medium with 10% FBS and also 28oC ± 1oC. Those last samples were subdued to a growth profile and the ones which present a good profile incubated with Grace medium (specific medium to grow cells) to induce the metaciclogenesis.
Then the cultures were transferred to 50mL falcons and centrifuged (Figure 62) during 30min at 4oC. The sediment was hung up in 10mL of 7’2 pH PBS medium. The humid mass that was obtained was stored in a freezer (Figure 63) at -70oC until its using.
104 semi-confluent monolayers of Vero cells were fixed in a glass coverslip (Figure 64) and were inoculated with 105 metacyclic trypomastigotes from the previous cultures. Then, in order to remove extracellular parasites, the culture was washed with PBS and maintained at the 5% of CO2, 37 ªC until the time of collection of the cells (24, 48 and 72 hours after inoculation).
To measure the growth profile of the amastigotes in Vero cells the method used was the same as in Andrade, AF. et al, (1985) after 24h, 48h and 72h of the infection. For the counting, the samples were fixed with methanol and dyed with Fast Panotic.
The number of infected cells out of the total cells and the development or proliferation (number of amastigotes out of the number of infected cells) was examined by optical microscopy (Figure 65).

Analysis and modelling of Trypanosomatidae family in vitro and ex vivo cultures. 2. Experimental work Chagas disease and Leishmaniasis
54
Figures 60, 61, 62, 63, 64 and 65 are the materials used in the experimental work.
Figure 60. Falcon [amex-vienna.at]
Figure 61. Heater
[pblequipo2.wordpress.com]
Figure 62. Centrifuge [eng.spbu.ru]
Figure 63. Freezer
[korean-machinery.com]
Figure 64. Glass coverslip [livshop.com.au]
Figure 65. Optical microscope [tedpella.com]

Analysis and modelling of Trypanosomatidae family in vitro and ex vivo cultures. 2. Experimental work Chagas disease and Leishmaniasis
55
2.2.2 Results Trypanosoma cruzi amastigotes results
The first measurement that Claudia Martins Carneiro did at the School of Pharmacy of the Ouro Preto Federal University of Brazil was number of infected cells out of the counted cells (100 counted cells) that their ex vivo culture have. Those results are shown in Figures 66, 67, 68, 69, 70, 71, 72, 73, 74 and 75. They are represented in a scale from 0 to 1, so if the number is 0’2 it means that there were 20 infected cells out of 100 counted cells. The tables with the numbers are in the Appendix C.
Be- 62
Figure 66. Infected cells/counted cells of ex vivo culture
of the strain Be-62. Ouro Preto
Be-78
Figure 67. Infected cells/counted cells of ex vivo
culture of the strain Be-78. Ouro Preto
375-12-3
Figure 68. Infected cells/counted cells of ex vivo culture
of the strain 375-12-3. Ouro Preto
371-12-3
Figure 69. Infected cells/counted cells of ex vivo
culture of the strain 371-12-3. Ouro Preto

Analysis and modelling of Trypanosomatidae family in vitro and ex vivo cultures. 2. Experimental work Chagas disease and Leishmaniasis
56
371-12-6
Figure 70. Infected cells/counted cells of ex vivo culture
of the strain 371-12-6. Ouro Preto
372-12-6
Figure 71. Infected cells/counted cells of ex vivo
culture of the strain 372-12-6. Ouro Preto 375-12-6
Figure 72. Infected cells/counted cells of ex vivo culture
of the strain 375-12-6. Ouro Preto
385-12-6
Figure 73. Infected cells/counted cells of ex vivo
culture of the strain 385-12-6. Ouro Preto
371-12-12
Figure 74. Infected cells/counted cells of ex vivo culture
of the strain 371-12-12. Ouro Preto
385-12-12
Figure 75. Infected cells/counted cells of ex vivo
culture of the strain 385-12-12. Ouro Preto

Analysis and modelling of Trypanosomatidae family in vitro and ex vivo cultures. 2. Experimental work Chagas disease and Leishmaniasis
57
The second measurement with the ex vivo culture done by Claudia Martins Carneiro at the School of Pharmacy of the Ouro Preto Federal University of Brazil was the number of amastigotes out of the number of infected cells. Those results are shown in Figures 76, 77, 78, 79, 80, 81, 82, 83, 84, and 85. The tables with the numbers are in the Appendix C.
Be- 62
Figure 76. Number of amastigotes/infected cells of ex
vivo culture of the strain Be-62. Ouro Preto
Be-78
Figure 77. Number of amastigotes/infected cells of ex
vivo culture of the strain Be-78. Ouro Preto
375-12-3
Figure 78. Number of amastigotes/infected cells of ex
vivo culture of the strain 375-12-3. Ouro Preto
371-12-3
Figure 79. Number of amastigotes/infected cells of ex
vivo culture of the strain 371-12-3. Ouro Preto
371-12-6
Figure 80. Number of amastigotes/infected cells of ex
vivo culture of the strain 371-12-6. Ouro Preto
372-12-6
Figure 81. Number of amastigotes/infected cells of ex
vivo culture of the strain 372-12-6. Ouro Preto

Analysis and modelling of Trypanosomatidae family in vitro and ex vivo cultures. 2. Experimental work Chagas disease and Leishmaniasis
58
375-12-6
Figure 82. Number of amastigotes/infected cells of ex
vivo culture of the strain 375-12-6. Ouro Preto
385-12-6
Figure 83. Number of amastigotes/infected cells of ex
vivo culture of the strain 385-12-6. Ouro Preto
371-12-12
Figure 84. Number of amastigotes/infected cells of ex
vivo culture of the strain 371-12-12. Ouro Preto
385-12-12
Figure 85. Number of amastigotes/infected cells of ex
vivo culture of the strain 385-12-12. Ouro Preto

Analysis and modelling of Trypanosomatidae family in vitro and ex vivo cultures. 2. Experimental work Chagas disease and Leishmaniasis
59
2.2.3 Analysis of the results
In order to analyse and understand the behaviour of the ex vivo cultures of Claudia Martins Carneiro, we draw two graphics with the average of the different strains results.
The Figure 86 depicts the results of the infected cells out of the counted cells of all the strains and their average. In the same way that section “2.2.2. Results”, the results are represented in a scale from 0 to 1.
Figure 86. All the infected cells/counted cells of the ex vivo cultures and the average. Ouro Preto
The average denotes a slightl increment of the number of infected cells out of the number of counted cells to the extent that the hours draw on.

Analysis and modelling of Trypanosomatidae family in vitro and ex vivo cultures. 2. Experimental work Chagas disease and Leishmaniasis
60
The Figure 87 depicts the results of the number of amastigotes out of the infected cells of all the strains and their average.
Figure 87. All the numbers of amastigotes/infected cells of the ex vivo cultures and the average. Ouro Preto
The average denote that at 48h the number of amastigotes per infected cells is quietly higher than at 24h and shortly higher than at 72h.
With all this experimental work, there are 4 parameters in ex vivo cultures that we would like to deduce in order to deeply understand the interaction between the protozoa and the eukaryotic cells:
− The infection probability of a trypomastigote to an eukaryotic cell. − The transformation time from a trypomastigote to an amastigote. − The duplication time of an amastigote. − The maximum number of amastigotes that causes the differentiation of amastigote to
trypomastigote and the lysis of the cell.
Those parameters are difficult to obtain experimentally, further thinking about the real system we can notice that it is a complex system with a complex interaction between the protozoa and the cells. However from the experimental results obtained we can take out the infection probability.

Analysis and modelling of Trypanosomatidae family in vitro and ex vivo cultures. 2. Experimental work Chagas disease and Leishmaniasis
61
The infection process was done (as is explained in “2.2.1. Materials and methods”) with 10 trypomastigotes every 1 eukaryotic cell and as it can be observed at the Figure 82, the average number of infected cells out of the counted cells at 24h is 24. Therefore, the infection probability is:
𝑃𝑃 inf = 𝑑𝑑𝑖𝑖
𝑑𝑑𝑡𝑡 · 𝑑𝑑𝑐𝑐=
24100 · 10
= 0′0024 → 0′24%
This is a very low infection probability.
Also, the average number of amastigotes that are inside the infected cells at 24h is rather low, 1’82, this may indicate one hypothesis: if the number of amastigotes inside the cells is quite low, the amounts of trypomastigotes that have penetrated to the cells are also low. Hence, there may be a change in the membrane composition that does not allow the other trypomastigotes to penetrate.
Otherwise, the complete growing cycle of the amastigotes may be larger than 72h. We hypothesize that because if the life cycle would be shorter than 72h we ought to observe oscillations in their behaviour. What is more, the duplication time of the amastigotes may be higher than 20h because the average numbers of amastigotes is 1’82 at 24h, 2’81 at 48h and 2’51 at 72h.

Analysis and modelling of Trypanosomatidae family in vitro and ex vivo cultures. 3. Models development Chagas disease and Leishmaniasis
62
3. Models development
3.1 Continuous model of in vitro culture
In order to understand the observed behaviour, we aim to develop a mathematical model partially empiric partially mechanistic. It will be empiric because we will impose two linear growths (the latent phase and the growing phase). And it will also be mechanistic because in a simple way we will impose the oxygen’s behaviour and its consequences against the population (growth and mortality).
In many bibliography (Nepomuceno-Mejía et al., 2010), (Hernández et al., 2012) the growth of the epimastigotes is considered exponential. If we consider this growing behaviour, the differential equation that depicts it would be this:
𝑑𝑑𝑑𝑑𝑑𝑑𝑑𝑑
= 𝜇𝜇 𝑑𝑑
𝜇𝜇: Is defined as the specific growth rate.
𝜇𝜇 =1𝑑𝑑
𝑑𝑑𝑑𝑑𝑑𝑑𝑑𝑑
So, considering 𝜇𝜇 as a constant, we could observe an exponential growing behaviour:
𝑑𝑑 = 𝑑𝑑0 𝑒𝑒𝜇𝜇 𝑡𝑡
But epimastigotes do not grow as an exponential equation. This is due to the interaction between the cells. Therefore the specific growth rate cannot be considered a constant, whereas it decreases when the protozoa’ concentration increases. Mathematically this cells interaction is:
𝜇𝜇 =𝜇𝜇0𝑑𝑑
Therefore the differential equation changes this way:
𝜇𝜇0𝑑𝑑
=1𝑑𝑑
𝑑𝑑𝑑𝑑𝑑𝑑𝑑𝑑
𝜇𝜇0 = 𝑑𝑑𝑑𝑑𝑑𝑑𝑑𝑑
Finally obtaining this linear expression:
𝑵𝑵 = 𝑵𝑵𝟎𝟎 + 𝝁𝝁𝟎𝟎 𝒕𝒕
Now, mathematically we understand that in order to explain the observed behaviour the model which describes the growth is a linear model. But matching up the mathematic

Analysis and modelling of Trypanosomatidae family in vitro and ex vivo cultures. 3. Models development Chagas disease and Leishmaniasis
63
evidence with the biology of the protozoa it may be some synthesised molecule that inhibits the growth.
We can similarly observe that the growth is limited (in some point the growing curve starts to decrease) because of some factor. From some measurements done in the Department of Health Microbiology and Parasitology of the Universitat de Barcelona lab (not included in this bachelor thesis) we have supposed that this factor is the oxygen. Graterol et al, (2012) did an experiment with two cultures with different height; one was three times higher than the other. They figured out that the growth of Trypanosoma cruzi epimastigotes is inversely proportional to the culture height due to the lack or excess of oxygen.
The final phase is characterized for reaching different stable values in the samples. We hypothesize that those difference is due to the variations on the oxygen flux. If the diffusion of the oxygen between the medium and the environment is high, the final values will be higher. Whereas, if the diffusion between the environment and the medium is not such high, the final values will be lower. Besides, the completely mortality in some cultures could be explained by those lack of oxygen in the culture.
Consequently, taking into account those hypotheses, we define a first model of the Trypanosoma cruzi growth. The mortality relies on the oxygen concentration, but pursuing the law of parsimony we build a simpler model which assumes that the oxygen consumption by the cells is constant. This is a simplification, because the oxygen consumption should be different if there is a growing phase cell or a decreasing phase cell and the oxygen flow should depend on the gradient concentration.
Thus, in the model we will consider two variables N and O.
𝑑𝑑: Cells number 𝑂𝑂: Oxygen concentration To describe the behaviour between the cells and with the oxygen, we consider 5 parameters: 𝑎𝑎: Linear growing velocity of the culture during the latent phase 𝑏𝑏: Linear growing velocity of the culture 𝑐𝑐: Mortality velocity of the cells in no oxygen conditions Ү: Velocity of the oxygen consumption by the cells 𝑒𝑒: Oxygen entrance by diffusion from the external medium So the equations that describe the latent phase are:
𝑑𝑑𝑑𝑑𝑑𝑑𝑡𝑡
= 𝑎𝑎 𝑑𝑑𝑑𝑑𝑑𝑑𝑡𝑡
= −Ү 𝑑𝑑 +𝑒𝑒 when e= 0 if 𝑂𝑂 > 𝑂𝑂𝑠𝑠 As well as the equations that describe the growing phase are:

Analysis and modelling of Trypanosomatidae family in vitro and ex vivo cultures. 3. Models development Chagas disease and Leishmaniasis
64
𝑑𝑑𝑑𝑑𝑑𝑑𝑡𝑡
= 𝑏𝑏 − 𝑐𝑐 𝑑𝑑 when 𝑏𝑏 = 0 if 𝑂𝑂 = 0
𝑐𝑐 = 0 if 𝑂𝑂 > 0
𝑑𝑑𝑑𝑑𝑑𝑑𝑡𝑡
= −Ү 𝑑𝑑 + 𝑒𝑒 when e= 0 if 𝑂𝑂 > 𝑂𝑂𝑠𝑠
𝑂𝑂𝑠𝑠 is the saturation concentration of the oxygen in the medium. It means that the diffusion of the oxygen will start when the oxygen concentration in the medium gets lower than the saturation concentration.
Hypothesizing that the oxygen concentration limits the growth, we may expect that the multiplication between the epimastigotes number and the time elapsed (the integral) from the beginning of the latent phase to beginning of the decrease phase, should be similar in all the samples. Showing then, the initial concentration of the oxygen in the culture. In this way:
𝑂𝑂𝑖𝑖𝑖𝑖𝑖𝑖𝑡𝑡𝑖𝑖𝑖𝑖𝑖𝑖 = 𝛼𝛼� 𝑑𝑑 ∆𝑑𝑑𝑡𝑡 𝑏𝑏𝑏𝑏𝑏𝑏𝑏𝑏𝑏𝑏𝑏𝑏 𝑡𝑡ℎ𝑏𝑏 𝑑𝑑𝑏𝑏𝑑𝑑𝑏𝑏𝑠𝑠𝑖𝑖𝑠𝑠𝑖𝑖𝑖𝑖𝑑𝑑 𝑝𝑝ℎ𝑖𝑖𝑠𝑠𝑏𝑏
𝑡𝑡=0
𝛼𝛼: Fixes the relation between the product 𝑑𝑑 ∆𝑑𝑑 units and the oxygen moles consumed.
The Table 2 and Figure 88 depict the result of the mentioned integral by the Ouro Preto strains.
Table 4. Integral of the whole growing phase of Trypanosoma cruzi strains. Ouro Preto
Samples Integral Be-62 3’284 Be-78 3’672
3 MAI 375/12 3’451 391/12 3’102
6 MAI
371/12 3’257 372/12 3’275 375/12 3’527 385/12 3’108
12 MAI 371/12 3’386 385/12 3’431

Analysis and modelling of Trypanosomatidae family in vitro and ex vivo cultures. 3. Models development Chagas disease and Leishmaniasis
65
Figure 88. Integral of the whole growing phase (latent phase + growing phase) of the Ouro Preto strains
Accordingly, if the abrupt fall of the protozoa’s growth is practically at the same growing moment in all the samples, we can deduce that this moment is due to the oxygen exhaustion. The hypothesis seems reasonable because the results of the integrals of the whole growing phase of all Ouro Preto experimental works are similar.
The latent phase that we consider in the growing curve corresponds to the adapting metabolic periods or individual growing periods of the parasites.
Therefore, with those hypotheses and the equations presented before we built a model for the epimastigotes growth. Figure 89 depicts the adjustment of the experimental results (circles) and the mathematical model (discontinuous line) of the strain 375-12-3 of Ouro Preto and the Table 4 shows the parameters that were used in order to build the model. This experimental-model adjust is correct and adequate adjust.

Analysis and modelling of Trypanosomatidae family in vitro and ex vivo cultures. 3. Models development Chagas disease and Leishmaniasis
66
Figure 89. Model and experimental results of the growing curve of the strain 375-12-3. Ouro Preto.
Table 5. Parameters and variables of Trypanosoma cruzi growing curve model
Parameters dt 0’05 𝑑𝑑0 1683333’33 𝑂𝑂0 310000000
Variables
a 1300000 b 10000000 c 0’65 d 1’01 e 5000000

Analysis and modelling of Trypanosomatidae family in vitro and ex vivo cultures. 3. Models development Chagas disease and Leishmaniasis
67
3.2 Individual-based model of ex vivo culture
The epimastigotes form of Trypanosoma cruzi and Leishmania spp. were modeled through a continuous model. However, the system composed by the trypomastigote and amastigote form of Trypanosoma cruzi and eukaryotic cells (described in the section “2.2.1 Materials and methods”) is more difficult to be modeled through continuous models. The most feasible way to model this dynamics is the Individual-based Model.
In order to describe an Individual-based Model the standard protocol used is ODD (Grimm et al., 2006). Nevertheless, in order to simplify and facilitate the communication we describe the model in a more schematic form. First, we present the flow chart of the model (Figure 90). The meanings of the subscripts and abbreviate words are in Table 6 (in the order that they appeared in the flow chart). Then we explain step by step the model and finally we show the Netlogo program created.
Figure 90. Flow charts of the model representing the ex vivo culture of Trypanosoma cruzi. The flow chart on the left is the general flow chart of the model. The flow chart on the top-right is the behaviour of each eukaryotic cell and
the flow chart on the bottom-right is the behaviour of each Trypanosoma cruzi.

Analysis and modelling of Trypanosomatidae family in vitro and ex vivo cultures. 3. Models development Chagas disease and Leishmaniasis
68
Table 6. Subscripts and abbreviations of the flow chart
Subscript or abbreviation Meaning
Ntrypincell Number of T. cruzi inside the cell Nmax Maximum number of T. cruzi that can be inside the cell before
it’s break tint Time that T. cruzi has been inside the cell trepr Time needed for T. cruzi to reproduce if it is inside the cell
t Time step tlatent Time needed for T. cruzi to differentiate from trypomastigote
to amastigote text Time that T. cruzi is in the medium
tdeath Time needed for T. cruzi to death if it has not infected any cell
The purpose of this model is to understand how Trypanosoma cruzi behaves in an ex vivo culture with eukaryotic cells. We aim to comprehend processes like the infection of the eukaryotic cells by the protozoans, the differentiation of trypomastigotes to amastigotes and the reproduction of the amastigotes.
This model is composed by two individuals: Eukaryotic cells and Trypanosoma cruzi. The protozoa start being trypomastigotes, so all of them are outside the cells at the beginning. Then they will or not infect the eukaryotic cells (based on a probability). If the trypomastigote does not infect an eukaryotic cell, it will be in the medium still it infects a cell or a fixed time passes and it dies. Otherwise, if the trypomastigote infect an eukaryotic cell, it gets differentiated to an amastigote being able to reproduce. After the time needed to be differentiated and the time needed to start reproducing, the amastigote reproduces by bipartition. The amastigotes will be reproducing until the number of protozoa inside the cell is higher than a fixed number, then the cell will lyse and the amastigotes will leave the cell and appear on the medium as tripomastigotes.
Therefore, the behavior of the eukaryotic cells is: they are onto the medium without moving. If they are not infected they remain equal. But if they are infected by a tripomastigote, they will remain equal till the number of amastigotes is superior to a maximum number fixed, then the cell will lyse and disappear from the medium.
Netlogo is an environment that allows the implementation of IbMs and simulation of the behavior of complex systems over time and space (two-dimensional or three-dimensional). It was designed to deal with mobile agents or individuals acting both in the same space and at the same time and a behavior dominated by local interactions over a period of time (Ginovart et al., 2011). We have implemented our model on this platform. The code of the program is in the Appendix D.

Analysis and modelling of Trypanosomatidae family in vitro and ex vivo cultures. 3. Models development Chagas disease and Leishmaniasis
69
The Figure 91 shows the interface of the program when it has been initialized.
Figure 91. Interface of the NetLogo program when this is just initialized
The parameters that can be modified from the interface are:
− Parameters related to T. cruzi
− Parameters related to the eukaryotic cells
Initial number of T. cruzi Probability of infection Time of the differentiation and the standard deviation Time to reproduce and the standard deviation Time to die if there is no infection and the standard deviation
Initial number of cells Maximum diameter of the cells and the standard deviation Distance between the cells and the standard deviation Maximum number of amastigotes inside and the standard deviation

Analysis and modelling of Trypanosomatidae family in vitro and ex vivo cultures. 3. Models development Chagas disease and Leishmaniasis
70
The Figure 92 shows the interface of the program when the program has run for 72 time steps (we wanted to make it work for 72 time steps because we consider each time step as one hour, and 3 days of simulation was enough to compare the data of the experimental work and the simulation).
Figure 92. Interface of the NetLogo program when is finished (after 72 time steps)
The simulation pulls out different output data in numbers or graphics. Each time step the number data changes on the interface (so after 72 time steps we only observe one number data). However the graphic depicts all the variations over the time and the program also allows to output all the number data to an Excel sheet.
The number data obtained is:
− Number of infected cells − Percentage of infected cells − Number of cells that are not infected − Number of trypomastigotes − Number of amastigotes − Amastigotes/cell
The graphic data obtained is:
− Number of eukaryotic cells − Number of infected cells − Percentage of infected cells − Number of Trypanosoma cruzis − Number of amastigotes − Amastigotes/cell

Analysis and modelling of Trypanosomatidae family in vitro and ex vivo cultures. 3. Models development Chagas disease and Leishmaniasis
71
We have developed and implemented an Individual-based Model. From this point on, in order to carry on understanding the ex vivo system presented, is necessary to parameterize the model. So as to do it, we should do a bibliographic work on the biologic cycle of the amastigote form of Trypanosoma cruzi and achieve the values of the parameters mentioned in the section “2.2.3 Analysis of the results” (The infection probability of a trypomastigote to an eukaryotic cell, the transformation time from a trypomastigote to an amastigote, the duplication time from an amastigote and the maximum number of amastigotes that causes the differentiation of amastigote to trypomastigote and the lysis of the cell). Maybe all those parameters are not figured out yet, so probably new specific experimental will have to be done in order to achieve those parameters.
This future research that combines experimental and modelling work will be meaningful to turn up with physical, chemical and biological data that may be important to understand the behaviour of Trypanosoma cruzi in human tissues where the cells can regenerate. In this way, the comprehension of the protozoa’s behaviour will go one step further.

Analysis and modelling of Trypanosomatidae family in vitro and ex vivo cultures. 4. Conclusions Chagas disease and Leishmaniasis
72
4. Conclusions
From in vitro epimastigotes cultures of different strains of Trypanosoma cruzi and Leishmania spp. we have observed that there are mainly two factors that determine the kinetics of the culture (objective 1). Firstly, the oxygen is the limiting substance in an in vitro culture. We obtained the datum of the initial oxygen concentration quantity. With this known value we can fix the parameter of oxygen concentration in an experimental work. Therefore, other unknown variables can be evaluated with less uncertainty. This elimination of the initial oxygen concentration uncertainty could help to compare the effect of different drugs against Trypanosoma cruzi. Secondly, being the epimastigotes the parasite forms that live in the vector is reasonable to think about the existence of mechanisms to control the population and facilitate the co-existence between the guest and the parasite. The results suggest that there may be some molecule secreted to the medium that inhibits the growing of the protozoa population itself. If this substance were experimentally figured out, it will probably have pharmacological interest.
From the mentioned deductions, we described mathematically and developed a continuous model of the in vitro epimastigotes cultures (objectives 2 and 3).
We have developed a technique to process the images from in vitro cultures that will allow us to develop an Individual-based Model based on the epimastigotes morphology that will help to better understand the behaviour of Trypanosoma cruzi and other Trypanosomatidae protozoa (objective 4). The main objective of this future model is to correlate the morphologic changes of the protozoa with the different phases of the culture.
We have developed an Individual-based Model of ex vivo amastigotes culture of Trypanosoma cruzi that will help to progress the understanding of the cultures behaviour (objective 5).
With all these progresses we have achieved the general objective of this bachelor thesis, which was a better understanding of Trypanosoma cruzi behaviour in in vitro and ex vivo cultures.
Once and for all, as a general conclusion of this work, it has been demonstrated the interest, importance and necessity of using mathematical models in order to understand Chagas disease and Leishmania. Accordingly, there is an obvious necessity of coordinating experimental work and modelling.

Analysis and modelling of Trypanosomatidae family in vitro and ex vivo cultures. 5. Perspectives Chagas disease and Leishmaniasis
73
5. Perspectives
The research presented in this bachelor thesis was mainly done in collaboration with the research group Computational Biology and Complex Systems, the Department of Health Microbiology and Parasitology of the Universitat de Barcelona and the School of Pharmacy of the Ouro Preto Federal University, Brazil.
We have reached the specific objectives presented in section “1.6 Objectives” but in order to progress in the understanding of Chagas disease and Leishmaniasis and ultimately improve the quality life of humans and other mammals who suffer from the diseases, the research must go on.
After developing a continuous model of in vitro epimastigotes culture and figured out that there is some metabolic substance secreted that inhibits the growing of the epimastigotes, this substance must be looked for.
After developing an image analysis technique to obtain the morphologic characteristics of an in vitro culture, this technique should be improved and the data obtained processed for building an Individual-based Model of those culture.
After developing and Individual-based Model of ex vivo amastigotes culture, we have to parameterize it in order to progress in the understanding of the behaviour of the protozoa in the cells. Once the behaviour in a cell will be known, in vivo cultures should be studied. Trypanosoma cruzi in those cultures have a more similar behaviour than in humans.
In the next steps of the research, we will collaborate with a medical microbiologist team and physicians specialists in tropical medicine and international health. This second group is studying the efficacy of two drugs that now are available for Chagas disease. Those drugs are Benznidazol and Nifurtimox and both have unfavourable effects. Therefore, they are investigating methods to apply them or variations in the drugs that do not have those unfavourable effects.
It is important to keep investigating and make aware the population of the Northern countries about those neglected diseases that affect such a big number of people because we are all humans, regardless of where are we from or which our economic, social or cultural situation is. As it is performed in the scene “the Jewish woman” from the theatre play “Terror and misery from the Third Reich “of Bertolt Brecht, we cannot cover our eyes to the misfortune of the others just because it is not ours.

Analysis and modelling of Trypanosomatidae family in vitro and ex vivo cultures. Bibliography Chagas disease and Leishmaniasis
74
Bibliography
Campos-Neto A, Lima FW, Andrade AF. Purification of tissue forms (Amastigotes) of Trypanosoma cruzi by immunoaffinity chromatography. J Protozool. 1985;32:8–84.
Aguilar-Garcia JJ, Dominguez-Pérez a D, Nacarino-Mejías V, Iribarren-Marín M a. Chagas disease. Rev Clin Esp [Internet]. Elsevier Ltd; 2010;210(9723):e25–7. Available from: http://dx.doi.org/10.1016/S0140-6736(10)60061-X
Cossy Isasi, G.J. Sibona y C.A. Condat. No Title. J Theor Biol. 2001;208:1–13.
Diaz RAM. Variabilidad intraespecifica en Trypanosoma cruzi y ensayos de nuevos metodos para el cribado farmacologico. Universidad complutense de Madrid; 1996. p. 217.
Ezquerra JPA. Las leishmaniasis: de la biologia al control. S.A. LI, editor. 2001.
Ferrer J, Prats C, López D, Vives-Rego J. Mathematical modelling methodologies in predictive food microbiology: A SWOT analysis. Int J Food Microbiol [Internet]. Elsevier B.V.; 2009;134(1-2):2–8. Available from: http://dx.doi.org/10.1016/j.ijfoodmicro.2009.01.016
Ginovart M, Portell X, Ferrer-closas P, Blanco M. Modelos basados en el individuo y la plataforma NetLogo. Rev Iberoam. 2011;131–50.
Gomes-Neves R, Duarte-Teodoro V. Enhancing Science and Mathematics Education with Computational Modelling. J Math Model Appl. 2010;1:2–15.
Graterol D, Arteaga RY, Navarro MC, Domínguez MI, Lima AR De. Artículo original El estadio amastigota precede la evolución del epimastigota durante la epimastigogénesis. 2013;72–9.
Grimm V. Ten years of individual-based modelling in ecology: What have we learned and what could we learn in the future? Ecol Modell. 1999;115:129–48.
Grimm V, Berger U, Bastiansen F, Eliassen S, Ginot V, Giske J, et al. A standard protocol for describing individual-based and agent-based models. Ecol Modell. 2006;198:115–26.
Haefner JW. Modeling Biological Systems. 1996.
Hide G. History of Sleeping Sickness in East Africa. Clin Microbiol Rev. 1999;112–25.
Hernández R, Cevallos AM, Nepomuceno-Mejía T, López-Villaseñor I. Stationary phase in Trypanosoma cruzi epimastigotes as a preadaptive stage for metacyclogenesis. Parasitol Res. 2012;2.
Analysis and modelling of Trypanosomatidae family in vitro and ex vivo cultures. Bibliography Chagas disease and Leishmaniasis
75
Ferrer J, Prats C, López D. Individual-based Modelling: An Essential Tool for Microbiology. J Biol Phys. 2008; 34:19–37.
Karplus WJ. The spectrum of mathematical models. Perspectives in Computing. 1983;3:4–13.
MediaWiki. ImageJ [Internet]. 2014 [cited 2015 Apr 1]. Available from: http://imagej.net
Nepomuceno-Mejía T, Lara-Martínez R, Cevallos AM, López-Villaseñor I, Jiménez-García LF, Hernández R. The Trypanosoma cruzi nucleolus: a morphometrical analysis of cultured epimastigotes in the exponential and stationary phases. FEMS Microbiology Letters [Internet]. 2010. p. 1–88. Available from: http://onlinelibrary.wiley.com/doi/10.1111/fml.2010.313.issue-1/issuetoc
Olsen OW. Animal Parasites: Their Life Cycles and Ecology. Dover Publications, editor. 1986.
Rabinovich JE, Rossell O. Mathematical Models and Ecology of Chagas Disease. PAHO American Trypanosomiasis Research, Vol. 318. 1976. p. 359–69.
WHO. Leishmaniasis [Internet]. Fact sheet No 375. 2015 [cited 2015 Apr 20]. p. 1. Available from: http://www.who.int/mediacentre/factsheets/fs375/en/
WHO. Chagas disease (American trypanosomiasis) [Internet]. Fact sheet No 340. 2015 [cited 2015 Apr 20]. p. 1. Available from: http://www.who.int/mediacentre/factsheets/fs340/en/

Appendix A. In vitro results

Analysis and modelling of Trypanosomatidae family in vitro and ex vivo cultures. Appendix A Chagas disease and Leishmaniasis
A1
BCN 858
Table A1. Data of the growing curve of the strain BCN 858, Trypanosoma cruzi. Universitat de Barcelona
BCN 858
Time (days)
Number of parasites x 106 /mL
0 0,5 1 1,3 2 1,95 5 5,4 6 6,1 8 11,7 9 20
12 39 14 54 16 60 20 52 22 50,6
Figure A1. Growing curve and bi-lineal growth of the strain 858, Trypanosoma cruzi. Universitat de Barcelona

Analysis and modelling of Trypanosomatidae family in vitro and ex vivo cultures. Appendix A Chagas disease and Leishmaniasis
A2
BCN 582
Table A2. Data of the growing curve of the strain BCN 582, Trypanosoma cruzi. Universitat de Barcelona
BCN 582
Time (days)
Number of parasites x 106 /mL
0 0,5 1 1,2 2 3,3 5 7,1 6 8,5 8 11,0 9 23,0
12 51,5 14 65,5 16 86,0 20 57,5 22 66,0
Figure A2. Growing curve and bi-lineal growth of the strain 582, Trypanosoma cruzi. Universitat de Barcelona

Analysis and modelling of Trypanosomatidae family in vitro and ex vivo cultures. Appendix A Chagas disease and Leishmaniasis
A3
BCN 590
Table A3. Data of the growing curve of the strain BCN 590, Trypanosoma cruzi. Universitat de Barcelona
BCN 590
Time (days)
Number of parasites x 106 /mL
0 0,5 1 2 2 4 5 17 6 18 8 30 9 26
12 36 14 63 16 61 20 60 22 59
Figure A3. Growing curve and bi-lineal growth of the strain 590, Trypanosoma cruzi. Universitat de Barcelona

Analysis and modelling of Trypanosomatidae family in vitro and ex vivo cultures. Appendix A Chagas disease and Leishmaniasis
A4
BCN 590 (2)
Table A4. Data of the growing curve of the strain BCN 590 (2), Trypanosoma cruzi. Universitat de Barcelona
BCN 590 (2)
Time (days)
Number of parasites x 106 /mL
1 1,35 3 8,2 6 16,2 9 18,35
13 28,8 16 28 19 27 22 33,83 28 30 30 41,83
Figure A4. Growing curve and bi-lineal growth of the strain 590 (2), Trypanosoma cruzi. Universitat de Barcelona

Analysis and modelling of Trypanosomatidae family in vitro and ex vivo cultures. Appendix A Chagas disease and Leishmaniasis
A5
Be-62
Table A5. Data of the growing curve of the strain Be-62, Trypanosoma cruzi. Ouro Preto
Be-62
Time (days) Number of parasites x 106 /mL Time (days) Number of
parasites x 106 /mL
1 1,67 11 21,00 2 4,03 12 6,83 3 6,90 13 3,33 4 10,87 14 2,58 5 20,33 15 3,08 6 32,50 16 2,17 7 46,83 17 1,17 8 55,25 18 2,00 9 84,33 19 2,00
10 65,67 20 1,92
Figure A5. Growing curve and bi-lineal growth of the strain Be-62, Trypanosoma cruzi. Ouro Preto

Analysis and modelling of Trypanosomatidae family in vitro and ex vivo cultures. Appendix A Chagas disease and Leishmaniasis
A6
Be-78
Table A6. Data of the growing curve of the strain Be-78, Trypanosoma cruzi. Ouro Preto
Be-78
Time (days) Number of parasites x 106/mL Time (days) Number of parasites
x 106 /mL
1 1,53 11 47,17 2 2,47 12 50,17 3 2,90 13 62,50 4 5,67 14 68,83 5 7,04 15 62,50 6 9,80 16 40,83 7 15,25 17 38,33 8 19,75 18 9,67 9 34,83 19 10,08
10 39,33 20 7,92
Figure A6. Growing curve and bi-lineal growth of the strain Be-78, Trypanosoma cruzi. Ouro Preto
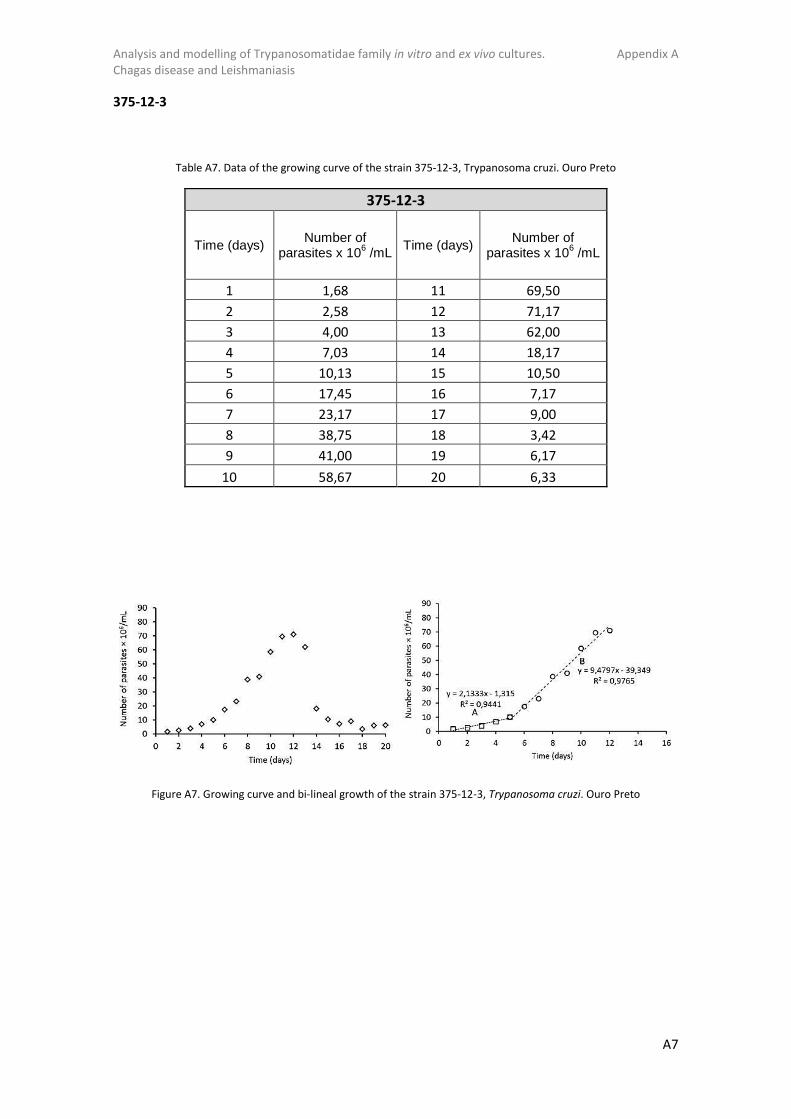
Analysis and modelling of Trypanosomatidae family in vitro and ex vivo cultures. Appendix A Chagas disease and Leishmaniasis
A7
375-12-3
Table A7. Data of the growing curve of the strain 375-12-3, Trypanosoma cruzi. Ouro Preto
375-12-3
Time (days) Number of parasites x 106 /mL Time (days) Number of
parasites x 106 /mL
1 1,68 11 69,50 2 2,58 12 71,17 3 4,00 13 62,00 4 7,03 14 18,17 5 10,13 15 10,50 6 17,45 16 7,17 7 23,17 17 9,00 8 38,75 18 3,42 9 41,00 19 6,17
10 58,67 20 6,33
Figure A7. Growing curve and bi-lineal growth of the strain 375-12-3, Trypanosoma cruzi. Ouro Preto

Analysis and modelling of Trypanosomatidae family in vitro and ex vivo cultures. Appendix A Chagas disease and Leishmaniasis
A8
375-12-6
Table A8. Data of the growing curve of the strain 375-12-6, Trypanosoma cruzi. Ouro Preto
375-12-6
Time (days) Number of parasites x 106 /mL Time (days) Number of
parasites x 106 /mL
1 0,98 11 33,50 2 1,77 12 40,67 3 2,45 13 58,33 4 4,57 14 5 5,13 15 64,17 6 6,50 16 45,83 7 12,00 17 44,33 8 13,63 18 28,42 9 20,33 19 21,00
10 30,33 20 6,50
Figure A8. Growing curve and bi-lineal growth of the strain 375-12-6, Trypanosoma cruzi. Ouro Preto

Analysis and modelling of Trypanosomatidae family in vitro and ex vivo cultures. Appendix A Chagas disease and Leishmaniasis
A9
371-12-6
Table A9. Data of the growing curve of the strain 371-12-6, Trypanosoma cruzi. Ouro Preto
371-12-6
Time (days) Number of parasites x 106 /mL Time (days) Number of
parasites x 106 /mL
1 1,02 11 39,50 2 2,07 12 49,17 3 2,35 13 57,50 4 3,97 14 63,17 5 7,63 15 56,67 6 8,75 16 36,17 7 11,08 17 21,00 8 21,00 18 22,33 9 23,33 19 21,25
10 35,17 20 24,67
Figure A9. Growing curve and bi-lineal growth of the strain 231-12-6, Trypanosoma cruzi. Ouro Preto

Analysis and modelling of Trypanosomatidae family in vitro and ex vivo cultures. Appendix A Chagas disease and Leishmaniasis
A10
371-12-12
Table A10. Data of the growing curve of the strain 371-12-12, Trypanosoma cruzi. Ouro Preto
371-12-12
Time (days) Number of parasites x 106 /mL Time (days) Number of
parasites x 106 /mL
1 1,12 11 24,83 2 1,78 12 36,00 3 2,25 13 38,17 4 4,07 14 39,17 5 3,67 15 40,17 6 5,55 16 39,50 7 9,83 17 39,83 8 13,75 18 28,33 9 20,50 19 32,25
10 21,33 20 29,17
Figure A10. Growing curve and bi-lineal growth of the strain 371-12-12, Trypanosoma cruzi. Ouro Preto

Analysis and modelling of Trypanosomatidae family in vitro and ex vivo cultures. Appendix A Chagas disease and Leishmaniasis
A11
372-12
Table A11. Data of the growing curve of the strain 372-12, Trypanosoma cruzi. Ouro Preto
372-12
Time (days) Number of parasites x 106 /mL Time (days) Number of
parasites x 106 /mL
1 1,38 11 37,17 2 1,77 12 48,67 3 3,08 13 51,67 4 5,57 14 60,33 5 6,17 15 58,67 6 11,55 16 53,33 7 15,92 17 28,67 8 21,25 18 17,25 9 28,50 19 23,00
10 34,50 20 24,08
Figure A11. Growing curve and bi-lineal growth of the strain 372-12, Trypanosoma cruzi. Ouro Preto

Analysis and modelling of Trypanosomatidae family in vitro and ex vivo cultures. Appendix A Chagas disease and Leishmaniasis
A12
385-12-6
Table A12. Data of the growing curve of the strain 385-12-6, Trypanosoma cruzi. Ouro Preto
385-12-6
Time (days) Number of parasites x 106 /mL Time (days) Number of parasites
x 106 /mL
1 1,63 11 32,38 2 2,22 12 40,17 3 3,68 13 52,33 4 4,27 14 45,17 5 6,38 15 41,67 6 11,40 16 32,00 7 13,50 17 19,83 8 20,25 18 10,67 9 32,25 19 2,75
10 45,17 20 2,25
Figure A12. Growing curve and bi-lineal growth of the strain 385-12-6, Trypanosoma cruzi. Ouro Preto

Analysis and modelling of Trypanosomatidae family in vitro and ex vivo cultures. Appendix A Chagas disease and Leishmaniasis
A13
385-12-12
Table A13. Data of the growing curve of the strain 385-12-12, Trypanosoma cruzi. Ouro Preto
385-12-12
Time (days) Number of parasites x 106 /mL Time (days) Number of
parasites x 106 /mL
1 1,45 11 37,17 2 2,15 12 46,00 3 3,15 13 48,33 4 5,27 14 39,33 5 7,38 15 43,83 6 10,40 16 26,67 7 13,67 17 29,17 8 21,00 18 21,25 9 25,17 19 16,25
10 38,83 20 10,67
Figure A13. Growing curve and bi-lineal growth of the strain 385-12-12, Trypanosoma cruzi. Ouro Preto

Analysis and modelling of Trypanosomatidae family in vitro and ex vivo cultures. Appendix A Chagas disease and Leishmaniasis
A14
391-12
Table A14. Data of the growing curve of the strain 391-12. Trypanosoma cruzi. Ouro Preto
391-12
Time (days) Number of
parasites x 10^6 /mL
Time (days) Number of parasites x 10^6 /mL
1 1,93 11 82,67 2 2,52 12 74,83 3 4,25 13 79,17 4 7,97 14 23,17 5 11,63 15 11,00 6 12,55 16 5,83 7 32,75 17 4,50 8 35,25 18 2,08 9 50,33 19 4,50
10 68,33 20 3,83
Figure A14. Growing curve and bi-lineal growth of the strain 391-12, Trypanosoma cruzi. Ouro Preto

Analysis and modelling of Trypanosomatidae family in vitro and ex vivo cultures. Appendix A Chagas disease and Leishmaniasis
A15
Bolivia strain
Table A15. Data of the growing curve of the Bolivia strain. Trypanosoma cruzi. Madrid
Bolivia strain
Time (days)
Number of parasites x 106 /mL
0 0,50 2 1,68 4 3,81 7 12,60 9 21,90
11 27,30 14 21,95 16 19,60 18 20,35 22 19,90
Figure A15. Growing curve and bi-lineal growth of the Bolivia strain, Trypanosoma cruzi. Madrid

Analysis and modelling of Trypanosomatidae family in vitro and ex vivo cultures. Appendix A Chagas disease and Leishmaniasis
A16
RAL strain
Table A16. Data of the growing curve of the RAL strain. Trypanosoma cruzi. Madrid
RAL strain
Time (days)
Number of parasites x 106 /mL
0 0,50 2 0,63 4 2,70 7 13,80 9 15,80
11 20,85 14 14,90 16 11,55 18 9,65 22 10,16
Figure A16. Growing curve and bi-lineal growth of the RAL strain, Trypanosoma cruzi. Madrid

Analysis and modelling of Trypanosomatidae family in vitro and ex vivo cultures. Appendix A Chagas disease and Leishmaniasis
A17
GM strain
Table A17. Data of the growing curve of the GM strain. Trypanosoma cruzi. Madrid
GM strain
Time (days)
Number of parasites x 106 /mL
0 0,50 2 2,03 4 6,38 7 14,15 9 16,95
11 19,45 14 20,30 16 22,50 18 18,90 22 16,85
Figure A17. Growing curve and bi-lineal growth of the GM strain, Trypanosoma cruzi. Madrid

Analysis and modelling of Trypanosomatidae family in vitro and ex vivo cultures. Appendix A Chagas disease and Leishmaniasis
A18
MC strain
Table A18. Data of the growing curve of the MC strain. Trypanosoma cruzi. Madrid
MC strain
Time (days)
Number of parasites x 106 /mL
0 0,50 2 0,75 4 3,95 7 18,65 9 23,90
11 21,11 14 16,40 16 14,60 18 13,30 22 14,70
Figure A18. Growing curve and bi-lineal growth of the MC strain, Trypanosoma cruzi. Madrid

Analysis and modelling of Trypanosomatidae family in vitro and ex vivo cultures. Appendix A Chagas disease and Leishmaniasis
A19
Y strain
Table A19. Data of the growing curve of the Y strain. Trypanosoma cruzi. Madrid
Y strain
Time (days)
Number of parasites x 106 /mL
0 0,50 2 0,77 4 4,10 7 12,05 9 22,95
11 26,45 14 17,65 16 17,55 18 14,80 22 16,20
Figure A19. Growing curve and bi-lineal growth of the Y strain, Trypanosoma cruzi. Madrid

Analysis and modelling of Trypanosomatidae family in vitro and ex vivo cultures. Appendix A Chagas disease and Leishmaniasis
A20
Tulahuén strain
Table A20. Data of the growing curve of the Tulahuén strain. Trypanosoma cruzi. Madrid
Tulahuén strain
Time (days)
Number of parasites x 106 /mL
0 0,50 2 1,84 4 3,60 7 11,00 9 14,83
11 24,38 14 18,10 16 16,55 18 18,20 22 17,90
Figure A20. Growing curve and bi-lineal growth of the Tulahuén strain, Trypanosoma cruzi. Madrid

Analysis and modelling of Trypanosomatidae family in vitro and ex vivo cultures. Appendix A Chagas disease and Leishmaniasis
A21
Leishmania braziliensis
Table A21. Data of the growing curve of Leishmania braziliensis. Universitat de Barcelona
Leishmania braziliensis
Time (days)
Number of parasites x 106 /mL
0 0,50 1 1,30 2 2,70 3 6,70 4 19,70 5 26,76 7 49,80
Figure A21. Growing curve and bi-lineal growth of the Leishmania braziliensis. Universitat de Barcelona

Analysis and modelling of Trypanosomatidae family in vitro and ex vivo cultures. Appendix A Chagas disease and Leishmaniasis
A22
Leishmania major
Table A22. Data of the growing curve of Leishmania major. Universitat de Barcelona
Leishmania major
Time (days)
Number of parasites x 106 /mL
0 0,50 1 1,70 2 3,60 3 15,80 4 55,70 5 72,00 7 87,75
Figure A22. Growing curve and bi-lineal growth of the Leishmania major. Universitat de Barcelona

Analysis and modelling of Trypanosomatidae family in vitro and ex vivo cultures. Appendix A Chagas disease and Leishmaniasis
A23
Leishmania Infantum
Table A23. Data of the growing curve of Leishmania infantum. Universitat de Barcelona
Leishmania Infantum
Time (days)
Number of parasites x 106 /mL
0 0,50 1 1,30 2 2,40 3 2,90 4 1,86 5 2,04 7 2,70
Figure A23. Growing curve and bi-lineal growth of the Leishmania infantum. Universitat de Barcelona

Appendix B. Pre-conditioning and image analysis of Trypanosoma
cruzi

Analysis and modelling of Trypanosomatidae family in vitro and ex vivo cultures. Appendix B Chagas disease and Leishmaniasis
B1
Pre-conditioning
In order to analyse the morphology of the protozoa with ImageJ, it is necessary to have contrasted and delimited shapes. Therefore, we aim to stand out the protozoa in front of the background. Moreover, it would be useful to process a model image from which all the other images will be automatic processed (assuming that all the images have been taken in the same conditions).
Therefore, the better process to pre-conditioning the images is:
Firstly, the image is opened with the Adobe Photoshop CC. We automatize the actions that the program does in order to be automatically reproduce the instructions: Window > Actions. And then use the option (registration) and start the conditioning process.
In the preconditioning phase, our main objective is to stand out the protozoa in front of the background in order to differentiate the protozoa and the background. So we will increase the saturation of the protozoa and decrease the background saturation in order to obtain a binary image.
To rise up the contrast of our image: Image > Adjusts > Brightness/Contrast (Figure B1).
Figure B1. Image of Trypanosoma cruzi culture with the contrast rose up
The background has to be decolorized and the protozoa enlighten. To realize it, the yellow’s saturation is reduced to zero and the magenta’s saturation is rose to the maximum: Image > Adjusts > Hue/Saturation (Figure B2).

Analysis and modelling of Trypanosomatidae family in vitro and ex vivo cultures. Appendix B Chagas disease and Leishmaniasis
B2
Figure B2. Image of Trypanosoma cruzi culture with the saturation reduced
Then the blue or the magenta needs to be changed in order to change the background colour. Hence, the arrows above the color bar are moved until the selection covers all the colors that were not selected before. Finally, the saturation is defined to 100 (Figure B3).
Figure B3. Image of Trypanosoma cruzi culture with the saturation up to 100
Now the protozoa are high coloured and our background is not, however we want the protozoa with black colour and the background with white colour: Selection > Color range. The window showed in the Figure B4 appears.

Analysis and modelling of Trypanosomatidae family in vitro and ex vivo cultures. Appendix B Chagas disease and Leishmaniasis
B3
Figure B4. Image of Trypanosoma cruzi culture transforming to binary
We select the grey scale on preview selection. Then we will see what is selected or not in the image, which is big enough to decide whether we are in the range of interest or not. Then, on the top menu, the sampled is selected. With Shift key pressed, different points of the background of our image are clicked in order to select all the background.
The selection can be improved: Selection > Modify > Round with 1 or 2 px value. We want our image in black and white, therefore new layers need to be painted. For the background: Layer > New > Layer > Paint Bucket (white). For the protozoa: Selection > Invert> New > Layer > Paint Bucket (black). Finally, Selection > Deselect. The final result of this conditioning, compared to the original file is represented in the Figure B5.
Figure B5. Image of Trypanosoma cruzi culture original and binary
The image is well-conditioned to be processed by ImageJ because the protozoa are distinguishable enough. In order to create an automated process, the button of the square on the actions window (stop) is pressed and the instructions named.
To condition the rest of the files: File > Automate > Batch, selecting the instruction just created.

Analysis and modelling of Trypanosomatidae family in vitro and ex vivo cultures. Appendix B Chagas disease and Leishmaniasis
B4
Analysis of the images
Once the pre-conditioning treatment has finished, the particles are well-contrasted and we are able to use ImageJ. Similarly as with Photoshop, this open-source program allows to record steps in a macro (a routine of steps that the program will reproduce automatically later).
Therefore, once the sample field is opened, the actions are recorded: Plugins > Macros > Record.
Then the results are metric systemize between pixels and meters or micrometers. Analyze > Set scale (Figure B6). The menu allows choosing a known distance in the desirable units and the equivalence in pixels.
Figure B6. Scales of the images
Before analyzing the protozoa, ImageJ needs the photography in binary mode. As the images are enough contrasted, ImageJ can automatically convert the images to binary images: Processes > Binary > Make binary. The command Processes > Binary > Close, closes possible holes on the protozoa and Processes > Binary > Fill holes fills the holes that are enclosed on black.
To analyze the image ImageJ offers multiple options of measures and after automatizes the measurement. If the measurements that interest are a few, they can be selected: Analyze > Set measurements (Figure B7).

Analysis and modelling of Trypanosomatidae family in vitro and ex vivo cultures. Appendix B Chagas disease and Leishmaniasis
B5
Figure B7. Different measurements to analyse the images
Finally: Analyze > Analyze protozoa. The range of areas that are considered from the protozoa can be defined in order to omit fake results. The command Clear results, deletes previous measurement and the command In situ Show > Overlay masks marks the protozoa that are considered and their assigned number.
The Figure B8 is the result of the process with the numbers and magenta colour to the selected protozoa: Image > Overlay > Labels.
Figure B8. Image of Trypanosoma cruzi culture with the measurements

Analysis and modelling of Trypanosomatidae family in vitro and ex vivo cultures. Appendix B Chagas disease and Leishmaniasis
B6
Not all the results are valid. In this case, the information of 3, 5, 6 and 8 protozoa are accurate. The instructions that have been recorded (the macro) is finished and saved: Recorder > Create > File > Save. The macro obtained in the described process is the depicted in the Figure B9.
Figure B9. Macro of the process to analyse the images
The data obtained is copied and pasted to a program like Microsoft Excel. In order to discard false positives, the results have to be checked manually.

Appendix C. Ex vivo results

Analysis and modelling of Trypanosomatidae family in vitro and ex vivo cultures. Appendix C Chagas disease and Leishmaniasis
C1
Table C1. Infected cells/counted cells of Trypanosoma cruzi amastigotes
Time (hours) Samples Average
Be- 62 24 0,44 0,18 0,12 0,25 48 0,67 0,32 0,53 0,51 72 0,46 0,38 0,34 0,39
Be-78 24 0,08 0,08 0,08 0,08 48 0,44 0,33 0,18 0,32 72 0,33 0,44 0,2 0,32
375-12-3 24 0,18 0,13 0,3 0,20 48 0,42 0,62 0,52 72 0,43 0,49 0,51 0,48
371-12-3 24 0,16 0,09 0,28 0,18 48 0,53 0,52 0,56 0,54 72 0,54 0,52 0,48 0,51
371-12-6 24 0,35 0,21 0,18 0,25 48 0,5 0,35 0,42 0,42 72 0,42 0,47 0,51 0,47
372-12-6 24 0,59 0,68 0,85 0,71 48 0,48 0,71 0,73 0,64 72 0,6 0,65 0,6 0,62
375-12-6 24 0,29 0,12 0,19 0,20 48 0,24 0,22 0,34 0,27 72 0,25 0,4 0,32 0,32
385-12-6 24 0,09 0,22 0,34 0,22 48 0,27 0,25 0,3 0,27 72 0,52 0,54 0,34 0,47
371-12-12 24 0,2 0,2 0,14 0,18 48 0,35 0,32 0,38 0,35 72 0,37 0,39 0,38 0,38
385-12-12 24 0,04 0,16 0,2 0,13 48 0,16 0,23 0,20 72 0,43 0,32 0,3 0,35
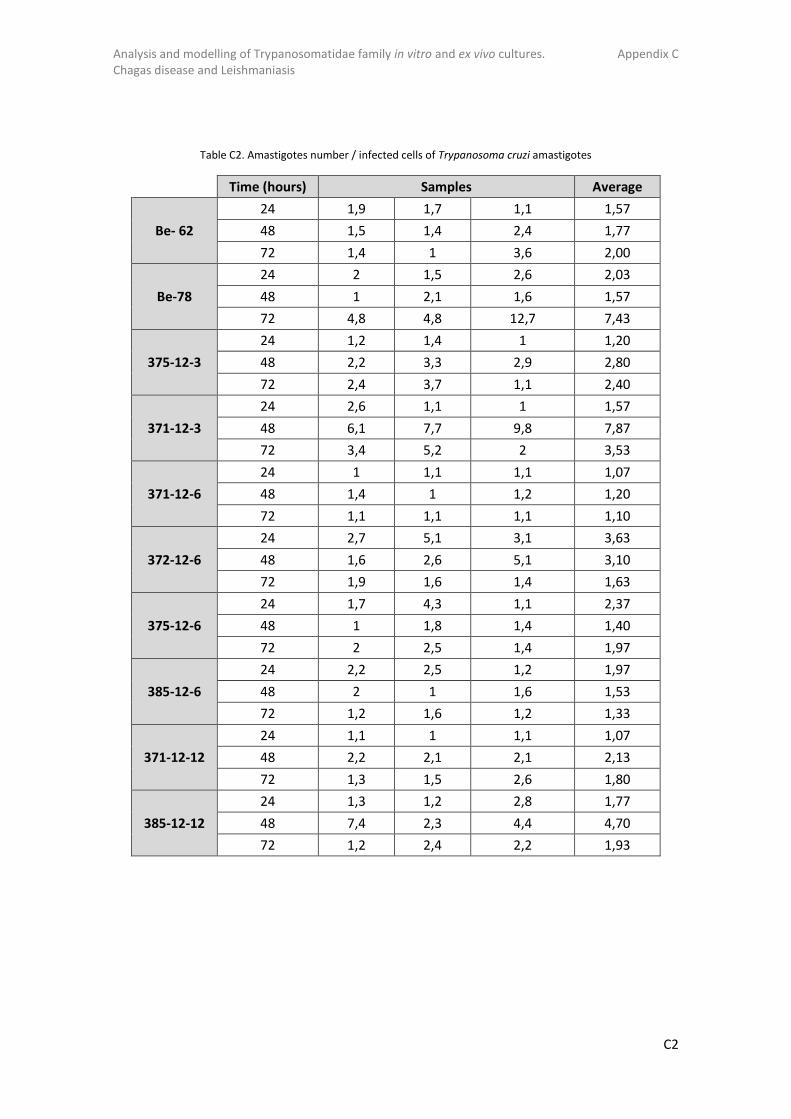
Analysis and modelling of Trypanosomatidae family in vitro and ex vivo cultures. Appendix C Chagas disease and Leishmaniasis
C2
Table C2. Amastigotes number / infected cells of Trypanosoma cruzi amastigotes
Time (hours) Samples Average
Be- 62 24 1,9 1,7 1,1 1,57 48 1,5 1,4 2,4 1,77 72 1,4 1 3,6 2,00
Be-78 24 2 1,5 2,6 2,03 48 1 2,1 1,6 1,57 72 4,8 4,8 12,7 7,43
375-12-3 24 1,2 1,4 1 1,20 48 2,2 3,3 2,9 2,80 72 2,4 3,7 1,1 2,40
371-12-3 24 2,6 1,1 1 1,57 48 6,1 7,7 9,8 7,87 72 3,4 5,2 2 3,53
371-12-6 24 1 1,1 1,1 1,07 48 1,4 1 1,2 1,20 72 1,1 1,1 1,1 1,10
372-12-6 24 2,7 5,1 3,1 3,63 48 1,6 2,6 5,1 3,10 72 1,9 1,6 1,4 1,63
375-12-6 24 1,7 4,3 1,1 2,37 48 1 1,8 1,4 1,40 72 2 2,5 1,4 1,97
385-12-6 24 2,2 2,5 1,2 1,97 48 2 1 1,6 1,53 72 1,2 1,6 1,2 1,33
371-12-12 24 1,1 1 1,1 1,07 48 2,2 2,1 2,1 2,13 72 1,3 1,5 2,6 1,80
385-12-12 24 1,3 1,2 2,8 1,77 48 7,4 2,3 4,4 4,70 72 1,2 2,4 2,2 1,93

Appendix D. NetLogo code program

Analysis and modelling of Trypanosomatidae family in vitro and ex vivo cultures. Appendix D Chagas disease and Leishmaniasis
D1
;; Eukaryotic cells breed [cells cell] ;; Properties: diàmeter, identifier index, amastigotes number if there is infection (= 0, no infection) cells-own [diacell classd numcell infect] ;; Trypanosoma cruzi breed [trypanosomacruzis trypanosomacruzi] ;; trypomastigote age, amastigote age, trypanosoma cruzi diameter, index of the cell that is infecting (= 0, is not infecting) trypanosomacruzis-own [age age1 diatrypo incell] ;; Global variables ;; number of cells, number of Trypanosoma cruzi, number of infected cells, number of trypanosoma cruzis infecting (amastigotes) globals [time ncells ntrypanosomacruzis ninfect ntrypanosomacruziinf ncdie ntrypanosomacruzidie ;; Auxiliar variables x1 y1 x2 y2 diam1 counts inc1 move] ;;........................START....................;; to setup clear-all ask patches [set pcolor one-of [119]] ;;........................ INITIAL CELLS......................;; ;; The forms of the cells is a circle set-default-shape cells "circle" ;; Index and counter are 0 set ncells 0 set counts 0 set ncdie 0 set ntrypanosomacruzidie 0 ;; We place the cells occupying their circular space ;; ncellini is located on the interface ;; The counter is arbitrary: if after n attempts the counter doesn't find free space, it let the placement of the cell pass ;; The value of the counter conditions a little bit the number of cells that are inhibit while [ (ncells < ncellini) and (counts < 100000) ] [
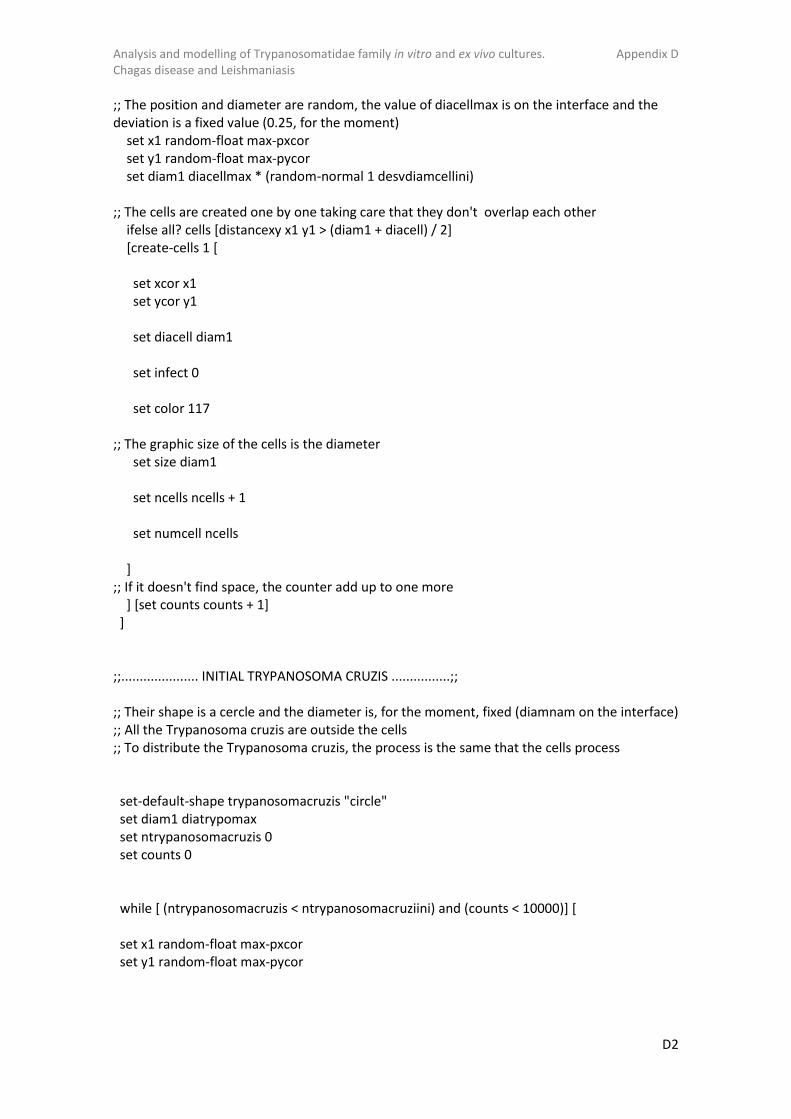
Analysis and modelling of Trypanosomatidae family in vitro and ex vivo cultures. Appendix D Chagas disease and Leishmaniasis
D2
;; The position and diameter are random, the value of diacellmax is on the interface and the deviation is a fixed value (0.25, for the moment) set x1 random-float max-pxcor set y1 random-float max-pycor set diam1 diacellmax * (random-normal 1 desvdiamcellini) ;; The cells are created one by one taking care that they don't overlap each other ifelse all? cells [distancexy x1 y1 > (diam1 + diacell) / 2] [create-cells 1 [ set xcor x1 set ycor y1 set diacell diam1 set infect 0 set color 117 ;; The graphic size of the cells is the diameter set size diam1 set ncells ncells + 1 set numcell ncells ] ;; If it doesn't find space, the counter add up to one more ] [set counts counts + 1] ] ;;..................... INITIAL TRYPANOSOMA CRUZIS ................;; ;; Their shape is a cercle and the diameter is, for the moment, fixed (diamnam on the interface) ;; All the Trypanosoma cruzis are outside the cells ;; To distribute the Trypanosoma cruzis, the process is the same that the cells process set-default-shape trypanosomacruzis "circle" set diam1 diatrypomax set ntrypanosomacruzis 0 set counts 0 while [ (ntrypanosomacruzis < ntrypanosomacruziini) and (counts < 10000)] [ set x1 random-float max-pxcor set y1 random-float max-pycor

Analysis and modelling of Trypanosomatidae family in vitro and ex vivo cultures. Appendix D Chagas disease and Leishmaniasis
D3
ifelse all? cells [distancexy x1 y1 > (diacell) / 2] [create-trypanosomacruzis 1 [ set xcor x1 set ycor y1 set diatrypo diam1 set color 115 set size diam1 set incell 0 set age 0 set age1 0 set ntrypanosomacruzis ntrypanosomacruzis + 1 ] ] [set counts counts + 1] ] set time 0 reset-ticks end ;;...........................TIME STEPS..............................;; to there-we-go set time time + dt ;;...Cells that break when they are infected by maxinfect (interface), for the moment with fixed noise.....;; ask cells [ if infect > maxinfect * (random-normal 1 desvmaxinfect) [let n1 numcell

Analysis and modelling of Trypanosomatidae family in vitro and ex vivo cultures. Appendix D Chagas disease and Leishmaniasis
D4
set ncdie ncdie + 1 ask trypanosomacruzis [if incell = n1 [ set color 115 set size diatrypo set incell 0 set age 0 set age1 0 ;; ask neighbors [ set pcolor brown ]] ] ] die] ] ;;........ Movement and infection of the eukaryotic cells by the tripomastigote form of Trypanosoma cruzi.........;; ;;....... Tripomastigotes that are infecting.......;; ask trypanosomacruzis with [incell > 0] [ set age1 age1 + 1 set age age + 1 let numc1 incell set diam1 diatrypo set move 0 set x1 xcor + (dist / 100) * (random-normal 0 desvdist) * dt set y1 ycor + (dist / 100) * (random-normal 0 desvdist) * dt ask cells with [numcell = numc1] [if distancexy x1 y1 >= diacell / 2 [set move 1 set x2 xcor set y2 ycor]] ifelse move = 0 [set xcor x1 set ycor y1] [facexy x2 y2 fd dist / 100] ;; if move = 0 [set xcor x1 set ycor y1] if (age >= tdelay * (random-normal 1 desvtdelay)) and (age1 >= trepro * (random-normal 1 desvtrepro)) [set age1 0 ask cells with [numcell = numc1] [set infect infect + 1] hatch 1 [rt random 360 fd diatrypo] ;; ask neighbors [ set pcolor green ] ] ] ;;....... Tripomastigotes that are not infecting.......;;

Analysis and modelling of Trypanosomatidae family in vitro and ex vivo cultures. Appendix D Chagas disease and Leishmaniasis
D5
ask trypanosomacruzis with [incell = 0][ set age age + 1 if age > tdie * (random-normal 1 desvtdie) [set ntrypanosomacruzidie ntrypanosomacruzidie + 1 die] set diam1 diatrypo set inc1 0 set x1 xcor + dist * (random-normal 0 desvdist) * dt set y1 ycor + dist * (random-normal 0 desvdist) * dt set move 1 ask cells [if distancexy x1 y1 < diacell / 2 ;; [set move 0 if (random-float 1 < probinf) [set move 0 if (random-float 1 < probinf) and infect = 0 [set inc1 numcell set infect infect + 1 set move 1 set x1 xcor set y1 ycor ]]] if move = 1 [set xcor x1 set ycor y1] if inc1 > 0 [set color 110 set age 0] ;; if inc1 > 0 [set color blue ask neighbors [ set pcolor green ]] set incell inc1 ] ;; set ncells count cells set ntrypanosomacruzis count trypanosomacruzis set ntrypanosomacruziinf count trypanosomacruzis with [incell > 0] set ninfect count cells with [infect > 0] if time = 73 [stop] ;; if (ntrypanosomacruzis = 0) or (ncells = 0) [stop] if time > 168 [stop] tick end