analysis: evidence from the barcelona local … · analysis: evidence from the barcelona local bus...
TRANSCRIPT

THE ROLE OF TRANSACTION COST ON MIXED DELIVERY ANALYSIS: EVIDENCE FROM THE BARCELONA LOCAL BUS SYSTEM
Germà Bel a and Jordi Rosell a
a Universitat de Barcelona, GiM-IREA
Abstract
Recent evidence on public-private cost production of local public services has become ambiguous, while in-house production has been maintained even a privatization process has taken place. The objective of this paper is to compare the public and private provision in a mixed delivery scheme, analyzing the role of ownership, competition and transaction costs on local public services delivery in the same jurisdictional area. Using a stochastic cost frontier, we compare Barcelona public-private urban bus lines. We obtain that private provision is more expensive than public, tender process do not reduce costs and the inclusion of the totality of transaction costs favors public provision. The results support the existence of relational contracting on mature competitive environments.
Keywords: costs, transaction costs, mixed delivery, local governments, JEL Codes: H0, H7, K00, L33
______________
Germà Bel. GiM-IREA, Department of Economic Policy. University of Barcelona, Barcelona (08034), Spain. [email protected] Av. Diagonal, 690. 08034 Barcelona (Spain) Tel: (+34)-934021946. Fax: (+34)-934024573 http://www.ub.edu/graap/beling.htm
Jordi Rosell. GiM-IREA, Department of Economic Policy. University of Barcelona. Barcelona (08034), Spain. [email protected] Av. Diagonal, 690. 08034 Barcelona (Spain). Tel: (+34)-934021946. Fax: (+34)-934024573

THE ROLE OF TRANSACTION COST ON MIXED DELIVERY ANAL YSIS: EVIDENCE FROM THE BARCELONA LOCAL BUS SYSTEM
1. INTRODUCTION
The developed countries governments have introduced competition in the organization
of public services. The eighties dichotomy between governments or markets is merely
being relegated for mixed models where it is intended to get the better of the public and
private sector. The public sector has the ability to order the private sector through
regulations. Beyond these regulations, competition between public and private
companies is a way to prevent the system from rusting over time. Private companies
have incentives to be competitive as the public company can move out of the market.
The public company has to seek efficiency, and thus workers awareness of the
importance of wage restraint. The regulator gets the monitoring of public company costs
as compared to the private, and avoids some anticompetitive behaviour by private
operators. At the end of the day, it is the consumer who benefits from this scheme.
Mixed delivery implies that a government divides her jurisdiction in several areas, and
pure public delivery is used in one or more areas while pure private production is used
in other district(s) within the same jurisdiction (Warner and Bel, 2008). The aim of this
paper is to compare a mixed delivery scheme and show what happens over time, when
competition for the market evolves. The role played by transaction cost on contracting
out has gained ground last years; thanks to transaction costs we can compare the cost of
planning and monitoring under different delivery structures.
The coexistence of the two worlds in the urban bus system of the Barcelona
metropolitan area shows us an interesting case to prove that. Using a stochastic cost
frontier we will demonstrate the firm efficiency related to the ownership, the

implications of the tender process, the role of the transaction cost and the optimality of
the regulatory scheme. Our mainly contribution is the cost comparison of a public-
private mixed delivery system in the same jurisdictional area. The Barcelona bus system
scheme is one of the unique cases of mixed delivery and also on urban bus. Several
studies make comparisons with different cities or countries with homogenizer’s
assumptions among regulators, but it is not our case. Comparing the same area and also
taking into count the role of transaction costs is an innovative way that has not been
done, according to our knowledge.
This paper is divided into five sections. In the first section, we outline the current state
of local public services, specially focusing on urban bus transit. In the second section,
we describe the regulator and the public and private firms on the Barcelona metro area.
In the third section, we describe the empirical strategy: the data and the used model.
Next section we comment the most important results and finally we conclude with some
policy implications.
2. LITERATURE REVIEW
2.1. Local public services
On local public services debate, ownership has been relegated by competition. Bel et al.
(2010) do not find cost savings resulting from private production; they point to
transaction costs and competition environment as a two important cost savings factors.
Domberger et al.(1986, 1987) found that in cases where public firms bid against private
contractors and won, the level of savings achieved was not significantly different from
that realized by private firms. If the public incumbent persistently under-performs
compared to private contractors, then competition is not effective. The existence of pure

public and pure private companies providing the service within one jurisdiction has
been called mixed delivery: regulators can compare firms’ production processes and
costs, while still retaining direct involvement in service delivery (Miranda and Lerner
1995). They argued that redundancy in delivery method could in fact be efficient, as a
form of benchmarking with the private sector, and a means to promote bureaucratic
competition in house. The rise in mixed forms of delivery reflects a continuing process
of change and innovation at the local government level that combines the market and
public delivery benefits (Warner and Hefetz, 2008). Private firms are interested in
profit, efficiency and control. The public sector is also interested in efficiency, but is
expected to provide failsafe delivery and ensure a higher level of public accountability
and involvement. Geographic zone can be a relevant factor to find more or less
competition for the market: moderate positive correlation between choice of delivery
form and level of competition on metro core areas is found (Girth et al., 2012). They
find also qualitative result on government “relational contracting” dynamics: regulators
tend to devote more time to helping with low performance, because they could lose the
only vendor available to provide the service. After all, this low competition implies an
increase of the transaction costs. Johnston and Girth (2012) offer insights into how
weak vendor competition affects contract management and overall contract
effectiveness. Local governments regulators tend to place more confidence in their
vendors’ faithfulness and honesty when there had been reputation prior to the
relationship, have strong community ties and perform their tasks well (Lamothe and
Lamothe, 2012).
Transaction costs are the other key issue on cost savings. Contracting out is not free of
charge; it generates transaction costs on private companies and on the regulator.
Contracting agencies can underestimate the cost of contracting because transaction costs

are often excluded on the analysis of public-private debate. Williamson (1991, 1999)
gave specific attention to transactions costs inside the public sector. First attempts to
classify local government services and assess the form of delivery using transaction
costs were carried by Stein (1990). Pursuing local government transaction costs, Brown
and Potoski (2005) focus on two transaction costs specific factors: asset specifity and
ease of measurement. However, they do not analyse costs of communication,
coordination or planning with the vendor, among others. On a previous study, Brown
and Potoski (2003) conduct a survey on 64 local services in the US at municipal and
county level, finding that transaction costs alone cannot account for why governments
select particular modes of delivery over others. For meterable services, they find that
local authorities are more likely to contract private firms that rely on direct service
provision. If these services are in a metropolitan area, is more likely to engage with
private firms relative to direct service provision. The role of transaction costs are not
sufficiently taken into account, as Croissant et al. (2013) conclude.
2.2. Local bus transportation system
When competition in the market is not possible, the best way to promote efficiency is to
encourage competition for the market (Laffont and Tirole, 1993). There is empirical
evidence that competitive tendering reduces cost, even when there are public
monopolies and private bus operators. Great Britain, specially London, Netherlands,
Sweden, Finland, United States and Australia are example of countries where the
tendering process has reduced the urban bus cost (Hensher and Wallis, 2005). But the
most transcendent result is that when the tendering second round takes place many years
after the first tendering process, they find an increase in the average in gross cost in the
majority of the countries. Not only after the second round of a tender process there are

not cost savings, but also there is certain quality deterioration (Mouwen and Rietveld,
2013). The lack of bidding parity at the time of recontracting can arises as an important
issue. Williamson (1976) argues that incumbents enjoy advantages over new entrants,
avoiding real competition in the new contract renewal.
The commercial bus market is imperfectly contestable (Mackie et al., 1995). Entry may
occur where the incumbent is inefficient, where the incumbent is efficient but weak
enough to be supplanted, or simply through incumbents’ over‐optimism. Incumbents
deter entry by tightly controlling costs and by not leaving profitable gaps in service.
Incumbents are better informed regarding assets, quality and demand features than
potential entrants. Besides, some authors accept that on the bus markets there are not
sunk costs, because it can be recovered through sale or alternative use if a service is
abandoned. For example, the employees must be transferred to the new winner. A study
based on local public services, operation and maintenance of bus system is classified as
an easy to measure service and high asset specificity (Brown and Potoski, 2005). It’s
easy of measurement is in the 27th position of 64 services, while asset specificity
increases, being in 39th position. Reducing bus asset specificity can be achieved by
dividing entire service area into several smaller before the contracting process. The
service of bus system is classified between a service delivery choice under monopoly
and/or low competition (Girth et al., 2012).
However, a loss in the number of bidder companies and a market concentration has
been described, for example in France (Yvrande-Billon, 2006), Sweden (Alexandersson,
Hultén and Fölster, 1998) and Norway (Mathisen and Solvoll, 2008), among others.
This situation is repeated in Italy, besides the incumbent operator wins the majority of
tender process (Boitani and Cambini, 2006). However, in Germany there is a renewal
rate of 74% and an average of more than 5 bidders per tender process (Beck and Walter,

2013). The relation between the buyer and the vendor evolves, and the dependence of
each part on each other increases. Putting this relationship to the tender process with
small number of bidders and incompleteness and complex contracts, may not be the best
solution when compared to negotiated performance-based contracts (Hensher and
Stanley, 2008).
There are no such studies controlling for competition before the actual century, and the
inexistence of them taking into account transaction costs. Leland and Smirnova (2009)
compare the evolution of efficiency and effectiveness on the US urban bus services.
They take as a reference Perry and Babitsky (1986). Both studies find that privately
owned and managed transit systems are no longer more efficient and effective providers
than government owned agencies. They point to a lack of competition among
contractors and transaction costs as factors. Also both studies find that general-purpose
governments that contract out services are still more efficient and effective than special-
purpose governments.
The evidence provided by stochastic frontier studies in favour of private sector delivery
should be weighed against the fact that almost none of these studies controls for the
degree of competition and the nature of government (De Borger et al., 2002). Recent
stochastic studies control for the existence of public and private companies and for the
level of comp, but none of them only focus on the same jurisdiction and take into
account the totality of transaction costs (Table 1). Other non-parametric or regional bus
studies, such as Fazioli, Filippini and Prioni (1993), found no relation between technical
efficiency and ownership among Italian urban transit firms. Filippini and Prioni (2003)
for Swiss bus lines have found a better performance of private operators. A Trans
European study finds that public firms are less productive that private ones, and partial
privatize firms are more productive than totally public (Boitani et al., 2013). Roy and

Yvrande-Billon (2007) find that private operators selected through competitive
tendering are more efficient than public. Using a stochastic production frontier for 135
urban transport networks, they find only marginal gains on technical efficiency from
regulatory changes that would consist in a shift to delegated management and high-
powered incentives regulatory contracts.
Table 1: Parametric urban bus studies comparing public-private firms
Autor Country and type of service
Are there tender process?
Impact of tender process
Is private production cheaper?
Economies of scale and density
Matas and Raymond
(1998)
Spain Urban
No - No clear evidence
Economies of density and U-shaped average cost function
Jørgensen et al.
(1997)
Norway Urban
Yes Yes No
evidence
U-shaped average cost
function
Gagnepain (1998)
Urban No - Do not check it
Do not check it
Fraquelli et al.
(2004)
Urban and interurban
No - Do not check it
Scale economies
Roy et al. (2007)
France Urban
Yes Yes, it reduces costs Decreasing returns to scale
Ottoz et al. (2009)
Piemonte (Italy)
Interurban and urban
Yes Do not check it
Yes Diseconomies of scale and
density
Scheffler et al.
(2013)
German Urban and interurban
Yes Yes, it reduces
cost
No evidence
Do not check it
There is an acceptance of economies of scale on regional bus transportation. When we
focus on urban bus there is a more tendency to a less economies of scale or non-
economies of scale. European urban bus studies as Fazioli et al. (1993), Filippini and
Prioni (1994), Fazioli et al. (2002) find increasing economies of scale. Some studies

find no economies of scale in the Barcelona metro (Matas and Raymond, 1998) and the
traditional u-shaped mean costs curve for company size, with constant economies of
scale on medium and large firms, as Berechman (1993) suggests. Also it is widely
accepted that urban bus transportation has economies of density; Matas and Raymond
find economies of density in Spain. Also Viton (1981) and aforementioned Europeans
studies find economies of density.
3. BARCELONA’S BUS SYSTEM
3.1. The regulator and the public and private companies
Public transport service provision in the Metropolitan Area of Barcelona has not
changed substantially over the last decades. The bus transport supply (and all public
transport supply except airport bus shuttle and touristic bus) has a fare integrated policy
since 2001. The local bus transportation in this metropolitan area is a mixed system in
which one public and several private firms supply the service in different areas under
the supervision of a regulator.
In Barcelona, two agencies with different responsibilities co-exist and work together.
This model is extended on most European cities: the one regulator (EMT) designs
routes and timetables, covers private firms deficits while ATM regulator sets fares for
all transport modes. The Entitat Metropolitana del Transport (EMT, henceforth) is the
regulator, which defines the characteristics of the service offered by the concessionaires,
establishes network routes, quality levels and organizes the tenders (Albalate et al.
2012). The exploitation regime of private companies is by franchise (in risk and

venture), by interested management contracts (tendering process) or profitable routes
(airport and touristic lines). The EMT provides the buses and the garages, and is the
owner of both. The EMT is not a newcomer in organizing tender process. On the
nineties it organizes the first tender process, besides being a management contractor
since decades ago. So, the contractual design has been evolved and information failures
have been reduced. The jurisdictional area of the regulator is the city of Barcelona and
surroundings municipalities.
The public company Transports Metropolitans de Barcelona (TMB, henceforth), owned
by the EMT, operates in Barcelona downtown and daily routes. TMB also operates
interurban routes between Barcelona and surroundings municipalities and urban
metropolitan municipalities routes. On 2012, TMB carried 174 million passengers.
Approximately, the number of carried passengers has not increased since the eighties,
due to some privatization lines and metro network expansion. Supply indicators also
remain stable during decades: on 2012 the offered places-km (millions) were 3,182,
while on 1989 were 3,050. Nowadays, TMB operates 106 lines. This public company
has not participated in any tender process in the Barcelona metropolitan area, but on
2011, the group formed by TMB and Vectalia has been awarded to operate the public
transport of the Perpignan Méditerranée metropolitan area. TMB enjoys freedom to
design and plan its services and is not subject to a concession contract with the EMT.
The private concessionaires connected the suburban areas with the downtown and also
operate surroundings municipalities routes. We are going to focus on competitive
contracts, because the contracts of risk and venture not present the same fares integrated
policy, they are not required to report data to the regulator and the majority of lines are
far from the city of Barcelona. These competitive contracts represent 81% of the total
passengers of the EMT (excluding TMB). The cost that the concessionaire assumes is

only the operational cost. The average concession length is five years, with a possibility
of an extension of three years as an average. The tender concessions follow a Net Cost
Contract scheme or Minimum Subsidy: the firms receive the difference between the
expected passenger’s revenues and the bidding cost. Private operators have far less
management autonomy than TMB.
3.2. The tender process
The strategy of putting different areas on tender has been applied in the Barcelona
metropolitan area during the nineties. The first tendering process took place on 1998,
and the latest process on 2013 (Table 2). In every process, between 1 and 5 companies
bid for the subsidize concession. The incumbent has never been removed by a new
entrant except the airport concession. In seven of eight contests, the incumbent has
never effort the lowest price. It only has happened in Hospitalet concession on 2001.
The financial proposal punctuation is between 25-30% of the total. Other aspects as
experience in the sector, expected demand or staff and equipment used are the other
important aspect. So, incumbents always obtain better punctuation in these aspects that
allow them to win the contest easily. This incumbent power has been described by
Williamson (1976). The author goes further and points out to the better knowledge of
communication channels, procedure routine or red tape of the incumbent as an
advantage.
Table 2: Bus tendering process on the Barcelona metropolitan area
Concession area
Tender date
Winner Number
of bidders
Winner lowest price?
Barcelonè 1998 Tusgsal 4 No Tusgsal, Autocares

s Nord Ravigo SL, UTE Urbaser-Alsa and
CTSA
2010 Tusgsal 1 -
Barcelonès Nord (Night)
1998 Tusgsal 4 No
2006 Tusgsal 3 No Tusgsal
UTE Martí Renom and TCC SA
L’Hospitalet de
Llobregat
2001 Rosanbus 5 Yes
Rosanbús, CTSA, TRAPSA,
UTE Alsa and UTE Sarbús
2011 Rosanbus 5 No
West Barcelona
1998 Soler Sauret
3 Yes
2008 Soler Sauret
- -
So, the majority of the private firms that offer the services operate under a tender
process and these areas are operated by a reduced number of companies. There is a
market concentration on some ownership groups. Figure 1 shows the temporal evolution
of cost per kilometer for several concessions. The line of the graph is shown with a dot
in the year when there is a tender process, being the following year when it enters into
force. We cannot know if the tender processes increase costs or keep them, but we can
rule out that these processes have led to a reduction in costs the years immediately
following the bidding process in the area of Barcelona. From Table 2, the Catalan
external audit institution analyses three concessions areas: Barcelonès Nord (daily and
nightly) and L’Hospitalet de Llobregat.

Figure 1 Temporal evolution of the cost per km by concession zone and tender years
3.2.1. Urban bus passenger transportation in Barcelonès Nord
Tusgsal is the company that performs the bus urban passenger transportation in
Barcelonès Nord. This company serves legally this area since January 1999, and its
contract has been extended by four years from January 2007. Previously the service was
provided through a management interest contract since the beginning of the nineties to
December 1998. The contract has been modified several times between 1999 and 2006:
32 modifications in lines and timetables, 4 general contract clauses modified and 2
operational cost clauses modification, among other. In 1999, Tusgsal operates 17 lines
in this zone with 6.6 million km ran. In 2008, the number of lines has increased to 30
and to 10.1 million ran km. The yearly net hours has increased an 80% in this
concession period. The Catalan external audit institution considers that after these
2
2.5
3
3.5
4
4.5
5
5.5
2002 2003 2004 2005 2006 2007 2008 2009 2010 2011 2012
Co
st p
er
km
(€
/km
)
Time (year)
Cost per km by concession zone and tender years
(inflation-adjusted)
TMB (public
firm)Tusgsal
Tusgsal
(Nightime)Rosanbús
Soler Sauret
Tender year

substantial changes, EMT should have opened a new bid in 2007, and not to extend the
contract.
3.2.2. Night bus urban passenger transportation in Barcelonès Nord
On November 1998 there was the first tendering process in Barcelonès Nord. It was the
most turbulent episode known in the EMT. First of all, TB union’s and opposition
parties denounced a report from the EMT that prohibited the public company TB enter
the contest. The EMT justified their position because the regulator was and is the owner
of the public company; TB managers would become part of the adjudication process as
members of the EMT. Second, the debate was open during the punctuation process.
Two of the four companies were disqualified for failure to meet the tender
specifications. The offered price weighted for 27% of the total points of the contest.
Tusgsal offered a higher price than its competitor, but the jury corrections applied,
giving a lower price to Tusgsal. The price difference and the other criteria were
extremely favourable to Tusgsal score, leading her to keep the award of the tender.
Despite being a different concession than the previous, is also operated by Tusgsal. The
initial contract was signed in September 2006 and his validity began in January 2007.
Between the firm and the beginning of this concession, the EMT approved extend lines
and five months after the entry into force of the concession, new variations in the
frequency and the extension of a line. The new situation implies a 36.4% increase on
expected ran kilometers. The public audit institution considers that these changes would
have involved a new bidding process.

3.2.3. Urban bus passenger transportation in Hospitalet de Llobregat and
surroundings municipalities
Rosanbús is the company that performs the bus urban passenger transportation in
Hospitalet de Llobregat and surrounding municipalities. This company serves legally
with a tender process this area since July 2002 (it has served the area for several
decades), and its contract has been extended by four years from July 2007. The contract
has been modified several times between 2002 and 2008: 16 modifications in lines and
timetables and 1 operational cost clauses modification, among other. In 2002, Rosanbús
operates 7 lines in this zone with 2.2 million km ran. In 2008, the number of lines has
increased to 10 and the ran km to 2.9 million. The yearly net hours has increased 32.6%
in this concession period. The Catalan external audit institution considers that after
these substantial changes, EMT should have opened a new bid in 2007, and not extends
the contract. Furthermore, EMT decided to create three new bus routes in Prat de
Llobregat and give them directly to Rosanbús. In 2012, there was a new bidding
process. Although Rosanbús did not do the lowest bid, thanks to the good reputation
and management experience, it won the contest again.
4. EMPIRICAL STRATEGY
4.1. Data
The dataset is an unbalanced panel for the period 2002-2012. The number of
observations is 377 and the number of companies 4; being one of them public (TMB)
and the other ones completely private. Data are provided by the public bus company
(TMB) and the regulator (EMT), which provides data from the private firms. The first
year after the fare integrated policy is 2002.

We choose private bus lines that connect Barcelona with nearby cities and urban lines in
surrounding cities. We avoid choosing lines that run along motorways or high capacity,
since the characteristics of these lines are not similar to those of the public company.
We choose all TMB lines that connect Barcelona with neighbouring cities and lines
within the municipality of Barcelona but far from Barcelona downtown. We exclude the
nightly routes because there are many differences daily routes: price of labour, average
speed, network length… On Figure 2 we represent our study area. The municipalities
are represented by polygons, being the largest of them Barcelona, with a length of 9 km
and a width of 8 km. The solid lines represent public bus routes and broken lines ones
operated by private concessionaires. The three companies operate in three geographic
areas: the northern is operated by Tusgsal, Soler i Sauret in the West and Rosanbus in
the south. An important point is that the different lines overlap over time, and even there
are different concession areas, they have similarities that allow us to compare it.
Figure 2. Public and private bus lines in our study area

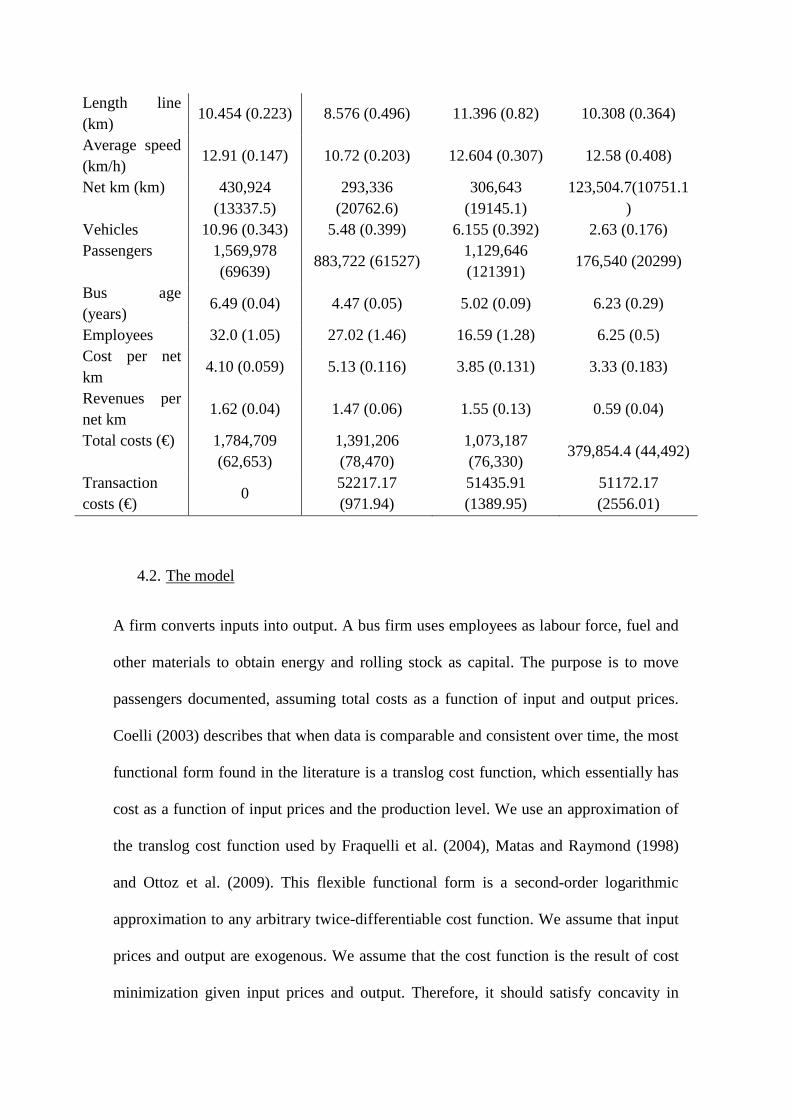
Table 3 reports some summary statistics about the concessionaire firms included in the
analysis. The available information includes per concession the number of analysed
lines, the length line, the number of vehicles, the number of employees and the cost and
revenue per net km, among others. The most important differences between concessions
on the descriptive statistics are on the number of analysed lines, the passengers carried,
the number of vehicles and the costs, total costs and cost per net km run. More than a
half of the analysed lines are public ones, while the others are distributed between the
three private companies. There is also a difference between the public and private
companies on the net km, the passengers carried and the kilometres run. Due to the
similarity on the length line, it is clear that TMB has a higher bus frequency than the
private companies, carrying more passengers. However, some private companies use
more workforce than TMB compared with the run kilometres, or TMB is more efficient
than the privates. Another difference is the age of the fleet, where the public company
has a rate of fleet renewal much lower than the main private operators. TMB has its own
purchasing policy, while the EMT pays the private bus fleet. Another difference is that
the number of employees is greater and significantly different in the public lines than in
private. There are clear differences on costs: the public company is the expensive firm
by line, but when we compare the total costs by net km, is not the most expensive. The
transaction costs are constant each year by private line. However, these cost can
represent between 3.5 and 14% of total costs.
Table 3: Mean (standard error) based on 377 bus lines observations (2002-2012)
Concessionaires TMB Tusgsal Rosanbus Soler Sauret Analysed lines 21 9.4 5.4 1.6
Length line (km)
10.454 (0.223) 8.576 (0.496) 11.396 (0.82) 10.308 (0.364)
Average speed (km/h)
12.91 (0.147) 10.72 (0.203) 12.604 (0.307) 12.58 (0.408)
Net km (km) 430,924 (13337.5)
293,336 (20762.6)
306,643 (19145.1)
123,504.7(10751.1)
Vehicles 10.96 (0.343) 5.48 (0.399) 6.155 (0.392) 2.63 (0.176) Passengers 1,569,978
(69639) 883,722 (61527)
1,129,646 (121391)
176,540 (20299)
Bus age (years)
6.49 (0.04) 4.47 (0.05) 5.02 (0.09) 6.23 (0.29)
Employees 32.0 (1.05) 27.02 (1.46) 16.59 (1.28) 6.25 (0.5) Cost per net km
4.10 (0.059) 5.13 (0.116) 3.85 (0.131) 3.33 (0.183)
Revenues per net km
1.62 (0.04) 1.47 (0.06) 1.55 (0.13) 0.59 (0.04)
Total costs (€) 1,784,709 (62,653)
1,391,206 (78,470)
1,073,187 (76,330)
379,854.4 (44,492)
Transaction costs (€)
0 52217.17 (971.94)
51435.91 (1389.95)
51172.17 (2556.01)
4.2. The model
A firm converts inputs into output. A bus firm uses employees as labour force, fuel and
other materials to obtain energy and rolling stock as capital. The purpose is to move
passengers documented, assuming total costs as a function of input and output prices.
Coelli (2003) describes that when data is comparable and consistent over time, the most
functional form found in the literature is a translog cost function, which essentially has
cost as a function of input prices and the production level. We use an approximation of
the translog cost function used by Fraquelli et al. (2004), Matas and Raymond (1998)
and Ottoz et al. (2009). This flexible functional form is a second-order logarithmic
approximation to any arbitrary twice-differentiable cost function. We assume that input
prices and output are exogenous. We assume that the cost function is the result of cost
minimization given input prices and output. Therefore, it should satisfy concavity in

input prices and monotonicity in input prices and output. The literature evidence
suggests that the following cost function is specified:
TC�� = �(��, � �� , ����, ����, ���, �)
Where the total cost of an urban bus firm TC is assumed to be a function of the output
Y, the factor prices P (labour L, material and energy M, and capital C), the network N
and the effect of time t. As a result, the cost function equation to be estimated can be
expressed in the following double log form:
ln ���� = �� + ������ + ������� + ��� ln ���� !
"��#(����)" +
!
"��#(�����)" +
!
"���#(ln ����)" + ������������ + �������� ln ���� + ��������� ln ���� +
��$ ln � �� + ��% ln ���� +!
"��$�$(ln � ��)" +
!
"��%�%(ln ����)" + ���$���� ln � �� +
���%���� ln ���� + ���$����� ln � �� + ���%����� ln ���� +����$ ln ���� ln � �� +
����% ln ���� ln ���� + ��$�% ln � �� ln ���� + ��&�'�(')_+',)�� +
�-.�)/0,�'�+�%-��1�2'33/1�� + �4%�5,)2'�1�,� + �67&�'�)1�� +
��789',)� + :�� + ;��
with / = 1, 2, … , 42,�(� = 2002, 2003, … , 2012
where subscripts i and t denote the line and year respectively. We can provide
estimators for two different specifications of;��. It follows a truncated-normal
distribution�B(C, D"). The simplest specification is when ;��. is uncorrelated with the
explanatory variables and is assumed to be constant over time. Also ;�~�B(C, DF") and
0��~�(0, DG"). This model assumes that the line-specific stochastic term ;� .So, the
inefficiency is time-invariant and the firm specific unobserved effects are due to
(2)
(1)

efficiency differences. The other specification is considering a time-variation
inefficiency, described by Battese and Coelli (1995),
;�� ≡ 'IJK−M(� − ��)N;�
Where �� is the last period in the /th panel, M is the decay parameter, ;�~�B(C, DF")
and 0��~�(0, DG"), and ;�� and 0�� are distributed independently of each other and the
covariates in the model. Linear homogeneity in input prices is imposed by dividing total
costs and input prices by material and energy price. We decide to include the tender
year to capture the impact of the contracted out process over time and ownership line’s
nature. On 2010, two new metro lines were opened, so we control this effect.
The actors with transaction costs are private firms and the regulator. Private companies
should devote part of their time to prepare a bid for the contest as well as monitoring
costs if they win the tender. The regulator must organize processes, as well as
monitoring private firms. When private companies bid for the concession, they charged
its transaction costs in their bid, while the regulator transaction costs is their budget.
Some papers take into account the transaction costs of private firms, but never regulator
transaction costs. If the regulator does not exist, and therefore private concessions,
TMB would also be responsible of these functions, implying an increase in costs as of
today assumed by the regulator. Thus, allocating regulator costs equally to all private
companies allows us a better comparison of the bus lines.
One consequence of the chosen model is the possibility of calculating the economies of
density, which are defined as the inverse of the elasticity of costs with respect to output,
holding all input prices and the network size fixed:
OP = 1
Q ln �Q ln
= 1
�� + ��# ln + ������ + �������� + ���$��� + ���%����
(3)

If the value of ED is greater than one, the economies of density exist: a less than
proportional increase in cost when the output increases while all the network
characteristics and input prices remain unchanged. An unitary value means that the
company is operating at the optimal output level given its network size.
4.3. Model variables
The cost function includes three inputs, one output and other variables.
��: The total cost is the dependent variable and include labour, fuel, maintenance, bus
fleet and other indirect costs. This total cost has to variants, whether we include the
totality of transaction costs or not. The transaction cost is the regulator total budget, and
we charge it equally to each line.
� : The price of labour is given by the ratio of total salary expenses to the total number
of worked hours. Private companies do not facilitate the entire number of workers, so
we use the worked hours as a price of labour instead of number of employees.
��: The price of material has been obtained by dividing fuel and maintenance material
costs by net kilometres.
��: The price of capital is given by the ratio of vehicles cost by the number of vehicles.
: The output variable is the vehicles·kilometres, as a supply-related measure. Seat-
kilometres would have been another good measure, but we do not have data for private
companies. Even demand-related indicators as number of passengers or passenger-km
could be more relevant and they do not ignore fully o empty buses, we choose supply-
related because they vary with inputs. The three inputs and output are expected to have
a positive sign.
�: As described by the literature, the length line is another network characteristic that
influence total costs.

��: Network speed represents a typical indicator that if a trip is covered by shorter time,
a lesser amount of vehicles and labour force is needed. Therefore, costs are expected to
lower with increasing network speed.
�'�(')+',): This dummy variable takes value 1 for the year after a tender process.
The new contracts come into force on January 1, even though the contest has been
celebrated the previous year.
�)/0,�': This binary variable takes value 1 if the line is operated by a private company
and 0 if it is operated by the public company TMB.
�1�2'33/1�,�(�/R'(;RR/'3: These dummies group the same concession bus
lines, having a total of four (TMB, Rosanbus, Tusgsal and Soler i Sauret). Moreover,
the time dummies aim to collect temporal effects of each year on all lines, having a total
of eleven.
5,)2'�1�,: This dummy variable takes value 1 if all the bus length line is inside the
municipality of Barcelona, and 0 otherwise. We try to control the effect of the city of
Barcelona on the cost function.
�'�)1: This dummy variable takes value 1 if the bus line is affected by the new metro
line opened on 2010, and 0 otherwise.
',): These dummy variables captures time effects.
5. RESULTS
We estimate the model by applying OLS to the equation X. For year dummies and
concession dummies, we take as a reference 2002 and Soler Sauret concession,
respectively. Since all variables are expressed in logarithms (except the dummies), the
coefficients can be interpreted as elasticities. The original values of monetary variables

are deflated by a price index. Table 4 presents the parameter estimates of the different
specification of the translog cost function not allowing time variant inefficiencies.
Table 4: Total-cost parameter estimates with time invariant inefficiency term
Significance levels: * 10 per cent; ** 5 per cent; *** 1 per cent.
(1) (2) (3) (4) (5) (6)
�� 0.632*** 0.460*** 0.601*** 0.429*** 0.581*** 0.394*** �� 0.189 -0.124 0.085 -0.054 0.200 0.180 ��� -1.056** -1.099*** -0.954** -0.945** -0.868** -0.826** ��$ 0.667** 0.546* 0.502 0.584* 0.410 0.497 ��% -0.471*** -0.433*** -0.448*** -0.441*** -0.435*** - 0.462***
�4%� 0.006 -0.025* 0.007 -0.02 �67& 0.014* 0.01 0.011 0.007
Tender year 0.014 -0.003 0.017* -0.001 Private 0.067*** 0.112*** Tusgsal 0.10*** 0.149***
Rosanbus 0.064*** 0.109*** Soler Sauret 0.024 0.069***
γ 0.873 0.875 0.986 0.728 0.986 0.971 Transaction
Costs No Yes No Yes No Yes
Log likelihood 722.41 723.64 738.97 746.91 748.76 756.08 Observations 377 377 377 377 377 377
The majority of the most important variable have the correct sign and are statistically
significant. Half of the specifications have been estimated with the dependent variable
total cost including transaction costs while the other half without. Thus, no significant
differences were found between using a dependent variable or another.
Output elasticity is between 0.632 and 0.394, implying that a 1% increase in the
supplied bus vehicle-kilometers will increase total cost only by 0.632-0.394%. The
network length is not statistically significant in any specification. A possible

multicolinearity problem between the output and the network length variables affects
the coefficient, as Ottoz et al. (2009) find and suggest. The average speed is negative
and always significant; our findings confirm that affects firms’ cost performance. Speed
up public policies might be desirable to be implemented by the government, because
passengers (and/or taxpayers) could pay less for the bus public transportation. The
labour input price is not statistically significant in all models, even for mean bus line the
coefficient varies across 41 and 67% of total costs, as literature points. The price of
capital coefficient is negative and highly significant. This is a controversial issue
derived from the generous government programs of subsidizing investments (Levaggi,
1994). The private firms do not minimize costs in the long term and therefore employs
too much capital.
The Barcelona control variable is not statistically significant on the majority of the
specifications. This implies inexistences of a biased sample selection or a local effect of
the Barcelona bus lines. The tender year is statistically significant and positive, or not
significant. These results confirms our empirical data that tenders process do not
diminish bus costs, moreover the cost increased due to the tender process can be
confirmed. The metro variable is only significant on specification 4; the new metro lines
imply a cost increase on several bus lines.
The private dummy and concession dummies can have a joint interpretation on the four
specifications: there are not cost savings on private production compared with the
public company. The public company is the cheapest one except on specification 5,
which the private company Soler Sauret costs are not different than TMB.
Table 5: Total-cost parameter estimates with time invariant inefficiency term
Significance levels: * 10 per cent; ** 5 per cent; *** 1 per cent.

(7) (8) (9) (10) (11) (12) �� 0.547*** 0.319*** 0.561*** 0.406*** 0.534*** 0.401*** �� 0.191 0.42* 0.118 0.059 0.178 0.164 ��� -1.364*** -1.448*** -1.299*** -1.008*** -1.214*** -0.922*** ��$ 0.554* 0.858*** 0.602** 0.506* 0.478* 0.486* ��% -0.641*** -0.715*** -0.636*** -0.57*** -0.658*** -0 .605***
�4%� 0.005 -0.024* 0.006 -0.018 �67& 0.002 0.009 -0.002 0.004
Tender year -0.016 -0.013 -0.018 -0.015 Private 0.003 0.080*** Tusgsal 0.045*** 0.115***
Rosanbus -0.007 0.07*** Soler Sauret -0.018 0.051***
2003 0.023*** 0.038*** 0.023*** 0.025*** 0.024*** 0.025*** 2004 0.032*** 0.048*** 0.032*** 0.032*** 0.033*** 0.032*** 2005 0.038*** 0.063*** 0.038*** 0.041*** 0.039*** 0.04*** 2006 0.039*** 0.061*** 0.039*** 0.033*** 0.039*** 0.032*** 2007 0.014* 0.029*** 0.014 0.008 0.013 0.007 2008 0.016* 0.042*** 0.016 0.011* 0.017* 0.011 2009 -0.011 -0.003 -0.011 -0.018 -0.010 -0.018** 2010 0.024*** 0.041*** 0.024** 0.01*** 0.027*** 0.011 2011 0.041*** 0.048*** 0.044*** 0.017*** 0.047*** 0.019* 2012 0.073*** 0.069*** 0.079** 0.034*** 0.084*** 0.038*** γ 0.848 0.879 0.907 0.666 0.987 0.965
Transaction Costs
No Yes No Yes No Yes
Log likelihood 794.34 776.11 798.5 797.09 810.9 808.79 Observations 377 377 377 377 377 377
On Table 5 we replicate the same specifications than in Table 4 but we add time control
variables. There are no such differences between the specifications in all variables. The
most significant is that the average speed is highly significant and its impact is over the
unit, the price of labour has gained significance and in specification 9 the private
dummy has lost its significance. The time trend is positive, indicating an increase in
cost, related or not to technological progress. There are three periods of time: from 2003

to 2006 and from 2010 to 2012 there is a cost increase over years, while the
intermediate period 2007-2009 the coefficients are not significant. This result does not
agree with the expected in development of technology regarding costs, one would
expect a cost decrease due to technology advance.
Table 6: Total-cost parameter estimates with time-varying inefficiency term
Significance levels: * 10 per cent; ** 5 per cent; *** 1 per cent.
(13) (14) (15) (16) (17) (18)
�� 0.619*** 0.483*** 0.576*** 0.526*** 0.596*** 0.513*** �� 0.554 -0.032 0.768** -0.012 -0.622 0.076 ��� -0.874** -0.962** -0.854** -0.821* -0.682** -0.718* ��$ 0.701** 0.552* 0.567* 0.594** 0.505** 0.551* ��% -0.439*** -0.425*** -0.436*** -0.447*** -0.428*** - 0.459***
�4%� 0.007 -0.011 0.008 -0.008 �67& 0.021*** 0.023*** 0.017** 0.014
Tender year 0.027*** 0.015 0.024** 0.008 Private 0.062*** 0.112*** Tusgsal 0.089** 0.154***
Rosanbus 0.07*** 0.117*** Soler Sauret 0.039** 0.09***
γ 0.968 0.857 0.988 0.821 0.94 0.82 M 0.038* 0.013** 0.087*** 0.154*** 0.091*** 0.162***
Transaction Costs
No Yes No Yes No Yes
Log likelihood 723.15 726.61 749.34 763.80 751.69 766.69 Observations 377 377 377 377 377 377
If the inefficiency is time variant, a bus line specific unobserved effect is not only
caused by a fixed effect, but also there is a time effect. Table 6 we estimate the same
specifications than in Table 4, but we use the Battese-Coelli model (1995) for a time
variant inefficiency. Comparing the estimates provided by the time invariant model in
and the time-varying model shows that these are different: parameter η is positive and

highly significant in all specifications; so firms tend to improve their level of technical
efficiency over time.
The estimated values in the time-varying model have hardly changed compared to the
time invariant model. The average speed variable has less impact and is less significant.
The Barcelona control variable is not significant in any specification, while the metro
variable is significant in specifications 15 and 16. The tender year is positive and highly
significant if we include the transaction costs, so there is empirical evidence that tender
process do not diminish cost or also it can increased it. The private and concessions
dummies are positive and significant; it is confirmed that all private companies are more
expensive than the public one.
Table 7 presents the estimated economies of scale and density for the median bus
operator for all specifications and for different concessions at the sample mean. The
results show increasing returns to density for all specifications and for all concessions
areas, meaning for the whole sample a less than proportional increase in cost when the
output (bus-kilometers) increases while all the network characteristics remain
unchanged. Reduction in costs could be achieved by increasing the density of the routes,
not by increasing the size of the company. There are not clearly differences between
concessions or public-private firms; even the inclusion of transaction costs implies
higher values. Reduction in unit cost could be achieved by increasing the density of the
routes and not by increasing the size of the concession area.
Table 7: Economies of density by specification (calculated at the sample mean)
Specification Economies of density
TMB Tusgsal Rosanbus Soler

Sauret 1 1.65
(0.294) 1.64
(0.287) 1.57
(0.307) 1.56
(0.259) 2 2.23
(0.509) 2.32
(0.537) 2.35
(0.550) 2.34
(0.561) 3 1.71
(0.255) 1.67
(0.241) 1.675
(0.244) 1.56
(0.214) 4 2.35
(0.482) 2.50
(0.550) 2.56
(0.581) 2.54
(0.583) 5 1.74
(0.258) 1.76
(0.264) 1.80
(0.28) 1.68
(0.243) 6 2.55
(0.560) 2.77
(0.667) 2.829
(0.707) 2.89
(0.751) 7 1.64
(0.244) 1.65
(0.249) 1.68
(0.255) 1.59
(0.231) 8 2.11
(0.434) 1.63
(0.252) 2.22
(0.488) 2.25
(0.510) 9 1.76
(0.247) 1.78
(0.253) 1.82
(0.277) 1.71
(0.235) 10 1.89
(0.292) 2.02
(0.335) 2.03
(0.341) 1.65
(0.221) 11 1.69
(0.229) 1.72
(0.236) 1.76
(0.248) 1.65
(0.220) 12 1.94
(0.310) 2.09
(0.374) 2.10
(0.370) 2.14
(0.389) 13 1.87
(0.264) 1.84
(0.256) 1.85
(0.261) 1.75
(0.234) 14 3.21
(0.900) 3.50
(1.116) 3.57
(1.184) 3.88
(1.550) 15 1.80
(0.261) 1.82
(0.267) 1.87
(0.281) 1.75
(0.247) 16 2.40
(0.06) 2.55
(0.07) 2.58
(0.08) 2.66
(0.09) 17 1.89
(0.264) 1.91
(0.268) 1.95
(0.284) 1.85
(0.254) 18 2.49
(0.460) 2.69
(0.549) 2.72
(0.567) 2.86
(0.638)
Throughout all empirical specifications it is repeated a set of results in our jurisdictional
area. First, private bus lines are more expensive than public ones, whether we include
all transaction costs or not in most specifications. In the specifications that we do not

include all transaction costs, we consider only the transaction costs of private firms,
while the costs of the regulator, also paid by citizens, are not taken into account. In the
specifications that we do not consider all transaction costs, private companies should
devote also part of their time negotiating with the regulator, being these costs
internalized, explaining perhaps why the majority of private lines are almost more
expensive than public ones. The ambiguous result of the literature on private property
achieving lower costs would be clarify when we include all transaction costs, increasing
private costs and being public provision cheaper. This increase reflects the cost paid by
the citizens to maintain the regulator, and allows a better comparison of the cost paid by
the citizen between a type of property or another. This result is not only the first to
compare costs of public and private companies in a scheme of mixed service, but
emphasizes that the public company can provide the service cheaper than a private firm
in a jurisdiction.
Second, we have no empirical evidence that competition achieved lower costs. Or the
contests do not involve changes in the costs or they increase it. Low market competition
implies that competition does not get to order the private incumbent, implying higher
costs over time. This low market competition is not linked to the number of bidders in
our case, but not aggressive price bidding is described on the tender process section.
The incumbent knows that does not need to make the most competitive offer, as the
price does not exceed 35% of the total score of the contest, and the regulator maintains
some discretion power. This relationship does not have to be a regulatory capture, but a
situation in which the transaction costs for the regulator with the incumbent are lower
than if an entrant would remain the market. Our study would be providing data to
Albalate et al. (2011), which concluded that the EMT is using his bargaining power to
complement a formal and relational contracting. This might not be an isolated case in

the city of Barcelona, but these behaviors may be appearing in places where competitive
tendering has been gaining ground (Yvrande-Billon, 2006) and also where the regulator
has gained enough experience.
6. CONCLUSIONS
In order to study the impact of a mixed delivery scheme under the presence of
transaction cost, the aim of this article is to evaluate the role of ownership, competition
and transaction cost on local public services’ total costs. Based on the Barcelona
metropolitan bus transportation, we estimated a translog stochastic cost frontier to shed
light on the mixed delivery scheme on local services.
The main results can be summarized as follows. First of all, the public firm performs
better than private operators selected through competitive tendering. The public
company can provide the service cheaper than the private companies; even we do not
take into account transaction costs that affect directly the private firms. We cannot
check if the poor performance of private operators affects TMB’s performance or not.
But the inclusion of the totality of transaction costs implies that all forms of private
production become more expensive than public production. This result would come up
if both the other studies of comparisons of public and private property in local services,
particularly in urban transport are not biased towards lower costs of private firms.
Secondly, we find that operating under a tender process does not imply cost savings, not
only because private operators are more expensive than public lines, but also because
the tender process increases or does not affect the total costs. One possible explanation
is the existence of relational contracting due to incomplete or complex contracts.
Another explanation is the preference to establish “familiar” contractors because the

EMT needs to change constantly the contract for adapting the contract to its needs. This
thesis would be supported by the Catalan external audit recommendations.
The first policy recommendation to the regulator is to allow TMB to bid on the future
concession tenders. The public company is in a good position to make competitive
offers and can discipline the private companies, not only offering a competitive price
but also by its area knowledge. The loss of government in-house experience is an
irreplaceable cost when relational contracting exists, but this is not Barcelona case. The
public company would undergo a threat of privatization that may well encourage
performance improvements to the public managers and employees of TMB. The second
policy recommendation is to separate the regulator and the public company. Even the
technical structure is separated and both pursue benevolent goals for society, the EMT
has a fully participation on TMB and the incentives that the regulator and the public
company have are different. The third recommendation is to incorporate an external
company to reduce the regulator dependence to only few local bus groups. TMB
participation in contests processes can alleviate the present situation, but not solve it.
And lastly, the regulator must achieve neutrality between private tenderers, and also
between future public-private tenderers to achieve real and effective competition for the
market.

7. References
• Albalate, D., Bel, G. and Calzada, J. (2012). Governance and regulation of urban
bus transportation: Using partial privatization to achieve the better of two
worlds. Regulation & Governance, 6(1), pp. 83-100.
• Alexandersson, G., Hultén, S. and Fölster, S. (1998). The effects of competition
in Swedish local bus services. Journal of Transport Economics and Policy, pp.
203-219.
• Battese, G.E. and Coelli, T.J. (1995). A model for technical inefficiency effects
in a stochastic frontier production function for panel data. Empirical Economics,
20, pp. 325-332.
• Beck, A., & Walter, M. (2013). Factors Affecting Tender Prices in Local Bus
Transport Evidence from Germany. Journal of Transport Economics and Policy
(JTEP), 47(2), pp. 265-278.
• Bel, G., Fageda, X., & Warner, M. E. (2010). Is private production of public
services cheaper than public production? A meta‐regression analysis of solid
waste and water services. Journal of Policy Analysis and Management, 29(3),
pp. 553-577.
• Berechman, J. (1993). Public Transit Economics and Deregulation Policy
(Amsterdam: North-Holland).
• Boitani, A. and Cambini, C. (2006). “To bid or not to bid, this is the question:
the Italian experience for local bus services”, European Transport no. 33, 63-81
• Boitani, A., Nicolini, M. and Scarpa, C. (2013). Do competition and ownership
matter? Evidence from local public transport in Europe. Applied Economics, 45
(11), pp. 1419-1434.

• Brown, T. and Potoski, M. (2003). Managing Contract Performance: A
Transaction Costs Approach”. Journal of Policy Analysis and Management 20,
pp. 275-297.
• Brown, T. and Potoski, M. (2005). Transaction costs and contracting: the
practitioner perspective.Public performance & management review, 28(3), pp.
326-351.
• Coelli, T. (2003). A Primer on Efficiency for Utilities and Transport Regulators.
World Bank Publications.
• Croissant, Y., Roy, W., & Canton, J. (2013). Reducing urban public transport
costs by tendering lots: a panel data estimation. Applied Economics, 45(26), pp.
3711-3722.
• De Borger, B., Kerstens, K. and Costa, A (2002). Public transit performance:
What does one learn from frontier studies? Transport Reviews, 22(1), pp. 1-38.
• Domberger, S., Meadowcroft, S., and Thompson, D. (1986). Competitive
Tendering and Efficiency: The Case of Refuse Collection, Fiscal Studies, 7(4),
pp. 69–87.
• Domberger, S., Meadowcroft, S., and Thompson, D. (1987), ‘The Impact of
Competitive Tendering on the Costs of Hospital Domestic Services’, Fiscal
Studies, 8(4), pp. 39–54.
• Fazioli, R., Filippini, M. and Prioni, P. (1993). Cost Structure and Efficiency of
Local Public Transport: The Case of Emilia Romagna Bus Companies.
International Journal of Transport Economics, 3, pp. 305-324.
• Fazioli, R., Filippini, M. and Kunzle M. (2002). Valutazione dell’efficienza
delle compagnie di bus italiane e svizzere, prepared fot the Central Bank of
Italy.

• Filippini, M. and Prioni, P. (1994). Is Scale and Cost Inefficiency in the Swiss
Bus Industry a Regulatory Problem? Evidence from a Frontier Cost Approach.
Journal of the Economics of Business, 1, pp. 219-231.
• Filippini, M. and Prioni, P. (2003). The influence of ownership on the cost of
bus service provision in Switzerland-an empirical illustration. Applied
Economics, 35(6), pp. 683-690.
• Fraquelli, G., Piacenza, M. and Abrate, G. (2004). Regulating Public Transit
Networks: How do Urban Intercity Diversification Speed up Measures Affect
Firms’ Cost Performance? Annals of public and Cooperative Economics, 75(2),
193-225.
• Gagnepain, P. (1998). Structures productives de l'industrie du transport urbain et
effets des schémas réglementaires. Economie et Prevision, 135, pp. 95-107.
• Girth, A., Hefetz, A. Johnston, J. and Warner, M. (2012). Outsourcing Public
Service Delivery: Management Responses in Noncompetitive Markets. Public
Administration Review, 72(6), pp. 887-900.
• Hensher, D. and Wallis, I. (2005). Competitive tendering as a contractin
mechanism for subsidising transport: The bus experience. Journal of Transport
Economics and Policy, 39(3), pp. 295-321.
• Hensher, D. A., and Stanley, J. (2008). Transacting under a performance-based
contract: The role of negotiation and competitive tendering. Transportation
Research Part A: Policy and Practice, 42(9), pp. 1143-1151.
• Johnston, J. M., & Girth, A. M. (2012). Government Contracts and “Managing
the Market” Exploring the Costs of Strategic Management Responses to Weak
Vendor Competition. Administration & Society, 44(1), 3-29.

• Jørgensen, F., Pedersen, P. A., & Volden, R. (1997). Estimating the inefficiency
in the Norwegian bus industry from stochastic cost frontier models.
Transportation,24(4), pp. 421-433.
• Laffont, J.-J., Tirole, J. (1993). A Theory of Incentives in Procurement and
Regulation. The MIT Press, Cambridge (MA).
• Lamothe, M., Lamothe, S. (2012). To Trust or Not to Trust? What Matters in
Local Government-Vendor Relationships? Journal of Public Administration
Research and Theory, 22(4), pp. 867-892.
• Leland, S. and Smirnova, O. (2009). Reassessing Privatization Strategies 25
Years Later: Revisiting Perry and Babitsky's Comparative Performance Study of
Urban Bus Transit Services. Public Administration Review, 69 (5): 855–867
• Levaggi, R. (1994). Parametric and non-parametric approach to efficiency: The
case of urban transport in Italy. Studi Economici, 49(53), pp. 67-88.
• Mackie, P., Preston, J. and Nash, C. (1995). Bus deregulation: ten years on.
Transport Reviews, 15(3), pp. 229-251.
• Matas, A. and Raymond, J.L. (1998). Technical characteristics and efficiency of
urban bus companies: The case of Spain. Transportation, 25, pp 243-263.
• Mathisen, T. A. and Solvoll, G. (2008). Competitive tendering and structural
changes: An example from the bus industry. Transport Policy, 15(1), pp. 1-11.
• Miranda, R. and Lerner, A. (1995). Bureaucracy, Organizational Redundancy,
and the Privatization of Public Services. Public Administration Review 55, pp.
193–200.
• Mouwen, A. and Rietveld, P. (2013). Does competitive tendering improve
customer satisfaction with public transport? A case study for the Netherlands.
Transportation Research Part A: Policy and Practice, 51, pp. 29-45.

• Ottoz, E., Fornengo, G. and Di Giacomo, M. (2009). The impact of ownership
on the cost of bus service provision: an example from Italy. Applied economics,
41, pp. 337-350.
• Perry, J. and Babitsky, T. T. (1986). Comparativa performance in urban bus
transit: Assessing privatization strategies. Public Administration Review, 57-66.
• Roy, W. and Yvrande-Billon, A. (2007). Ownership, contractual practices and
technical efficiency: The case of urban públic transport in France. Journal of
Transport Economics and Policy, 41(2), pp. 257-282.
• Scheffler, R., Hartwig, K. H., & Malina, R. (2013). The Effects of Ownership
Structure, Competition, and Cross-Subsidisation on the Efficiency of Public Bus
Transport: Empirical Evidence from Germany. Journal of Transport Economics
and Policy (JTEP), 47(3), pp. 371-386.
• Stein, R.M. (1990). Urban alternatives: Public and private markets in the
provision of local services, Pittsburgh. University of Pittsburgh Press.
• Viton, P. (1981). A Translog Cost Function for Urban Bus Transit. The Journal
of Industrial Economics, 29(3), pp. 287-304.
• Warner, M. E. and Hefetz, A.(2008). Managing Markets for Public Service: The
Role of Mixed Public/Private Delivery of City Services,”. Public
Administration Review,68(1), pp. 150-161.
• Warner, M.E. and Bel, G. (2008). Competition or monopoly? Comparing
privatization of local public services in the U.S. and Spain. Public
Administration 86(3), pp. 723-735.
• Williamson, O. (1976). Franchise bidding for natural monopoly-in general and
with respect to CATV.
• Williamson, O. (1991). Comparative Economic Organization: The Analysis of
Discrete Structural Alternatives. Administration Science Quarterly 36, pp. 269-
96.
• Williamson, O. (1999). A Transaction Cost Economics Perspective. Journal of
Law, Economics and Organization 15, pp. 306-342.
• Yvrande-Billon, A. (2006). The attribution process of delegation contracts in the
French urban public transport sector: why competitive tendering is a myth.
Annals of Public and Cooperative Economics, 77(4), pp. 453-478.