analysis fo sugars in maple syrup - perkinelmer
TRANSCRIPT
Liquid Chromatography
A P P L I C A T I O N N O T E
Author:
Jamie Foss
PerkinElmer, Inc. Shelton, CT
IntroductionMaple syrup is a popular natural sweetener that the U.S. Food and Drug Administration defines as the liquid food derived by concentrating and heat-treating sap from the
maple tree.1 Sucrose is the primary sugar found in maple syrup, along with lesser amounts of glucose, fructose and complex carbohydrates.2 Often, the total sugar content of maple syrup is based solely on the amount of sucrose, and does not consider the other sugar sources.2 Maple syrup also contains various other components including minerals, vitamins, amino acids, organic acids, and phytohormones.3 The sugar composition of maple syrup differs from honey, which is dominated by both glucose and fructose, and can contain other sugars such as sucrose and maltose, in much smaller concentrations.3
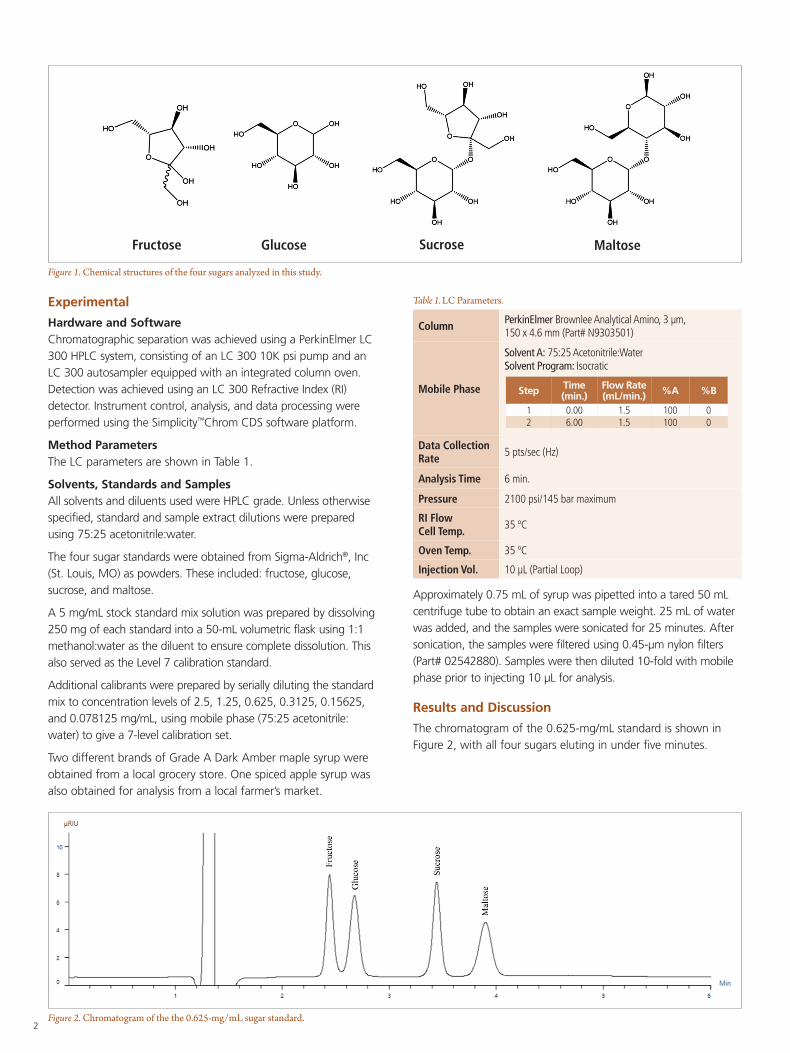
The analysis of simple sugars is commonly performed using high performance liquid chromatography (HPLC). Often, hydrophilic interaction chromatography (HILIC) is used with refractive index (RI) detection owing to the polarity of the sugars, and the lack of a suitable chromophore for UV detection. Therefore, this work describes a simple HILIC-RI method for the analysis of four common sugars found in maple syrup. The structures of these four sugars are shown in Figure 1.
Analysis of Sugars in Maple Syrup by Hydrophilic Interaction Chromatography (HILIC) with Refractive Index Detection
2
Figure 1. Chemical structures of the four sugars analyzed in this study.
Fructose Glucose Sucrose Maltose
Experimental
Hardware and SoftwareChromatographic separation was achieved using a PerkinElmer LC 300 HPLC system, consisting of an LC 300 10K psi pump and an LC 300 autosampler equipped with an integrated column oven. Detection was achieved using an LC 300 Refractive Index (RI) detector. Instrument control, analysis, and data processing were performed using the Simplicity™Chrom CDS software platform.
Method ParametersThe LC parameters are shown in Table 1.
Solvents, Standards and SamplesAll solvents and diluents used were HPLC grade. Unless otherwise specified, standard and sample extract dilutions were prepared using 75:25 acetonitrile:water.
The four sugar standards were obtained from Sigma-Aldrich®, Inc (St. Louis, MO) as powders. These included: fructose, glucose, sucrose, and maltose.
A 5 mg/mL stock standard mix solution was prepared by dissolving 250 mg of each standard into a 50-mL volumetric flask using 1:1 methanol:water as the diluent to ensure complete dissolution. This also served as the Level 7 calibration standard.
Additional calibrants were prepared by serially diluting the standard mix to concentration levels of 2.5, 1.25, 0.625, 0.3125, 0.15625, and 0.078125 mg/mL, using mobile phase (75:25 acetonitrile: water) to give a 7-level calibration set.
Two different brands of Grade A Dark Amber maple syrup were obtained from a local grocery store. One spiced apple syrup was also obtained for analysis from a local farmer’s market.
Column PerkinElmer Brownlee Analytical Amino, 3 µm, 150 x 4.6 mm (Part# N9303501)
Mobile Phase
Solvent A: 75:25 Acetonitrile:Water Solvent Program: Isocratic
Data Collection Rate 5 pts/sec (Hz)
Analysis Time 6 min.
Pressure 2100 psi/145 bar maximum
RI Flow Cell Temp. 35 ºC
Oven Temp. 35 ºC
Injection Vol. 10 μL (Partial Loop)
Table 1. LC Parameters.
Step Time (min.)
Flow Rate (mL/min.) %A %B
1 0.00 1.5 100 02 6.00 1.5 100 0
Approximately 0.75 mL of syrup was pipetted into a tared 50 mL centrifuge tube to obtain an exact sample weight. 25 mL of water was added, and the samples were sonicated for 25 minutes. After sonication, the samples were filtered using 0.45-µm nylon filters (Part# 02542880). Samples were then diluted 10-fold with mobile phase prior to injecting 10 µL for analysis.
Results and Discussion
The chromatogram of the 0.625-mg/mL standard is shown in Figure 2, with all four sugars eluting in under five minutes.
Figure 2. Chromatogram of the the 0.625-mg/mL sugar standard.

3
Figure 3. Chromatographic overlay of 10 replicates of the 0.625-mg/mL sugar standard.
Figure 4. Results of the 7-level calibration sets for fructose, glucose, sucrose, and maltose.
As listed in Table 2, the limit of detection (LOD) and limit of quantitation (LOQ) were obtained for each analyte, and were calculated from the standard deviation of the response and the slope of the calibration curve for each analyte, based on triplicate injections of the Level 1 standard.
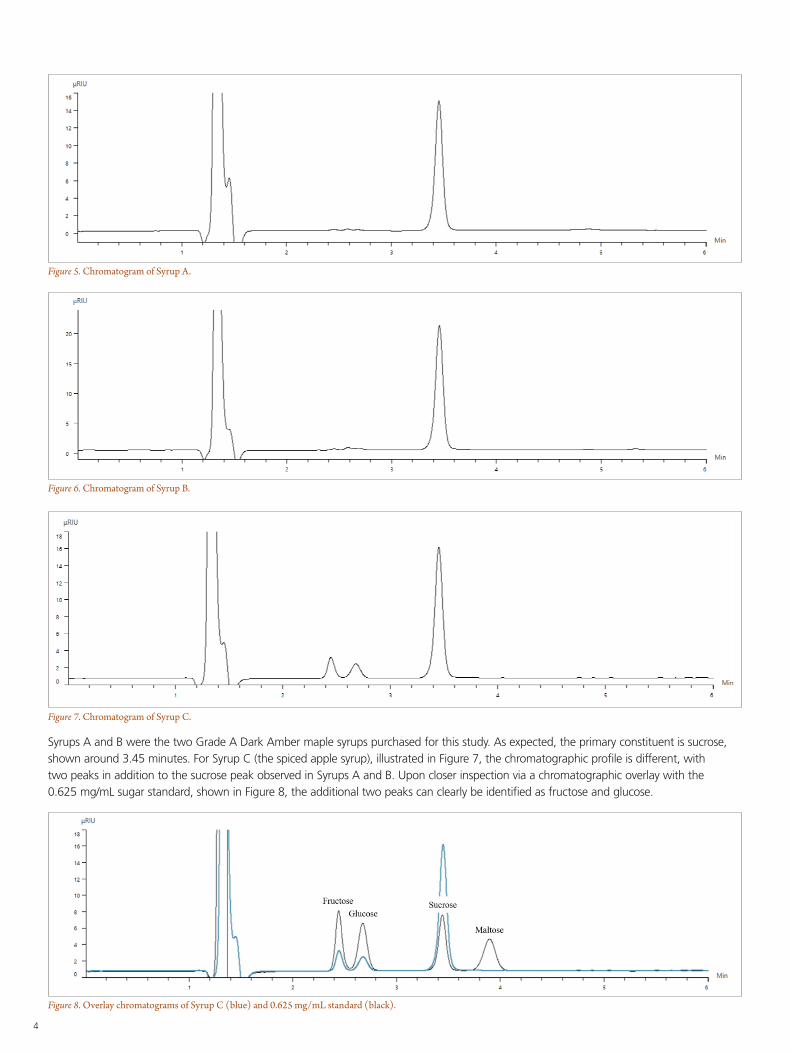
Using the same chromatographic conditions, the three syrup samples were analyzed. The chromatographic results for Syrups A, B, and C can be see in Figures 5, 6, and 7, respectively.
Analyte Calculated LOD (mg/mL) Calculated LOQ (mg/mL)
Fructose 0.006 0.022
Glucose 0.039 0.131
Sucrose 0.015 0.050
Maltose 0.015 0.050
Table 2. LODs and LOQs for the four analytes, in order of elution.
Figure 3 shows the overlay of 10 replicate 0.625 mg/mL sugar standard injections, demonstrating exceptional reproducibility. Retention time %RSDs were less than 0.07%, and peak area %RSDs were less than 0.5% for all analytes.
Figure 4 shows the calibration results for all four sugars over a concentration range of 0.078125 to 5 mg/mL. All four sugars followed a linear (1st order) fit and had R2 coefficients above 0.999 (n=3 at each level).
4
Syrups A and B were the two Grade A Dark Amber maple syrups purchased for this study. As expected, the primary constituent is sucrose, shown around 3.45 minutes. For Syrup C (the spiced apple syrup), illustrated in Figure 7, the chromatographic profile is different, with two peaks in addition to the sucrose peak observed in Syrups A and B. Upon closer inspection via a chromatographic overlay with the 0.625 mg/mL sugar standard, shown in Figure 8, the additional two peaks can clearly be identified as fructose and glucose.
Figure 5. Chromatogram of Syrup A.
Figure 6. Chromatogram of Syrup B.
Figure 7. Chromatogram of Syrup C.
Figure 8. Overlay chromatograms of Syrup C (blue) and 0.625 mg/mL standard (black).
5
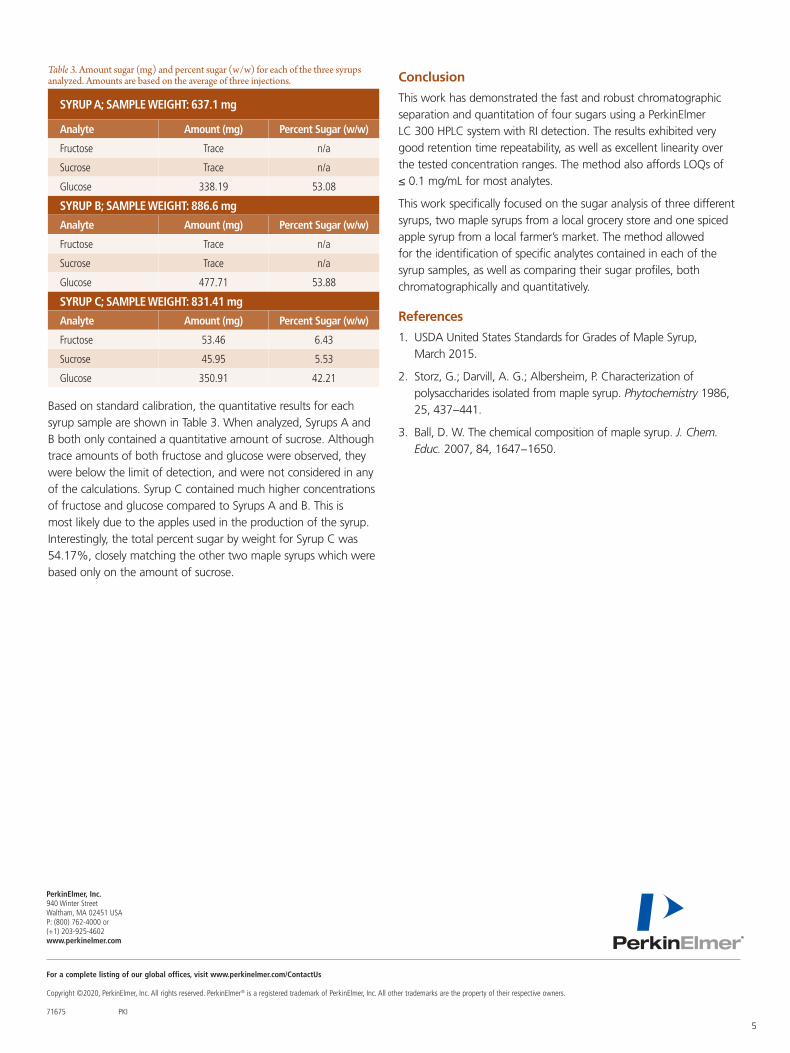
Based on standard calibration, the quantitative results for each syrup sample are shown in Table 3. When analyzed, Syrups A and B both only contained a quantitative amount of sucrose. Although trace amounts of both fructose and glucose were observed, they were below the limit of detection, and were not considered in any of the calculations. Syrup C contained much higher concentrations of fructose and glucose compared to Syrups A and B. This is most likely due to the apples used in the production of the syrup. Interestingly, the total percent sugar by weight for Syrup C was 54.17%, closely matching the other two maple syrups which were based only on the amount of sucrose.
Conclusion
This work has demonstrated the fast and robust chromatographic separation and quantitation of four sugars using a PerkinElmer LC 300 HPLC system with RI detection. The results exhibited very good retention time repeatability, as well as excellent linearity over the tested concentration ranges. The method also affords LOQs of ≤ 0.1 mg/mL for most analytes.
This work specifically focused on the sugar analysis of three different syrups, two maple syrups from a local grocery store and one spiced apple syrup from a local farmer’s market. The method allowed for the identification of specific analytes contained in each of the syrup samples, as well as comparing their sugar profiles, both chromatographically and quantitatively.
References
1. USDA United States Standards for Grades of Maple Syrup, March 2015.
2. Storz, G.; Darvill, A. G.; Albersheim, P. Characterization of polysaccharides isolated from maple syrup. Phytochemistry 1986, 25, 437−441.
3. Ball, D. W. The chemical composition of maple syrup. J. Chem. Educ. 2007, 84, 1647−1650.
SYRUP A; SAMPLE WEIGHT: 637.1 mg
Analyte Amount (mg) Percent Sugar (w/w)
Fructose Trace n/a
Sucrose Trace n/a
Glucose 338.19 53.08
SYRUP B; SAMPLE WEIGHT: 886.6 mg
Analyte Amount (mg) Percent Sugar (w/w)
Fructose Trace n/a
Sucrose Trace n/a
Glucose 477.71 53.88
SYRUP C; SAMPLE WEIGHT: 831.41 mg
Analyte Amount (mg) Percent Sugar (w/w)
Fructose 53.46 6.43
Sucrose 45.95 5.53
Glucose 350.91 42.21
Table 3. Amount sugar (mg) and percent sugar (w/w) for each of the three syrups analyzed. Amounts are based on the average of three injections.
For a complete listing of our global offices, visit www.perkinelmer.com/ContactUs
Copyright ©2020, PerkinElmer, Inc. All rights reserved. PerkinElmer® is a registered trademark of PerkinElmer, Inc. All other trademarks are the property of their respective owners. 71675 PKI
PerkinElmer, Inc. 940 Winter Street Waltham, MA 02451 USA P: (800) 762-4000 or (+1) 203-925-4602www.perkinelmer.com