analysis from great britain pros and cons of self driving
TRANSCRIPT

Page 1/14
Pros and Cons of Self Driving Vans - A Real Life Motorway Case StudyAnalysis from Great BritainRamjit Nandakumar ( [email protected] )
University of Leeds
Case Report
Keywords: Tra�c Simulation, Micro Simulation, Hypothetical condition, Autonomous Vehicles, Vehicle Connectivity, Environmental Emission
Posted Date: August 4th, 2021
DOI: https://doi.org/10.21203/rs.3.rs-375141/v2
License: This work is licensed under a Creative Commons Attribution 4.0 International License. Read Full License

Page 2/14
AbstractGiven the speculations that autonomous vehicles are sure to take over the transport sectors in the near future, this study micro-simulates the impacts ofautomating the vehicle VAN using the micro-simulation software AIMSUN in a hypothetical condition. This study analyses the impacts of automation of vansin different levels of automation penetrations with heterogeneous tra�c conditions on tra�c parameters such as speed and different environmental factorsand should only be considered as a case approach with minimal application in the real-world scenario. In this study, the impacts of automation of van indifferent road characteristics were also analyzed in detail. The study highlights that with an increase in van automation penetrations, tra�c parameters speedis positively impacted while negative impacts on environmental conditions are observed. This is mostly because multiple analysis should have been carriedout to have a complete understanding of the network.
BackgroundTra�c congestion has always been an area of rigorous concern for both urban planners and tra�c engineers as the development of various infrastructuralfacilities gets adversely impacted by them. With the wide technological innovations and advancements occurring in the present-day �eld of automatedvehicles, these concerns are sure to skyrocket soon (Johnson and Walker. (2016)). The General Motors and Radio Corporation of America Sarnoff Laboratory�rst carried out and initiated the idea of autonomous vehicles in the 1950s (Pendleton et al. 2017; Shladover 2018). Wadud et al. (Zia Wadud, Mackenzie, andLeiby. (2016)) and Flamig (Flämig. (2016)) reported that shortly, private methods of transportation and shared taxi services of transportation will see a majorboost in the domain of Automated Driving Systems (ADS) which is going to transform the way people move on the road. The considered main advantage ofautonomous vehicles is that they can be used both as a private and as a commercial (taxi) vehicle (Heinrichs. (2016); Collingwoos. (2017); Z Wadud. (2017);Anderson et al. (2014); Brown, Gonder, and Repac. (2014); Alessandrini et al. (2015); Levine and Boyles. (2015); Harper et al. (2016); Maurer et al. (2016); ZiaWadud, Mackenzie, and Leiby. (2016); Chan. (2017); Z Wadud. (2017); Taiebat et al. (2018); Khan et al. (2019)). Users with mobility limitations such as thechildren, sick, elderly, etc. (Pettigrew, Cronin, and Norman. (2019); Kovacs, McLeod, and Curtis.(2020)) are forecasted to be highly bene�ted by vehicleautomation. In general, AVs are expected to be cheap, reliable, comfortable and bring about more normalized �ows, steady speed outline, reduction inaccidents caused by human negligence, more uniform travel behavior, reduced travel time, time use bene�ts, etc. (Fagnant and Kockelman. (2015); Ambühl,Ciari, and Menendez. (2016); Milakas, van Arem, and van Wee. (2017); Benenson et al. (2008a); Godoy et al. (2015); Paden et al. (2016)). But these bene�tsthat are going to be introduced by the automation of freight vehicles are forecasted to bring about higher levels of tra�c congestion especially with the currentroad infrastructure and their behavior with the existing conventional vehicles (Harper et al. (2016); Metz ID (2018)).
This study looks into the impact of highly automated (Appendix A) freight VANs on travel time/delay, speed, and environmental impacts on an already existingmotorway in the UK. The different levels of automation penetration (25%, 50%, 75%, and 100%) for vans with heterogeneous tra�c conditions havingconventional cars, vans, and trucks (belonging to 3 different types) are addressed in this study. Thus, the impact of higher levels of van automation when inco-existence with the conventional vehicles are analyzed with the introduction of automation penetration in different penetrations.
This study aims to reduce the gap that currently exists in the body of literature that discusses the impacts of highly automated vans on real road networkconditions. This study analyses the impacts of higher levels of automated vans on speed and environmental factors in motorway driving. Thus, in this study,the M62 motorway which has a substantially-high percentage of vehicle movements is selected to analyze the impacts of automated vans withheterogeneous mixed tra�c conditions. The selected stretch of M62 features a comparably �at section with a considerable climb vehicle �ows which is keptto the current road network conditions using the information obtained from Highways England. Vans were provided with automated capabilities andpenetrated at 25%, 50%, 75%, and 100% automation in the microsimulation software AIMSUN.
1.2 Research Objectives
The main objective of this study is to analyze the various impacts that high levels of automated vans have on an already existing motorway. The variousobjectives include understanding the
the impact of high-level van automation on overall tra�c parameters such as speed and time
impacts of high-level van automation on environmental emission factors (Using London Emission Model) with respect to Carbon-Dioxide (CO2), NitrogenOxide (NOx), Particulate Matter (PM), and Volatile Organic Compound (VOC).
Methods And Materials2.1 Scope of the Study
Even though there exists a surplus body of literature corresponding to the impacts of automated cars and other private vehicles (typically of SAE Levels – 1and 2), the body of literature incorporating the impacts of highly automated freight vehicles especially vans with mixed tra�c conditions on a real roadnetwork conditions are limited. Thus, in this study, the M62 motorway which has a substantially-high percentage of freight movements is selected to analyzethe impacts of automated vans with heterogeneous mixed tra�c conditions on delay/travel time, tra�c speed and environmental emission aspects. This

Page 3/14
study focuses on reducing the above-mentioned gap in the literature by analyzing the impact of higher levels of automated vans with heterogeneous tra�cconditions on an existing motorway tra�c �ow information obtained from Highways England by the method of micro-simulation modeling.
2.2 Study Area
Motorways are the network of trunk roads administrated by Highways England in the United Kingdom (ICE (2020)). For the purpose of this study, the stretch ofM62 motorway situated to just further Junction 22 towards westbound of Leeds (Junction 28) & towards Manchester was selected. M62 is one of the mainstretches of trunk roads in the UK linking wider European networks via Rotterdam and Dublin also covering other prominent urban areas in England such asthe Hull, Leeds, Bradford, Manchester, and Liverpool.
Motorways with sections of entry and exit ramps of M606 and M621 motorways were merged with M62. The �at section which is 73m above sea level fromLeeds to Brighouse (Junction 25) increases to 230m above sea level at Pennines (Junction 22). Hence the impact of automation on normal, congested, andup-hill stretches can be analyzed from this selected motorway without having the need to run multiple motorway simulations. The leftmost lane is consideredto be the slow lane in the UK and that the highest elevation observed in the motorway of England (372m) is observed at the selected stretch at the east ofJunction 22.
Figure 1 shows the chosen stretch of motorway M62 for simulation using the micro-simulation software Aimsun. The merging of motorways M606 and M621into M62 is shown in Figure 1. The varying levels of congestion that can be observed in the selected stretch of motorway allow analyzing the impact ofdifferent levels of automation of different vehicles in tra�c �ow. The uphill stretch located near Junction 22 allows observing the impacts of speed, delay, andenvironmental emission behavior of automated vans in the uphill portions.
2.3 Simulation Setup
2.3.1 Simulating Vehicle Behavior
For the purpose of simulation, tra�c �ow data was collected. Micro-simulation software Aimsun version 8.3 was used for simulation of automated and non-automated vehicles in the motorway stretch M62 (Figure 1). Given that there is only less available literature that co-operates higher levels of automated vanswith other types of conventional vehicles, vehicle types belonging to the classi�cation of vans were assumed to be automated in existing mixed tra�cconditions in our simulation.
The entire stretch of M62 given in �gure 1 was simulated in the micro-simulation software Aimsun. Details of junctions, their exits, and entries, wasincorporated in Aimsun while simulating the motorway characteristics.The merging of the M606 and M621 with M62 is shown in �gure 1
The classes of vehicles used in the simulation were classi�ed according to the vehicle length as per the motorway count measurement system which is givenin Table 1. Even though we have three types of trucks (light, rigid and articulated) as given in Table 1, the impacts of automation of vans are assumed topenetrate at a similar rate for all the three groups together mentioned as Trucks in our study. Tra�c �ow is measured for this classi�cation of vehicle classesand each class was given automation capability in different levels of penetration in the simulation.
Table 1: Vehicle Classi�cation
Vehicle Classes Vehicle Length
Cars <=5.2m
Vans >5.2m and <=6.6m
Light Commercial Vehicles (light trucks) >6.6m and <=11.6m
Large trucks: they are split into 50% rigid and 50% articulated >11.6m
Aimsun’s default parameters were applied for simulating the standard (non-automated) vehicles. Some minor adjustments were made in order to re�ect UKspeci�cation regulations and to calibrate against the mean speed of different classes of vehicles at individual sections of the motorway. The mean speed limitof automated vans was increased when compared to conventional vans since automated vehicles are predicted to have higher speed pro�les.
The behavior of automated van for the purpose of micro-simulation of tra�c �ow along the motorway is modeled as follows:

Page 4/14
For an automated van, the reaction time is lesser than the human reaction time
Speed distribution of automated van is more uniform since non – uniformity in human behavior can be overcome through the automation of vehicles
Standard Speed limits given is 100% followed
London Emission Model in the micro-simulation software Aimsun is used to analyze the environmental impacts of automation
2.4 Modelled Scenarios
2.4.1 Van Automation at Different Penetrations at a Time
Analysis of automation penetration was made for the group of scenarios where only the vehicle classi�cation van was automated for different penetrationlevels at a single time.
Table 2: Modelled Scenarios – Van Vehicle Classi�cation Automated
SI
No
Vehicle Classi�cation Percentage of Automation Penetration
0% 25% 50% 75% 100%
2.4.1 Only Van √ √ √ √ √
Here the vehicle classi�cation “Van” is automated at different penetrations (0%, 25%, 50%, 75%, 100%) while the other vehicle types “Car” and “Truck” are keptnon-automated throughout the study. In the above-mentioned. 0% of automation penetration indicates the current real-life tra�c demand on the motorwayM62 network with 100% conventional vehicles. The results from 0% automation penetrations were used as a baseline to compare and understand the impactsthat further levels of automation penetration have on tra�c parameters and various environmental emission factors in our study. Similarly, 25% automation ofvans indicates that out of the considered 100% conventional vans, 25% of the total vehicle type vans are converted to autonomous vehicles and given higherautomation capabilities in simulation while the rest 75% of the vehicle type remains non-automated. Thus, in this particular scenario, various analysis such aseffects on overall tra�c parameter (speed), environmental emission analysis is carried out while the vehicle type cars are automated at different penetrations,while the impact of automation of vans on non-automated vehicles are also analyzed in detail.
Results And Discussion3.1 Introduction
The simulation results for the different scenarios are presented for smaller stretches of the motorway between two junctions in order to understand andidentify the different vehicle behaviors and environmental impacts along different stretches. Stretch 27 - 26 (J27 - J26) is the heavily congested stretch, 26 - 25(J26 - J25) is the moderately congested stretch, stretch 24 – 23 (J24 - J23) is the uphill stretch, and stretch 23 - 22 (J23 -J22) is the mild uphill stretch.Inferences on the impact of automation in different road geometry (uphill or not), tra�c conditions (congested or not), and environmental factors were madewithout having the need to run different simulations for understanding the impact of automation in different road network characteristics.
3.2 General Analysis
The mean speed represented below in the �gures is the average speeds of the vehicles that are taken into consideration for the simulation. Environmentalemission factors such as Carbon-Dioxide (CO2), Nitrogen Oxide (NOx), Particulate Matter (PM), and Volatile Organic Compounds (VOC) was analyzed alongthe stretch of motorway. To determine and examine the different emission factors along the considered stretches, London Emission Model in the micro-simulation software Aimsun was used. With the increase in penetration of automated vehicles, hints of certain trends for the emission factors for differentstretches of the motorway with almost similar property could be observed. For each scenario, it can be observed that the greatest emissions along M62happen at the most congested stretch i.e. J27 – J26 as expected. Stretch 27 - 26 (J27 - J26) is the highly congested stretch due to the merging of M621 intoM62 and stretch 26 - 25 (J26 - J25) is the moderately congested stretch due to the merging of M606 into M62, stretch 24 - 23 (J24 - J23) is the uphill stretchand stretch 23 - 22 (J23-J22) is the mild uphill stretch.
3.2.1 Analysis of Higher Level of Van Automation
Mean Speed.
Figure 2 represents the impact of different levels of automation penetration of vehicle type van on tra�c speed on the motorway M62. The other vehicle typescars and trucks are kept non-automated throughout the stretch on M62. From the different sub�gures shown in �g 2, improvements in mean speed for thevehicle type van can be observed as the automation penetration increase i.e. as more and more vans are automated, the mean speeds of vehicle type van alsoincrease. Noticeably, as more and more vans are automated, it can be observed that the mean speed of non-automated vehicles also positively beingimpacted by the increase in automation penetration, although this increase is negligible. Overall, van vehicle automation improves the travel speed of vehicletype van and does not have any adverse impacts on the speeds of other vehicles.

Page 5/14
With respect to the increase in automation penetration, there is some observational hint of non-linearity in the improvements in the mean speed of vans. Innormal conditions, it can be observed that the improvements at higher automation penetration are greater than the speed increases at lower automationpenetration. In congested situations, as in J27 - J26 and J26 - J25 (Figures 2a and 2b), this non- linearity becomes more prominent at an earlier level ofpenetration.
From �g 2, it can be noted that the largest bene�ts in terms of greater mean speeds are observed in congested situations (�g 3b). The congested stretch J27 –J26 falls just after the merging of the two motorways M621 and M606 with the M62. An increase of 14.7% in mean speed of vehicle type van is observedwhen all of them become automated compared to none of them being automated i.e. 0% automation. Noticeably, this substantial increase in mean speed ofvans also improves the mean speed of cars and trucks in congested stretches by 16.8% and 13.2% respectively. It can be noted that just for congestedstretches, the vehicle type cars are more bene�tted with respect to mean speed when vans are automated. This might be possibly due to the less amount ofcon�icts between the vehicles due to automation and the higher amount of the vehicle type car along the stretch. Since the stretch J27 – J26 lies between 2other motorways merging at both ends (M621 and M601), this stretch also has substantial weaving tra�c. In comparison, only less than 4% improvement forcars and trucks with respect to mean speed can be observed along the normal stretches of the considered motorway whereas a minimum of 7% increase inmean speeds for the vehicle type vans is observed along the stretch of the motorway. From �g 2e and 2f it can be observed that even along uphill stretchesthe mean speed of the vehicle type van gets bene�ted without any negative impact on the mean speed of other non-automated vehicle types.
Environmental Emission.
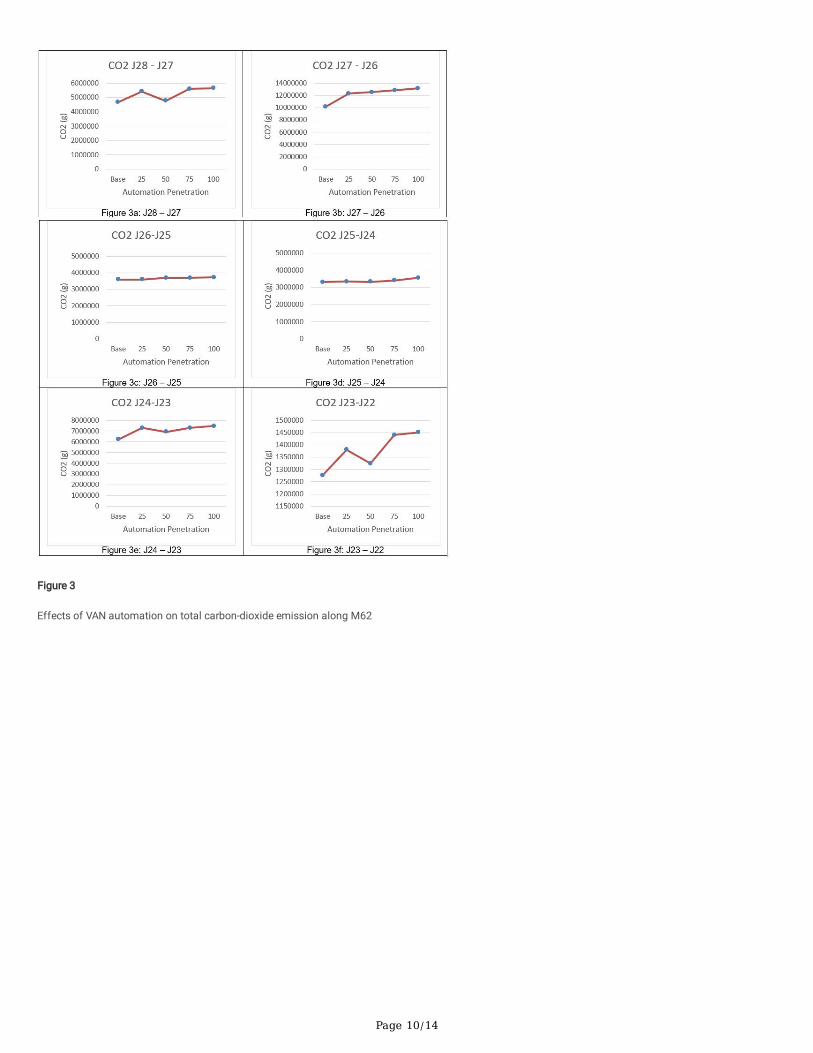
Figure 3,4, 5, 6 represents the total emission concentration of the stretches when vans are automated on the simulated stretch M62. From stretches, wherepossible, inferences on the impact of automation with respect to environmental emission in different road geometry (uphill or not) and tra�c conditions(congested or not) were made.
For different stretches of the motorway with almost similar property, hints of certain trends for the emission factors could be observed along with thepenetration of automated vans. For congested, normal, and uphill stretches along with the motorway, it can be observed that 100% penetration of automatedvans emitted the greatest emission and controversially, 0% penetration of automated vans emitted the least emission for congested, uphill and normalstretches. This might be possible because of the share of the percentage of vehicle mix of vans in the tra�c demand. Due to fewer percentage of vehicle typevan along the motorway, automation of vans might create road tra�c confusions to conventional vehicles resulting in more frequent accelerations,decelerations and braking, resulting in more emission of environmental factors. It can be observed that the greatest emission along M62 happens at the mostcongested stretch i.e. J27 – J26 as expected. The general trend observed for environmental emission along van automation penetration is mentioned in Table3.
Table 3: Emission trends along the stretch when vehicle type VANs are automated
Stretch
Characteristic
Decreasing level of emission (London Emission model) with respect to the level of VAN automation penetration
Decreasing Level of Emission
Congested Stretch 100%
(Greatest)
75% 25% 50% 0%
(Lowest)
Uphill Stretch
(Stretch with slope)
100%
(Greatest)
75% 25% 50% 0%
(Lowest)
Flat Stretch 100%
(Greatest)
75% 25% 50% 0%
(Lowest)
From the above analysis, the stretch with the maximum congestion (J26- J27) was observed to be the stretch that emits the greatest emission along themotorway and non-uniformity in emission analysis in almost all kinds of stretches were observed. This study highlights that the automation of vans increasesthe mean speed of travel taken to traverse different stretches of the motorway as observed from section 3.2.1. However, the environmental emission analysisindicates a signi�cant rise in emission values for almost all of the considered scenarios. A possible conclusion about the negative impacts of emittedenvironmental emission factors is that as lower levels of automated vans are introduced into the existing heterogeneous tra�c demand, initial confusions inmixed tra�c behaviors within vehicles are developed. This confusion in tra�c behavior are developed as a result of the difference between the reaction time,speed pro�le and speed acceptance characteristics of autonomous and non-autonomous vehicles along with the motorway. This results in non-uniform tra�c�ows. These initial levels of confusions are expected to reach greater levels as the total percentage of automated vans reaches greater occupancy levels in themotorway, as there still exist a prominent amount of conventional trucks and private cars compared to automated vans in the motorway tra�c. This can leadto an increase in difference of vehicle behavior resulting in more amount of frequent accelerations and braking. These con�icts are identi�ed by the non-
Page 6/14
uniformity in the emission levels represented through �gures 3,4,5 & 6 The study highlights that when all of the vehicles along the motorway are automated,such con�icts will be reduced and bene�ts for environmental emissions can be observed in a signi�cant amount which is represented in �gure 6.
When all the vehicles are automated, it can be noted that for the total stretch from Junction 22 to Junction 28 for a distance of approx. 37 km along M62,100% automation of vehicles (total emissions of all vehicle type considered together) gives the least value of emission for all the considered environmentalfactors.
Conclusion4.1 Summary
Micro-simulation software Aimsun was used for the simulation purpose of various modeled scenarios described in this research. This study has shown that speed is
4.1.1 Tra�c Parameter Analysis
Tra�c �ow was found to improve with the increase in levels of van automation. Automation of vans in different penetrations along with the motorway ben
No negative impacts on the mean speed was observed from the different levels of
Congested stretch and Up-hill stretches are the most bene�ted from vehicle automation concerning speed and time..
4.1.2 Environmental Emission Analysis
This study highlight that introducing higher levels of van automation into existing heterogenous motorway tra�c leads to increase in vehicle emission.This study hypothesizes that this is probably because multiple analysis and simulations shuld be conducted inorder to get a proper average result.
The study hypothesizes that the complete bene�ts of autonomous vehicles can only be observed after every vehicle class are automated with higherlevels of autonomous capabilities.
Carbon-dioxide emission appears to be the most signi�cant environmental emission factor and Particulate Matter the least. Thus, stating that, negativeimpacts of environmental emissions through van automation can possibly lead to increase in global warming by signi�cant amounts.
It was observed that greater slope results in greater emission values of environmental factors irrespective of the length of the considered stretch. (It wasobserved that the stretch with the greatest slope (J24 – J23) of length 2250m (approx.) emits higher values of emission factors than the stretch with mildslope (J23 – J22) of 11200m (approx.). Suggesting that the rate of the slope of the considered stretch can lead to higher negative impacts on emissionfactors rather than the length of the stretch).
Particulate Matter emissions are observed to be the highest in congested stretches suggesting that major portions of the Particulate Matter emissionsoccur from frequent tyre and brake wears resulting from the non-uniform �ow of tra�c (leading to frequent acceleration and braking) and not just fromvehicle exhausts.
Thus, from the overall analysis of the microsimulation conducted along motorway M62, it can be concluded that higher level van automation favors differenttra�c parameters along the motorway in a positive manner. Importantly, the conclusions that no negative impacts have been analysed on the tra�cparameters for automation of vehicles in any of the simulated scenarios and that individual automation of vehicles bene�ts speed with negative impacts onthe environmental emission factors are of signi�cant importance.
4.2 Research Limitations and Future Research Recommendations
Demand - For the purpose of this study, a conscious decision was made to not include any potential demand implications of any vehicle classautomation that might occur due to the relative changes in the price of automated vehicle transport. How the demand of autonomous vehicles mightimpact the total tra�c �ow of road networks are still under studies, thus these changes that might occur in tra�c demand due to automation can beincluded in the future works once everything is precise and clear.
Van Automation – only van was assumed to be automated with higher levels of capabilities. Different impact analyses with other vehicle types can beworked in future and the results found could be compared.
Single Motorway - This study analyzes the impact of vehicle automation in motorway M62 in the UK with different road characteristics between junctions,more motorways can be simulated in the future and the results found could be compared.
Emission - London Emission Model was used to analyze the environmental impacts of vehicle automation along the motorway, in the future moreenvironmental model analysis could be carried forward with multiple simulations. The emission analysis carried in this study analyzes the total emissionimpacts from all vehicle classes along the considered motorway. If needed individual vehicle emission analysis from the same motorway could be donein the future.

Page 7/14
DeclarationsData Availability Statement
Some or all data, models, or code generated or used during the study are proprietary or con�dential in nature and may only be provided with restrictions
Acknowledgement
The author would like to thank Dr Zia Wadud and Michael Daly from the University of Leeds, United Kingdom for their continuous support in helping to �nishthis project e�ciently on time. The author would also like to thank Dr Mithun Mohan from National Institute of Technology, Surathkal, India for his continuoussupport and appreciate AIMSUN software for providing a license for conducting this study.
ReferencesJohnson, Charlie, and Jonathan Walker. 2016. “PEAK CAR OWNERSHIP THE MARKET OPPORTUNITY OF ELECTRIC AUTOMATED MOBILITY SERVICES.”Rocky Mountain Institute - Mobility Transformation. http://rmi.org/wp-content/uploads/2017/03/Mobility_PeakCarOwnership_Report2017.pdf.
Pendleton, Scott Drew, Hans Andersen, Xinxin Du, Xiaotong Shen, Malika Meghjani, You Hong Eng, Daniela Rus, and Marcelo H Ang.Jr. 2017. “Perception,Planning, Control, and Coordination for Autonomous Vehicles.” MDPI - Machines 5 (6). https://doi.org/10.3390.
Shladover, S.E. 2018. “Connected and Automated Vehicle Systems.” Journal of Intelligent Transportation Systems 22: 190–200.
Wadud, Zia, P Mackenzie, and P Leiby. 2016. “Help or Hindrance? The Travel, Energy and Carbon Implications of Highly Automated Vehicles.” TransportationResearch Part A: Policy and Practice 86: 1–86.
Flämig, H. 2016. Autonomous Vehicles and Autonomous Driving in Freight Transport. Berlin: Springer.
Fagnant, D.J, and K Kockelman. 2015. “Preparing a Nation for Autonomous Vehicles: Opportunities, Barriers and Policy Recommendations.” Transp. Res. PartA Policy Pract 77: 167–81.
Ambühl, L, F Ciari, and M Menendez. 2016. “What about Space? A Simulation Based Assessment of AVs Impact on Road Space in Urban Areas.” In .
“How Autonomous Vehicles Could Relieve or Worsen Tra�c Congestion.” 2017. Here.Com. 2017. https://www.here.com/sites/g/�les/odxslz166/�les/2018-
Milakas, D, B van Arem, and B van Wee. 2017. “Policy and Society Related Implications of Automated Driving: A Review of Literature and Directions for FutureResearch.” Ournal of Intelligent Transportation Systems 21 (4): 324–48. https://doi.org/10.1080/15472450.2017.1291351.
Anderson, J.M, K. Nidhi, K.D. Stanley, P Sorensen, C Samaras, and O.A. Oluwatola. 2014. “Autonomous Vehicle Technology: A Guide for Policymakers.” SantaMonica: Rand Corporation.
Brown, A, J Gonder, and B Repac. 2014. “An Analysis of Possible Energy Impacts of Autonomous Vehicles.” Road Vehicle Automation.
Alessandrini, A, A Campagna, P Site Delle, F Filippi, and L Persia. 2015. “Automated Vehicles and the Rethinking of Mobility and Cities.” TransportationResearch Procedia 5: 145–60.
Levine, M.W, and S.D. Boyles. 2015. “Effects of Autonomous Vehicle Ownership on Trip, Mode, and Route Choice.” Transportation Research Record Journal ofthe Transportation Research Board 2493 (1): 29–38.
Harper, D, C Hendrickson, S Mangones, and C Samaras. 2016. “Estimating Potential Increases in Travel with Autonomous Vehicles for the Non-Driving, Elderlyand People with Travel-Restrictive Medical Conditions.” Transport Research Part C 72: 1–9.
Maurer, M, J.C. Gerdes, B. Lenz, and H Winner. 2016. Autonomous Driving. Vol. 10. Berlin: Springer.
Wadud, Z. 2017. “Fully Automated Vehicles. a Cost of Ownership Analysis to Inform Early Adoption.” Transport Research Part A 101: 163–76.
Chan, C Y. 2017. “Advancements, Prospects, and Impacts of Automated Driving Systems.” International Journal of Transportation Science and Technology 6(3): 208–16.
Taiebat, M, A Brown, H.R. Safford, S Qu, and M Xu. 2018. “A Review on Energy, Environmental, and Sustainability Implications of Connected and AutomatedVehicles.” Environmental Science and Technology 52 (20): 11449–65.
Khan, A, C.D. Harper, C.T. Hendrickson, and C Samaras. 2019. “Net-Societal and Net-Private Bene�ts of Some Existing Vehicle Crash Avoidance Technologies.”Accident Analysis & Prevention 125: 207–16.

Page 8/14
Bansal, P, and K Kockelman. 2017. “Forecasting Americans’ Long-Term Adoption of Connected and Autonomous Vehicle Technologies.” Transportation Part A95: 49–63.
Litman, Todd. 2017. “Autonomous Vehicle Implementation Predictions.” Victoria, BC: Victoria Transport Policy Institute.
Godoy, J, J Perez, E Onieva, J Villagra, V Milanes, and R Haber. 2015. “A Driverless Vehicle Demonstration on Motorways and in Urban Environments.”Transport 30 (3): 252–63.
Paden, B, M Čáp, S.Z Yong, D Yershov, and E Frazzoli. 2016. “A Survey of Motion Planning and Control Techniques for Self-Driving Urban Vehicles.” IEEETransactions on Intelligent Transportation Systems 1 (1): 33–55.
Metz ID, David. 2018. “Developing Policy for Urban Autonomous Vehicles: Impact on Congestion.” Urban Science - MDPI 2: 33.
Soteropoulus, A, M Berger, and F Ciari. 2019. “Impacts of Automated Vehicles on Travel Behaviour and Land Use: An International Review of ModellingStudies.” Transport Review 39: 29–49.
2017.12/HERE_How_autonomous_vehicles_could_relieve_or_worsen_tra�c_congestion_white_paper.pdf.
Arbib, James, and Tony Seba. 2017. “Rethinking Transportation 2020-2030.The Disruption of Transportation and the Collapse of the Internal-CombustionVehicle and Oil Industries Disruption, Implications and Choices.” A RethinkX Sector Disruption Report. Rethink Transportation.
Benenson, R, S Petti, T Fraichard, and M Parent. 2008a. “Towards Urban Driverless Vehicles.” International Journal on Vehicle Autonomous System 6 (2): 4–23.
Kyriakidis, M, R Happee, and J.C de Winter. 2015. “Public Opinion on Automated Driving: Results of an International Questionnaire among 5000 Respondents.”Transport Research Part F: Tra�c Psychology Behaviour 32: 127–40.
ICE. 2020. “UK Motorways.” Instituition of Civil Engineers. 2020. https://www.ice.org.uk/what-is-civil-engineering/what-do-civil-engineers-do/uk-motorways.
Gips, P. 1981. “A Behavioural Car-Following Model for Computer Simulation.” Transportation Research Part B: Methodological 15: 105–11.
SAE. 2016. “Taxonomy and De�nitions for Terms Related to Driving Automation Systems for On-Road Motor Vehicles.” 2016.http://standards.sae.org/j3016_201609.
Figures
Figure 1
M62 Motorway (Study Area) Note: *Source - From Micro-simulation conducted in AIMSUN by the author

Page 9/14
Figure 2
Effects of VAN automation on mean speed of different vehicle types along M62
Page 10/14
Figure 3
Effects of VAN automation on total carbon-dioxide emission along M62

Page 11/14
Figure 4
Effects of VAN automation on total Nitrogen-Oxide emission along M62

Page 12/14
Figure 5
Effects of VAN automation on total Particulate Matter emission along M62

Page 13/14
Figure 6
Effects of VAN automation on total VOC emission along M62

Page 14/14
Figure 7
Effects of ALL vehicle automation on Environmental Emission Factors for the motorway M62 (J22 – J28)
Supplementary Files
This is a list of supplementary �les associated with this preprint. Click to download.
AppendixA.docx