analysis of 2015 premium changes in the affordable care
TRANSCRIPT
Analysis of 2015 Premium Changes in the Affordable Care Act’s Health Insurance Marketplaces
Cynthia Cox, Larry Levitt, Gary Claxton, Rosa Ma, Robin Duddy-Tenbrunsel
In the first year of full implementation, enrollment in the Affordable Care Act’s (ACA) health insurance
exchanges largely fulfilled expectations, following a rocky beginning. Now, attention is turning to 2015, and one
of the first tangible tests of how well the ACA is working is how much premiums rise in the new health
insurance marketplaces (also known as exchanges). This tells us how much coverage will cost enrollees and the
federal government, which contributes towards premiums through tax credits for low- and middle-income
people, and could influence public perception of the law as well.
This brief presents an initial analysis of premium changes for marketplace plans for individuals in 15 states
plus the District of Columbia, where we were able to find comprehensive data on rates or rate filings for all
insurers. It follows a similar approach to our September 2013 analysis of 2014 marketplace premiums.
We look at the change in the premium for the lowest-cost options available in each state. Since premiums vary
substantially across geographic rating areas even within a state – there are 500 rating areas nationwide – we
examine premium changes in the rating area that includes a major city in each state.
For each area, we look at premium changes for the lowest-cost bronze plan and the two lowest-cost silver plans.
Bronze plans have an actuarial value of 60%, meaning they cover 60% of enrollees’ health expenses on average
for a typical population. They typically have the highest deductibles and copays and the lowest premiums
(except for catastrophic plans, which are only available to young people and those who have no other affordable
options). Silver plans have an actuarial value of 70%. Most marketplace enrollees (65%) have chosen silver
plans this year, while 20% have chosen bronze, according a report from the federal Department of Health and
Human Services.
The lowest-cost bronze and silver options are particularly noteworthy for a number of reasons:
The lowest-cost bronze plan in an area is generally the least expensive option someone without
employer-based coverage can choose to satisfy the ACA’s requirement to have insurance or pay a
penalty.
The second-lowest-cost silver plan is the benchmark for tax credits provided to people buying in the
marketplaces who have incomes of 100% to 400% of the federal poverty level ($23,850 to $95,400 for a
family of four). Through these tax credits, eligible individuals pay 2% to 9.5% of income on a sliding
Analysis of 2015 Premium Changes in the Affordable Care Act’s Health Insurance Marketplaces 2
scale to enroll in the second-lowest-cost silver plan and the federal government covers the difference.
Tax credits are portable, meaning they can also be used in other marketplace plans. 85% of people
signing up for a plan through the marketplaces are receiving tax credits.
People with incomes up to 250% of the federal poverty level are also eligible for cost-sharing subsidies
that lower their deductibles and copays, but only if they enroll in a silver plan. Therefore, the lowest-
cost silver plan is the option with the lowest premium that gives lower-income individuals access to
cost-sharing subsidies.
People buying coverage in marketplaces this year gravitated towards lower premium plans.
In preparation for open enrollment for coverage in 2015 – which begins November 15 – insurers have filed
rates with state insurance departments. States vary in whether and when they release those filings. Our
analysis is based on the 15 states plus the District of Columbia where we were able to find comprehensive
filings or other information about the rates of the lowest cost plans. Other states have released summary
information, but not sufficient detail to identify the lowest-cost bronze and silver plans. In some cases, rates
are still under review by insurance departments and may change prior to the start of open enrollment.
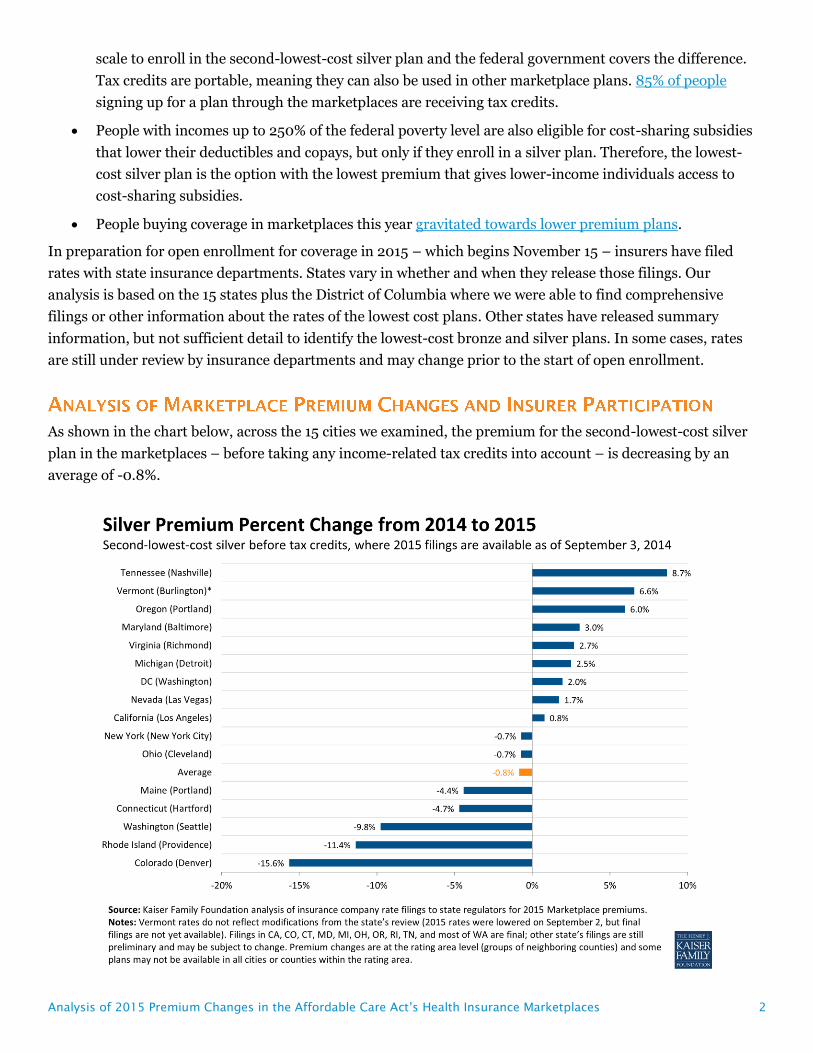
As shown in the chart below, across the 15 cities we examined, the premium for the second-lowest-cost silver
plan in the marketplaces – before taking any income-related tax credits into account – is decreasing by an
average of -0.8%.
Analysis of 2015 Premium Changes in the Affordable Care Act’s Health Insurance Marketplaces 3
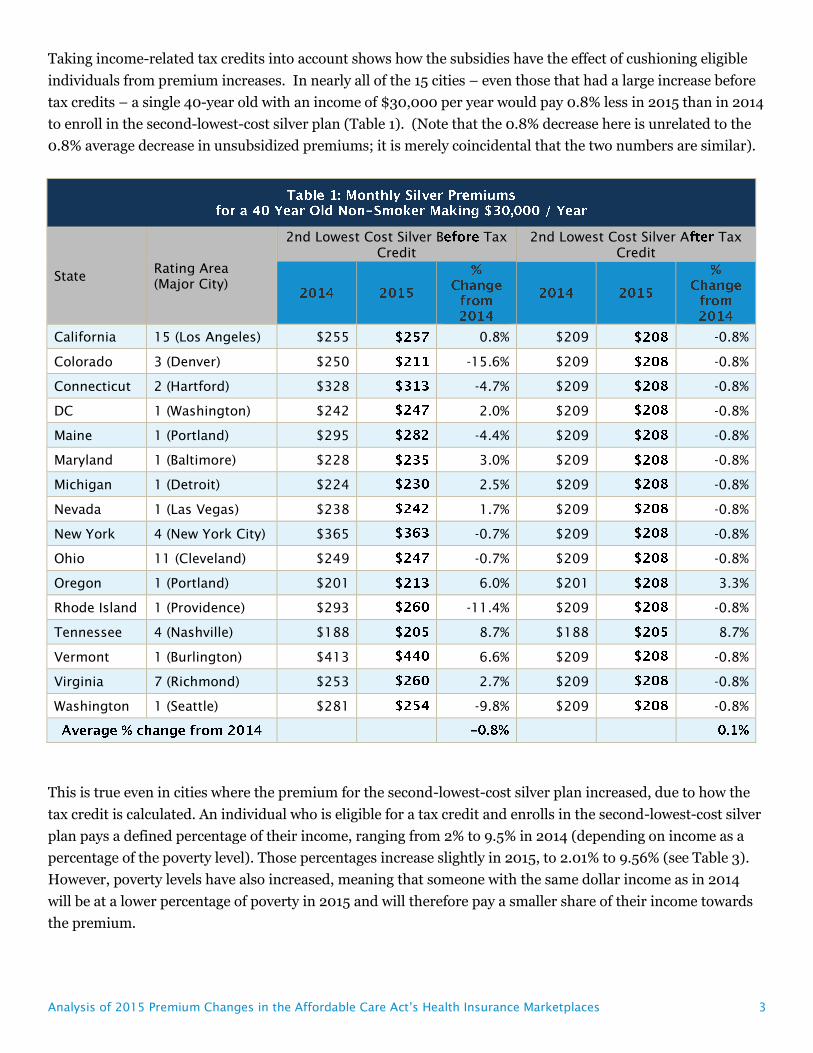
Taking income-related tax credits into account shows how the subsidies have the effect of cushioning eligible
individuals from premium increases. In nearly all of the 15 cities – even those that had a large increase before
tax credits – a single 40-year old with an income of $30,000 per year would pay 0.8% less in 2015 than in 2014
to enroll in the second-lowest-cost silver plan (Table 1). (Note that the 0.8% decrease here is unrelated to the
0.8% average decrease in unsubsidized premiums; it is merely coincidental that the two numbers are similar).
State Rating Area
(Major City)
2nd Lowest Cost Silver B Tax
Credit
2nd Lowest Cost Silver A Tax
Credit
California 15 (Los Angeles) $255 0.8% $209 -0.8%
Colorado 3 (Denver) $250 -15.6% $209 -0.8%
Connecticut 2 (Hartford) $328 -4.7% $209 -0.8%
DC 1 (Washington) $242 2.0% $209 -0.8%
Maine 1 (Portland) $295 -4.4% $209 -0.8%
Maryland 1 (Baltimore) $228 3.0% $209 -0.8%
Michigan 1 (Detroit) $224 2.5% $209 -0.8%
Nevada 1 (Las Vegas) $238 1.7% $209 -0.8%
New York 4 (New York City) $365 -0.7% $209 -0.8%
Ohio 11 (Cleveland) $249 -0.7% $209 -0.8%
Oregon 1 (Portland) $201 6.0% $201 3.3%
Rhode Island 1 (Providence) $293 -11.4% $209 -0.8%
Tennessee 4 (Nashville) $188 8.7% $188 8.7%
Vermont 1 (Burlington) $413 6.6% $209 -0.8%
Virginia 7 (Richmond) $253 2.7% $209 -0.8%
Washington 1 (Seattle) $281 -9.8% $209 -0.8%
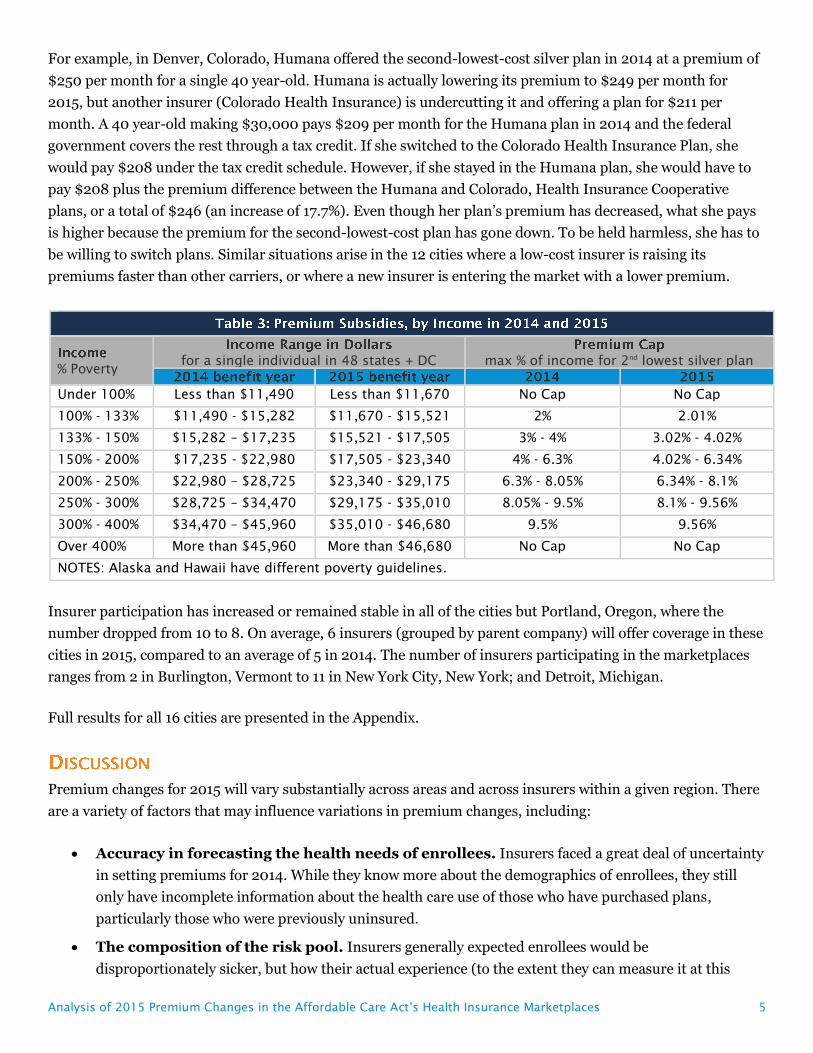
This is true even in cities where the premium for the second-lowest-cost silver plan increased, due to how the
tax credit is calculated. An individual who is eligible for a tax credit and enrolls in the second-lowest-cost silver
plan pays a defined percentage of their income, ranging from 2% to 9.5% in 2014 (depending on income as a
percentage of the poverty level). Those percentages increase slightly in 2015, to 2.01% to 9.56% (see Table 3).
However, poverty levels have also increased, meaning that someone with the same dollar income as in 2014
will be at a lower percentage of poverty in 2015 and will therefore pay a smaller share of their income towards
the premium.

Analysis of 2015 Premium Changes in the Affordable Care Act’s Health Insurance Marketplaces 4
The net result of changes to tax credit calculation and poverty guidelines is that a subsidy-eligible individual
whose income does not change will generally pay a little less to enroll in the second-lowest cost silver plan in
2015 than they did if they enrolled in the second-lowest cost plan in 2014. There are exceptions to this pattern–
e.g., in Portland, Oregon and Nashville, Tennessee – where the premiums in 2014 were so low that a 40 year-
old making $30,000 was not eligible for a tax credit. (An interactive calculator from the Kaiser Family
Foundation provides 2014 premium and tax credit estimates for people in different circumstances by zip code.)
As shown in Table 2, the lowest-cost bronze option across the marketplaces is increasing by an average of 3.3%,
ranging from a low of -15.7% in Hartford, Connecticut to a high of 13.3% in Baltimore, Maryland.
Rating Area
(Major City)
Lowest Bronze
Tax Credit
Lowest Bronze
Tax Credit
% Change
from
2014
% Change
from
2014
California 15 (Los Angeles) $188 11.7% $142 12.9%
Colorado 3 (Denver) $186 -10.0% $145 13.0%
Connecticut 2 (Hartford) $232 -15.7% $113 -19.9%
DC 1 (Washington) $166 8.2% $133 5.4%
Maine 1 (Portland) $235 -9.1% $149 -6.7%
Maryland 1 (Baltimore) $146 13.3% $127 8.4%
Michigan 1 (Detroit) $168 7.8% $153 3.8%
Nevada 1 (Las Vegas) $183 12.5% $154 11.1%
New York 4 (New York City) $307 3.8% $151 8.3%
Ohio 11 (Cleveland) $185 5.5% $146 7.1%
Oregon 1 (Portland) $165 6.1% $165 2.8%
Rhode Island 1 (Providence) $210 -4.4% $126 17.8%
Tennessee 4 (Nashville) $139 10.1% $139 10.1%
Vermont* 1 (Burlington) $336 6.4% $132 -5.5%
Virginia 7 (Richmond) $170 1.7% $126 -4.5%
Washington 1 (Seattle) $186 4.3% $114 29.7%
SOURCE: Kaiser Family Foundation NOTES: Vermont rates do not reflect modifications from the state’s
review. Filings in CA, CO, CT, MD, MI, OH, OR, RI, TN, and most of WA are final; other state’s filings are
still preliminary and may change. Premium changes are at the rating area level.
While the tax credits may cushion the effect of premium increases, subsidized enrollees could still face large
premium increases if they are enrolled in a plan that is no longer a low-cost plan and they fail to switch during
open enrollment. In 12 of the 16 cities, at least one of the insurers that had offered one of the two lowest-cost
silver plans in 2014 is no longer offering a low-cost silver plan in 2015.
Analysis of 2015 Premium Changes in the Affordable Care Act’s Health Insurance Marketplaces 5
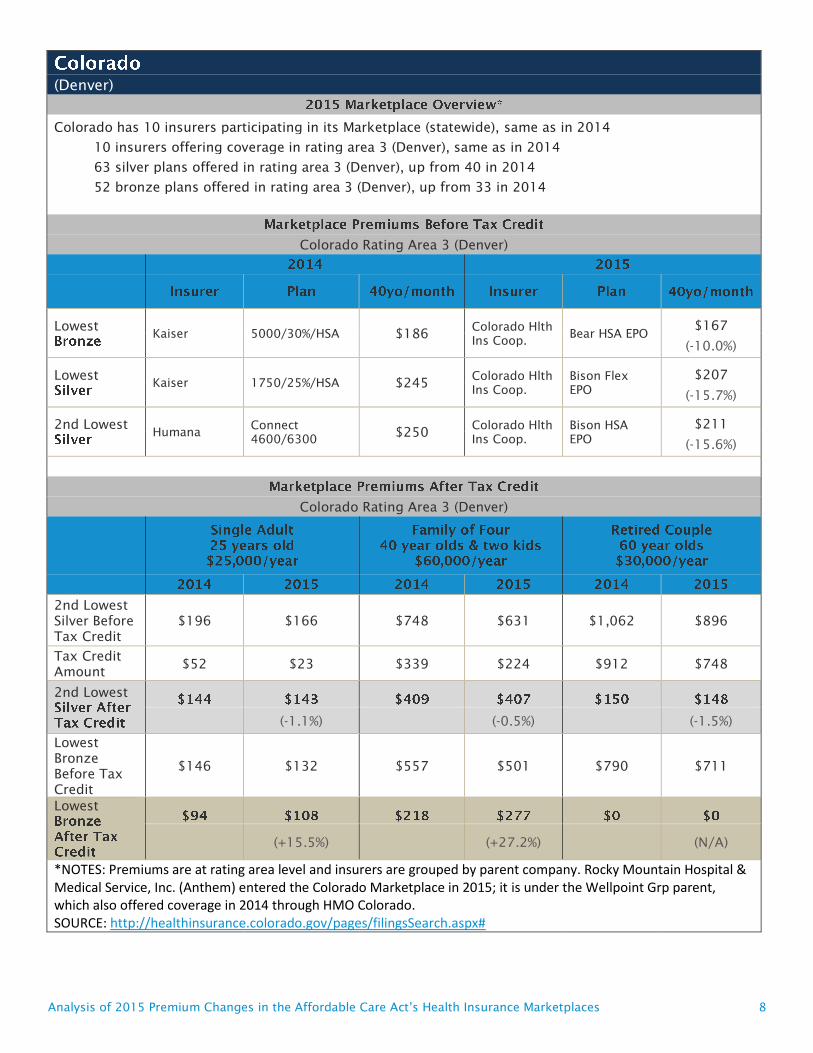
For example, in Denver, Colorado, Humana offered the second-lowest-cost silver plan in 2014 at a premium of
$250 per month for a single 40 year-old. Humana is actually lowering its premium to $249 per month for
2015, but another insurer (Colorado Health Insurance) is undercutting it and offering a plan for $211 per
month. A 40 year-old making $30,000 pays $209 per month for the Humana plan in 2014 and the federal
government covers the rest through a tax credit. If she switched to the Colorado Health Insurance Plan, she
would pay $208 under the tax credit schedule. However, if she stayed in the Humana plan, she would have to
pay $208 plus the premium difference between the Humana and Colorado, Health Insurance Cooperative
plans, or a total of $246 (an increase of 17.7%). Even though her plan’s premium has decreased, what she pays
is higher because the premium for the second-lowest-cost plan has gone down. To be held harmless, she has to
be willing to switch plans. Similar situations arise in the 12 cities where a low-cost insurer is raising its
premiums faster than other carriers, or where a new insurer is entering the market with a lower premium.
Insurer participation has increased or remained stable in all of the cities but Portland, Oregon, where the
number dropped from 10 to 8. On average, 6 insurers (grouped by parent company) will offer coverage in these
cities in 2015, compared to an average of 5 in 2014. The number of insurers participating in the marketplaces
ranges from 2 in Burlington, Vermont to 11 in New York City, New York; and Detroit, Michigan.
Full results for all 16 cities are presented in the Appendix.
Premium changes for 2015 will vary substantially across areas and across insurers within a given region. There
are a variety of factors that may influence variations in premium changes, including:
Accuracy in forecasting the health needs of enrollees. Insurers faced a great deal of uncertainty
in setting premiums for 2014. While they know more about the demographics of enrollees, they still
only have incomplete information about the health care use of those who have purchased plans,
particularly those who were previously uninsured.
The composition of the risk pool. Insurers generally expected enrollees would be
disproportionately sicker, but how their actual experience (to the extent they can measure it at this
% Poverty for a single individual in 48 states + DC max % of income for 2
nd
lowest silver plan
Under 100% Less than $11,490 Less than $11,670 No Cap No Cap
100% - 133% $11,490 - $15,282 $11,670 - $15,521 2% 2.01%
133% - 150% $15,282 – $17,235 $15,521 - $17,505 3% - 4% 3.02% - 4.02%
150% - 200% $17,235 - $22,980 $17,505 - $23,340 4% - 6.3% 4.02% - 6.34%
200% - 250% $22,980 – $28,725 $23,340 - $29,175 6.3% - 8.05% 6.34% - 8.1%
250% - 300% $28,725 – $34,470 $29,175 - $35,010 8.05% - 9.5% 8.1% - 9.56%
300% - 400% $34,470 – $45,960 $35,010 - $46,680 9.5% 9.56%
Over 400% More than $45,960 More than $46,680 No Cap No Cap
NOTES: Alaska and Hawaii have different poverty guidelines.

Analysis of 2015 Premium Changes in the Affordable Care Act’s Health Insurance Marketplaces 6
point) matches up with their expectations will vary. Insurers also vary in how they expect the risk pool
to change as enrollment ramps up in the second year; second-year enrollees are likely to be healthier on
average than those who enrolled in the first year. States where enrollment was strong in the first year
may tend to have risk pools that are more balanced. Conversely, states that permitted non-compliant
plans to continue under a federal transition policy may have less balanced risk pools since healthier-
than-average individuals likely stayed in those non-compliant plans.
Competitive dynamics. Now that insurers have been able to see what their competitors are charging
and how market share is distributed, they are making strategic adjustments in how they price relative to
other carriers.
In general, premium changes for 2015 are quite modest when looking at the low-cost insurers in the
marketplaces, which is where enrollment is concentrated. On average, the premium for the second-lowest-cost
plan is decreasing in the major cities in states with comprehensive public data available. This points to strong
competitive forces in the marketplaces, though still a wide range of experiences, with premium changes for the
second-lowest-cost silver plan ranging from a low of -15.6% to a high of 8.7%. Since tax credits are keyed to the
second-lowest-cost silver plans, this is good news from a budgetary perspective. Our analysis is based on less
than one-third of states, and the overall picture could change as more premium data becomes available.
While competitive forces are often driving premiums down, they are also resulting in significant volatility.
People who were price-conscious and chose low premium plans this year – which was the norm – may find that
their plan is no longer a low-cost option. Income-related tax credits protect low- and middle-income enrollees
from substantial premium increases, but enrollees may need to switch plans to benefit from that protection.
These findings highlight the importance of shopping around for marketplaces enrollees during the next open
enrollment period, which runs from November 15, 2014 to February 15, 2015. While the marketplaces will
auto-renew enrollees in their current plans and generally continue their estimated tax credits at the same level
as in 2014, many enrollees may be able to lower their premiums substantially by switching plans. Effective
communication to enrollees and consumer assistance will be key to helping people understand their options.
Even so, people may be “sticky” in their behavior and reluctant to switch plans, particularly if it requires
changing doctors. How willing people are to switch plans will not only affect what they pay next year, but also
how strong competitive forces are in the future and how much pressure insurers feel to keep premium
increases modest.
Data were collected from health insurer rate filing submitted to state regulators. These submissions are
publicly available for the states we analyzed and can be found on the state websites listed in the Appendix.
Most rate information is available in the form of a SERFF filing (System for Electronic Rate and Form Filing)
that includes a base rate and other factors that build up to an individual rate. In states where filings were
unavailable, we gathered data from tables released by state insurance departments. Filings in DC, ME, NV, NY,
VA, and some in WA are still preliminary and rates for VT do not reflect recent reductions. All premiums in this
analysis are at the rating area level, and some plans may not be available in all cities or counties within the
rating area. Rating areas are typically groups of neighboring counties, so a major city in the area was chosen for
identification purposes.

Analysis of 2015 Premium Changes in the Affordable Care Act’s Health Insurance Marketplaces 7
(Los Angeles)
California has 10 insurers participating in its Marketplace (statewide), down from 11 in 2014
6 insurers offering coverage in rating area 15 (Los Angeles), same as in 2014
7 silver plans offered in rating area 15 (Los Angeles), down from 8 in 2014
9 bronze plans offered in rating area 15 (Los Angeles), same as in 2014
California Rating Area 15 (Los Angeles)
Lowest
L.A. Care 004 Std Coins. $188 Kaiser KP HMO HSA
$210
(+11.7%)
Lowest
Health Net 008 Std Copay $224 Health Net
Health Net
HMO
$230
(+2.7%)
2nd Lowest
Blue Shield of
CA 003 Std Coins. $255 Anthem BC Anthem HMO
$257
(+0.8%)
California Rating Area 15 (Los Angeles)
2nd Lowest
Silver Before
Tax Credit
$200 $202 $763 $769 $1,083 $1,092
Tax Credit
Amount $56 $59 $354 $362 $933 $944
2nd Lowest
(-1.1%) (-0.5%) (-1.5%)
Lowest
Bronze
Before Tax
Credit
$148 $165 $563 $629 $798 $892
Lowest
(+15.5%) (+27.6%) (N/A)
*NOTES: Premiums are at rating area level and insurers are grouped by parent company. Contra Costa Health Plan left the CA Marketplace in 2015. SOURCE: http://www.coveredca.com/PDFs/CC-health-plans-booklet-2015.pdf
Analysis of 2015 Premium Changes in the Affordable Care Act’s Health Insurance Marketplaces 8
(Denver)
Colorado has 10 insurers participating in its Marketplace (statewide), same as in 2014
10 insurers offering coverage in rating area 3 (Denver), same as in 2014
63 silver plans offered in rating area 3 (Denver), up from 40 in 2014
52 bronze plans offered in rating area 3 (Denver), up from 33 in 2014
Colorado Rating Area 3 (Denver)
Lowest
Kaiser 5000/30%/HSA $186
Colorado Hlth
Ins Coop. Bear HSA EPO
$167
(-10.0%)
Lowest
Kaiser 1750/25%/HSA $245
Colorado Hlth
Ins Coop.
Bison Flex
EPO
$207
(-15.7%)
2nd Lowest
Humana
Connect
4600/6300 $250
Colorado Hlth
Ins Coop.
Bison HSA
EPO
$211
(-15.6%)
Colorado Rating Area 3 (Denver)
2nd Lowest
Silver Before
Tax Credit
$196 $166 $748 $631 $1,062 $896
Tax Credit
Amount $52 $23 $339 $224 $912 $748
2nd Lowest
(-1.1%) (-0.5%) (-1.5%)
Lowest
Bronze
Before Tax
Credit
$146 $132 $557 $501 $790 $711
Lowest
(+15.5%) (+27.2%) (N/A)
*NOTES: Premiums are at rating area level and insurers are grouped by parent company. Rocky Mountain Hospital & Medical Service, Inc. (Anthem) entered the Colorado Marketplace in 2015; it is under the Wellpoint Grp parent, which also offered coverage in 2014 through HMO Colorado. SOURCE: http://healthinsurance.colorado.gov/pages/filingsSearch.aspx#
Analysis of 2015 Premium Changes in the Affordable Care Act’s Health Insurance Marketplaces 9
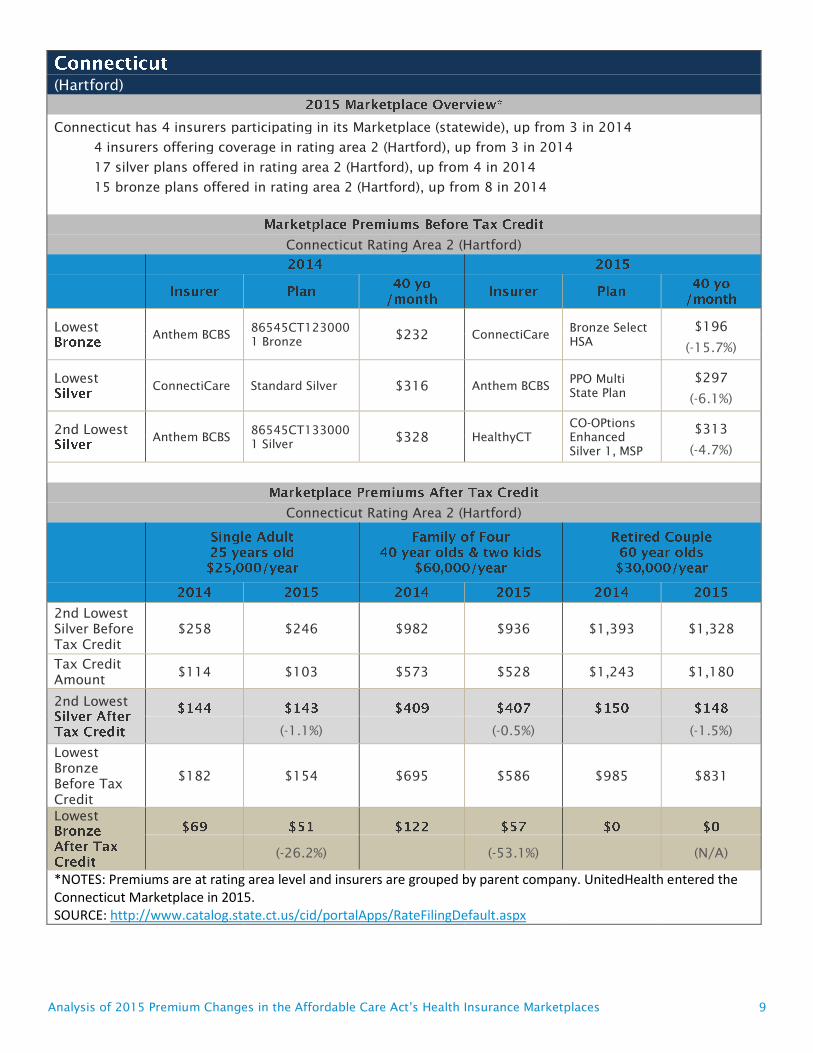
(Hartford)
Connecticut has 4 insurers participating in its Marketplace (statewide), up from 3 in 2014
4 insurers offering coverage in rating area 2 (Hartford), up from 3 in 2014
17 silver plans offered in rating area 2 (Hartford), up from 4 in 2014
15 bronze plans offered in rating area 2 (Hartford), up from 8 in 2014
Connecticut Rating Area 2 (Hartford)
Lowest
Anthem BCBS
86545CT123000
1 Bronze $232 ConnectiCare
Bronze Select
HSA
$196
(-15.7%)
Lowest
ConnectiCare Standard Silver $316 Anthem BCBS
PPO Multi
State Plan
$297
(-6.1%)
2nd Lowest
Anthem BCBS
86545CT133000
1 Silver $328 HealthyCT
CO-OPtions
Enhanced
Silver 1, MSP
$313
(-4.7%)
Connecticut Rating Area 2 (Hartford)
2nd Lowest
Silver Before
Tax Credit
$258 $246 $982 $936 $1,393 $1,328
Tax Credit
Amount $114 $103 $573 $528 $1,243 $1,180
2nd Lowest
(-1.1%) (-0.5%) (-1.5%)
Lowest
Bronze
Before Tax
Credit
$182 $154 $695 $586 $985 $831
Lowest
(-26.2%) (-53.1%) (N/A)
*NOTES: Premiums are at rating area level and insurers are grouped by parent company. UnitedHealth entered the Connecticut Marketplace in 2015. SOURCE: http://www.catalog.state.ct.us/cid/portalApps/RateFilingDefault.aspx
Analysis of 2015 Premium Changes in the Affordable Care Act’s Health Insurance Marketplaces 10
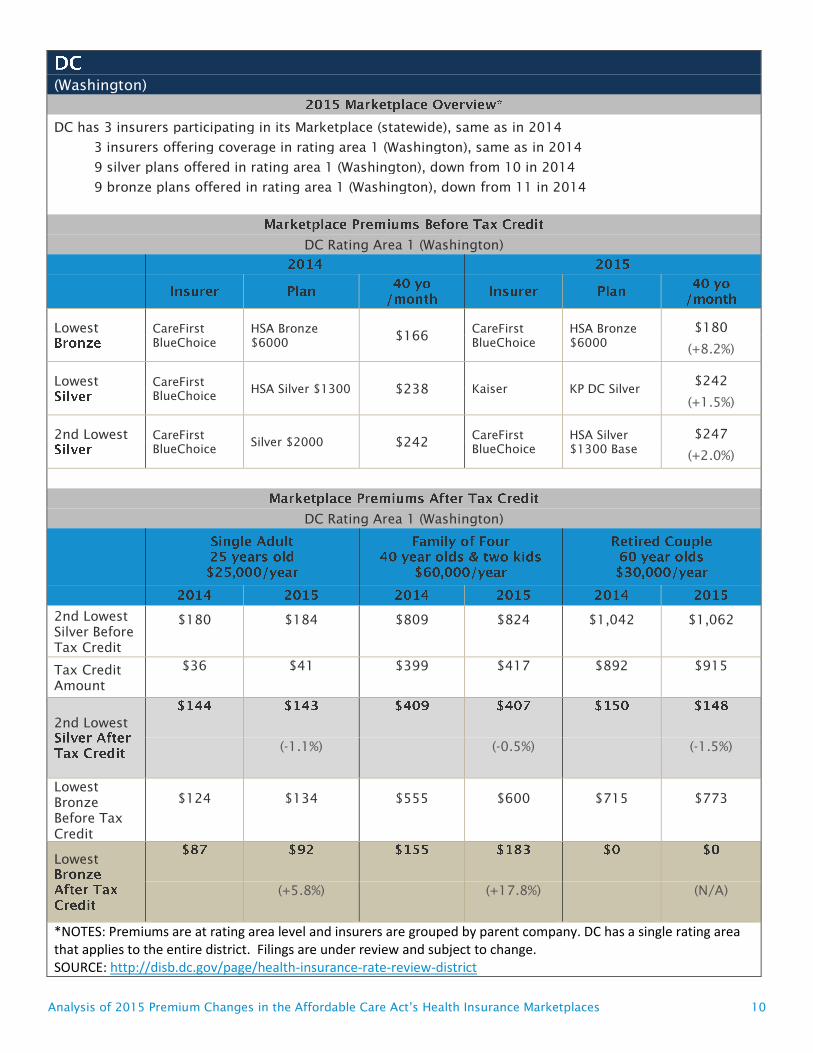
(Washington)
DC has 3 insurers participating in its Marketplace (statewide), same as in 2014
3 insurers offering coverage in rating area 1 (Washington), same as in 2014
9 silver plans offered in rating area 1 (Washington), down from 10 in 2014
9 bronze plans offered in rating area 1 (Washington), down from 11 in 2014
DC Rating Area 1 (Washington)
Lowest
CareFirst
BlueChoice
HSA Bronze
$6000 $166
CareFirst
BlueChoice
HSA Bronze
$6000
$180
(+8.2%)
Lowest
CareFirst
BlueChoice HSA Silver $1300 $238 Kaiser KP DC Silver
$242
(+1.5%)
2nd Lowest
CareFirst
BlueChoice Silver $2000 $242
CareFirst
BlueChoice
HSA Silver
$1300 Base
$247
(+2.0%)
DC Rating Area 1 (Washington)
2nd Lowest
Silver Before
Tax Credit
$180 $184 $809 $824 $1,042 $1,062
Tax Credit
Amount
$36 $41 $399 $417 $892 $915
2nd Lowest
(-1.1%) (-0.5%)
(-1.5%)
Lowest
Bronze
Before Tax
Credit
$124 $134 $555 $600 $715 $773
Lowest
(+5.8%) (+17.8%) (N/A)
*NOTES: Premiums are at rating area level and insurers are grouped by parent company. DC has a single rating area that applies to the entire district. Filings are under review and subject to change. SOURCE: http://disb.dc.gov/page/health-insurance-rate-review-district

Analysis of 2015 Premium Changes in the Affordable Care Act’s Health Insurance Marketplaces 11
(Portland)
Maine has 3 insurers participating in its Marketplace (statewide), up from 2 in 2014
3 insurers offering coverage in rating area 1 (Portland), up from 2 in 2014
12 silver plans offered in rating area 1 (Portland), up from 6 in 2014
9 bronze plans offered in rating area 1 (Portland), up from 7 in 2014
Maine Rating Area 1 (Portland)
Lowest
Anthem
Bronze Guided
Access - caaa $235 Anthem
Bronze X HMO
0% for HSA
$213
(-9.1%)
Lowest
Maine
Community
Health
Options
Community
Value $284 Anthem
Silver X HMO
3500/20%
$269
(-5.2%)
2nd Lowest
Maine
Community
Health
Options
Community
Choice $295
Maine
Community
Health
Options
Community
Value
$282
(-4.4%)
Maine Rating Area 1 (Portland)
2nd Lowest
Silver Before
Tax Credit
$232 $221 $883 $844 $1,253 $1,197
Tax Credit
Amount $88 $79 $474 $437 $1,103 $1,050
2nd Lowest
(-1.1%) (-0.5%) (-1.5%)
Lowest
Bronze
Before Tax
Credit
$184 $168 $702 $639 $997 $906
Lowest
(-8.4%) (-11.8%) (N/A)
*NOTES: Premiums are at rating area level and insurers are grouped by parent company. Harvard Pilgrim entered the Maine Marketplace in 2015. Filings are under review and subject to change. SOURCE: http://www.maine.gov/pfr/insurance/PPACA/HFAI.htm#
Analysis of 2015 Premium Changes in the Affordable Care Act’s Health Insurance Marketplaces 12
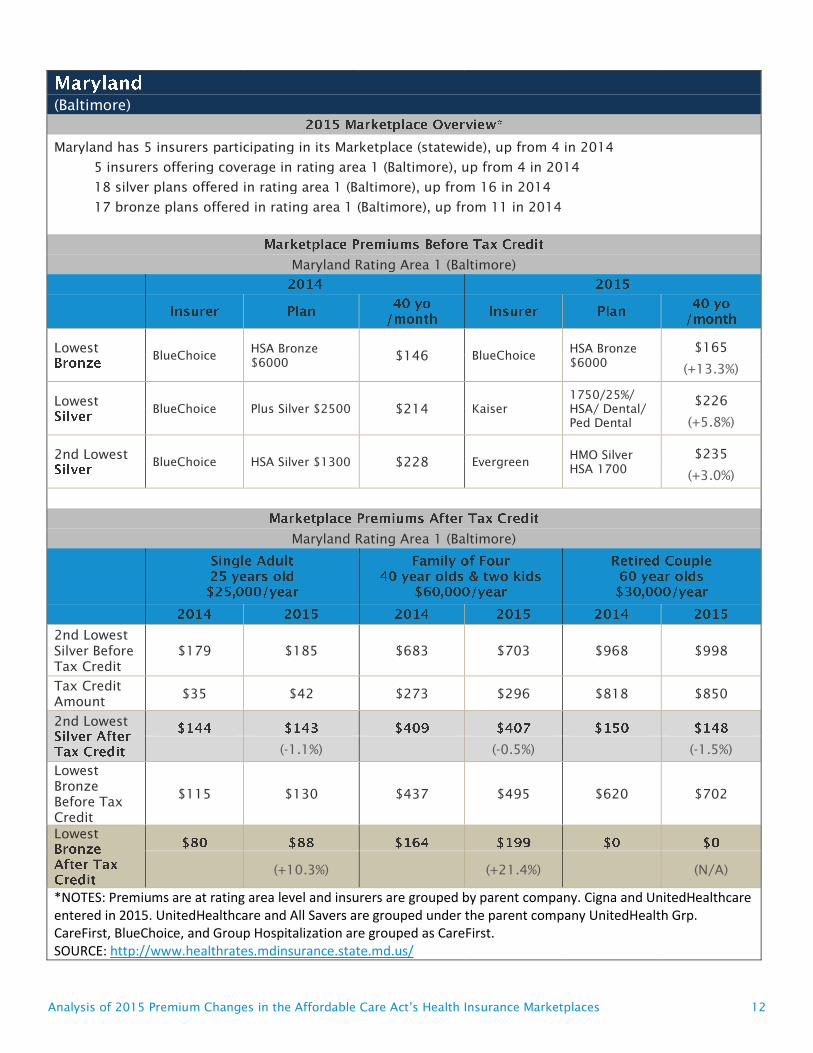
(Baltimore)
Maryland has 5 insurers participating in its Marketplace (statewide), up from 4 in 2014
5 insurers offering coverage in rating area 1 (Baltimore), up from 4 in 2014
18 silver plans offered in rating area 1 (Baltimore), up from 16 in 2014
17 bronze plans offered in rating area 1 (Baltimore), up from 11 in 2014
Maryland Rating Area 1 (Baltimore)
Lowest
BlueChoice
HSA Bronze
$6000 $146 BlueChoice
HSA Bronze
$6000
$165
(+13.3%)
Lowest
BlueChoice Plus Silver $2500 $214 Kaiser
1750/25%/
HSA/ Dental/
Ped Dental
$226
(+5.8%)
2nd Lowest
BlueChoice HSA Silver $1300 $228 Evergreen
HMO Silver
HSA 1700
$235
(+3.0%)
Maryland Rating Area 1 (Baltimore)
2nd Lowest
Silver Before
Tax Credit
$179 $185 $683 $703 $968 $998
Tax Credit
Amount $35 $42 $273 $296 $818 $850
2nd Lowest
(-1.1%) (-0.5%) (-1.5%)
Lowest
Bronze
Before Tax
Credit
$115 $130 $437 $495 $620 $702
Lowest
(+10.3%) (+21.4%) (N/A)
*NOTES: Premiums are at rating area level and insurers are grouped by parent company. Cigna and UnitedHealthcare entered in 2015. UnitedHealthcare and All Savers are grouped under the parent company UnitedHealth Grp. CareFirst, BlueChoice, and Group Hospitalization are grouped as CareFirst. SOURCE: http://www.healthrates.mdinsurance.state.md.us/
Analysis of 2015 Premium Changes in the Affordable Care Act’s Health Insurance Marketplaces 13
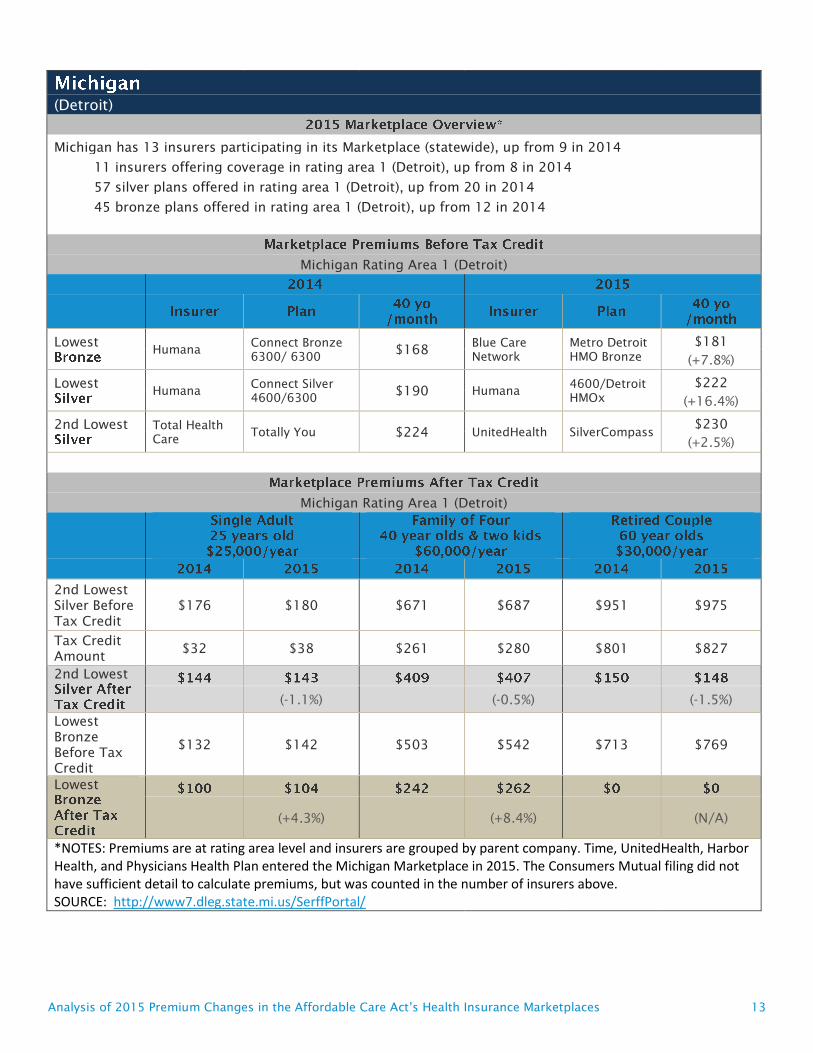
(Detroit)
Michigan has 13 insurers participating in its Marketplace (statewide), up from 9 in 2014
11 insurers offering coverage in rating area 1 (Detroit), up from 8 in 2014
57 silver plans offered in rating area 1 (Detroit), up from 20 in 2014
45 bronze plans offered in rating area 1 (Detroit), up from 12 in 2014
Michigan Rating Area 1 (Detroit)
Lowest
Humana
Connect Bronze
6300/ 6300 $168
Blue Care
Network
Metro Detroit
HMO Bronze
$181
(+7.8%)
Lowest
Humana
Connect Silver
4600/6300 $190 Humana
4600/Detroit
HMOx
$222
(+16.4%)
2nd Lowest
Total Health
Care Totally You $224 UnitedHealth SilverCompass
$230
(+2.5%)
Michigan Rating Area 1 (Detroit)
2nd Lowest
Silver Before
Tax Credit
$176 $180 $671 $687 $951 $975
Tax Credit
Amount $32 $38 $261 $280 $801 $827
2nd Lowest
(-1.1%) (-0.5%) (-1.5%)
Lowest
Bronze
Before Tax
Credit
$132 $142 $503 $542 $713 $769
Lowest
(+4.3%) (+8.4%) (N/A)
*NOTES: Premiums are at rating area level and insurers are grouped by parent company. Time, UnitedHealth, Harbor Health, and Physicians Health Plan entered the Michigan Marketplace in 2015. The Consumers Mutual filing did not have sufficient detail to calculate premiums, but was counted in the number of insurers above. SOURCE: http://www7.dleg.state.mi.us/SerffPortal/

Analysis of 2015 Premium Changes in the Affordable Care Act’s Health Insurance Marketplaces 14
(Las Vegas)
Nevada has 5 insurers participating in its Marketplace (statewide), up from 4 in 2014
4 insurers offering coverage in rating area 1 (Las Vegas), up from 3 in 2014
18 silver plans offered in rating area 1 (Las Vegas), up from 16 in 2014
13 bronze plans offered in rating area 1 (Las Vegas), up from 11 in 2014
Nevada Rating Area 1 (Las Vegas)
Lowest
Nevada Health
CO-OP Southern Simple $183
Nevada
Health CO-OP
Southern
Simple
$206
(+12.5%)
Lowest
Health Plan of
Nevada MyHPN Silver 4 $237
Health Plan of
Nevada
MyHPN Silver
5
$241
(+1.9%)
2nd Lowest
Health Plan of
Nevada MyHPN Silver 3 $238
Health Plan of
Nevada
MyHPN Silver
3
$242
(+1.7%)
Nevada Rating Area 1 (Las Vegas)
2nd Lowest
Silver Before
Tax Credit
$187 $190 $713 $725 $1,011 $1,028
Tax Credit
Amount $43 $48 $303 $317 $861 $881
2nd Lowest
(-1.1%) (-0.5%) (-1.5%)
Lowest
Bronze
Before Tax
Credit
$144 $162 $548 $616 $777 $874
Lowest
(+13.0%) (+22.0%) (N/A)
*NOTES: Premiums are at rating area level and insurers are grouped by parent company. Assurant Inc. (Time) entered in 2015 and Nevada Health CO-OP expanded offerings by adding a Multi-State plan. Filings are under review and subject to change. SOURCE: http://doi.nv.gov/Health-Rate-Review/Review-Process/

Analysis of 2015 Premium Changes in the Affordable Care Act’s Health Insurance Marketplaces 15
(New York City)
New York has 15 insurers participating in its Marketplace (statewide), down from 16 in 2014
11 insurers offering coverage in rating area 4 (New York City), same as in 2014
55 silver plans offered in rating area 4 (New York City), up from 44 in 2014
45 bronze plans offered in rating area 4 (New York City)
New York Rating Area 4 (New York City)
Lowest
Health
Republic Bronze Standard $307
Health
Republic
Active Living
Basic (Bronze)
$319
(+3.8%)
Lowest
MetroPlus
Health Plan
NYHX Indiv St
Silver with Ped
Dental
$359 Health
Republic
Active Living
Plus (Silver)
$363
(+1.0%)
2nd Lowest
Health
Republic
NYHX Indiv NS
Silver 2 $365
Health
Republic
Active Living
Plus (Silver)
Age 29
Option
$363
(-0.7%)
New York Rating Area 4 (New York City)
2nd Lowest
Silver Before
Tax Credit
$365 $363 $1,041 $1,034 $731 $725
Tax Credit
Amount
$221 $220 $632 $626 $581 $578
2nd Lowest
(-1.1%) (-0.5%) (-1.5%)
Lowest
Bronze
Before Tax
Credit
$307 $319 $875.29 $908 $1,304 $1,354
Lowest
(+14.7%) (+15.7%) (+7.2%)
*NOTES: Premiums are at rating area level and insurers are grouped by parent company. Universal American exited. Family of four scenario does not reflect CHIP premiums. Filings are under review and subject to change. SOURCE: https://myportal.dfs.ny.gov/web/prior-approval/rate-applications-by-company
Analysis of 2015 Premium Changes in the Affordable Care Act’s Health Insurance Marketplaces 16
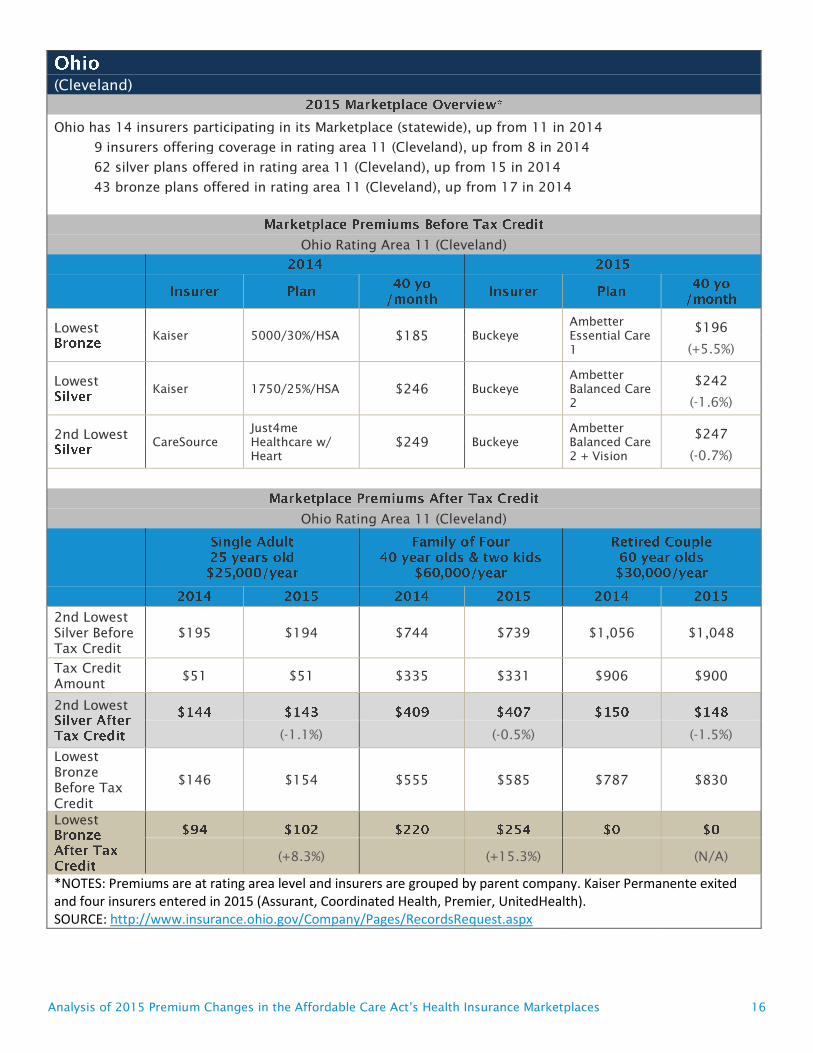
(Cleveland)
Ohio has 14 insurers participating in its Marketplace (statewide), up from 11 in 2014
9 insurers offering coverage in rating area 11 (Cleveland), up from 8 in 2014
62 silver plans offered in rating area 11 (Cleveland), up from 15 in 2014
43 bronze plans offered in rating area 11 (Cleveland), up from 17 in 2014
Ohio Rating Area 11 (Cleveland)
Lowest
Kaiser 5000/30%/HSA $185 Buckeye
Ambetter
Essential Care
1
$196
(+5.5%)
Lowest
Kaiser 1750/25%/HSA $246 Buckeye
Ambetter
Balanced Care
2
$242
(-1.6%)
2nd Lowest
CareSource
Just4me
Healthcare w/
Heart
$249 Buckeye
Ambetter
Balanced Care
2 + Vision
$247
(-0.7%)
Ohio Rating Area 11 (Cleveland)
2nd Lowest
Silver Before
Tax Credit
$195 $194 $744 $739 $1,056 $1,048
Tax Credit
Amount $51 $51 $335 $331 $906 $900
2nd Lowest
(-1.1%) (-0.5%) (-1.5%)
Lowest
Bronze
Before Tax
Credit
$146 $154 $555 $585 $787 $830
Lowest
(+8.3%) (+15.3%) (N/A)
*NOTES: Premiums are at rating area level and insurers are grouped by parent company. Kaiser Permanente exited and four insurers entered in 2015 (Assurant, Coordinated Health, Premier, UnitedHealth). SOURCE: http://www.insurance.ohio.gov/Company/Pages/RecordsRequest.aspx

Analysis of 2015 Premium Changes in the Affordable Care Act’s Health Insurance Marketplaces 17
(Portland)
Oregon has 10 insurers participating in its Marketplace (statewide), down from 11 in 2014
8 insurers offering coverage in rating area 1 (Portland), down from 10 in 2014
40 silver plans offered in rating area 1 (Portland), up from 32 in 2014
31 bronze plans offered in rating area 1 (Portland), up from 27 in 2014
Oregon Rating Area 1 (Portland)
Lowest
Moda Be Savvy $165 LifeWise
Exclusive
Provider
Bronze 5250
HSA
$175
(+6.1%)
Lowest
Moda
Be Aligned –
Rose City $194 Providence
Connect 2000
Silver
$212
(+9.4%)
2nd Lowest
Moda Be Aligned $201 Moda
Be Aligned -
Rose City
$213
(+6.0%)
Oregon Rating Area 1 (Portland)
2nd Lowest
Silver Before
Tax Credit
$158 $167 $602 $638 $854 $905
Tax Credit
Amount $14 $25 $192 $230 $704 $757
2nd Lowest
(-1.1%) (-0.5%) (-1.5%)
Lowest
Bronze
Before Tax
Credit
$130 $137 $494 $524 $701 $743
Lowest
(-2.7%) (-2.7%) (N/A)
*NOTES: Premiums are at rating area level and insurers are grouped by parent company. HealthNet exited the Oregon Marketplace in 2015. SOURCE: http://www.oregonhealthrates.org/
Analysis of 2015 Premium Changes in the Affordable Care Act’s Health Insurance Marketplaces 18
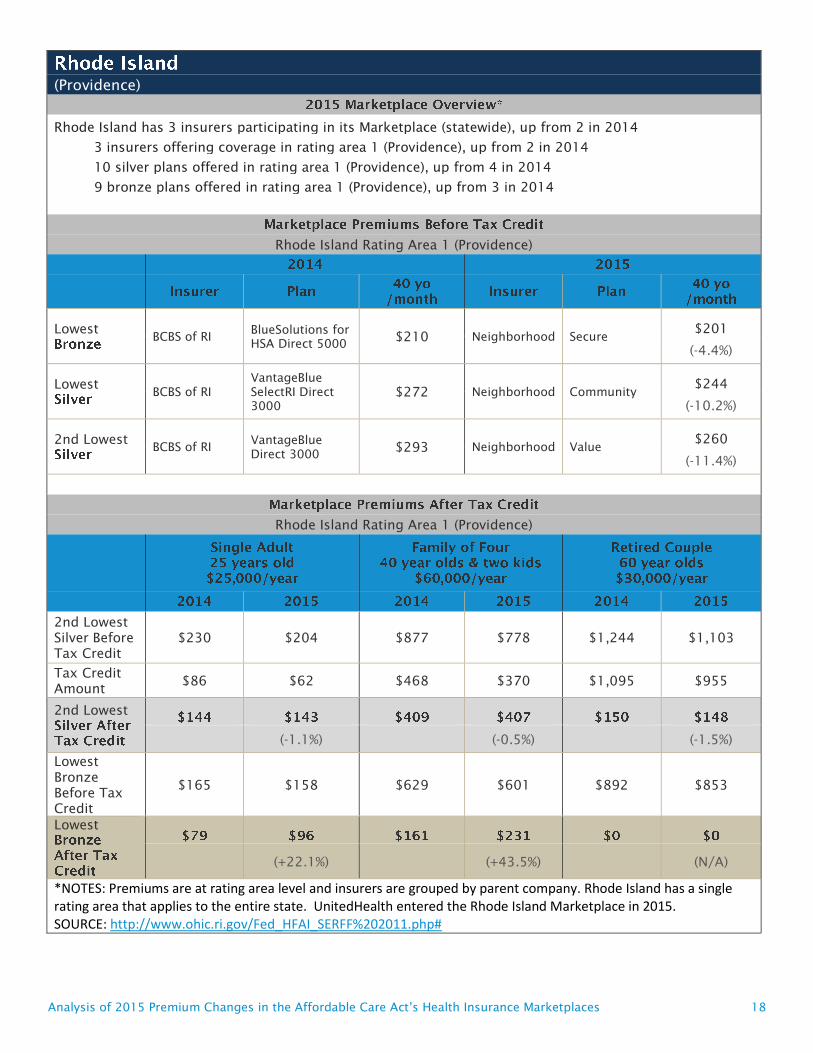
(Providence)
Rhode Island has 3 insurers participating in its Marketplace (statewide), up from 2 in 2014
3 insurers offering coverage in rating area 1 (Providence), up from 2 in 2014
10 silver plans offered in rating area 1 (Providence), up from 4 in 2014
9 bronze plans offered in rating area 1 (Providence), up from 3 in 2014
Rhode Island Rating Area 1 (Providence)
Lowest
BCBS of RI
BlueSolutions for
HSA Direct 5000 $210 Neighborhood Secure
$201
(-4.4%)
Lowest
BCBS of RI
VantageBlue
SelectRI Direct
3000
$272 Neighborhood Community $244
(-10.2%)
2nd Lowest
BCBS of RI
VantageBlue
Direct 3000 $293 Neighborhood Value
$260
(-11.4%)
Rhode Island Rating Area 1 (Providence)
2nd Lowest
Silver Before
Tax Credit
$230 $204 $877 $778 $1,244 $1,103
Tax Credit
Amount $86 $62 $468 $370 $1,095 $955
2nd Lowest
(-1.1%) (-0.5%) (-1.5%)
Lowest
Bronze
Before Tax
Credit
$165 $158 $629 $601 $892 $853
Lowest
(+22.1%) (+43.5%) (N/A)
*NOTES: Premiums are at rating area level and insurers are grouped by parent company. Rhode Island has a single rating area that applies to the entire state. UnitedHealth entered the Rhode Island Marketplace in 2015. SOURCE: http://www.ohic.ri.gov/Fed_HFAI_SERFF%202011.php#
Analysis of 2015 Premium Changes in the Affordable Care Act’s Health Insurance Marketplaces 19
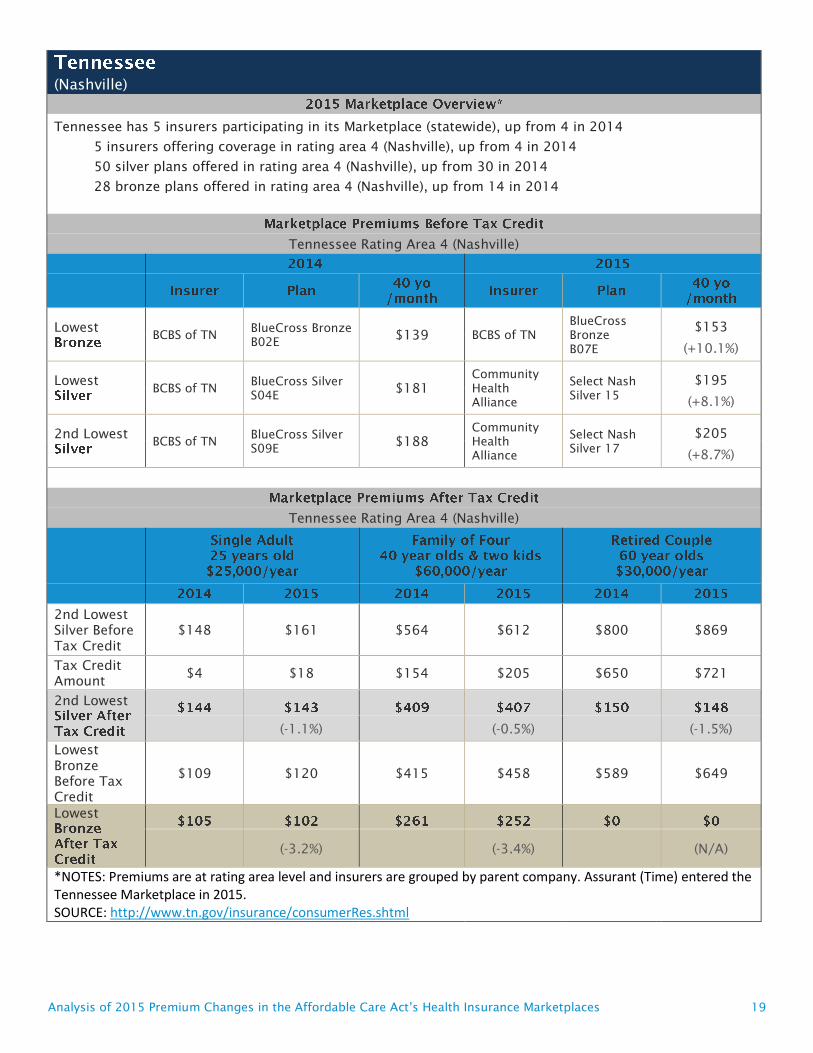
(Nashville)
Tennessee has 5 insurers participating in its Marketplace (statewide), up from 4 in 2014
5 insurers offering coverage in rating area 4 (Nashville), up from 4 in 2014
50 silver plans offered in rating area 4 (Nashville), up from 30 in 2014
28 bronze plans offered in rating area 4 (Nashville), up from 14 in 2014
Tennessee Rating Area 4 (Nashville)
Lowest
BCBS of TN
BlueCross Bronze
B02E $139 BCBS of TN
BlueCross
Bronze
B07E
$153
(+10.1%)
Lowest
BCBS of TN
BlueCross Silver
S04E $181
Community
Health
Alliance
Select Nash
Silver 15
$195
(+8.1%)
2nd Lowest
BCBS of TN
BlueCross Silver
S09E $188
Community
Health
Alliance
Select Nash
Silver 17
$205
(+8.7%)
Tennessee Rating Area 4 (Nashville)
2nd Lowest
Silver Before
Tax Credit
$148 $161 $564 $612 $800 $869
Tax Credit
Amount $4 $18 $154 $205 $650 $721
2nd Lowest
(-1.1%) (-0.5%) (-1.5%)
Lowest
Bronze
Before Tax
Credit
$109 $120 $415 $458 $589 $649
Lowest
(-3.2%) (-3.4%) (N/A)
*NOTES: Premiums are at rating area level and insurers are grouped by parent company. Assurant (Time) entered the Tennessee Marketplace in 2015. SOURCE: http://www.tn.gov/insurance/consumerRes.shtml
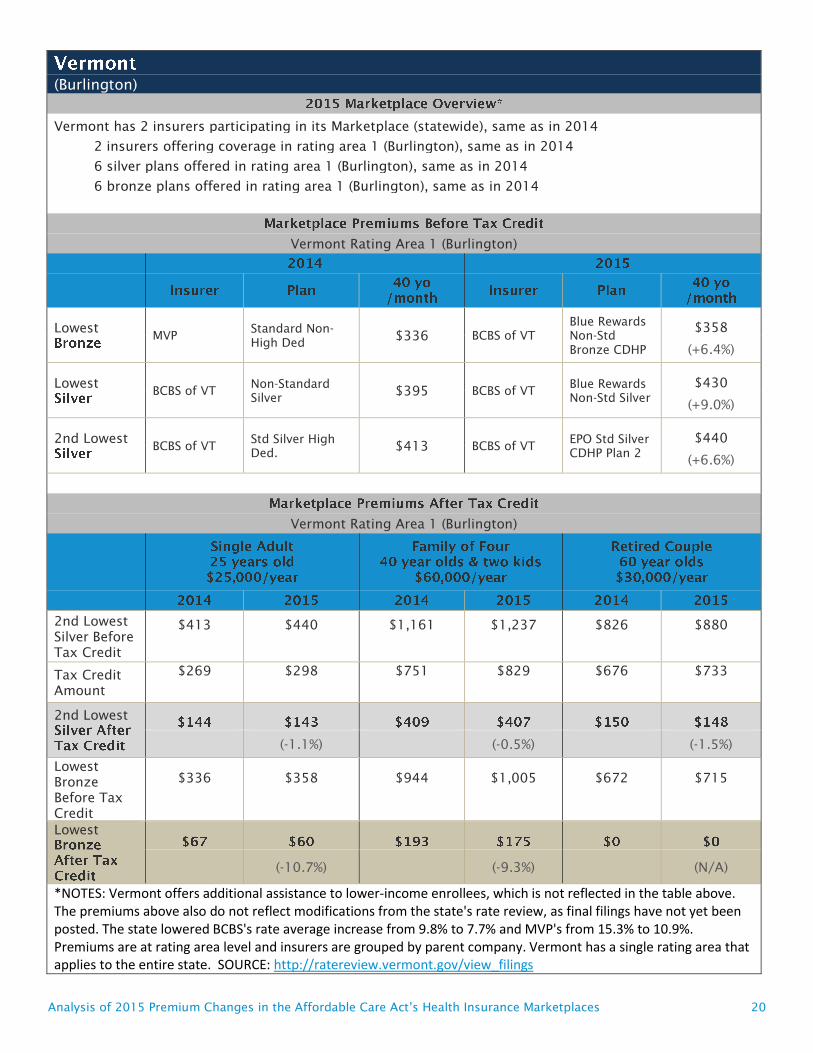
Analysis of 2015 Premium Changes in the Affordable Care Act’s Health Insurance Marketplaces 20
(Burlington)
Vermont has 2 insurers participating in its Marketplace (statewide), same as in 2014
2 insurers offering coverage in rating area 1 (Burlington), same as in 2014
6 silver plans offered in rating area 1 (Burlington), same as in 2014
6 bronze plans offered in rating area 1 (Burlington), same as in 2014
Vermont Rating Area 1 (Burlington)
Lowest
MVP
Standard Non-
High Ded $336 BCBS of VT
Blue Rewards
Non-Std
Bronze CDHP
$358
(+6.4%)
Lowest
BCBS of VT
Non-Standard
Silver $395 BCBS of VT
Blue Rewards
Non-Std Silver
$430
(+9.0%)
2nd Lowest
BCBS of VT
Std Silver High
Ded. $413 BCBS of VT
EPO Std Silver
CDHP Plan 2
$440
(+6.6%)
Vermont Rating Area 1 (Burlington)
2nd Lowest
Silver Before
Tax Credit
$413 $440 $1,161 $1,237 $826 $880
Tax Credit
Amount
$269 $298 $751 $829 $676 $733
2nd Lowest
(-1.1%) (-0.5%) (-1.5%)
Lowest
Bronze
Before Tax
Credit
$336 $358 $944 $1,005 $672 $715
Lowest
(-10.7%) (-9.3%) (N/A)
*NOTES: Vermont offers additional assistance to lower-income enrollees, which is not reflected in the table above. The premiums above also do not reflect modifications from the state's rate review, as final filings have not yet been posted. The state lowered BCBS's rate average increase from 9.8% to 7.7% and MVP's from 15.3% to 10.9%. Premiums are at rating area level and insurers are grouped by parent company. Vermont has a single rating area that applies to the entire state. SOURCE: http://ratereview.vermont.gov/view_filings
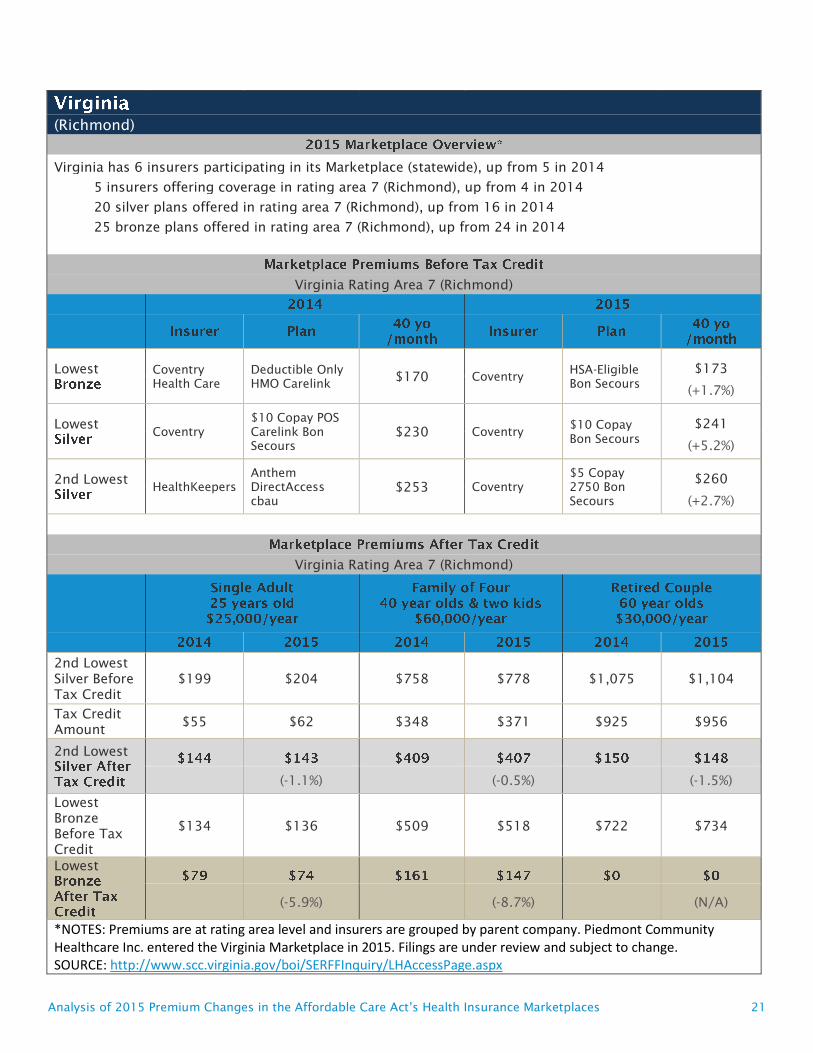
Analysis of 2015 Premium Changes in the Affordable Care Act’s Health Insurance Marketplaces 21
(Richmond)
Virginia has 6 insurers participating in its Marketplace (statewide), up from 5 in 2014
5 insurers offering coverage in rating area 7 (Richmond), up from 4 in 2014
20 silver plans offered in rating area 7 (Richmond), up from 16 in 2014
25 bronze plans offered in rating area 7 (Richmond), up from 24 in 2014
Virginia Rating Area 7 (Richmond)
Lowest
Coventry
Health Care
Deductible Only
HMO Carelink $170 Coventry
HSA-Eligible
Bon Secours
$173
(+1.7%)
Lowest
Coventry
$10 Copay POS
Carelink Bon
Secours
$230 Coventry $10 Copay
Bon Secours
$241
(+5.2%)
2nd Lowest
HealthKeepers
Anthem
DirectAccess
cbau
$253 Coventry
$5 Copay
2750 Bon
Secours
$260
(+2.7%)
Virginia Rating Area 7 (Richmond)
2nd Lowest
Silver Before
Tax Credit
$199 $204 $758 $778 $1,075 $1,104
Tax Credit
Amount $55 $62 $348 $371 $925 $956
2nd Lowest
(-1.1%) (-0.5%) (-1.5%)
Lowest
Bronze
Before Tax
Credit
$134 $136 $509 $518 $722 $734
Lowest
(-5.9%) (-8.7%) (N/A)
*NOTES: Premiums are at rating area level and insurers are grouped by parent company. Piedmont Community Healthcare Inc. entered the Virginia Marketplace in 2015. Filings are under review and subject to change. SOURCE: http://www.scc.virginia.gov/boi/SERFFInquiry/LHAccessPage.aspx

(Seattle)
Washington has 11 insurers participating in its Marketplace (statewide), up from 7 in 2014
8 insurers offering coverage in rating area 1 (Seattle), up from 6 in 2014
28 silver plans offered in rating area 1 (Seattle), up from 14 in 2014
26 bronze plans offered in rating area 1 (Seattle), up from 13 in 2014
Washington Rating Area 1 (Seattle)
Lowest
Coordinated
Care Ambetter Bronze $186
Coordinated
Care
Ambetter
Essential Care
$194
(+4.3%)
Lowest
Coordinated
Care Ambetter Silver $245
Coordinated
Care
Ambetter
Balanced Care
$235
(-4.2%)
2nd Lowest
Group Health
Cooperative Core Silver $281 BridgeSpan
HSA UW
Medicine
$254
(-9.8%)
Washington Rating Area 1 (Seattle)
2nd Lowest
Silver Before
Tax Credit
$221 $199 $841 $759 $1,193 $1,077
Tax Credit
Amount $77 $57 $432 $352 $1,044 $929
2nd Lowest
(-1.1%) (-0.5%) (-1.5%)
Lowest Bronze
Before Tax
Credit
$146 $152 $556 $580 $789 $823
Lowest
(+38.1%) (+83.8%) (N/A)
*NOTES: Premiums are at rating area level and insurers are grouped by parent company. Columbia, UnitedHealth, Health Alliance, and Moda entered the Washington Marketplace in 2015. Some filings are under review and subject to change. SOURCE: http://www.insurance.wa.gov/your-insurance/health-insurance/health-rates/
The Henry J. Kaiser Family Foundation Headquarters: 2400 Sand Hill Road, Menlo Park, CA 94025 | Phone 650-854-9400
Washington Offices and Barbara Jordan Conference Center: 1330 G Street, NW, Washington, DC 20005 | Phone 202-347-5270
www.kff.org | Email Alerts: kff.org/email | facebook.com/KaiserFamilyFoundation | twitter.com/KaiserFamFound
Filling the need for trusted information on national health issues, the Kaiser Family Foundation is a nonprofit organization based in Menlo Park, California.