analysis of a cyanobacterial uv-sensitive sensor …
TRANSCRIPT

ANALYSIS OF A CYANOBACTERIAL UV-SENSITIVE
SENSOR KINASE EXPRESSED IN ESCHERICHIA COLI
by
Adreian A. Paul
A Thesis
Submitted to the Faculty of Purdue University
In Partial Fulfillment of the Requirements for the degree of
Master of Science
Department of Biology at Purdue Fort Wayne
Fort Wayne, Indiana
May 2020
2
THE PURDUE UNIVERSITY GRADUATE SCHOOL
STATEMENT OF COMMITTEE APPROVAL
Dr. Tanya T. Soule
Department of Biology
Dr. Jaiyanth Daniel
Department of Biology
Dr. Ahmed Mustafa
Department of Biology
Approved by:
Dr. Jordan M. Marshall

3
ACKNOWLEDGMENTS
There are so many I would like to thank throughout this journey. To begin, I would like to
thank Dr. Soule for taking me on as her student and encouraging me throughout this project. I
cannot express how thankful I am for taking the time to teach me and encouraging me. When I
began as a graduate student, I was unsure of how things would progress, but as time went on, she
was always optimistic and encouraged me to keep persevering. I thank her for always taking the
time to not only answer all my questions, but also just taking the time to talk and see how I was
doing. I cannot put into words how much I enjoyed my research experience while working in her
lab, and for that I will always be grateful.
I would like to thank my committee members, Dr. Ahmed Mustafa and Dr. Jaiyanth Daniel
for their time, perspective and expertise. I would especially like to thank Dr. Daniel for his
guidance for working on protein expression techniques. What I learned from him was invaluable
and I appreciate his help immensely. Moreover, I would like to thank all the members of the Soule
lab that I had the pleasure of working with. I appreciate the fact that we were all willing to help
each other with our projects if someone needed an extra set of hands. Specifically, I would like to
thank Shannon Calder for teaching me when I first started in the lab as well as Victoria, Gracie,
Lindsey and Mike for helping me whenever I needed it. I will miss all the time we spent together
growing and learning.
I would like to thank all my fellow graduate students in the PFW Biology Department. To
me, we are like family. Although we may not always agree, at the end of the day we were always
there for each other with encouragement and support. I firmly believe you all helped bring the best
out of me and helped me grow as a person. I would like to thank all the faculty and staff in the

4
Department of Biology. Many of you were here when I first started as a freshman, and I am grateful
for having many great role models that helped shape me into the person I am today. Special thanks
to Dar, Colleen, Arlis and Bruce for always helping in everything I needed. I have built great
memories within the Biology Department and I will always cherish them.
Finally, I would like to thank my family. They have always supported me in everything
that I have wanted to pursue and made sacrifices that I will never forget. I want to thank my siblings,
Benny and Hannah, for picking up the slack around the house while I was spending long hours in
the lab. I want to thank my mother and father for their love and support. No matter what I have
wanted to do in life, you have always encouraged me to pursue it with all my heart. You have
always been there for whether I was having a good day or a bad day. I owe so much to my family
and will always be eternally grateful.

5
TABLE OF CONTENTS
LIST OF TABLES .......................................................................................................................... 6
LIST OF FIGURES ........................................................................................................................ 7
INTRODUCTION .............................................................................................. 11
METHODS ......................................................................................................... 19
2.1 Cell Culturing and Media Composition ............................................................................ 19
2.2 DNA Isolation and Blunt-End PCR Product Construction for TOPO Vector Cloning .... 19
2.3 PCR Product Insertion and One Shot TOP 10 Cell Transformation ................................ 20
2.4 Transformed Cell Screening and Sequence Confirmation ................................................ 21
2.5 Transformation into BL21 Star E. coli Cells for Protein Expression ............................... 22
2.6 Optimization of Npun_F1277 Protein Expression in SKE Cells ...................................... 22
2.7 Stress Studies in SKE E. coli Cells ................................................................................... 24
2.8 Identification of Candidate UV and Light-Responsive Genes in E. coli for qPCR .......... 25
2.9 Primer Design for Candidate Genes ................................................................................. 27
2.10 Stress Experiments, RNA Extraction, and cDNA Synthesis .......................................... 29
2.11 Gene Expression Studies ................................................................................................ 30
RESULTS ........................................................................................................... 32
3.1 Generation of Sensor Kinase Expression (SKE) and Empty Vector (EV) E. coli Cells .. 32
3.2 Optimization of Npun_F1277 Protein Expression in SKE Cells ...................................... 34
3.3 Qualitative Assessment of Growth in Stressed SKE and EV E. coli Cells....................... 38
3.4 Quantitative Assessment of Growth in Stressed SKE and EV E. coli Cells .................... 43
3.5 Expression of Candidate Genes in Stressed SKE and EV E. coli Cells ........................... 47
DISCUSSION ..................................................................................................... 50
4.1 Fitness of E. coli SKE Cells .............................................................................................. 50
4.2 Gene Expression Changes................................................................................................. 55
4.3 Summary and Conclusions ............................................................................................... 60
REFERENCES ............................................................................................................................. 64
APPENDIX A: RECIPES ............................................................................................................. 67
APPENDIX B: PROTEIN ALIGNMENTS ................................................................................. 69
APPENDIX C: ADDITIONAL FIGURES .................................................................................. 73

6
LIST OF TABLES
Table 1. Candidate genes used in E. coli expression studies ........................................................ 26
Table 2. Primers used in quantitative-PCR ................................................................................... 28
Table 3. Quantitative PCR fold-change for all six candidate genes compared between SKE and EV
cells after exposure to white light and UVA for 30 minutes and UVB for 15 minutes. ............... 48
Table 4. Quantitative PCR fold-change for all six candidate genes compared between SKE and EV
cells after exposure to white light and UVA for 60 minutes and UVB for 30 minutes. ............... 48
Table 5. Quantitative PCR fold-change for all six candidate genes compared between SKE cells
after exposure to stress as white light and UVA for 30 minutes or UVB for 15 minutes versus SKE
cells in the dark. ............................................................................................................................ 49
Table 6. Quantitative PCR fold-change for all six candidate genes compared between SKE cells
after exposure to stress as white light and UVA for 60 minutes or UVB for 30 minutes versus SKE
cells in the dark. ............................................................................................................................ 49

7
LIST OF FIGURES
Figure 1. Nostoc punctiforme without scytonemin in the extracellular sheath. ............................ 12
Figure 2. Chemical structure of scytonemin ................................................................................. 13
Figure 3. Scytonemin biosynthetic gene cluster in N. punctiforme .............................................. 13
Figure 4. SK and RR interaction. .................................................................................................. 14
Figure 5. HKII + (PAS)2PAS/PAC domain architecture ............................................................. 15
Figure 6. ΔΔCq equation for calculating the relative fold change in gene expression ................. 31
Figure 7. Npun_F1277 PCR product for plasmid transformation. ............................................... 32
Figure 8. Colony PCR confirmation of TOP10 cells for Npun_F1277 insertion ......................... 33
Figure 9. Colony PCR confirmation of BL21 Star cells for the empty vector and p1277. ........... 33
Figure 10. Extracted protein of SKE and EV cells induced with 1mM IPTG compared to uninduced
SKE cells. ...................................................................................................................................... 34
Figure 11. Total protein extraction of SKE cells induced with either 1%, 5% or 10% lactose. A)
insoluble proteins .......................................................................................................................... 36
Figure 12. Total protein extracted from EV cells induced with 1%, 5% and 10% lactose. .......... 36
Figure 13. Total protein extracted from SKE cells induced with 0.25mM, 0.5mM and 0.75mM
IPTG .............................................................................................................................................. 37
Figure 14. OD600 growth comparison of BL21 Star, EV, and SKE cells in the presence of either
1mM IPTG or 5% lactose ............................................................................................................. 37
Figure 15. Two-fold dilution series for cells under various stress conditions without an acclimation
period. SKE and EV cells are induced with 1 mM IPTG. ............................................................ 39
Figure 16. Ten-fold dilution for cells under various stress conditions without an acclimation period.
SKE and EV cells are induced with 1 mM IPTG ......................................................................... 39
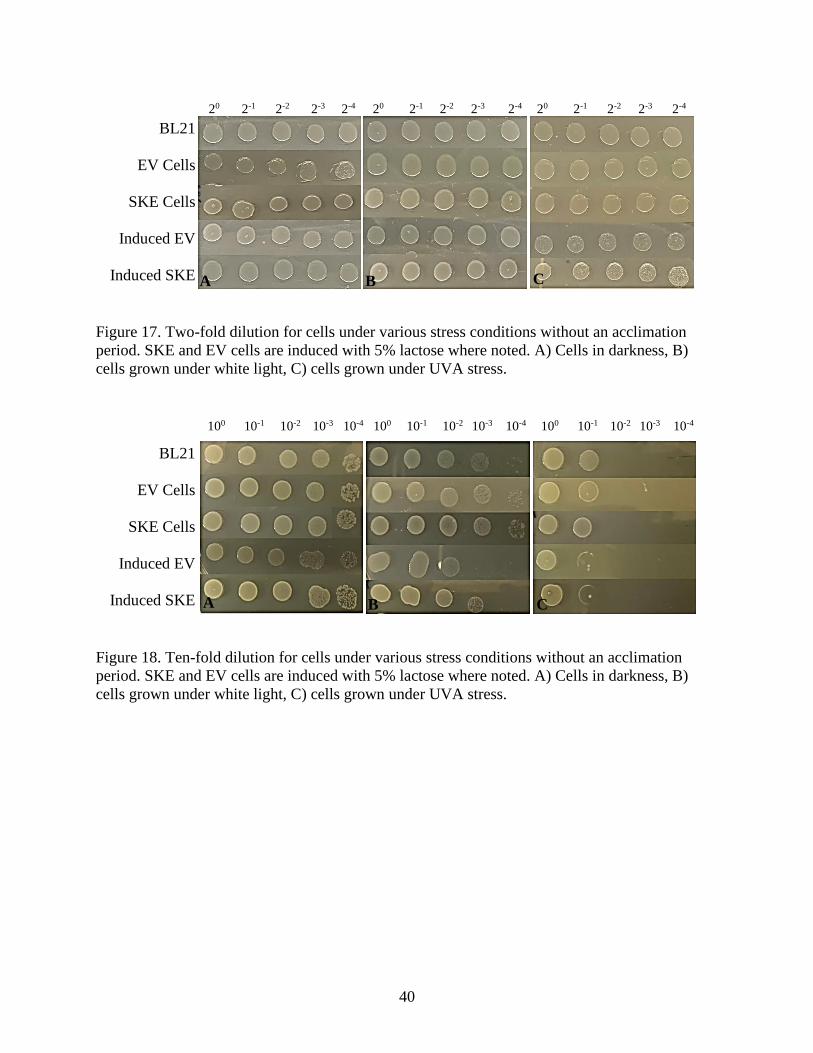
Figure 17. Two-fold dilution for cells under various stress conditions without an acclimation
period. SKE and EV cells are induced with 5% lactose ............................................................... 40
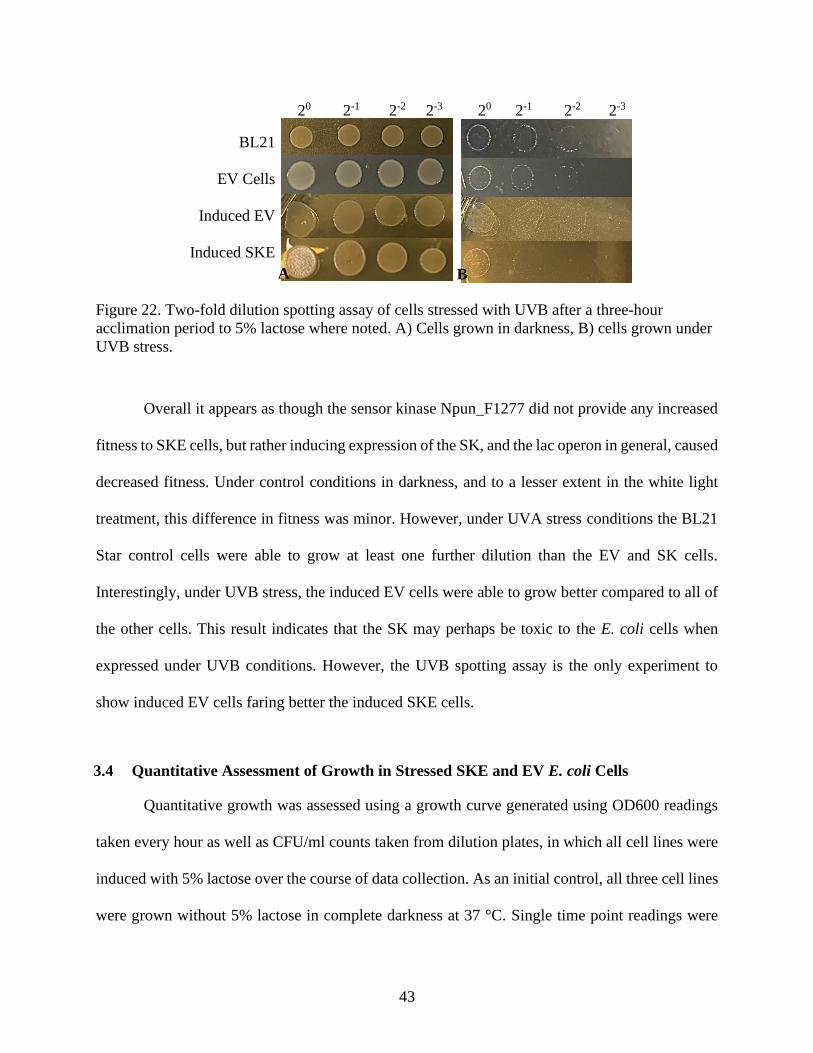
Figure 18. Ten-fold dilution for cells under various stress conditions without an acclimation period.
SKE and EV cells are induced with 5% lactose. .......................................................................... 40
Figure 19. Comparison of SKE cells when acclimation time to 5% lactose is varied prior to 14
hours of UVA exposure ................................................................................................................ 41
Figure 20. Two-fold dilution for cells under various stress conditions after a three-hour acclimation
period to 5% lactose ...................................................................................................................... 42
8
Figure 21. Ten-fold dilution for cells under various stress conditions after a three-hour acclimation
period to 5% lactose ...................................................................................................................... 42
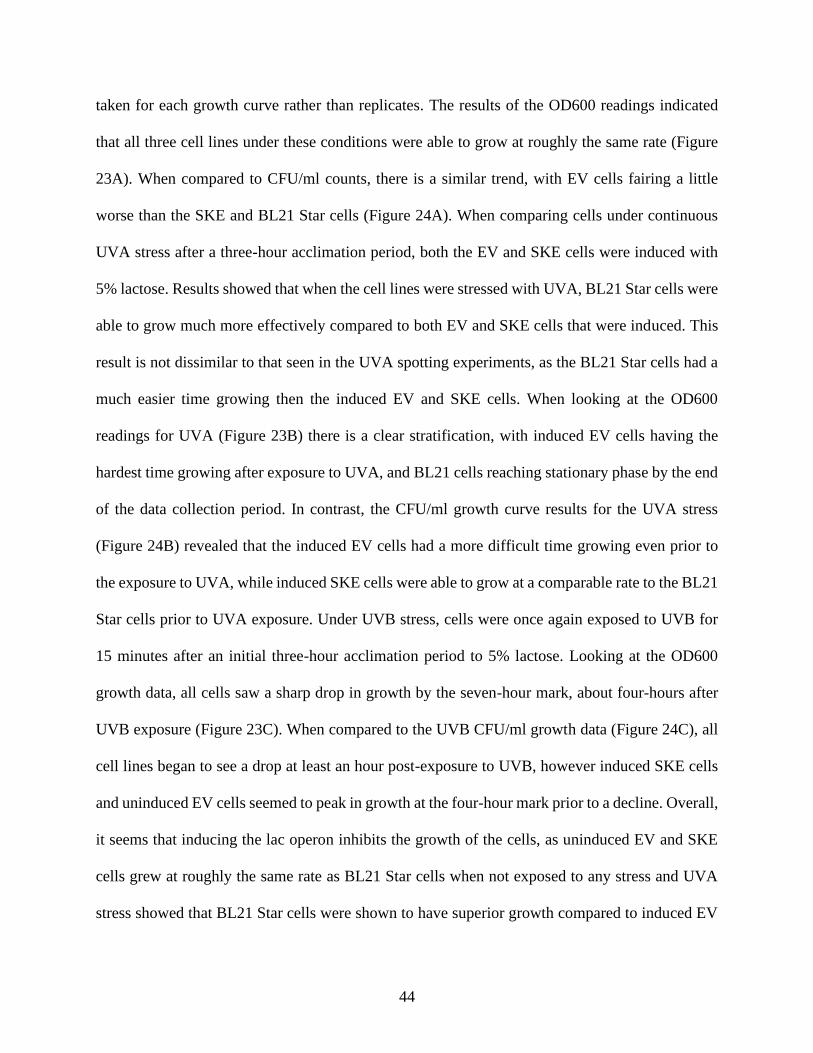
Figure 22. Two-fold dilution spotting assay of cells stressed with UVB after a three-hour
acclimation period to 5% lactose .................................................................................................. 43
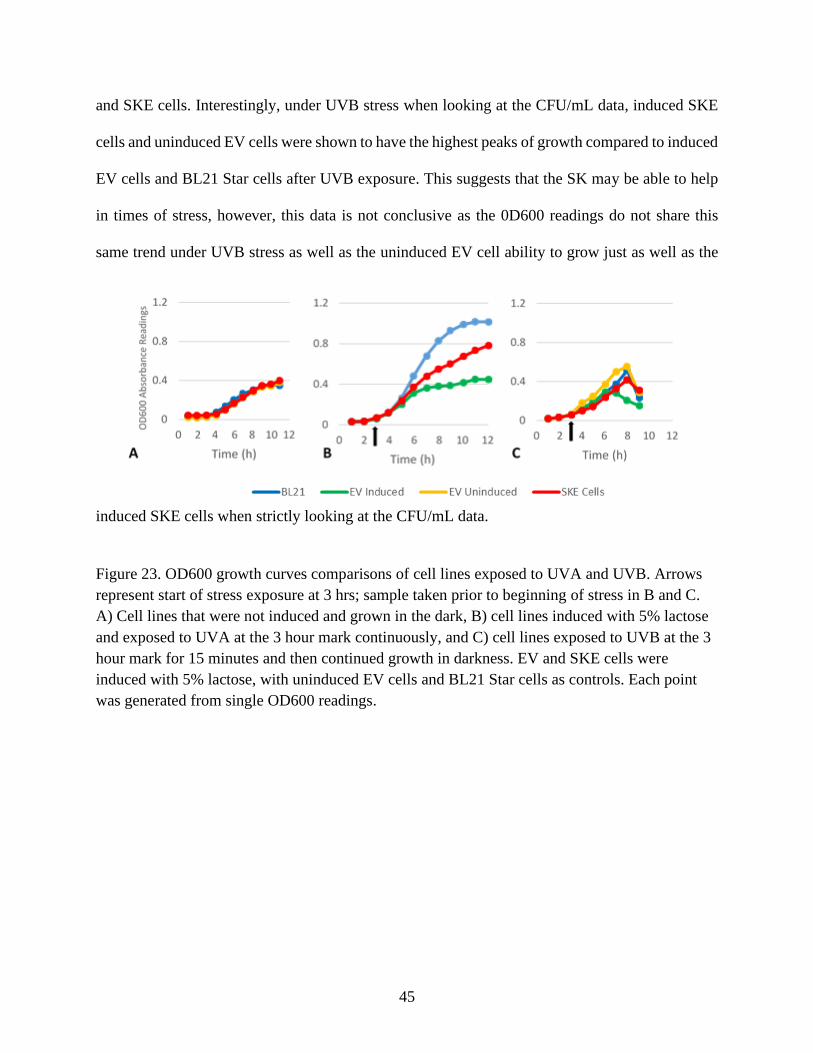
Figure 23. OD600 growth curves comparisons of cell lines exposed to UVA and UVB............. 45
Figure 24. CFU/ml growth curve comparisons when cell lines are exposed to UVA and UVB .. 46
Figure C1. Map of p1277 Plasmid. ............................................................................................... 73

9
ABSTRACT
Exposure to ultraviolet radiation (UVR) has been shown to cause cellular damage in
cyanobacteria. In response to UVR exposure, some cyanobacteria produce scytonemin, an indole-
alkaloid sunscreen capable of absorbing long-wavelength UVA radiation. Previous genomic and
transcriptomic analyses have determined that the production of scytonemin is controlled by a two-
component regulatory system (TCRS), encoded by Npun_F1277 and Npun_F1278 in the
cyanobacterium Nostoc punctiforme ATCC 29133. This TCRS is thought to not only regulate
scytonemin biosynthesis, but also other responses to light and UVR stimuli. To better understand
the functionality of the sensor kinase (SK) Npun_F1277 and to determine if it could activate
alternative UVR protection pathways, the SK was expressed in Escherichia coli. The first objective
of this study was to observe and quantify the level of fitness conferred to E. coli expressing
Npun_F1277 from N. punctiforme (strain SKE) when exposed to white light, UVA, and UVB
stress. Results from these experiments do not indicate that expression of the N. punctiforme SK
conferred an advantage to E. coli under white light, UVA, or UVB stress based on growth alone.
Therefore, the second objective was to study the expression of regulatory genes, such as response
regulators, in E. coli that are homologs to those associated with the SK Npun_F1277 in N.
punctiforme using quantitative-PCR. Expression of the selected genes was measured following
exposure to white light and UVA after 30 and 60 minutes as well as UVB after 15 and 30 minutes.
Comparison of SKE to empty-vector (EV) control cells exposed to the same stress showed that
there were significant changes in the expression of important regulatory genes (e.g. recA, spoT,
relA) in the SKE strain. Moreover, when comparing SKE cells exposed to the same conditions
above to unstressed SKE cells, a similar result was seen for SKE cells exposed to UVA and UVB
as was found in the studies comparing SKE to EV cells. These results suggest that the SK

10
Npun_F1277 may play a role in multiple defense mechanisms of N. punctiforme in addition to
initiation of the scytonemin biosynthesis pathway.

11
INTRODUCTION
Cyanobacteria are a diverse group of oxygenic photosynthetic bacteria that are widespread,
inhabiting many different terrestrial, planktonic, and benthic environments. Many of these
organisms get their name from the phycobilin pigment phycocyanin, which, along with chlorophyll
a, causes them to become bluish-green in color (Whitton & Potts, 2012). Due to their need to carry
out photosynthesis, cyanobacteria are exposed to the solar spectrum and subject to high irradiance
ultraviolet radiation (UVR) (Castenholz & Garcia-Pichel, 2012; Castenholz, 2015). The major
UVR wavelengths that cyanobacteria are exposed to are UVA (320 nm to 400 nm) and UVB (280
nm to 320 nm). UVA comprises about 90 percent of the UVR that passes through the atmosphere
and UVB constitutes the remaining 10 percent. Moreover, a third type of UVR, UVC (180 nm to
280 nm), is unable to reach the surface of the earth as the stratospheric ozone layer (O2/O3) is able
to absorb these shorter wavelengths. However, it is thought that these wavelengths were observed
on an early earth devoid of an atmosphere (Kasting, 1992).
Prolonged UVA exposure has been shown to cause direct damage to DNA by forming
pyrimidine dimers, altering downstream protein synthesis (Jiang et al., 2009). Similarly, UVB
radiation has also been shown to cause dimer formation, while it is also implicated in the
destruction of photosystem II proteins and of the light-harvesting phycobiliproteins in
cyanobacteria (Castenholz & Garcia-Pichel, 2012). As a result, cyanobacteria have evolved
defense mechanisms to compensate for their constant UVR exposure in the natural environment.
Some of these defense mechanisms include specialized DNA repair systems, gliding movements
in filamentous strains, synthesis of UV shock proteins, as well as the aggregation of antioxidants
and carotenoids (Bebout & Garcia-Pichel, 1995; Castenholz & Garcia-Pichel, 2012). Moreover,
some cyanobacteria are able to secrete microbial sunscreens. Microbial sunscreens are defined by

12
their ability to 1) absorb wavelengths within the UV spectrum and 2) be highly concentrated within
the organism. Specifically, mycosporine-like amino acids and scytonemin are sunscreens produced
by some cyanobacteria species (Gao & Garcia-Pichel, 2011).
In particular, scytonemin is a yellow-brown pigmented, indole-alkaloid, lipid-soluble
molecule that is induced upon exposure to UVR (mainly UVA) and secreted into the
extracellular sheaths of some species of cyanobacteria (Garcia-Pichel et al., 1992). The presence
of scytonemin in the filamentous cyanobacterium Nostoc punctiforme (N. punctiforme) ATCC
29133 (PCC 73102) can be seen as a visible brown coloration compared to the normal green cell
color (Figure 1). Chemically, scytonemin is composed of eight carbon rings, with the structure
being built from the condensation of identical tryptophanyl (tryptophan) and tyrosyl (tyrosine)
derived subunits held together through carbon-carbon bonds (Figure 2). This complex ring
20µm 20µm
A B
Figure 1. Nostoc punctiforme without scytonemin in the extracellular sheath (A) and with
scytonemin in the extracellular sheath (B). Image from Soule et al., 2007.
13
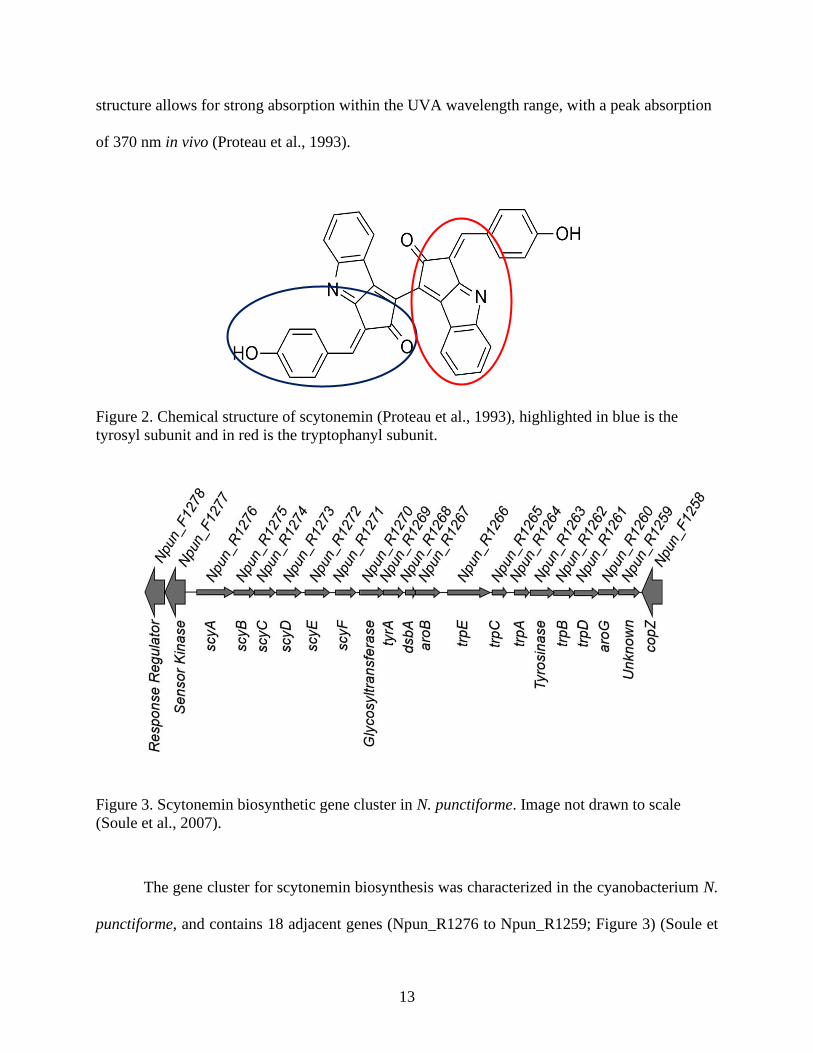
structure allows for strong absorption within the UVA wavelength range, with a peak absorption
of 370 nm in vivo (Proteau et al., 1993).
The gene cluster for scytonemin biosynthesis was characterized in the cyanobacterium N.
punctiforme, and contains 18 adjacent genes (Npun_R1276 to Npun_R1259; Figure 3) (Soule et
Figure 3. Scytonemin biosynthetic gene cluster in N. punctiforme. Image not drawn to scale
(Soule et al., 2007).
Figure 2. Chemical structure of scytonemin (Proteau et al., 1993), highlighted in blue is the
tyrosyl subunit and in red is the tryptophanyl subunit.
14
al., 2007). Transcription of these genes occurs in the same direction and results in a single
transcript, with each of the first few genes encoding proteins specific to scytonemin production. In
particular, a previous study showed that scyA (Npun_R1276) and scyB (Npun_R1275) encode for
enzymes involved in the biosynthesis of proteins involved in the early stages of scytonemin
biosynthesis (Balskus & Walsh, 2008).
In 2009 Soule et. al. compared the 18 genes in the scytonemin biosynthetic gene cluster of
N. punctiforme to homologous genes found in other cyanobacteria, such as Anabaena PCC 7120,
Lyngbya PCC 8106, Nodularia CCY 9414, and Chlorogloeopsis sp. Cgs-O-89. This comparison
not only revealed the presence of the gene cluster in other cyanobacteria, but also that it was near
a conserved putative two-component regulatory system (Npun_F1278 and Npun_F1277 in N.
punctiforme) that is consistently upstream and adjacent to the scytonemin biosynthetic gene cluster.
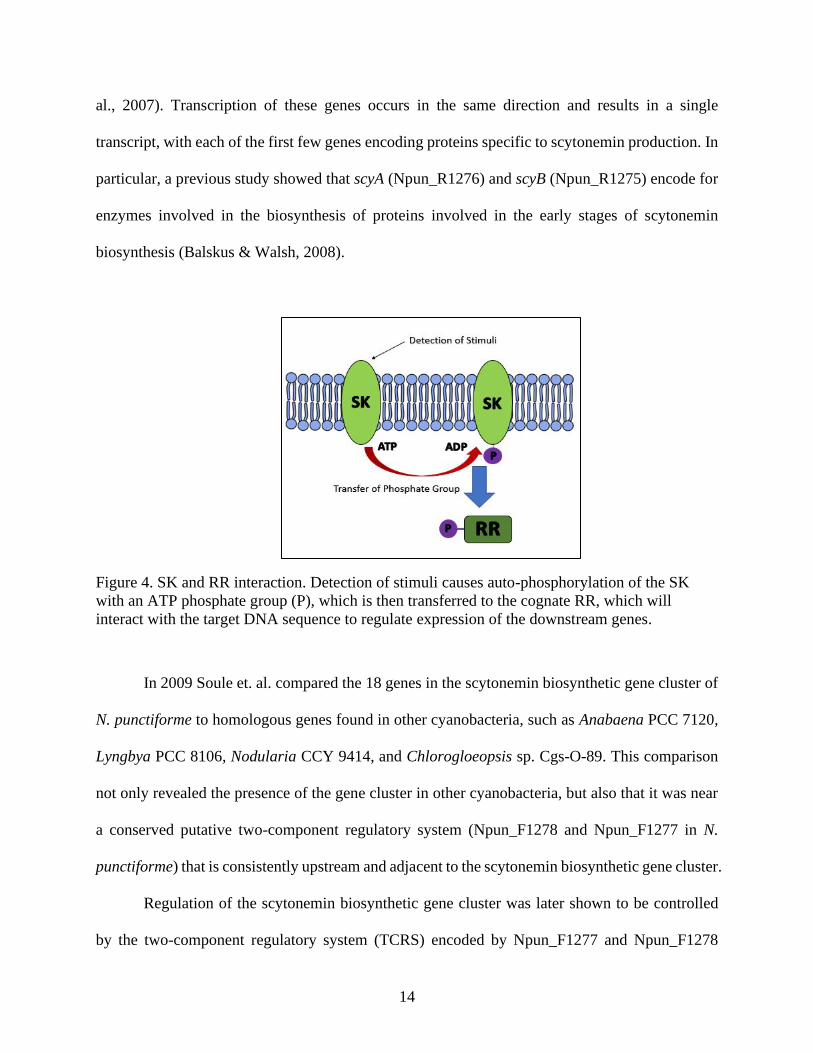
Regulation of the scytonemin biosynthetic gene cluster was later shown to be controlled
by the two-component regulatory system (TCRS) encoded by Npun_F1277 and Npun_F1278
Figure 4. SK and RR interaction. Detection of stimuli causes auto-phosphorylation of the SK
with an ATP phosphate group (P), which is then transferred to the cognate RR, which will
interact with the target DNA sequence to regulate expression of the downstream genes.

15
(Naurin et al., 2016). Based on protein sequence similarities, Npun_F1277 likely encodes a
histidine kinase (HK) or sensor kinase (SK) while Npun_F1278 likely encodes for a response
regulator (RR) protein. SKs are normally present in the cell membrane and are activated when
stimulated by changes in the surrounding environment (Figure 4). All SKs typically contain a
HisKA domain that functions to sense the stimuli in conjunction with upstream domains, and a
HATPase domain that functions in phosphorylation of a histidine residue on the SK. The phosphate
group attached to the histidine residue is then transferred to an aspartate residue on the RR to
activate it for downstream regulation through interaction with a target DNA sequence (Ashby &
Houmard, 2006).
N. punctiforme contains multiple types of SKs and RRs throughout its genome (Thiel et al.,
2002). The SK encoded by Npun_F1277 is characterized by its HKII + (PAS)2PAS/PAC domain
(Figure 5). The class HKII domains are identified through their linkage to GAF and/or PAS and
PAC domains and their interactions with them. The PAS domains found in this SK is homologous
to others that have been shown to respond to stimuli of light, oxygen, and redox potentials. The
latter of which occurs through the use of cofactors such as heme groups and flavin dinucleotides,
as well as voltage changes within ion channels, and nitrogen availability (Narikawa et al., 2004;
Ashby & Houmard, 2006).
Figure 5. HKII + (PAS)2PAS/PAC domain architecture encoded by Npun_F1277 in N.
punctiforme.

16
Moreover, the PAC domain is always found associated with the C-terminus of the PAS
domain, helping with PAS domain folding (Ashby & Houmard, 2006). PAS and PAC domains
are abundant among a variety of different organisms across all domains (Galperin, 2001).
Specifically within photosynthetic bacteria such as N. punctiforme and members of the
Anabaena genus, as many as 60 different PAS-containing domains can be present (Taylor &
Zhulin, 1999; Ashby & Houmard, 2006).
Specifically, the Npun_F1277 SK has been shown to be strongly activated by light
stimulation. Previous gene expression studies done by Janssen and Soule (2016) revealed that the
expression of Npun_F1277 and Npun_F1278 was up-regulated under UVA, UVB, and high light
irradiance (135 μmol photons m−2 s−1), and down-regulated by reactive oxygen species (ROS) over
an hour-long exposure period, with samples taken at 20-minute intervals. Particularly, exposure to
UVA caused the greatest increase in expression after the first 20 minutes (Janssen & Soule, 2016).
Interestingly, recent transcriptomic data (Soule, T., unpublished data), revealed that the SK alone
(not the RR Npun_F1278) was up-regulated under UVA and ROS conditions after 48 hours of
exposure, while UVB exposure caused down-regulation of Npun_F1277 in the same time period.
Expression under UVA and ROS was similar, possibly due to the fact that prolonged UVA
exposure will produce ROS (Tyrrell et al., 1991). Since SKs play a critical role in an organism’s
ability to respond to their environment, and since the response of Npun_F1277 to UVR and ROS
stress has been initially characterized, it would be of interest to further study the role of this SK in
stress adaptation. Moreover, in a recent RNA-seq study (Klicki, K., unpublished data) in which
the Npun_F1278 was deleted from N. punctiforme, it was revealed that there were significant
changes in gene expression for many genes under UVA as compared to the wild type. As expected,
many of the genes in the scytonemin biosynthesis pathway experienced significant downregulation.

17
Interestingly, several genes, including other response regulators, experienced changes in
expression. This leads to the notion that the Npun_F1277 SK may play a larger role in the
activation of multiple UV radiation defense mechanisms rather than simply acting as a signal for
the initiation of just the scytonemin biosynthesis pathway.
To study the response of Npun_F1277 in UV radiation defense, the BL21 DE3 strain of
Escherichia coli (E. coli) was chosen as an alternative host organism for the expression of
Npun_F1277. The E. coli strain BL21 (DE3) allows for easy manipulation of gene products
through the LacIQ/PlacUV5-T7 expression system that is inducible using IPTG or lactose. E. coli
was previously used as an alternative host for the heterologous expression of most of the
scytonemin biosynthetic pathway, excluding the TCRS (Malla & Sommer, 2014). The authors
were able to successfully produce the immediate precursor to scytonemin and several new
alkaloids from shunt pathways found in E. coli. Their results indicate that native E. coli pathways
can interact with scytonemin pathway protein products originating from N. punctiforme genes,
thus making it is plausible to think that similar interactions could be seen with the Npun_F1277
SK.
In previous studies, E. coli cells have been shown to have a reduced growth rate under both
exposure to visible light and under UV radiation (D'Aoust et al., 1974; Radman, 1975). Therefore,
any change in fitness conferred to E. coli through the expression of the Npun_F1277 SK under
UVA or UVB stress should be attributed to the non-native SK. This response can be evaluated
both qualitatively through observed growth and quantitatively through growth dynamics using a
standard bacterial growth curve. In addition to phenotypic growth studies, the expression of genes
involved in regulation, the SOS DNA damage response, and the stringent response can be
18
evaluated using quantitative-PCR on cDNA from E. coli cells expressing the SK under UVA and
UVB stress.
The main objective of this research project is to understand the impact of the Npun_F1277
sensor kinase in response to light-associated stresses in a non-cyanobacterial host. This will be
done by 1) observing and quantifying the level of fitness conferred to Escherichia coli expressing
the Npun_F1277 gene from N. punctiforme when exposed to white light, UVA, and UVB stress
using growth studies, and 2) studying candidate regulatory and stress response genes in E. coli that
are homologs of those identified from a UVR transcriptomic study of a Npun_F1278 mutant strain
of N. punctiforme. Examining the expression of these genes under light and UVR stress will
demonstrate if the Npun_F1277 SK is capable of interacting with a broader regulatory network in
a non-native host.
Overall, the goal of this study is to better understand the role of this sensor kinase and how
it may contribute to the regulation of light-associated conditions. The information from this study
could later be used to determine if Npun_F1277 is able to interact with other response regulators
and influence gene expression of other UV radiation protective pathways within N. punctiforme or
other host organisms, such as E. coli. Moreover, this research could lead to the development of
light/UVR-regulated genetic systems that could be used in industrial settings in which the
expression of gene products can be precisely controlled through light intensity or spectral output
and require minimum supplementation. This system could also be used to optimize light exposure
in plant models, in which plants would be able to grow under reduced or altered light requirements.

19
METHODS
2.1 Cell Culturing and Media Composition
Nostoc punctiforme ATCC 29133 (PCC 73102) cells were cultured in either 50 ml of Allen
and Arnon (AA) liquid medium (Allen & Arnon, 1955) or on plates that were solidified with 1%
(W/V) Noble agar. Cultures were grown at 23 °C under white light using cool-white fluorescent
bulbs that provided an intensity of about 30-45 μmols photons m-2 s-1. E. coli cells were cultured
in Luria Bertani (LB) medium solidified with 1% (W/V) Bacto agar. When necessary, kanamycin
was used at a final concentration of 50 µg ml-1.
2.2 DNA Isolation and Blunt-End PCR Product Construction for TOPO Vector Cloning
Genomic DNA was isolated from stationary phase N. punctiforme cultures using the
DNeasy PowerPlant Pro Kit (Qiagen) according to the manufacturer’s instructions. DNA quality
and relative quantity were verified through gel electrophoresis on 1% agarose gels stained with
EZVision In-Gel Solution (AmrescoR) and quantified using a Nanodrop spectrophotometer
(Thermo Fisher Scientific). Electrophoresis was performed in 1X TAE buffer at 100 V for 30
minutes. Bands produced were compared to the molecular mass standard GeneRuler 1 kb Plus
DNA Ladder (Thermo Scientific).
Blunt-end PCR products of the entire Npun_F1277 (1980 bp) gene, including the stop and
start codons, were amplified from the extracted N. punctiforme genomic DNA using the 1277protF
and 1277protR.2 primers. In order to ensure that directional cloning into the pET200 TOPO vector
(Life Technologies) occurred, the forward primer was designed with an additional CACC at the 5’
end, bringing the total size of the PCR product to 1984 bp in length. The sequence for 1277protF
was 5’ CACCATGAATTCTGGCGATTATAA 3’, while the sequence for 1277protR.2 was 5’

20
TCATAACTCGGAACTACTAAA 3’. Each PCR reaction was 20 μl and was composed of 20-30
ng of genomic DNA, 0.1 μM of each primer, 4 μl 5X Phusion HF polymerase buffer, 0.4 μl 10
mM dNTPs, and 0.1 μl 5X PFU DNA polymerase (Thermo Fisher Scientific). PCR was performed
in a T100 Thermal Cycler (Bio-Rad) with the following parameters: 98 °C for 5 minutes followed
by a cycle of 98 °C for 30 seconds, 48 °C for 30 seconds, and 72 °C for 1 minute that was repeated
35 times, followed by a final extension at 72 °C for 10 minutes. PCR products were confirmed on
1% agarose gels as described above. Products of the appropriate size (1984 bp) were purified with
the UltraClean PCR Purification Kit (MoBio Laboratories, Inc.) and quantified using a Nanodrop
spectrophotometer (Thermo Fisher Scientific).
2.3 PCR Product Insertion and One Shot TOP 10 Cell Transformation
The blunt-end PCR products of the Npun_F1277 gene were cloned into the pET 200 TOPO
Vector (Life Technologies), generating p1277 plasmids (See Appendix C for map of p1277
plasmid). To do this, the Npun_F1277 PCR product and pET 200 vector were mixed in 6 μl
reactions consisting of 10-20 ng of purified PCR product, 1 μl of the pET 200 TOPO vector, 1 μl
salt solution, and sterile water. All materials besides the PCR product where found in the
Champion pET Directional TOPO Expression Kit (Invitrogen). Reactions were mixed gently by
flicking and incubated at room temperature for 5 minutes. After incubation, the mixture was placed
on ice until transformation.
The p1277 plasmid was transformed into One Shot TOP10 chemically-competent E. coli
cells (Invitrogen) by gently mixing 3 μl of the TOPO cloning reaction with 1 vial of competent
cells by flicking. The mixture was incubated on ice for 20 minutes. The cells were then heat-
shocked at 42 °C for 30 seconds in a water bath without shaking and transferred to ice immediately.
250 μl of room-temperature SOC medium was added and the mixture was incubated at 37 °C for

21
1 hour with horizontal shaking. After incubation, 100 μl of the bacterial cultures were plated onto
LB plates with kanamycin and incubated overnight at 37 °C. Colonies at random were cultured in
liquid LB medium containing kanamycin. Colonies in media were stored at 4 °C until they could
be screened for the presence of the Npun_F1277 insertion in the pET 200 vector.
2.4 Transformed Cell Screening and Sequence Confirmation
Before sequencing, clones that contained the p1277 plasmid were first confirmed by colony
PCR using T7 forward and reverse primers since the priming sites flanked the product insertion
site. For this, 0.5 ml of each culture that was previously grown overnight and stored at 4°C, was
centrifuged for 1 minute to pellet cells and the supernatent was removed by aspiration, then the
colonies were resuspended in 20 μl of PCR water. Each 20 μl PCR reaction consisted of 2 μl of
the resuspended cells, 0.1 μM of each T7 primer, 2 μl 10X Dream Taq polymerase buffer, 0.4 μl
10 mM dNTPs, and 0.1 μl 10X Dream Taq DNA polymerase (Thermo Fisher Scientific). The PCR
reaction was run with the following parameters: 94 °C for 5 minutes followed by a cycle of 94 °C
for 30 seconds, 48°C for 30 seconds, and 72 °C for 1 minute that was repeated 35 times followed
by a final extension at 72 °C for 10 minutes. A positive result would be the presence of a band that
is 2258 base pairs (includes the insert and flanking region) following 1% agarose gel
electrophoresis as described previously.
p1277 plasmids were purified from positive clones and confirmed through sequencing.
Plasmids were isolated using the UltraClean Plasmid DNA Isolation Kit (MoBio Laboratories,
Inc.). Inserts were confirmed through PCR on those plasmids prior to sequencing following the
same PCR reaction described above for screening except that the template consisting of 10-20 ng
of purified plasmid DNA. The plasmids were then sent to McLab (www.mclab.com) and
sequenced using the Sanger sequencing method. Sequencing was performed using the T7 forward

22
and reverse primers based on priming sites on the vector. Sequences were analyzed using the
software program Geospiza Finch TV (https://digitalworldbiology.com/FinchTV) to confirm that
they were the correct products before proceeding.
2.5 Transformation into BL21 Star E. coli Cells for Protein Expression
For transformation of the p1277 plasmid into E. coli cells for expression of Npun_F1277,
vials of BL21 Star (DE3) cells (Invitrogen) were thawed on ice and 1 µg of the p1277 plasmid was
added to each of the vials which were mixed gently by flicking. Cells were then placed on ice for
30 minutes, followed by a heat-shock for 30 seconds in a water bath at 42 °C, before a short
incubation on ice. Then 250 µl of SOC medium was added to each vial and the cells were incubated
at 37 °C with shaking for 30 minutes. The contents of each vial were added to 10 ml of LB broth
containing kanamycin which was incubated overnight at 37 °C with shaking. The resulting
transformed cells were then referred to as the Sensor Kinase Expression (SKE) cells. Empty vector
(EV) cells were also created in the same manner using plasmids that did not contain the
Npun_F1277 insert.
2.6 Optimization of Npun_F1277 Protein Expression in SKE Cells
To optimize expression of the Npun_F1277 protein in SKE cells and determine that only
SKE cells could express the protein, protein expression was induced with either IPTG or lactose
for a period of 5 hours at 37 °C. To do this, 0.5 ml of SKE and EV cells were grown in 10 ml of
LB broth with kanamycin for 3 hours at 37 °C with shaking. The Optical Density at 600 nm
(OD600) was checked to ensure that the cell culture concentration was > 0.5 OD600. Cell cultures
of each strain were then split into two 5-ml aliquots, with one induced with IPTG (0.25, 0.5, 0.75,
1.0 mM) and the other with lactose (1%, 5%, 10%). Cells were grown at 37 °C with shaking and

23
0.5 ml aliquot samples were then collected every hour for 5 hours. Samples were centrifuged at
10,000 rpm to pellet the cells, the supernatant was decanted, and the cell samples were stored at -
20 °C until protein extraction.
Crude protein was extracted from the cell pellets by first resuspending the cells in 500 µl
of cold lysis buffer (see Appendix A for all recipes in this section) by vortexing for 5 seconds. The
cells were kept in an ice-cold water bath in 1.5 ml Eppendorf tubes until sonication occurred using
a 1/8” microtip sonicator (Thermo Fisher Scientific) at 37% amplitude with 5 seconds on and off
pulsing for 30 seconds. Each sample was sonicated three times with a 5-minute rest period between
cycles. After sonication, the soluble and insoluble fractions were separated by centrifugation at
14,800 rpm for 2 minutes to pellet insoluble proteins, leaving the soluble proteins in the
supernatant. For each sample, the supernatant was transferred to a clean 1.5 ml Eppendorf tube
and kept on ice. The supernatants were then each mixed with 500 µl of 2X SDS PAGE sample
buffer and boiled for 5 minutes. Likewise, insoluble protein samples were mixed with 500 µl of
1X SDS PAGE sample buffer and boiled for 5 minutes. 10 µl of each soluble protein sample and
5 µl of each insoluble protein sample was loaded into a 10% Tris/Glycine SDS-PAGE gel along
with a molecular mass standard (Precision Plus Protein Dual Color Standards; Bio-Rad).
Electrophoresis was performed in running buffer containing 1X Tris/Glycine and 0.1% SDS at 120
V for 85 minutes. The gel was stained in staining solution with gentle shaking overnight. De-
staining was done in de-staining solution with shaking and fresh solution was replaced every hour
until clear bands were visible. A positive result was the visualization of a band at the 75 kDa region
in the soluble portion of induced SKE cells.
24
2.7 Stress Studies in SKE E. coli Cells
In order to assess the fitness conferred to E. coli SKE cells by the expression of the
Npun_F1277 protein, three experimental groups were used, untransformed BL21 Star cells that
served as a control, EV (empty vector) cells to determine if the plasmid played a role in any
changes in E. coli fitness, and SKE cells as the experimental group. Fitness under stress was
assessed using two methods, a qualitative growth spotting assay and a quantitative growth curve
analysis.
For the qualitative assessment of E. coli cell fitness using spotting assays, cell cultures
were first grown overnight at 37 °C with shaking in LB media with kanamycin added as needed.
Then cells of equal optical density were centrifuged at 10,000 rpm and resuspended with 1 ml of
LB media with kanamycin as necessary. These cell cultures were used to create two-fold dilutions
to 2-6 or ten-fold dilutions to 10-4 in LB media. These dilutions were then spotted by plating 10 µl
of each dilution onto solid LB media (with kanamycin as needed) with or without 1 mM IPTG (or
5% lactose). Spotted plates were grown in complete darkness, stressed under white light (about 40
μmols photons m-2 s-1) using 34 W cool-white fluorescent bulbs (Sylvania), stressed under UVA
(9-11 W m-2) using an 18 W 24-in T8 Black Light Fluorescent Tube (Phillips), or under UVB (0.5
W m-2) using a 15W XX-series lamp. Cells underwent an acclimation period of three hours in
complete darkness at 37 °C prior to 14 hours of stress exposure in the case of white light and UVA.
For UVB, after the acclimation period, cells were exposed to UVB radiation for 15 minutes, then
grown in the dark for 14 hours since prolonged exposure to UVB would kill the cells. To ensure
cells were exposed to both UVA and UVB, sterilized UVA-transparent glass Petri dishes and
Saranwrap were used respectively for each stress. Following exposure, the relative amount of
growth was compared for all cells and treatments.

25
For the quantitative assessment of E. coli fitness, cells were grown in 25 ml batch cultures
in LB broth (with kanamycin as needed) and 5% lactose in the presence of UVA and UVB as
described above. Cells were grown in either a tissue flask (UVA) or a glass petri dish covered with
Saranwrap (UVB), with shaking to ensure even illumination. Growth was assessed using standard
growth curves with measurements at OD600 and dilution plates to generate CFU/ml counts, with
samples being taken every hour over a period ranging from 8 to 10 hours.
2.8 Identification of Candidate UV and Light-Responsive Genes in E. coli for qPCR
Candidate regulatory genes of interest in N. punctiforme were identified using an RNA-seq
study of a mutant strain of N. punctiforme in which the response regulator (Npun_F1278) was
knocked-out and the total gene expression under UVA stress was assessed (Klicki, K., unpublished
data). Candidate regulatory genes were selected using three criteria. First, their expression had to
be significantly altered by the absence of Npun_F1278 under UVA in N. punctiforme or directly
involved in DNA repair mechanisms, since UVA is known to affect DNA. Next they had to have
appropriate homologs in E. coli, based on the amino acid sequence, for evaluating their expression
in the SKE strain. Finally, the homolog found in E. coli had to have at least 33% query cover and
33% percent identity in the amino acid sequence compared to the candidate gene product found in
N. punctiforme, as identified in a Protein-BLAST search (see Appendix B for alignments). Overall,
six candidate genes were selected, spoT, curR, phoB, lexA, recA, and relA (Table 1).

Table 1. Candidate genes used in E. coli expression studies
N. punctiforme ATCC
29133 gene locus N. punctiforme gene products
E. coli gene
homolog E. coli gene function
Percent
Identity
Query
Cover
Npun_F1278
AraC family transcriptional
regulator
cusR Response to copper and
silver
37.40% 43%
Npun_F2162
Response regulator receiver phoB Positive regulator for the
phosphate regulon
36.13% 99%
Npun_R2633
Metal dependent
phosphohydrolase
spoT Synthesis and degradation of
ppGpp
33.07% 61%
Npun_F5595 (p)ppGpp synthetase I relA Formation of pppGpp 36.53% 94%
Npun_F4481 SOS-response transcriptional
repressor
lexA Down regulation of the SOS
regulon and DNA repair
34.16% 98%
Npun_F2914 Recombinase A recA SOS response 62.18% 96%
26

27
2.9 Primer Design for Candidate Genes
Using Primer-BLAST, primers for quantitative-PCR (qPCR) for the E. coli gene homologs
were designed with the following parameters: they should amplify a PCR product 30 to 300 bp in
length and have a melting temperature between 57 °C - 63 °C (Table 2). Standard PCR reactions
were done with each primer pair to determine the optimal annealing temperature. Each PCR
reaction consisted of 20 μl total volume, 10-20 ng of E. coli genomic DNA, 0.1 μM of both the
forward and reverse primer, 2 μl 10X Dream Taq polymerase buffer, 0.4 μl 10 mM dNTPs, and
0.1 μl 10X Dream Taq DNA polymerase (Thermo Fisher Scientific). The PCR reaction was run
with the following parameters: 94 °C for 5 minutes followed by a cycle of 94 °C for 30 seconds,
either 55 °C or 58 °C depending on the primer sets being tested (Table 2) for 30 seconds, and 72 °C
for 1 minute, which was repeated 35 times followed by a final extension at 72 °C for 10 minutes.
Gel electrophoresis in 1% agarose was done to verify the correct product size as well as to ensure
there was no non-specific binding.

28
Table 2. Primers used in quantitative-PCR
Primer
Name Primer Sequence (5’ to 3’) Tm (°C)
Annealing
Temperature (°C) PCR Product
Size (bp)
CusRF.1 TCCTTGCGCGTCAGTGTAAT 60.04 55.0 209
CusRR.1 CGATGACAGAGTCAGAGGGC 59.90
PhoBF GCGGTGGAAGAGGTGATTGA 60.04 55.0 241
PhoBR CCAGTGCTTTACGTAGGCGA 60.11
SpoTF.1 TCCAGTGGTGATGTTGACCG 59.97 55.0 168
SpoTR.1 TCAATCACCTCTTCCACCGC 60.04
LexAF GGTCGTTGTCGCACGTATTG 59.91 58.0 131
LexAR TGAAGCTCTGCTGACGAAGG 60.04
RecAF.3 CCGATACGACGGATGTCGAG 60.11 58.0 213
RecAR.3 AATCGGCGACTCTCACATGG 60.18
RelAF AAGACCTGGCTGCGTACTTC 60.04 58.0 282
RelAR CGATTACGTCGCTAACCCGA 59.97
GyrAF.3 GATGAGGATCACGCCCTGAG 59.97 55.0 or 58.0 197
GyrAR.3 AATACCCAACCAAGTCGCGT 59.96
29
2.10 Stress Experiments, RNA Extraction, and cDNA Synthesis
Stress experiments were done by first growing cell cultures of BL21 Star, EV, and SKE
cells overnight. All strains were then spread-plated onto 5% lactose LB media (with kanamycin as
needed) and grown in the dark for an acclimation period of 14 hours at 37 °C. All plates were
grown in triplicate, with each strain grown in the dark as a control and exposed to three stress
conditions, white light, UVA, and UVB as described above. For the white light and UVA
conditions, cells were stressed for one hour, in which samples were taken at 30 minutes and 60
minutes after exposure for the purpose of total RNA extraction. For UVB, samples were taken
immediately after 15 minutes and 30 minutes of exposure. Cell samples were scraped off the plate
using a sterile pipette tip and deposited into a sterile Eppendorf tube containing cold TRIzol
reagent (Thermo Fisher Scientific) for immediate RNA extraction.
Total RNA was extracted from each E. coli strain using the TRIzol Plus RNA Purification
Kit (Thermo Fisher Scientific). To begin, samples were lysed with 1 ml of cold TRIzol reagent
and then homogenized by using the bead beater at 2500 rpm for 90 seconds. The lysed samples
were then incubated at room temperature for 5 minutes. Following incubation, 0.2 ml of
chloroform was added to each sample and then incubated for 3 minutes at room temperature.
Samples were then centrifuged at 12,000 rpm at 4 °C for 15 minutes. Following centrifugation, the
clear aqueous layer was pipetted into sterile Eppendorf tubes.
The RNA was then isolated by first adding one volume of 70% ethanol to each sample.
The samples were vortexed, and the lysate was passed through a spin column to collect the RNA
in the eluent. Extracted RNA samples were stored at -80 oC until processing. Total RNA was
treated with the TURBO DNA-free DNase Kit (Invitrogen) following the manufacturer’s
instructions to remove unwanted DNA fragments. The RNA was then used to synthesize cDNA
using the SensiFast cDNA Synthesis Kit (Bioline) following the manufacturer’s instructions. To

30
do this, 4 μl 5X Sensi-Fast buffer was used with 1 μl reverse transcriptase along with 1 μg RNA
in 20 μl reactions. cDNA synthesis was performed with the following parameters: 25 °C for 10
minutes, 42 °C for 15 minutes, and 85 °C for 5 minutes in a Bio-Rad T100 Thermal Cycler.
2.11 Gene Expression Studies
The cDNA was used in qPCR to measure expression levels in E. coli of candidate genes
(Table 1) using the primers listed in Table 2. Samples were run in triplicate, with either cells of
the same strain that had been grown in the dark or EV cells exposed to the same stress as the SKE
cells as a control, with gyrA serving as a reference gene (Sorrels et al., 2009). qPCR was performed
on a CFX Connect Real-Time PCR Detection System (Bio-Rad Laboratories). Each reaction was
run in a low-profile 96-well plate and contained 10 µl of 2X iTaq Universal SYBR Green Supermix
(Bio-Rad Laboratories), 0.1 μM of each forward and reverse primer, 1 µl of cDNA, and PCR water
for a total volume of 20 µl. The data was analyzed with the CFX Manager Software package (Bio-
Rad Laboratories). Expression of genes in response to each stress condition was analyzed by
comparing the copy number of cDNA fragments that were amplified by each pair of primers,
expressed as the Cq value, which is the PCR cycle in which the product amplification passed the
threshold value. The Cq values were then each individually normalized to the reference gene. The
normalized fold change (ΔΔCq) was then calculated using the formula in Figure 6 (Pfaffl, 2001).
SKE cells for each stress were compared to EV cells under the same stress as well as SKE cells
that were unstressed (in the dark). The fold change threshold for significance was set at ±2.00 at p
≤ 0.05. Although this threshold value is arbitrary, it has been used in previous studies similar to
this one (Soule et al., 2013). A student’s t-test was then used to determine if the expression of
genes in the control and experimental samples were significantly different.

31
Figure 6. ΔΔCq equation for calculating the relative fold change in gene expression between a
control and experimental sample that is normalized to a reference gene. E is the efficiency of the
reaction which is set to 2. The target value is the gene of interest a and the reference gene (ref) was
DNA gyrase A (gyrA) in these experiments. The control samples were either EV cells or unstressed
SKE cells, depending on the experiment. The sample was comprised of SKE cells exposed to
various stresses. Image from Pfaffl, 2001.
32
RESULTS
3.1 Generation of Sensor Kinase Expression (SKE) and Empty Vector (EV) E. coli Cells
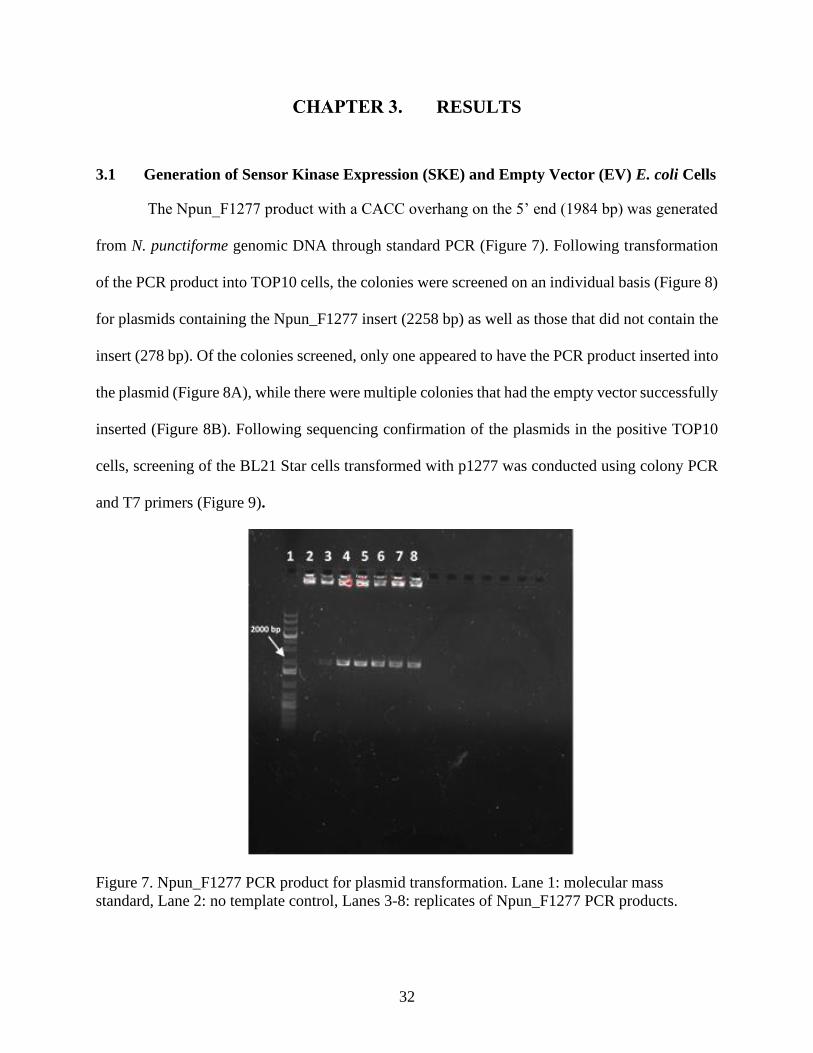
The Npun_F1277 product with a CACC overhang on the 5’ end (1984 bp) was generated
from N. punctiforme genomic DNA through standard PCR (Figure 7). Following transformation
of the PCR product into TOP10 cells, the colonies were screened on an individual basis (Figure 8)
for plasmids containing the Npun_F1277 insert (2258 bp) as well as those that did not contain the
insert (278 bp). Of the colonies screened, only one appeared to have the PCR product inserted into
the plasmid (Figure 8A), while there were multiple colonies that had the empty vector successfully
inserted (Figure 8B). Following sequencing confirmation of the plasmids in the positive TOP10
cells, screening of the BL21 Star cells transformed with p1277 was conducted using colony PCR
and T7 primers (Figure 9).
Figure 7. Npun_F1277 PCR product for plasmid transformation. Lane 1: molecular mass
standard, Lane 2: no template control, Lanes 3-8: replicates of Npun_F1277 PCR products.

33
Figure 8. Colony PCR confirmation of TOP10 cells for Npun_F1277 insertion. Lane 1:
molecular mass standard, Lanes 2 and 13: empty wells, Lane 14: no template control. A) Lanes
3-12: colonies taken from plated cells transformed with empty vector plasmids. B) Lanes 3-12:
colonies taken from plated cells transformed with p1277 plasmids. Red circle indicates a positive
result.
Figure 9. Colony PCR confirmation of BL21 Star cells for the empty vector and p1277 plasmid.
Lane 1: molecular standard, Lanes 2 and 5: empty, Lane 3: EV cells, Lane 4: SKE cells, Lane 6:
negative control.
A B

34
3.2 Optimization of Npun_F1277 Protein Expression in SKE Cells
Expression of Npun_F1277 in E. coli SKE cells was confirmed and accomplished by
inducing the lac operon controlling Npun_F1277 expression with 1 mM IPTG for two and five
hours. The crude proteins were extracted and split into insoluble and soluble fractions and run on
two separate SDS-PAGE gels (Figure 10). Results of induced SKE cells were compared to cells
that were not induced and to EV cells to confirm the presence of a protein ~75 kDa, presumed to
be Npun_F1277, in the soluble fraction of induced SKE cells.
Figure 10. Extracted protein of SKE and EV cells induced with 1mM IPTG compared to
uninduced SKE cells. A) insoluble proteins and B) soluble proteins from SKE and EV cells with
samples taken at 2 and 5 hours after induced expression. Lane 1: Precision Plus Protein Standard
A) lane 2: SKE cells induced after 2 hours, lane 3: SKE cells uninduced after 2 hours, lane 4: EV
cells induced 2 hours, lane 5: SKE cells induced after 5 hours, lane 6: SKE cells uninduced after
5 hours, lane 7: EV cells induced 5 hours. B) lane 3: SKE cells induced after 2 hours, lane 4:
SKE cells uninduced after 2 hours, lane 5: EV cells induced 2 hours, lane 6: SKE cells induced
after 5 hours, lane 7: SKE cells uninduced after 5 hours, lane 8: EV cells induced 5 hours.

35
To determine if it was possible for the SKE cells to sufficiently express Npun_F1277 with
lactose as an inducer to reduce any unintended toxicity from IPTG, the expression induction
experiment above was repeated with 1%, 5%, and 10% lactose for one and three hours. The SDS-
PAGE protein gels revealed that the use of 1%, 5%, and 10% lactose in the media was able to
induce expression in SKE cells in the soluble fraction after both one and three hours of induction,
while the 75 kDa protein was absent in the insoluble fraction (Figure 11).
EV cells were also induced with lactose to verify that they were not able to express the
Npun_F1277 protein (Figures 12). Moreover, lower concentrations of IPTG (0.25, 0.5, and 0.75
mM) were also able to induce expression of Npun_F1277 at least one hour after adding IPTG to
the media (Figures 13). Therefore, to determine which inducing agent provided less stress to the
cells, a growth curve based on OD600 values was performed. Protein expression was induced by
either 5% lactose or 1 mM IPTG induction for the comparison. The growth curve (Figure 14)
indicated that overall the SKE cells were able to grow better than the EV cells, however, the control
BL21 Star cells were able to grow better than both SKE and EV cells. Furthermore, IPTG induction
seemed to be more harmful to SKE or EV cells than lactose.

36
Figure 11. Total protein extraction of SKE cells induced with either 1%, 5% or 10% lactose. A)
insoluble proteins and B) soluble proteins from SKE cells with samples taken after 1 hour and 3
hours of induced expression with 1%, 5% and 10% lactose. Lane 1: Precision Plus Protein
Standard, lane 2: SKE cells induced with 1% lactose for 1 hour, lane 3: SKE cells induced with
1% lactose for 3 hours, lane 4: SKE cells induced with 5% lactose for 1 hour, lane 5: SKE cells
induced with 5% lactose for 3 hours, lane 6: SKE cells induced with 10% lactose for 1 hour, lane
7: SKE cells induced with 10% lactose for 3 hours.
Figure 12. Total protein extracted from EV cells induced with 1%, 5% and 10% lactose. A)
insoluble proteins and B) soluble proteins from EV cells with samples taken after 1 hour and 3
hours of induced expression with 1%, 5% and 10% lactose. Lane 1: Precision Plus Protein
Standard, lane 2: EV cells induced with 1% lactose for 1 hour, lane 3: EV cells induced with 1%
lactose for 3 hours, lane 4: EV cells induced with 5% lactose for 1 hour, lane 5: EV cells induced
with 5% lactose for 3 hours, lane 6: EV cells induced with 10% lactose for 1 hour, lane 7: EV
cells induced with 10% lactose for 3 hours.
A B

37
A B
Figure 13. Total protein extracted from SKE cells induced with 0.25mM, 0.5mM and
0.75mM IPTG. A) insoluble proteins and B) soluble proteins from SKE cells with samples
taken after 1 hour and 3 hours of induced expression with 0.25 mM, 0.5 mM and 0.75 mM
IPTG. Lane 1: Precision Plus Protein Standard, lane 2: SKE cells induced with 0.25 mM
for 1 hour, lane 3: SKE cells induced with 0.25 mM for 3 hours, lane 4: SKE cells induced
with 0.5 mM for 1 hour, lane 5: SKE cells induced with 0.5 mM for 3 hours, lane 6: SKE
cells induced with 0.75 mM for 1 hour, lane 7: SKE cells induced with 0.75 mM for 3
hours.
Figure 14. OD600 growth comparison of BL21 Star, EV, and SKE cells in the presence of either
1mM IPTG or 5% lactose. A) 1 mM IPTG or B) 5% lactose over a nine-hour period. Each
sample was a single reading.

38
3.3 Qualitative Assessment of Growth in Stressed SKE and EV E. coli Cells
Spotting growth assays were used to initially examine if Npun_F1277 inferred any
qualitative advantage to the SKE cells compared to EV and BL21 Star cells. To first determine
how IPTG and lactose in the EV and SKE cells would affect their growth under stress, each strain
was exposed to darkness, white light, or UVA stress in both ten-fold and two-fold dilution series.
Overall, the SKE and EV cells exposed to 1 mM IPTG had a harder time growing under each stress
when compared to the unexposed BL21 Star and EV control cells (Figures 15 and 16). Specifically,
in the two-fold dilution series, the exposed cells under UVA treatment were able to grow up to 2-
2, while unexposed cells were able to grow up to 2-3 (Figure 15C). Moreover, the ten-fold dilution
series showed that exposure to IPTG caused the cells to not grow as efficiently when compared to
those that were unexposed, even under darkness (Figure 16).
Based on initial results, it was determined that the IPTG was likely having a toxic effect
on the cells when used to induce the lac operon, therefore 5% lactose was substituted as the
inducing agent to determine if it would mitigate the toxic effect in subsequent stress experiments.
When using 5% lactose as the inducer, the two-fold spotting assays had similar growth along the
entire dilution series under every stress (Figure 17). However, cells in the 10-fold dilution series
were able to grow out to the 10-4, 10-3, and 10-2 dilution for darkness, white light, and UVA stress
respectively (Figure 18), each being able to grow at least one further dilution than those induced
with IPTG. Moreover, under darkness, the exposed cells exhibited similar growth to the control
unexposed groups. To improve viability under each stress when induced with lactose, SKE cells
were acclimated by growth on 5% lactose for varying amounts of time prior to exposure to UVA
stress at 37 °C. The results indicated that a minimum of 1-hour growth on 5% lactose prior to stress

39
improves survivability of SKE cells exposed to UVA (Figure 19). Therefore, a 3-hour acclimation
time period was chosen as it would allow for increased cell survival and minimize time constraints.
Figure 15. Two-fold dilution series for cells under various stress conditions without an
acclimation period. SKE and EV cells are induced with 1 mM IPTG where noted. A) Cells in
darkness, B) cells grown under white light, C) cells grown under UVA stress.
Figure 16. Ten-fold dilution for cells under various stress conditions without an acclimation period.
SKE and EV cells are induced with 1 mM IPTG where noted. A) Cells in darkness, B) cells grown
under white light, C) cells grown under UVA stress.
2-1 2-2 2-3 2-4 2-1 2-2 2-3 2-4 2-1 2-2 2-3 2-4
A B C
BL21
EV Cells
Induced EV
Induced SKE
100 10-1 10-2 10-3 10-4 100 10-1 10-2 10-3 10-4 100 10-1 10-2 10-3 10-4
BL21
EV Cells
Induced EV
Induced SKE A B C
40
Figure 17. Two-fold dilution for cells under various stress conditions without an acclimation
period. SKE and EV cells are induced with 5% lactose where noted. A) Cells in darkness, B)
cells grown under white light, C) cells grown under UVA stress.
Figure 18. Ten-fold dilution for cells under various stress conditions without an acclimation
period. SKE and EV cells are induced with 5% lactose where noted. A) Cells in darkness, B)
cells grown under white light, C) cells grown under UVA stress.
20 2-1 2-2 2-3 2-4 20 2-1 2-2 2-3 2-4 20 2-1 2-2 2-3 2-4
BL21
EV Cells
SKE Cells
Induced EV
Induced SKE A B C
100 10-1 10-2 10-3 10-4 100 10-1 10-2 10-3 10-4 100 10-1 10-2 10-3 10-4
BL21
EV Cells
SKE Cells
Induced EV
Induced SKE A B C

41
Figure 19. Comparison of SKE cells when acclimation time to 5% lactose is varied prior to 14
hours of UVA exposure. A) SKE cells acclimated for one-hour, B) SKE cells acclimated for
three hours, C) SKE cells acclimated for five hours.
In the results from the spotting assays with 5% lactose as the inducing agent and a three-
hour acclimation period, the two-fold spotting assays had similar growth along the entire dilution
series under white light and UVA stress for each cell type up to the 2-6 dilution (Figure 20). This
result was similar to the result observed with no acclimation period seen in Figure 17. However,
for cells in the 10-fold dilution series, all of the cells grown in darkness were able to grow up to
the 10-4 dilution (Figure 21A). Under white light stress, BL21 Star cells and uninduced EV and
SKE cells were able to grow up to the 10-4 dilution, while induced EV and SKE cells were able to
grow up to the 10-3 dilution, with little difference between the two cell types (Figure 21B). Under
UVA stress, all cell lines were able to grow up to the 10-3 dilution, with BL21 Star and the
uninduced cells having the greatest growth. Interestingly induced SKE cells were able to grow
slightly better than induced EV cells (Figure 21C). Moreover, the two-fold spotting assay for the
UVB stress showed that the cells generally struggled to grow after 15 minutes of exposure (Figure
22). Overall, all cell lines under UVB stress were able to grow up to the 2-3 with varying results,
as EV cells that were induced were shown to have the most growth.
100 10-1 10-2 10-3 10-4
A
C
B

42
Figure 20. Two-fold dilution for cells under various stress conditions after a three-hour
acclimation period to 5% lactose where noted. A) Cells in darkness, B) cells grown under white
light, C) cells grown under UVA stress.
Figure 21. Ten-fold dilution for cells under various stress conditions after a three-hour
acclimation period to 5% lactose where noted. A) Cells in darkness, B) cells grown under white
light, C) cells grown under UVA stress.
BL21
EV Cells
SKE Cells
Induced EV
Induced SKE
2-1 2-2 2-3 2-4 2-5 2-6 2-1 2-2 2-3 2-4 2-5 2-6 2-1 2-2 2-3 2-4 2-5 2-6
A B C
100 10-1 10-2 10-3 10-4 100 10-1 10-2 10-3 10-4 100 10-1 10-2 10-3 10-4
BL21
EV Cells
SKE Cells
Induced EV
Induced SKE A B C
43
Figure 22. Two-fold dilution spotting assay of cells stressed with UVB after a three-hour
acclimation period to 5% lactose where noted. A) Cells grown in darkness, B) cells grown under
UVB stress.
Overall it appears as though the sensor kinase Npun_F1277 did not provide any increased
fitness to SKE cells, but rather inducing expression of the SK, and the lac operon in general, caused
decreased fitness. Under control conditions in darkness, and to a lesser extent in the white light
treatment, this difference in fitness was minor. However, under UVA stress conditions the BL21
Star control cells were able to grow at least one further dilution than the EV and SK cells.
Interestingly, under UVB stress, the induced EV cells were able to grow better compared to all of
the other cells. This result indicates that the SK may perhaps be toxic to the E. coli cells when
expressed under UVB conditions. However, the UVB spotting assay is the only experiment to
show induced EV cells faring better the induced SKE cells.
3.4 Quantitative Assessment of Growth in Stressed SKE and EV E. coli Cells
Quantitative growth was assessed using a growth curve generated using OD600 readings
taken every hour as well as CFU/ml counts taken from dilution plates, in which all cell lines were
induced with 5% lactose over the course of data collection. As an initial control, all three cell lines
were grown without 5% lactose in complete darkness at 37 °C. Single time point readings were
20 2-1 2-2 2-3 20 2-1 2-2 2-3
BL21
EV Cells
Induced EV
Induced SKE
A B
44
taken for each growth curve rather than replicates. The results of the OD600 readings indicated
that all three cell lines under these conditions were able to grow at roughly the same rate (Figure
23A). When compared to CFU/ml counts, there is a similar trend, with EV cells fairing a little
worse than the SKE and BL21 Star cells (Figure 24A). When comparing cells under continuous
UVA stress after a three-hour acclimation period, both the EV and SKE cells were induced with
5% lactose. Results showed that when the cell lines were stressed with UVA, BL21 Star cells were
able to grow much more effectively compared to both EV and SKE cells that were induced. This
result is not dissimilar to that seen in the UVA spotting experiments, as the BL21 Star cells had a
much easier time growing then the induced EV and SKE cells. When looking at the OD600
readings for UVA (Figure 23B) there is a clear stratification, with induced EV cells having the
hardest time growing after exposure to UVA, and BL21 cells reaching stationary phase by the end
of the data collection period. In contrast, the CFU/ml growth curve results for the UVA stress
(Figure 24B) revealed that the induced EV cells had a more difficult time growing even prior to
the exposure to UVA, while induced SKE cells were able to grow at a comparable rate to the BL21
Star cells prior to UVA exposure. Under UVB stress, cells were once again exposed to UVB for
15 minutes after an initial three-hour acclimation period to 5% lactose. Looking at the OD600
growth data, all cells saw a sharp drop in growth by the seven-hour mark, about four-hours after
UVB exposure (Figure 23C). When compared to the UVB CFU/ml growth data (Figure 24C), all
cell lines began to see a drop at least an hour post-exposure to UVB, however induced SKE cells
and uninduced EV cells seemed to peak in growth at the four-hour mark prior to a decline. Overall,
it seems that inducing the lac operon inhibits the growth of the cells, as uninduced EV and SKE
cells grew at roughly the same rate as BL21 Star cells when not exposed to any stress and UVA
stress showed that BL21 Star cells were shown to have superior growth compared to induced EV
45
and SKE cells. Interestingly, under UVB stress when looking at the CFU/mL data, induced SKE
cells and uninduced EV cells were shown to have the highest peaks of growth compared to induced
EV cells and BL21 Star cells after UVB exposure. This suggests that the SK may be able to help
in times of stress, however, this data is not conclusive as the 0D600 readings do not share this
same trend under UVB stress as well as the uninduced EV cell ability to grow just as well as the
induced SKE cells when strictly looking at the CFU/mL data.
Figure 23. OD600 growth curves comparisons of cell lines exposed to UVA and UVB. Arrows
represent start of stress exposure at 3 hrs; sample taken prior to beginning of stress in B and C.
A) Cell lines that were not induced and grown in the dark, B) cell lines induced with 5% lactose
and exposed to UVA at the 3 hour mark continuously, and C) cell lines exposed to UVB at the 3
hour mark for 15 minutes and then continued growth in darkness. EV and SKE cells were
induced with 5% lactose, with uninduced EV cells and BL21 Star cells as controls. Each point
was generated from single OD600 readings.
46
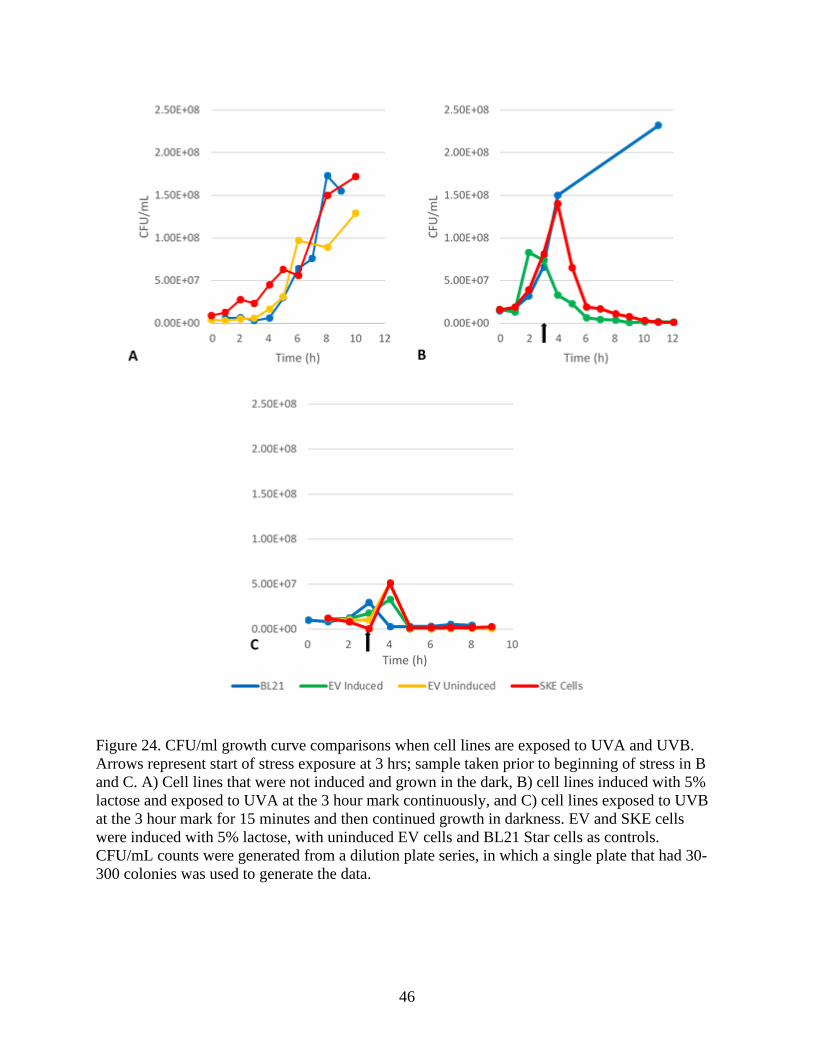
Figure 24. CFU/ml growth curve comparisons when cell lines are exposed to UVA and UVB.
Arrows represent start of stress exposure at 3 hrs; sample taken prior to beginning of stress in B
and C. A) Cell lines that were not induced and grown in the dark, B) cell lines induced with 5%
lactose and exposed to UVA at the 3 hour mark continuously, and C) cell lines exposed to UVB
at the 3 hour mark for 15 minutes and then continued growth in darkness. EV and SKE cells
were induced with 5% lactose, with uninduced EV cells and BL21 Star cells as controls.
CFU/mL counts were generated from a dilution plate series, in which a single plate that had 30-
300 colonies was used to generate the data.

47
3.5 Expression of Candidate Genes in Stressed SKE and EV E. coli Cells
When the expression of homologous response regulator, stringent response, and SOS
DNA repair genes were compared between EV and SKE cells under each stress, a few trends
were identified. After 30 minutes of exposure of white light, there was no significant changes in
expression, while under UVA stress, only recA experienced a significant change in gene
expression, with a 239.87-fold change. After 15 minutes of exposure to UVB, many of the genes
experienced significant upregulation. Specifically, cusR saw a 5.01-fold change, lexA saw a 5.30
change, while spoT and phoB saw more modest changes in regulation, with a 2.27-fold and 2.76-
fold change respectively (Table 3).
Moreover, when looking at longer durations of stress (or in the case of UVB the ability to
recover post exposure), the SKE cells seemed to have continued altered expression. Under 60
minutes of white light exposure, cusR was shown to have a -5.62-fold change, phoB had a 30.09-
fold change and spoT had the greatest observed change in expression under any stress with a
6747.73-fold change. Under 60 minutes of UVA, cusR experienced a 225.18-fold change, phoB
experienced an 86.12-fold change, and spoT experienced a 133.09-fold change. Finally, after 30
minutes post exposure to UVB , SKE cells experienced a -953.28-fold change in recA expression
(Table 4).
Comparing SKE cells grown in the dark to SKE cells exposed to various stress, it was
shown that there was no appreciable change when the cells were exposed to white light, while
UVA stress was shown to have a few significant changes. After 30 minutes of UVA exposure,
the only significant change was a -42.18-fold change of lexA (Table 5), while after 60 minutes of
UVA exposure, the only significant change was a -3.71-fold change in spoT (Table 6). UVB
exposure was shown to have the greatest response when comparing SKE cells as after 15
minutes of exposure, as five of the six genes had significant changes in gene regulation as cusR

48
had a 35.27-fold change, phoB had a 38-fold change, spoT had a 22.82-fold change, lexA had a
-9.5-fold change and finally relA had a 73.61-fold change (Table 5). Moreover, 30 minutes post
UVB exposure had a similar trend as four of the six genes experienced significant changes in
gene expression as phoB had a 10.12-fold change, spoT had a 3.3-fold change, lexA had a 43.49-
fold change and relA had 302.17-fold change (Table 6).
Table 3. Quantitative PCR fold-change for all six candidate genes compared between SKE and
EV cells after exposure to white light and UVA for 30 minutes and UVB for 15 minutes.
WL UVA UVB
Biosynthetic Genes Regulation p-value Regulation p-value Regulation p-value
cusR - - -5.65 0.2666 5.01 0.0092*
phoB 207.41 0.1677 - - 2.27 0.0435*
spoT 159.03 0.0787 - - 2.76 0.0047*
lexA - - 18.94 0.1045 5.30 0.0175*
recA 2316.22 0.1461 239.87 0.0475* - -
relA 7.13 0.1719 - - 3.78 0.0834
*Statistically different from the EV cell control exposed to the same stress, n=3, p < 0.05 Dashes indicate no change in regulation or inconclusive results when compared to the control
Table 4. Quantitative PCR fold-change for all six candidate genes compared between SKE and
EV cells after exposure to white light and UVA for 60 minutes and UVB for 30 minutes.
WL UVA UVB
Biosynthetic Genes Regulation p-value Regulation p-value Regulation p-value
cusR -5.62 0.0006* 225.18 0.0602 - -
phoB 30.09 0.0009* 86.12 <0.0001* - -
spoT 6747.73 0.0085* 133.09 <0.0001* - -
lexA 42.67 0.1549 718.25 0.3524 - -
recA 278.88 0.2135 20.27 0.2918 -953.28 <0.0001*
relA - - - - - -
*Statistically different from the EV cell control exposed to the same stress, n=3, p < 0.05 Dashes indicate no change in regulation or inconclusive results when compared to the control

49
Table 5. Quantitative PCR fold-change for all six candidate genes compared between SKE cells
after exposure to stress as white light and UVA for 30 minutes or UVB for 15 minutes versus
SKE cells in the dark.
WL UVA UVB
Biosynthetic Genes Regulation p-value Regulation p-value Regulation p-value
cusR - - -4.17 0.4867 35.27 0.0034*
phoB -2.31 0.6974 - - 38.00 0.0053*
spoT - - - - 22.82 0.0005*
lexA - - -42.28 <0.0001* -9.50 0.0005*
recA - - 4.42 0.1112 28.01 0.0901
relA 2.51 0.3817 10.49 0.1516 73.61 0.0298*
*Statistically different from the SKE cells grown in darkness, n=3, p < 0.05 Dashes indicate no change in regulation or inconclusive results when compared to the control
Table 6. Quantitative PCR fold-change for all six candidate genes compared between SKE cells
after exposure to stress as white light and UVA for 60 minutes or UVB for 30 minutes versus
SKE cells in the dark.
WL UVA UVB
Biosynthetic Genes Regulation p-value Regulation p-value Regulation p-value
cusR - - -14.35 0.3148 7.04 0.0985
phoB - - -11.28 0.2582 10.12 0.0052*
spoT - - -3.71 0.0507* 3.30 0.0045*
lexA 5.19 0.2464 69.28 0.3537 43.49 0.0033*
recA 5.01 0.2514 13.21 0.2604 - -
relA 10.22 0.2539 40.81 0.3410 302.17 0.0005*
*Statistically different from the SKE cells grown in darkness, n=3, p < 0.05 Dashes indicate no change in regulation or inconclusive results when compared to the control

50
DISCUSSION
Previous studies done with N. punctiforme determined that the expression of scytonemin
is controlled by the two-component regulatory system (TCRS) encoded by Npun_F1277 (sensor
kinase; SK) and Npun_F1278 (response regulator; RR) (Janssen & Soule, 2016; Naurin et al.,
2016). Moreover, in an RNA-seq study of a Npun_R1278 null mutant strain of N. punctiforme
where the total gene expression under UVA stress was assessed (Klicki, K., unpublished data), it
was found that this TCRS may also impact other mechanisms within the cell, as many processes
such as the stringent response, were negatively down-regulated in the mutant strain. Therefore, it
was hypothesized that expressing the Npun_F1277 SK within E. coli cells would confer increased
fitness to E. coli grown under light and UVR stress. If fitness is indeed enhanced, then this could
be observed by a change in phenotype that allows for enhanced growth under light and UVR stress,
as well as in the differential regulation of genes involved in regulatory mechanisms, such as the
stringent response and SOS DNA repair response. To test this hypothesis, spotting growth assays
and growth curves were used to analyze the fitness levels of E. coli cells expressing the
Npun_F1277 SK (SKE cells) compared to both control BL21 Star cells as well as cells transformed
with an empty vector (EV cells). Quantitative-PCR was also used to analyze changes in the
expression of key regulatory genes between these cells (SKE and EV) as well as unstressed cells.
4.1 Fitness of E. coli SKE Cells
When comparing SKE cells to untransformed BL21 Star cells, EV cells were used as an
additional control to assess if inducing the lac operon caused any observable changes. In the initial
spotting assays to assess qualitative growth, it was shown that the inducing agent used on the lac
operon was an important factor in evaluating if the SK was conferring fitness. Specifically, it

51
seemed that IPTG was having a toxic effect on the cells, as BL21 Star and uninduced EV cells
were able to grow at higher dilutions in both the two-fold (Figure 15) and ten-fold spotting assays
(Figure 16). When compared to the spotting assays in which lactose was used as the inducing agent,
both induced and uninduced cell lines exhibited similar growth on the two-fold spotting assay
(Figure 17), while the induced EV and SKE cells still had a harder time growing when exposed to
either white light or UVA stress in the ten-fold spotting assays, although the growth was much
more discernible (Figure 18). These results suggest that inducing the lac operon, regardless of the
inducing agent, causes a negative effect on cell survivability. However, this is not unexpected, as
previous studies that examined expression of the lac operon also showed that lactose was able to
mitigate some of the metabolic burden of continuous expression when compared to IPTG (Dvorak
et al., 2015). To try and further mitigate these metabolic constraints, cells were given an incubation
period of 3 hours in darkness in the presence of 5% lactose prior to stress exposure.
Spotting assays that used both a three-hour incubation period with 5% lactose as an
inducing agent revealed that under two-fold dilution spotting, induced EV and SKE cells were
capable of growing at about the same amount as the uninduced cell lines under both white light
and UVA stress (Figure 20). However, in the ten-fold spotting assays under the same conditions,
the induced EV and SKE cells failed to grow as well as the other cell lines (Figure 21). Under
UVB stress conditions, induced EV cells seemed to have the most growth, while induced SKE
cells showed the least amount of growth (Figure 22). This result conflicts with all of the previous
spotting assays, suggesting that inducing the lac operon alone causes an increased fitness under
UVB. In general, even though inducing the EV and SKE cell lines generally caused them to have
decreased fitness, the SKE cells seemed to be more viable under white light and UVA stress than
the induced EV cells, although the differences are too subtle to draw any conclusions.

52
The OD600 and CFU/mL growth curves used to assess quantitative growth had similar
results as the spotting assays. When cells were grown in the dark, all cell lines grew at a comparable
rate (Figure 23A and Figure 24A). The trends observed from both the OD600 values and CFU/mL
plate counts are generally the same for each cell line. Under UVA stress, BL21 Star cells were
able to grow better than both induced EV and SKE cells and the induced SKE cells were able to
grow better than the induced EV cells (Figure 23B and Figure 24B). When examining the OD600
readings under UVA stress, it appears that the induced EV cells reach their stationary phase
somewhere between 3-4 hours after beginning UVA exposure, while induced SKE cells appeared
to still be on an upward trajectory though the end of the experiment. These SKE cells grow even
better than the BL21 Star cells, which reach stationary phase about nine hours after beginning
UVA exposure. When compared to the CFU/mL, the overall trend is like that seen in the OD600
readings but showed a more immediate reaction to UVA exposure. EV cells experienced a decline
in growth one hour immediately after exposure, while SKE cells decline after 2 hours of exposure.
Interestingly, it appeared that BL21 Star cells were still in the exponential growth phase throughout
the duration of the experiment, even in the presence of UVA radiation.
Under UVB stress, the results obtained through absorbance and plate counts were not as
consistent as the UVA results. The absorbance data for UVB stressed cells (Figure 23C) showed
that all cell lines had similar growth patterns until at least 4 hours after beginning UVB exposure,
in which induced EV cells were shown to be in decline, and all other cell lines experienced a
decline two hours later. When comparing UVB CFU/mL data (Figure 24C) to the OD600 readings,
these same trends do not appear. Just like the UVA results, it appears that exposure to the stress
had a more immediate impact than what the OD600 readings indicated. Specifically, BL21 Star
cells saw an immediate decline just 45 minutes after being exposed to UVB, while all other cell

53
lines experienced a decline an hour after the BL21 Star cells declined. The discrepancy seen in the
survivability of each cell line between the UVB absorbance and CFU/mL data is most likely the
result of dead cells and other cellular debris inflating the OD600 readings when sample points
were taken. While the growth curve results generally show that induced SKE cells are still able to
grow better than induced EV cells, these results are not convincing, as the BL21 Star control cells
and uninduced EV cells should have similar growth to each other under UVB stress. However, it
is interesting that the plate count data immediately after UVB stress shows a strong recovery for
cells carrying the vector (both induced and uninduced) as compared to BL21 Star control cells.
However, with the growth curves lacking replicates, the experiments must be repeated to determine
if the comparative growth rates remain consistent or if there is any variation that was not originally
observed. Due to this, the results of the growth curves cannot be reliably interpreted. Therefore, in
order to mitigate this issue, when the experiment is repeated, at least three OD600 readings and
plate count values should be taken for an average to account for potential variance.
Overall, expressing the SK in E. coli cells seems to have a toxic effect when the cells are
stressed, based on the fact that SKE cells have less growth compared to the controls. What is
unclear is how much of this effect is due to the expression of the lac operon alone, and how much,
if any, is due to the presence of the SK. In previous studies, expression of the lac operon within E.
coli has shown to inhibit the production of proteins that are present during exponential growth
(Kosinski, 1992). This problem was the biggest obstacle within this study, and as a result, it could
not be determined if the SK was toxic to the cells, if the lac operon was inhibiting growth, or a
combination of the two. However, based on the results of the CFU/mL growth curves and
observations from the spotting assays, it is most likely that the lac operon is responsible for the
SKE cells having a lower level of fitness than uninduced cell lines, as induced SKE cells still

54
generally performed better than induced EV cells. Specifically, the production of beta-
galactosidase (encoded by lacZ) could be responsible for this effect, as previous studies have
shown that when present within the periplasm of E. coli cells it can have toxic effects (Snyder &
Silhavy, 1995). Therefore, in order to determine if the Npun_F1277 SK can infer increased fitness
when expressed within E. coli, a different vector should be used. Specifically the pBAD operon
controlled with L-arabinose or the Tet-operon controlled with tetracycline and doxycycline may
be better inducible systems, as both of these systems are reversible for greater control (Gossen et
al., 1995; Guzman et al., 1995). Furthermore, if the lac operon proves to be the most effective way
of expressing the SK, perhaps reducing the amount of lactose used to induce expression would
mitigate this. Although 5% lactose was used in this study, 1% lactose was also shown to be capable
of inducing expression of the SK, therefore these experiments could be repeated with different
levels of lactose to see if it improves observable results. The experiments could also be repeated
using the same conditions, but with more replicates to allow for more accurate comparisons. In
tandem with this though, the use of different model organisms should be explored to see if the
results observed are limited to E. coli, or if the results are widespread among other organisms
expressing the Npun_F1277 SK. Faster-growing cyanobacteria, such as Synechocystis PCC 6803
or Synechococcus PCC 7942, would also make good candidates, since they are oxygenic
phototrophs and they also have a variety of available molecular tools. Moreover, additional
spotting assays and growth curves could be performed under different stress conditions such as
exposure to reactive oxygen species as well as changes in temperature and salinity to determine if
the SK can infer fitness against non-light-based stimuli.

55
4.2 Gene Expression Changes
The variable growth identified in the previous experiments revealed that the SK, when
placed in E. coli, can interact in some form with other stress response mechanisms and E. coli
molecular machinery. This result is not entirely unexpected, as previous studies have shown that
genes from the N. punctiforme scytonemin biosynthetic pathway were able to interact with native
E. coli pathways (Malla & Sommer, 2014). What is interesting is that it appears that the SK cells
are much more sensitive to light-based stress and changes in the environment than the control cells,
as shown in both the growth and gene expression assays. In general, when SKE cells were exposed
to white light, UVA, or UVB, they had significant changes in gene regulation when compared to
EV cells. However, there was much less of an impact when stressed SKE cells were compared to
control SKE cells grown in the dark. Moreover, it appears that the SK may be able to interact with
other RRs in E. coli, although this interaction may vary with the type of stress and duration of
stress.
When selecting candidate genes to analyze within E. coli, protein sequences were used to
identify homology rather than protein functionality. Candidate regulatory genes of interest in N.
punctiforme were identified using an RNA-seq study of a mutant strain of N. punctiforme in which
the response regulator (Npun_F1278) was knocked-out and the total gene expression under UVA
stress was assessed (Klicki, K., unpublished data). Genes were selected based on 1) if their
expression had been significantly altered by the absence of the Npun_F1278 RR or 2) if they were
directly involved in DNA repair mechanisms, as UVA exposure has been known to harm DNA.
Appropriate homologs in E. coli were then found through Protein-BLAST searches in which
homologs had at least 33% query cover and 33% percent identity in the amino acid sequence
compared to the candidate gene product found in N. punctiforme. Overall six genes were selected,

56
three of which had identical annotations within both organisms (lexA, recA and relA), while the
other three, cusR, phoB and spoT, were much different.
The protein encoded by cusR within E. coli is annotated as a RR that is involved in the
regulation of copper within the cell to avoid metal toxicity (Munson et al., 2000), while its closest
homolog within N. punctiforme is the Npun_F1278 RR, which is involved in the production of
scytonemin (Janssen & Soule, 2016; Naurin et al., 2016). When looking at the expression of this
gene within SKE and EV cells exposed to the same stress, a few trends can be observed. After 60
minutes of exposure to white light, SKE cells had a significant down-regulation of the gene, while
there is significant up-regulation of this gene after 15 minutes of UVB exposure. Moreover, when
examining the expression of this gene in the context of SKE cells under different stress conditions
compared to unstressed SKE cells in the dark, the only significant change was also after 15 minutes
of UVB exposure, a significant up-regulation that is seven times greater (35.27 fold-change) than
the SKE versus EV cell comparison (5.01 fold-change). These results suggest that when under
UVB stress, E. coli cells may be attempting to rebalance copper within the cells. This dual response
was also found in studies using Pterocladiella capillacea, a red alga, where it was shown that
copper and UVR may have synergistic effects on the cell (Schmidt et al., 2015). This implies that
within N. punctiforme, the SK may actively play a role in copper regulation in conjunction with
the Npun_F1278 RR.
The protein encoded by phoB in E. coli is involved in the allocation of phosphate when
levels of phosphate within the cell become diminished (Brickman & Beckwith, 1975), while its
closest homolog in N. punctiforme, Npun_F2162, is a general response regulator receiver.
Expression of this gene was significantly altered after white light, UVA, and UVB exposure when
comparing SKE to EV cells. What is interesting is that in each case, the gene was significantly up-

57
regulated, with UVA having the largest fold-change at 86.12 and UVB with the lowest at 2.27.
Furthermore, when comparing stressed and dark unstressed SKE cells, the only significant change
was up-regulation post UVB exposure. These results show that when the SK is exposed to UVA
and UVB stress, it may try to mitigate the stress by acting on alternative pathways to increase
phosphorus levels within the cell. A similar result was seen in previous studies, as phosphate
limitations were shown to increase the impact of UVR stress, specifically on growth rates and
photosynthetic activity, within freshwater algae and their communities (Aubriot et al., 2004; Xu
& Gao, 2009).
The protein encoded by spoT in E. coli is an enzyme that catalyzes both the synthesis and
degradation of ppGpp (guanosine 3'-diphosphate 5-' diphosphate), which is involved in the
stringent response of the cell. The stringent response helps cells cope with stress conditions such
as amino-acid starvation, fatty acid limitation, heat shock, or UVR stress, in which the cell
reallocates nutrients for only essential functions important for survival (Laffler & Gallant, 1974).
Moreover, when looking at the close homolog of spoT in N. punctiforme, the protein encoded by
Npun_R2633, it is annotated as a metal-dependent phosphohydrolase. Most metal-dependent
phosphohydrolases are part of the stringent response and are members of a highly conserved
domain. These proteins are responsible for the breakdown of ppGpp. Specifically, in E. coli, it has
been shown that SpoT protein has some overlap with metal-dependent phosphohydrolase domains
(Calderón-Flores et al., 2005). The stringent response seemed to have an increased activation in
SKE cells when compared to EV cells, as spoT expression was significantly up-regulated in
response to white light, UVA, and UVB stress. Moreover, when comparing stressed and dark
unstressed SKE cells, this gene was significantly up-regulated post UVB exposure and slightly
down-regulated after 60 minutes of UVA exposure. This may imply that the SK may assist in

58
reallocating resources within its native organism needed for scytonemin biosynthesis as well as
other vital cellular functions, such as DNA repair mechanisms and storing large amounts of
nutrients to survive prolonged stress. However, this cannot be said with complete certainty, as the
spoT homolog in N. punctiforme was not annotated with this function.
Moreover, relA also encodes a protein involved in the stringent response, functioning to
catalyze the formation of (p)ppGpp, which will later be hydrolyzed to form ppGpp (Metzger, 1989).
When comparing SKE and EV cells under the same stress, there are no observable changes in gene
expression under any stress. A similar trend is also seen when comparing stressed and dark
unstressed SKE cells under white light and UVA, as this gene is only up-regulated after UVB
exposure. This result indicates that the SK does not influence the expression of this gene as
strongly as it does the other genes tested, as the up-regulation observed in the SKE cell comparison
can be seen as a normal cellular response to UVB stress. This has been shown in previous studies
with E. coli and UVA exposure, which caused a delay in growth, increased levels of ppGpp above
basal levels, and affected the general activation of the stringent response (Oppezzo et al., 2011)
The proteins encoded by lexA and recA function in SOS DNA repair, in which LexA is
involved in the repression of gene expression by binding to the operator of target genes, and
blocking RNA polymerase from binding. RecA is involved in the annealing of single-stranded
DNA and inactivates the repressor LexA (Little & Mount, 1982). The SK seemed to have a large
influence on SOS DNA repair mechanisms, as recA was significantly up-regulated after 30
minutes of UVA exposure and lexA was up-regulated just after 15 minutes of UVB exposure when
comparing SKE cells to EV cells. Interestingly, a significant down-regulation (-953.28 fold-
change) of recA is seen just 30 minutes post UVB exposure. This suggests that the SK may increase
the rate of the SOS response throughout the cell, which could explain the large fold-changes

59
observed. Moreover, when comparing the stressed SKE cells to the unstressed dark SKE cells,
there was a negative fold-change after 30 minutes of UVA and 15 minutes of UVB exposure for
lexA, which changed to an up-regulation of this gene under 30 minutes of UVB exposure. This
result may indicate that the SK may aide in the ability to quickly adapt to the stress and make
preparations ahead of time. This would make sense, as the SK primarily functions to detect changes
in the external environment Moreover, since the SOS DNA repair pathway has been shown to be
one of the initial to reactions to any stress, including UVA in other organisms such as Salmonella
typhimurium and Caulobacter crescentus (Smith et al., 1991; da Rocha et al., 2008), these results
could provide a better indication as to how the SK interacts with the mechanism. However, what
is most intriguing about this result is that the homologs within N. punctiforme did not exhibit
altered expression in the deleted Npun_F1278 RR strain compared to its control (Klicki, K.,
unpublished data).
Overall, it seems that the presence of the SK within E. coli cells caused an increased
response to UVR primarily, with a lesser response to white light. When looking at the data, the
SKE cells appear to have had an increased effort of regulating copper and phosphorus within the
cells compared to the EV cells. The movement of these two nutrients in and out of the cell is not
uncommon when E. coli cells are exposed to UVR, as copper has been shown to have synergistic
affects (Schmidt et al., 2015), while increased phosphorus levels have been shown to help mitigate
the stress on the cell (Aubriot et al., 2004; Xu & Gao, 2009). This increased allocation of
phosphorus may be related to the increased regulation of the stringent response, as phosphate
groups are required for the synthesis of ppGpp, the main catalyst for the stringent response. These
changes are less pronounced when comparing stressed SKE cells to unstressed SKE cells overall.
This may imply that the SK also functions to regulate basal levels of these nutrients so the cell can

60
provide a faster response to stress conditions. This may explain why changes in gene expression
were most evident under higher levels of stress.
SOS repair mechanisms were more dramatic in the SKE/EV comparison compared to the
stressed/unstressed SKE comparison. Again, this may imply that the SK increases the effectiveness
and reactivity of not only this mechanism but also related pathways. However, regardless of the
presence of the SK, exposure to both UVA and UVB should cause activation of this mechanism.
Therefore, to better understand the functionality of this SK in regard to the global response within
the cell, other genes involved with metabolic regulation and defense mechanisms should be
measured under these conditions in these cells.
4.3 Summary and Conclusions
The purpose of this study was to determine if the UV-responsive sensor kinase
Npun_F1277 from N. punticforme can assist growth and survivability in E. coli cells in response
to light-associated stress conditions. To complement these studies, changes in the expression of
genes involved in stress adaptation were also examined in SKE E. coli cells under the same
conditions. Results from the spotting and growth curve assays under UVA and UVB stress
revealed that expressing the SK from the lac operon on the expression vector was harmful, as SKE
cells struggled to grow in comparison to BL21 Star cells as well as uninduced cell lines when
under stress. The reason for this may be explained by the presence of beta-galactosidase within the
E. coli cells, as its presence has been shown to be toxic and inhibit growth within E. coli cells
(Snyder & Silhavy, 1995). Furthermore, since induced SKE cells generally performed better under
stress when compared to EV cells, it is likely that the SK is beneficial to the cell. The variance in
results suggests that the amount of acclimation time for these cells to adjust to protein expression,
as well as the duration of stress exposure, are both factors in how E. coli responds to each stress.

61
However, the growth curve data fails to account for potential variance as it lacks reliable replicates
therefore, growth curves should be repeated with multiple readings to verify the original results
observed. Moreover, additional spotting assays should be explored to determine if there is an
optimum acclimation and stress duration to obtain observable differences in E. coli fitness between
SKE and control cells.
Moreover, this study examined if the Npun_F1277 SK plays a role in multiple defense
mechanisms and possibly interacts with response regulators other than its native Npun_F1278 RR
in N. punctiforme. The results of the gene expression study showed that many of the selected genes
were significantly altered, with the type and duration of the stress being a determining factor. This
significant change in gene expression, however, was not shown to have much of an effect at the
phenotypic level. This may be explained by the toxic effects of continuous expression of beta-
galactosidase, causing the cells extra burden when the lac operon is induced. Perhaps by using a
different inducible promoter, a clear understanding of the SK’s effect on the phenotypic level can
be observed.
Interestingly, when comparing the results obtained from this study to the RNA-seq study
of a Npun_F1278 mutant strain of N. punctiforme (Klicki, K., unpublished data), expression of
lexA,and recA were significantly altered within E. coli, while their homologs within N. punctiforme
were not altered under UVA stress. When exploring other genes within the Klicki study, several
of the genes that experienced a significant change in gene expression in the absence of the
Npun_F1278 RR were primarily associated with the scytonemin biosynthetic pathway, the
stringent response and nutrient allocation, as well as several hypothetical proteins. However, these
levels of gene expression are highly dependent on both the duration and the intensity of the stress
on the cell. Therefore, it may not be overly surprising that some of these genes experienced a

62
significant change under UVB exposure in E. coli cells, while in the Klicki study, their homologs,
like those involved in SOS DNA repair, failed to show a significant change under UVA, as RNA
transcript abundance varies dramatically over time. Therefore, in future studies the sampling time
and intensity of stress should be more standardized to have a better understand of the impact of
the SK.
These results showed that the SK, when expressed in an alternative host, can have a
profound effect on the stress response of a non-native host. This can be seen when comparing SKE
and EV cells exposed to the same stress for all of the genes, except for relA. Each of the other
genes had a significant change in expression under at least one stress, which demonstrated the wide
range of influence the SKE had on the physiology of E. coli cells. This was also seen when
comparing stressed and dark unstressed SKE cells, although the changes were not as profound.
This implies that both the Npun_F1277 SK and Npun_1278 RR within N. punctiforme may have
a wider global effect on gene expression, rather than only being limited to the scytonemin
biosynthetic pathway. This supports the initial hypothesis, showing that the SK can interact with
other mechanisms within the cell besides the scytonemin biosynthetic pathway. Therefore, further
research should be explored using other regulatory genes within E. coli SKE and EV cells.
Specifically, genes involved in relieving reactive oxygen species stress and heat acclimation
should be examined as other sensor kinases with similar domains are able to react to various
stresses such as temperature, starvation, and redox potentials in addition to light-based stimuli
(Ashby & Houmard, 2006). Moreover, to determine if the RR does play a larger role within
phototrophs, expressing both the SK and RR within other cyanobacteria, such as Synechocystis
PCC 6803 and Synechococcus PCC 7942, should be done. The information gathered from these
experiments could be used to further understand light-regulated genetic systems and how they

63
could be used in plants, algae, and bacteria in which the expression of gene products can be
precisely controlled through light intensity to minimize resources to produce agricultural crops
and commercial products in mass quantities.

64
REFERENCES
Allen, M. B., & Arnon, D. I. (1955). Studies on nitrogen-fixing blue-green algae. I. growth and
nitrogen fixation. Plant Physiology, 30, 366-372.
Ashby, M. K., & Houmard, J. (2006). Cyanobacterial two-component proteins: structure,
diversity, distribution, and evolution. Microbiology and Molecular Biology Reviews, 70,
472-509.
Aubriot, L., Conde, D., Bonilla, S., & Sommaruga, R. (2004). Phosphate uptake behavior of
natural phytoplankton during exposure to solar ultraviolet radiation in a shallow coastal
lagoon. Marine Biology, 144, 623-631.
Balskus, E. P., & Walsh, C. T. (2008). Investigating the initial steps in the biosynthesis of
cyanobacterial sunscreen scytonemin. Journal of the American Chemical Society, 130,
15260-15261.
Bebout, B. M., & Garcia-Pichel, F. (1995). UV B-induced vertical migrations of cyanobacteria in
a microbial mat. Applied and Environmental Microbiology, 61, 4215-4222.
Brickman, E., & Beckwith, J. (1975). Analysis of the regulation of Escherichia coli alkaline
phosphatase synthesis using deletions and φ80 transducing phages. Journal of Molecular
Biology, 96, 307-316.
Calderón-Flores, A., Du Pont, G., Huerta-Saquero, A., Merchant-Larios, H., Servín-González,
L., & Durán, S. (2005). The stringent response is required for amino acid and nitrate
utilization, nod factor regulation, nodulation, and nitrogen fixation in Rhizobium etli.
Journal of Bacteriology, 187, 5075-5083.
Castenholz, R. W. (2015). General characteristics of the cyanobacteria. In F. R. W.B. Whitman,
P. Kämpfer, M. Trujillo, J. Chun, P. DeVos, B. Hedlund and S. Dedysh (Ed.), Bergey's
Manual of Systematics of Archaea and Bacteria (pp. 1-23). New York: John Wiley &
Sons, Inc.
Castenholz, R. W., & Garcia-Pichel, F. (2012). Cyanobacterial responses to UV radiation. In B.
A. Whitton (Ed.), Ecology of Cyanobacteria II: Their Diversity in Space and Time (pp.
481-499). Dordrecht: Springer Netherlands.
D'Aoust, J. Y., Giroux, J., Baraan, L. R., Schneider, H., & Martin, W. G. (1974). Some effects of
visible light on Escherichia coli. Journal of Bacteriology, 120, 799-804.
da Rocha, R. P., de Miranda Paquola, A. C., do Valle Marques, M., Menck, C. F. M., &
Galhardo, R. S. (2008). Characterization of the SOS Regulon of Caulobacter crescentus.
Journal of Bacteriology, 190, 1209-1218.
Dvorak, P., Chrast, L., Nikel, P. I., Fedr, R., Soucek, K., Sedlackova, M., Chaloupkova, R., de
Lorenzo, V., Prokop, Z., & Damborsky, J. (2015). Exacerbation of substrate toxicity by
IPTG in Escherichia coli BL21(DE3) carrying a synthetic metabolic pathway. Microbial
Cell Factories, 14, 201, 1-15.
Galperin, M. Y. (2001). Novel domains of the prokaryotic two-component signal transduction
systems. FEMS Microbiology Letters, 203(1), 11-21.
Gao, Q., & Garcia-Pichel, F. (2011). Microbial ultraviolet sunscreens. Nature Reviews
Microbiology, 9(11), 791-802.
Garcia-Pichel, F., Sherry, N. D., & Castenholz, R. W. (1992). Evidence for an ultraviolet
sunscreen role of the extracellular pigment scytonemin in the terrestrial cyanobacterim
Chiorogloeopsis sp. Photochemistry and Photobiology, 56, 17-23.

65
Gossen, M., Freundlieb, S., Bender, G., Muller, G., Hillen, W., & Bujard, H. (1995).
Transcriptional activation by tetracyclines in mammalian cells. Science, 268, 1766-1769.
Guzman, L. M., Belin, D., Carson, M. J., & Beckwith, J. (1995). Tight regulation, modulation,
and high-level expression by vectors containing the arabinose pBAD promoter. Journal
of Bacteriology, 177, 4121-4130.
Janssen, J., & Soule, T. (2016). Gene expression of a two-component regulatory system
associated with sunscreen biosynthesis in the cyanobacterium Nostoc punctiforme ATCC
29133. FEMS Microbiology Letters, 363(2), 1-6.
Jiang, Y., Rabbi, M., Kim, M., Ke, C., Lee, W., Clark, R. L., Mieczkowski, P. A., & Marszalek,
P. E. (2009). UVA generates pyrimidine dimers in DNA directly. Biophysical Journal,
96, 1151-1158.
Kasting, J. F. (1992). The proterozoic biosphere. A multidisciplinary study. Cambridge:
Cambridge University Press.
Klicki, K. (2018). RNA sequencing data of mutant N. punctiforme with deleted Npun_F1278
response regulator: Unpublished raw data.
Kosinski, M. J. (1992). Isopropyl-β-d-thiogalactopyranoside influences the metabolism of
Escherichia coli. Applied microbiology and biotechnology., 36, 782-784.
Laffler, T., & Gallant, J. (1974). spoT, a new genetic locus involved in the stringent response in
E. coli. Cell, 1, 27-30.
Little, J. W., & Mount, D. W. (1982). The SOS regulatory system of Escherichia coli. Cell, 29,
11-22.
Malla, S., & Sommer, M. O. A. (2014). A sustainable route to produce the scytonemin precursor
using Escherichia coli. Green Chemistry, 16, 3255-3265.
Metzger, S. (1989). Protein sequences encoded by the relA and the spoT genes of Escherichia
coli are interrelated. Journal of Biological Chemistry, 264, 9122-9125.
Munson, G. P., Lam, D. L., Outten, F. W., & O'Halloran, T. V. (2000). Identification of a
copper-responsive two-component system on the chromosome of Escherichia coli K-12.
Journal of Bacteriology, 182, 5864-5871.
Narikawa, R., Okamoto, S., Ikeuchi, M., & Ohmori, M. (2004). Molecular evolution of PAS
domain-containing proteins of filamentous cyanobacteria through domain shuffling and
domain duplication. DNA Research, 11, 69-81.
Naurin, S., Bennett, J., Videau, P., Philmus, B., Soule, T., & Collier, J. (2016). The response
regulator Npun_F1278 is essential for scytonemin biosynthesis in the cyanobacterium
Nostoc punctiforme ATCC 29133. Journal of Phycology, 52, 564-571.
Oppezzo, O., Costa, C., & Pizarro, R. (2011). Effects of ultraviolet A radiation on survival and
growth of gram negative bacteria. Trends in Photochemistry and Photobiology, 13, 37-
50.
Pfaffl, M. W. (2001). A new mathematical model for relative quantification in real-time RT-
PCR. Nucleic Acid Research, 29, e45-e45.
Proteau, P. J., Gerwick, W. H., Garcia-Pichel, F., & Castenholz, R. (1993). The structure of
scytonemin, an ultraviolet sunscreen pigment from the sheaths of cyanobacteria.
Experientia, 49, 825-829.
Radman, M. (1975). SOS repair hypothesis: phenomenology of an inducible DNA repair which
is accompanied by mutagenesis. In P. C. Hanawalt & R. B. Setlow (Eds.), Molecular
Mechanisms for Repair of DNA: Part A (pp. 355-367). Boston, MA: Springer US.

66
Schmidt, É. C., Kreusch, M., Felix, M. R. d. L., Pereira, D. T., Costa, G. B., Simioni, C.,
Ouriques, L. C., Farias-Soares, F. L., Steiner, N., Chow, F., Ramlov, F., Maraschin, M.,
& Bouzon, Z. L. (2015). Effects of ultraviolet radiation (UVA+UVB) and copper on the
morphology, ultrastructural organization and physiological responses of the red alga
Pterocladiella capillacea. Photochemistry and Photobiology, 91, 359-370.
Smith, C. M., Arany Z Fau - Orrego, C., Orrego C Fau - Eisenstadt, E., & Eisenstadt, E. (1991).
DNA damage-inducible loci in Salmonella typhimurium. Journal of Bacteriology, 173,
3587-3590.
Snyder, W. B., & Silhavy, T. J. (1995). Beta-galactosidase is inactivated by intermolecular
disulfide bonds and is toxic when secreted to the periplasm of Escherichia coli. Journal
of Bacteriology, 177, 953-963.
Sorrels, C. M., Proteau, P. J., & Gerwick, W. H. (2009). Organization, evolution, and expression
analysis of the biosynthetic gene cluster for scytonemin, a cyanobacterial UV-absorbing
pigment. Applied and Environmental Microbiology, 75, 4861-4869.
Soule, T., Gao, Q., Stout, V., & Garcia-Pichel, F. (2013). The global response of Nostoc
punctiforme ATCC 29133 to UVA stress, assessed in a temporal DNA microarray study.
Photochemistry and Photobiology, 89, 415-423.
Soule, T., Stout, V., Swingley, W. D., Meeks, J. C., & Garcia-Pichel, F. (2007). Molecular
genetics and genomic analysis of scytonemin biosynthesis in Nostoc punctiforme ATCC
29133. Journal of Bacteriology, 189, 4465.
Taylor, B. L., & Zhulin, I. B. (1999). PAS Domains: internal sensors of oxygen, redox potential,
and light. Microbiology & Molecular Biology Reviews, 63, 479.
Thiel, T., C. Meeks, J., Elhai, J., Potts, M., Larimer, F., Lamerdin, J., Predki, P., & Atlas, R.
(2002). Nitrogen fixation: analysis of the genome of the cyanobacterium Nostoc
Puctiforme. In Nitrogen Fixation: Global Perspectives (pp. 88-92). New York: CABI.
Tyrrell, R., Keyse, S., & Moraes, E. (1991). Cellular defense against UVA (320–380 nm) and
UVB (290–320 nm) radiations. In R. E. (Ed.), Photobiology (pp. 861-871). Boston, MA:
Springer.
Whitton, B. A., & Potts, M. (2012). Introduction to the cyanobacteria. In B. A. Whitton (Ed.),
Ecology of Cyanobacteria II: Their Diversity in Space and Time (pp. 1-13). Dordrecht:
Springer Netherlands.
Xu, Z., & Gao, K. (2009). Impacts of UV radiation on growth and photosynthetic carbon
acquisition in Gracilaria lemaneiformis (Rhodophyta) under phosphorus-limited and
replete conditions. Functional Plant Biology, 36, 1057-1064.

67
APPENDIX A: RECIPES
Recipes in this section were used to for the purposes of running an SDS-page
polyacrylamide gel to determine the presence of Npun_F1277 sensor kinase.
Lysis Buffer
1. 50 mM potassium phosphate, pH 7.8
2. 400 mM NaCl
3. 100 mM KCl
4. 10% glycerol
5. 0.5% Triton X-100
6. 10 mM imidazole
2X SDS-Page Sample Buffer (10 ml Stock)
1. 0.5 M Tris-HCl, pH 6.8 (2.5ml)
2. 100% Glycerol (2.0 ml)
3. β-mercaptoethanol (0.4 ml)
4. Bromophenol Blue (0.02 g)
5. Sodium dodecyl sulfate (0.4g)
6. Sterile water to bring solution to 10 ml
1X SDS-Page Sample Buffer (10 ml Stock)
1. 0.5 M Tris-HCl, pH 6.8 (1.25ml)
2. 100% Glycerol (1.0 ml)
3. β-mercaptoethanol (0.2 ml)
4. Bromophenol Blue (0.01 g)
5. Sodium dodecyl sulfate (0.2g)
6. Sterile water to bring solution to 10 ml

68
Resolving Gel (40 ml Stock)
1. Double distilled water (19.1 ml)
2. 40% Acrylamide (10 ml)
3. 1.5 M Tris-HCL, pH 8.8 (10 ml)
4. 10% Sodium dodecyl sulfate (0.4 ml)
5. 10% Ammonium persulfate (0.4 ml)
6. TEMED (0.016 ml)
Stacking Gel (10 ml Stock)
1. Double distilled water (7.25 ml)
2. 40% Acrylamide (1.25 ml)
3. 1.5 M Tris-HCL, pH 6.8 (1.25 ml)
4. 10% Sodium dodecyl sulfate (0.1 ml)
5. 10% Ammonium persulfate (0.1 ml)
6. TEMED (0.01 ml)
5X SDS Electrophoresis Buffer
1. .125 M Tris Base
2. .96 M Glycine
3. 0.5% Sodium dodecyl sulfate
1X SDS Electrophoresis Buffer
1. .025 M Tris Base
2. .192 M Glycine
3. 0.1% Sodium dodecyl sulfate
Staining Solution
1. 50% methanol
2. 10% Acetic Acid
3. 0.1% Coomassie Brilliant Blue R250
De-staining Solution
1. 50% methanol
2. 10% Acetic Acid

69
APPENDIX B: PROTEIN ALIGNMENTS
Protein alignments of homologues proteins used in gene expression analysis.
- Donates missing amino acid
. Donates same amino acid
Npun F2162 - M K K V L L V E D S L T E S E K M T R Y L E Q G G Y S V Y E V R S G E E A Q L R L K Q Q K P D L I
phoB M A R R I . V . . . E A P I R . M V C F V . . . N . F Q P V . A E D Y D S . V N Q . N E P W . . . .
Npun F2162 L L D L I L P G Q S G F E F C R K L K A D P T T K G I P V V I C S T K N T D V D R T W G N M S G A D
phoB . . . WM . . . G . . I Q . I K H . . R E S M . R D . . . . M L T A R G E E E . . V R . L E T . . .
Npun F2162 G Y L V K P V D E N T L L Q T V S K F I R - - - - - - - - - - - - - - - - - - - - - - - - - - - - -
phoB D . I T . . F S P K E . V A R I K A V M . R I S P M A V E E V I E M Q G L S L D P T S H R V M A G E
Npun F2162 - - - - - - - - - - - - - - - - - - - - - - - - - - - - - - - - - - - - - - - - - - - - - - - - - -
phoB E P L E M G P T E F K L L H F F M T H P E R V Y S R E Q L L N H V W G T N V Y V E D R T V D V H I R
Npun F2162 - - - - - - - - - - - - - - - - - - - - - - - - - - - - -
phoB R L R K A L E P G G H D R M V Q T V R G T G Y R F S T R F

70
Npun R2633 M F L L R S T Q L F K F K H N M A N F T D S P I L T N R F S E A L V F A H Q A H L H Q V R K G G T K
spoT . Y . F E . - - - - - L N Q L I Q . Y L P E D Q I - K . L R Q . Y L V . R D . . E G . T . S S . - -
Npun R2633 A P Y I S H L L A V A S L V L E A G G N E D E A I A A L L H D A I E D V Q V E P R L I I E K F G E N
spoT E . . . T . P V . . . C I L A . M K L D Y E T L M . . . . . . V . . . T P A T Y Q D M E Q L . . K S
Npun R2633 V C K I V Q E L S E D K A L P K K E R K S R Y I E S V C C F S N S A I R - - - - - - V S I A D K L H
spoT . A E L . E G V . K L D K . K F R D K . E A Q A . N F R K M I M A M V Q D I R V I L I K L . . R T .
Npun R2633 N I R - - - - - - - - - - - - - - - - - - - - - - - - - - - - - - - - - - - - - - - - - - - - - - -
spoT . M . T L G S L R P D K R R R I A R E T L E I Y S P L A H R L G I H H I K T E L E E L G F E A L Y P
Npun R2633 - - - - - - - - - - - - - - - - - - - - - - - - - - - - - - - - - - - - - - - - - - - - - - - - - -
spoT N R Y R V I K E V V K A A R G N R K E M I Q K I L S E I E G R L Q E A G I P C R V S G R E K H L Y S
Npun R2633 - - - - - - - - - - - - - - - - - - - - - - - - - - - - - - C Y - - - - - - - - - - - - - - - - - -
spoT I Y C K M V L K E Q R F H S I M D I Y A F R V I V N D S D T . . R V L G Q M H S L Y K P R P G R V K
Npun R2633 - - - - - - - - - - - - - - - - - - - - - - - - - - - - - - - - - - - S Q S P E L - - - - - W G K E
spoT D Y I A I P K A N G Y Q S L H T S M I G P H G V P V E V Q I R T E D M D . M A . M G V A A H . A Y K
Npun R2633 Q Y - - - - - - - - - - - - - - - - - - - - - - - - - - - - - - - - - - - - - E F Y K D L L F N Y -
spoT E H G E T S T T A Q I R A Q R WM Q S L L E L Q Q S A G S S F E F I E S V K S D L F P . E I Y V F T
Npun R2633 - - - - - - - - - - - - - - - - - - - - - - - - - - - - - - - - - - - - E Q F V V S N E L L E N Q V
spoT P E G R I V E L P A G A T P V D F A Y A V H T D I G H A C V G A R V D R Q P Y P L . Q P . T S G . I
Npun R2633 I E I - - - - - - - - - - - - - - - - - - - - - - - - - - - - - - - - - - - - - - - - - - - - - - -
spoT V . . I T A P G A R P N A A W L N F V V S S K A R A K I R Q L L K N L K R D D S V S L G R R L L N H
Npun R2633 - - - - - - - - - - - - - - - - - - - - - - - - - - - - - - - - - - - - - - - - - - - - - - - - - -
spoT A L G G S R K L N E I P Q E N I Q R E L D R M K L A T L D D L L A E I G L G N A M S V V V A K N L Q
Npun R2633 - - - - - - - - - - - - - - - - - - - - - - - - - - - - - - - - - - - - - - - - - - - - - - - - G L
spoT H G D A S I P P A T Q S H G H L P I K G A D G V L I T F A K C C R P I P G D P I I A H V S P G K . .
Npun R2633 L M E Q L S - - - - - - - - - - - - - - - - - - - - - - - - - - - - - - - - - - - - - - - - - - - -
spoT V I H H E . C R N I R G Y Q K E P E K F M A V E W D K E T A Q E F I T E I K V E M F N H Q G A L A N
Npun R2633 - - - - - - - - - - - - - - - - - - - - - - - - - - - - - - - - - - - - - - - - - - - - - - - - - -
spoT L T A A I N T T T S N I Q S L N T E E K D G R V Y S A F I R L T A R D R V H L A N I M R K I R V M P
Npun R2633 - - - - - - - - - -
spoT D V I K V T R N R N

71
Npun F5595 - - - M S S L A I N S S V D L A I P E W L K K C L K E S S T S N G E V E D D R R H S D A V L I G R A
relA M V A V R . A H . . K A G E F D P E K . I - A S . G I T . Q K S C . C L A E - - - - - - - - - - - -
Npun F5595 F E F A Y Q L H Q G Q Y R K S G E P Y I A H P I A V A D L L H D L G G S A A M I A A G F L H D V V E
relA - T W . . C . Q . T . G H P D A S L L L W R G V E M V E I . S T . S M D I D T L R . A L . F P L A D
Npun F5595 D T E V T S Q E I E E R F G A E V R Q L V E G V T K L S K I - - - - - - N F T S K T E S Q A E N F R
relA A N V . S E D V L R . S V . K S . V N . I H . . R D M A A . R Q L K A T H T D . V S S E . V D . V .
Npun F5595 R M F L A M A Q D I R V I V V K L A D R L H N M R T L Q Y M S E A S R R R S A Q E T R D I F A P L A
relA . . L . . . V D . F . C V . I . . . E . I A H L . E V K D A P . D E . V L A . K . C T N . Y . . . .
Npun F5595 N R L G I W R I K W E L E D L A F K Y L E P E A F R Q M Q E L V S E K R T A R E E K L A R A T N M L
relA . . . . . G Q L . . . . . . Y C . R . . H . T E Y K R I A K . L H . R . L D . . H Y I E E F V G H .
Npun F5595 Q E R L Q Q A G I R F Q D I S G R P K H L Y S I Y Q K M H R Q Q K E F H E I Y D L A A L R I I V Q S
relA R A E M K A E . V K - A E V Y . . . . . I . . . W R . . Q K K N L A . D . L F . V R . V . . V A E R
Npun F5595 N E E C Y R A L A V V H D A F R P I P G R F K D Y I G L P K P N R Y Q S L H T G V I G L T G R P L E
relA L Q D . . A . . G I . . T H Y . H L . D E . D . . V A N . . . . G . . . I . . V . L . P G . K T V .
Npun F5595 V Q I R T I E M H H I A E Y G I A A H W K Y K E T G G S S I S H L T G T D D K F T W L R Q L L E W Q
relA I . . . . K Q . . E D . . L . V . . . . . . . . - . A A A G G A R S . H E . R I A . . . K . I A . .
Npun F5595 T D L K D A Q E Y L D S V K D N L F E D D V Y V F T P K G D V V P L S P G S T T V D F A Y R I H T E
relA E E M A . S G . M . . E . R S Q V . D . R . . . . . . . . . . . D . P A . . . P L . . . . H . . S D
Npun F5595 V G N H C S G A R V N G R M V S L S T R L Q N G D I V E V L T Q K N C H P S L D W L N - - - - F V R
relA . . H R . I . . K I G . . I . P F T Y Q . . M . . Q I . I I . . . Q P N . . R . . . . P N L G Y . T
Npun F5595 S S A A K Y R I K Q W Y K R S R R E E N V A R G R E L L E K E L G K T G F D S L L K S D A M Q I V A
relA T . R G R S K . H A . F R K Q D . D K . I L A . . Q I . D D . . E H L . I S - - . . E A E K H L L P
Npun F5595 E K C N Y H S V D D L L A G L G Y G E V T L N L V L N R W R E V A K G Q Q P V S T V P P F I P K E P
relA - R Y . F N D . . E . . . A I . G . D I R . . Q M V . F L Q S Q F N - - - - - - - - K . S A E E Q D
Npun F5595 P T T S K A L R D - - - A P P T T S R A S D S P I V - G V E G L V Y H L A G C C T P I P G E P I I G
relA A A A L . Q . Q Q K S Y T . Q N R . K D N G R V V . E . . G N . M H . I . R . . Q . . . . D E . V .
Npun F5595 V V T R G R G I S I H R Q G C H N L E T V E Y - - - E R L V P V R W N P S A E N S G R P H T Y P V D
relA F I . Q . . . . . V . . A D . E Q . A E L R S H A P . . I . D A V . G E . Y S A G - - - - - . S L V
Npun F5595 V Q I E A L D R V G V L K D I L S R L S D Q G I N V R H A Q V K T S V G Q P - A L M D L G I D I R D
relA . R V V . N . . S . L . R . . T T I . A N E K V . . L G V A S R S D T K . Q L . T I . M T . E . Y N
Npun F5595 R S Q L E Q V F V Q I K K M S D I L N I R R V G Q I D E
relA L Q V . G R . L G K L N Q V P . V I D A . . L H G S - -

72
Npun_4481 M E R L T E A Q Q E L Y E WL A E Y I R T H Q H S P S I R Q M M Q A M N L K S P A P I Q S R L E H L
lexA . K A . . A R . . . V F D L I R D H . S Q T G M P . T R A E I A . R L G F R . . N A A E E H . K A .
Npun_4481 R T K G Y I E WT E G Q A R T I R I L R P V K Q G V P I L G T I A A G G - - L I E P F T D A V D H L
lexA A R . . V . . I V S . A S . G . . L . Q E E E E . L . L V . R V . . . E P L . A Q Q H I E G H Y Q V
Npun_4481 D F S N F D L P P Q T Y A L R V A G D S M I E D L I T D G D V V F L R P V A E P N H L K N G T I V A
lexA . P . L . K - . N A D F L . . . S . M . . K D I G . M . . . L L - - - A . H K T Q D V R . . Q V . V
Npun_4481 A R V D G F G T T L K R F Y R Q G D R V T L K P A N P K Y N P I E V S A M Q - - V Q V Q G S L I G V
lexA . . I . D - E V . V . . L K K . . N K . E . L . E . S E F K . . V . D L R . Q S F T I E . L A V . .
Npun_4481 WR G Y N - -
lexA I . N G D WL
Npun F2914 M A I N T D T S G K Q K A L T M V L N Q I E R S F G K G A I M R L G D A T R M R V E T I S S G A L T
recA . . . D E N - - - . . . . . A A A . G . . . K Q . . . . S . . . . . E D R S . D . . . . . T . S . S
Npun F2914 L D L A L G - G G L P K G R V I E I Y G P E S S G K T T V A L H A L A E V Q R N G G I A A F V D A E
recA . . I . . . A . . . . M . . I V . . . . . . . . . . . . L T . Q V I . A A . . E . K T C . . I . . .
Npun F2914 H A L D P T Y A A A L G V D I D N L L I S Q P D T G E S A L E I V D Q L V R S A A V D I V V I D S V
recA . . . . . I . . R K . . . . . . . . . C . . . . . . . Q . . . . C . A . A . . G . . . V I . V . . .
Npun F2914 A A L V P R A E I E G D M G D A H V G L Q A R L M S Q A L R K I T G N I G K S G C T V I F I N Q L R
recA . . . T . K . . . . . E I . . S . M . . A . . M . . . . M . . L A . . L K Q . N T L L . . . . . I .
Npun F2914 Q K I G V T Y G S P E T T T G G N A L K F Y A S V R L D I R R I Q T L K K G T D E Y G N R V K V K V
recA M . . . . M F . N . . . . . . . . . . . . . . . . . . . . . . . G A V . E . E N V V . S E T R . . .
Npun F2914 A K N K V A P P F R I A E F D I I F G K G I S T L G C V V D L A E E T G I I I R K G A W Y S Y N G D
recA V . . . I . A . . K Q . . . Q . L Y . E . . N F Y . E L . . . G V K E K L . E K A . . . . . . K . E
Npun F2914 N I S Q G R D N A I K Y L E E K P E F A E E I K K L V R E K L D K G A V V S A N S V A K A S E E D E
recA K . G . . K A . . T A W . K D N . . T . K . . E . K . . . L . - - - - L S N P . . T P D F . V D . S
Npun F2914 E E E V D L E P E E
recA . G V A E T N E D F

73
APPENDIX C: ADDITIONAL FIGURE
Figure 251. Map of p1277 Plasmid. Map shows the Npun_F1277 insertion into the lacZ gene, the
neomycin/kanamycin resistance cassette, origin of replication, rop gene which controls plasmid
copy number, and the lacI repressor gene. Also shown are important promoters and terminators.
Image was made with Snapgene v5.0.7.