analysis of alcoholic drinks market in vietnam · alcoholic drinks market in vietnam. that's...
TRANSCRIPT
1
ANALYSIS OF ALCOHOLIC
DRINKS MARKET IN VIETNAM
T.Q.NGUYEN and F.SEYTE
LAMETA University Montpellier1

2
INTRODUCTION
• From Fama (1970) an efficient market is a market on
which prices reflect simultaneously and completely all
the information available and relevant: the best predictor
of course tomorrow is today's lesson.
• The aim of this paper is to analyze the efficiency of the
alcoholic drinks market in Vietnam. That's what we will
analyze segmentation of the market in the first part and
market efficiency in the second part.
PART1
ANALISIS OF SEGMENTATION
PART2
ANALISIS
OF MARKET EFFICIENCY
3
PART 1
ANALYSIS OF SEGMENTATION

4
The demand for beer and wine in
Vietnam forecast to 2015(million
liters)
0
500
1000
1500
2000
2500
3000
3500
4000
4500
5000
2009 2010 2011 2012 2013 2014 2015
Year
Mill
ion liters
Demand on Beer
Demand on Alcohol

5
• the current average consumption of beer
of the people of our country is 15.8 liters
per year, in 2 / 3 compared with the
consumption of the world
• Average consumption of alcohol was 3.9
liters in which the demand is 6 liters

6
The number of manufacturing
enterprises in Beer - Alcohol -
Beverage by specialization:Specializat
ionNumber of enterprises Evolution(%/year)
2000 2005 2006 2007 2000-
2005
2006-
2007
Beer 137 163 167 151 3,54 -3,75
Alcohol 28 77 75 78 22,42 0,65
Soft Drink 602 727 771 1013 3,85 14,04
Total 767 967 1013 1242 4,74 13,33
7
• the number of enterprises of the industry
increased rapidly, especially in the period
2006-2007 more than 13% per year
• the beverage manufacturing industry has
the largest number of enterprises, then to
the beer industry
• Wine industry is at the least number of
enterprises
8
Structure of beer manufacturing
in 2007 on capacity
• the proportion of manufacturing beer
capacity (over 100 million liters per year) is
still relatively small, only 5%
• the business has a capacity of 20 million
liters per year have a large proportion,
accounting for 61%

9
5% 13%
21%61%
>100 million liters
50-100 million liters
20-50 million liters
<20 million liters
10
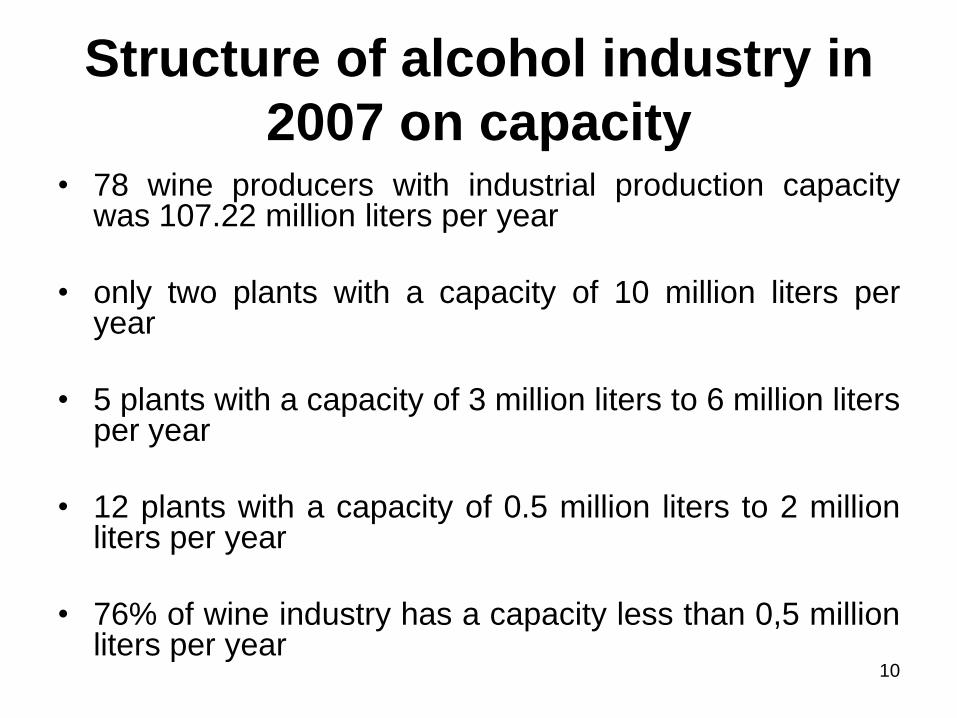
Structure of alcohol industry in
2007 on capacity• 78 wine producers with industrial production capacity
was 107.22 million liters per year
• only two plants with a capacity of 10 million liters peryear
• 5 plants with a capacity of 3 million liters to 6 million litersper year
• 12 plants with a capacity of 0.5 million liters to 2 millionliters per year
• 76% of wine industry has a capacity less than 0,5 millionliters per year
11
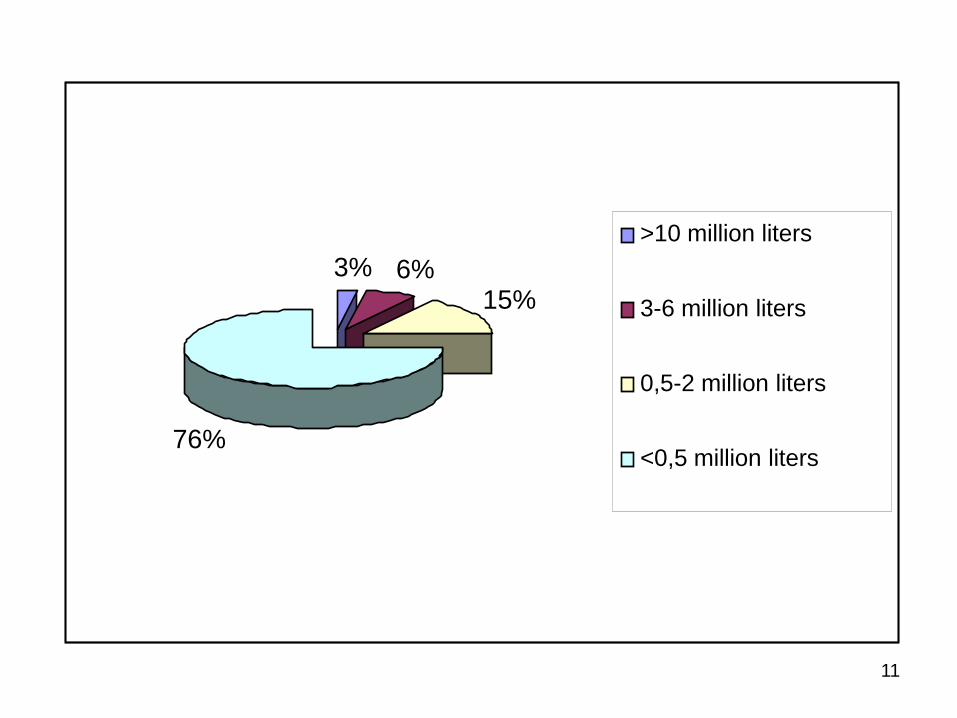
3% 6%15%
76%
>10 million liters
3-6 million liters
0,5-2 million liters
<0,5 million liters

12
Structure of production enterprises in all
economic sectors (%)
2000 2005 2006 2007
State
enterprises32,72 3,93 3,06 2,66
Non state
enterprises65,58 92,24 93,39 95,01
Foreign –
invested
enterprises
1,69 3,83 3,55 2,33

13
• the state enterprise is the largest scale(445 billion Vietnam dong / enterprise; 242people / business)
• then to the area of foreign investmentcapital (384 billion Vietnam dong /enterprise; 226 people per enterprise)
• and after the sector non-state (9 billionVietnam dong per enterprise, 18 persons /company)

14
Structure of productions by region (%):
2000 2005 2006 2007
Red River
Delta
14,08 24,41 26,65 23,35
Central
Northern
mountainous
4,30 4,55 4,64 4,75
Central Coast 15,91 22,54 16,88 21,01
Highlands
(Tay Nguyen)
0,65 2,79 3,06 3,46
Southeast
region
21,90 35,16 38,01 33,82
Cửu Long
River Delta
43,16 10,55 10,76 13,61
Total 100 100 100 100
15
• production capacity is mainly concentrated
in central cities
• For the brewing industry, Hanoi accounted
for 19.53% of total national production
capacity, Ho Chi Minh City (19.7%)
• Production value of the Beer - Alcohol -
Beverage increase continuously in the
period from 2000 to 2007 with average
growth rate of over 15% per year

16
Structuring and restructuring of products
(%)
Beer 2000 2005 2006 2007
Bottled beer 56,43 56,50 55,60 55,11
Beer cans 10,29 15,23 15,45 17,08
Draught beer 33,27 28,27 28,95 27,81
17
• bottled beer accounts for the largest
proportion (over 55%) also beer cans has
lowest proportion in all years
• The proportion of beer cans tend to
increase while the draught beer tends to
decrease

18
Structuring and restructuring of products
(%)
Alcohol
production
2000 2005 2006 2007
White wine
>25°
3,76 5,93 11,58 11,90
Colored
wine>25°
2,85 0,96 1,60 1,40
Sparkling
wine
0,24 0,13 0,17 0,16
Wine from
fresh fruit
5,08 3,91 4,22 4,3
Bulk Alcohol 88,07 89,07 82,43 82,25

19
• the largest proportion is bulk alcohol; the
proportion of this alcohol is 82%.
• fresh fruit decreased slowly

20
• As forecast, the demand for beer, wine, soft drinks in thecountry and around the world are still large; this is agood opportunity for industry development in the future.
• Despite the conditions and opportunities for developmentbut the last time beer and wine industry meet basicneeds in the mass market, not export. The Beverageindustry has some high-end products but is very strongcompetition by products of the leading beveragecompany in the world.
• Industrial production of beer, wine, soft drinks are stillgrowing strongly. Especially in the near future, theindustry tends to focus in Asia and Southeast Asia; thisis just the opportunity but also creates enormouspressure for the beer - alcohol - water in Vietnam.
21
PART 2
ANALISIS OF MARKET EFFICIENCY
22
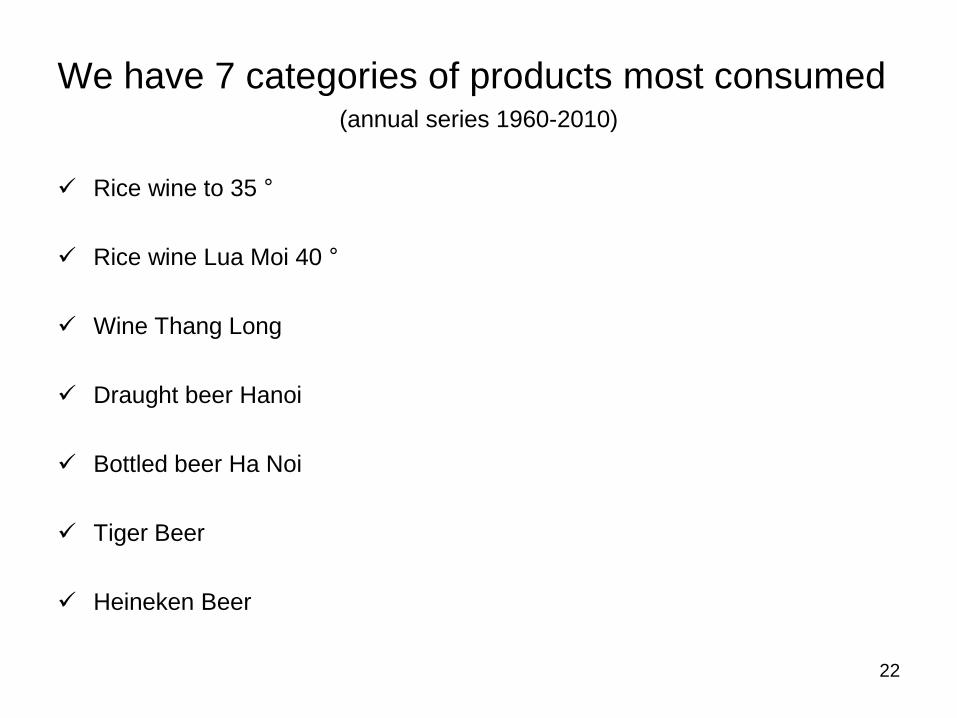
We have 7 categories of products most consumed(annual series 1960-2010)
Rice wine to 35 °
Rice wine Lua Moi 40 °
Wine Thang Long
Draught beer Hanoi
Bottled beer Ha Noi
Tiger Beer
Heineken Beer

23
Data characteristics and unit root tests
LAL LLM LHE LPH LTI LHN LTL
Mean 6.69 9.06 8.06 7.29 7.83 7.71 7.70
Median 6.55 8.73 7.83 7.39 7.57 7.46 7.30
Std.Dev 1.30 0.75 0.72 0.73 0.75 0.81 1.16
Skewness
Normality
test
0.29
1.59
0.59
2.24
0.55
2.17
-0.51
2.10
0.55
2.16
0.35
1.72
0.41
1.88
Kurtosis
Normality
test
1.94
-1.52
1.95
-1.52
2.05
-1.37
2.70
-0.43
2.06
-1.36
1.96
-1.51
1.97
-1.50
Jarque-Bera 3.12 5.33 4.53 2.48 4.44 3.33 3.74
Dickey-
Fuller
augmented
-0.32
(4r)
-3.51
-1.93
(4r)
-3.51
0.13
(6r)
-3.51
-1.40
(6r)
-3.51
-0.75
(8r)
-3.52
-1.26
(8r)
-3.52
0.19
(10r)
-3.52
Philips-
Perron
-1.08
(1r)
-3.50
-1.14
(1r)
-3.50
-0.13
(1r)
-3.50
-1.46
(1r)
-3.50
0.04
(1r)
-3.50
-2.30
(1r)
-3.50
3.83
(1r)
-3.50
Dickey-
pentula
-0.74
-3.19
-1.21
-3.19
-0.59
-3.19
-1.49
-3.19
-0.66
-3.19
-2.69
-3.19
-1.06
-3.19
24
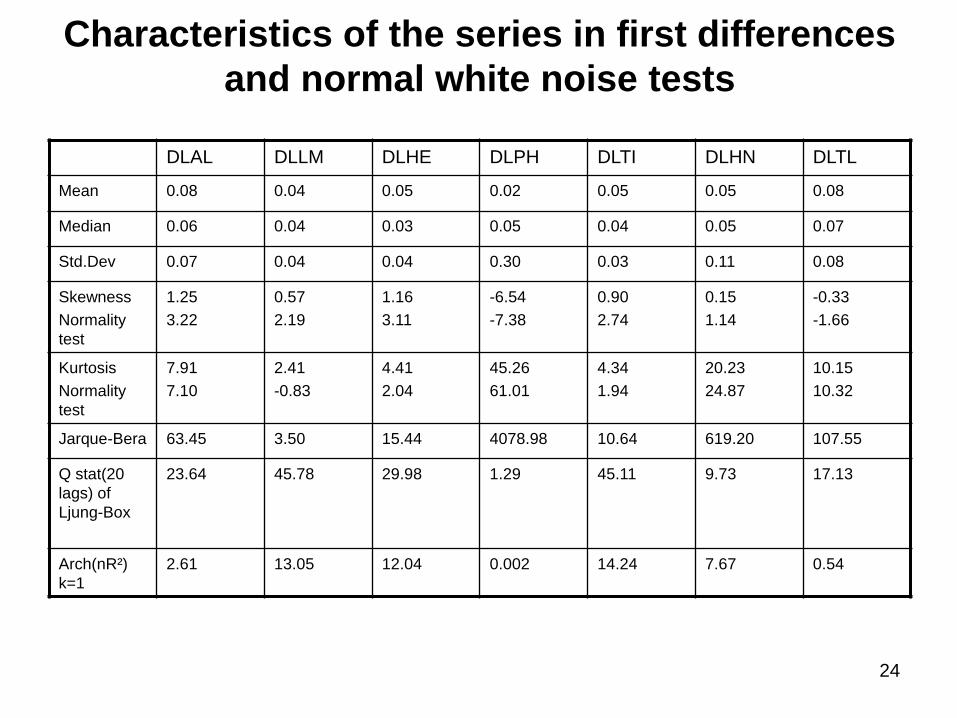
Characteristics of the series in first differences
and normal white noise tests
DLAL DLLM DLHE DLPH DLTI DLHN DLTL
Mean 0.08 0.04 0.05 0.02 0.05 0.05 0.08
Median 0.06 0.04 0.03 0.05 0.04 0.05 0.07
Std.Dev 0.07 0.04 0.04 0.30 0.03 0.11 0.08
Skewness
Normality
test
1.25
3.22
0.57
2.19
1.16
3.11
-6.54
-7.38
0.90
2.74
0.15
1.14
-0.33
-1.66
Kurtosis
Normality
test
7.91
7.10
2.41
-0.83
4.41
2.04
45.26
61.01
4.34
1.94
20.23
24.87
10.15
10.32
Jarque-Bera 63.45 3.50 15.44 4078.98 10.64 619.20 107.55
Q stat(20
lags) of
Ljung-Box
23.64 45.78 29.98 1.29 45.11 9.73 17.13
Arch(nR²)
k=1
2.61 13.05 12.04 0.002 14.24 7.67 0.54
25
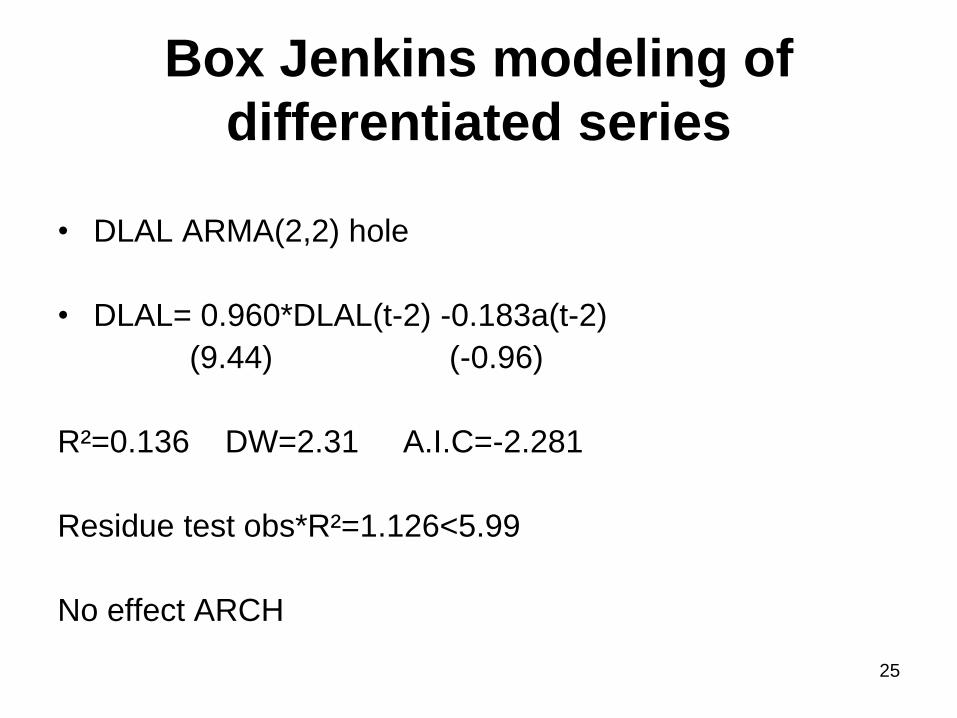
Box Jenkins modeling of
differentiated series
• DLAL ARMA(2,2) hole
• DLAL= 0.960*DLAL(t-2) -0.183a(t-2)
(9.44) (-0.96)
R²=0.136 DW=2.31 A.I.C=-2.281
Residue test obs*R²=1.126<5.99
No effect ARCH
26
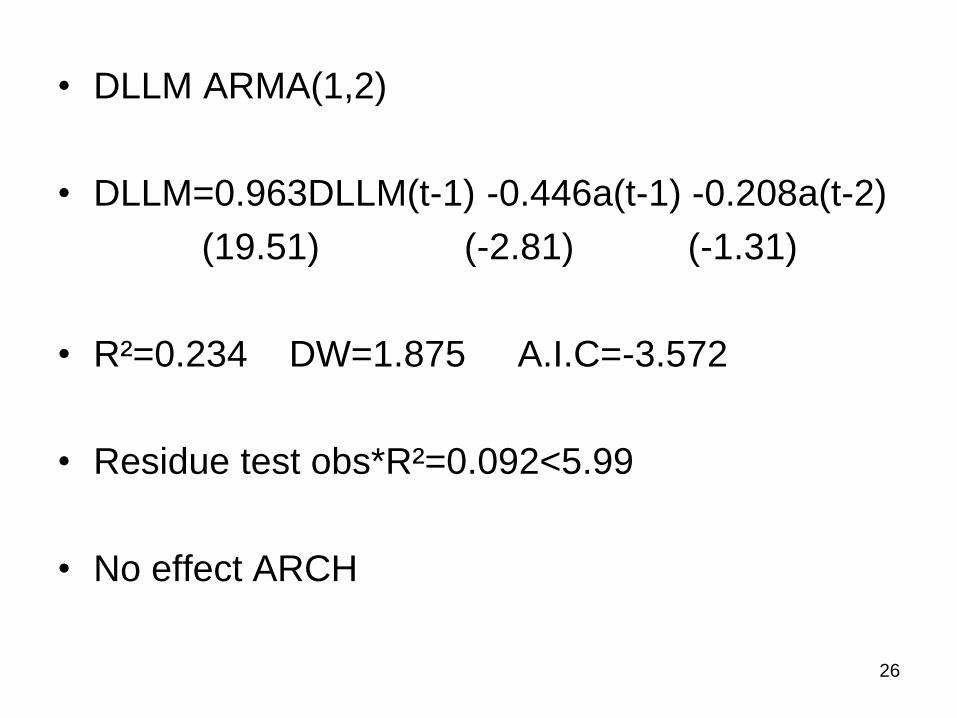
• DLLM ARMA(1,2)
• DLLM=0.963DLLM(t-1) -0.446a(t-1) -0.208a(t-2)
(19.51) (-2.81) (-1.31)
• R²=0.234 DW=1.875 A.I.C=-3.572
• Residue test obs*R²=0.092<5.99
• No effect ARCH

27
• DLHE ARMA(2,2) hole
• DLHE=0.926DLHE(t-2) +0.556a(t-1) -0.439a(t-2)
(8.27) (0.55) (-0.43)
• R²=0.221 DW=2.05 A.I.C=-3.705
• Residue test obs*R²=0.254<5.99
• No effect ARCH

28
• DLPH ARMA(10,10)
• R²=0.791 DW=0.367 A.I.C=-0.088
• Residue test obs*R²=14.621>5.99
• Effect ARCH
29
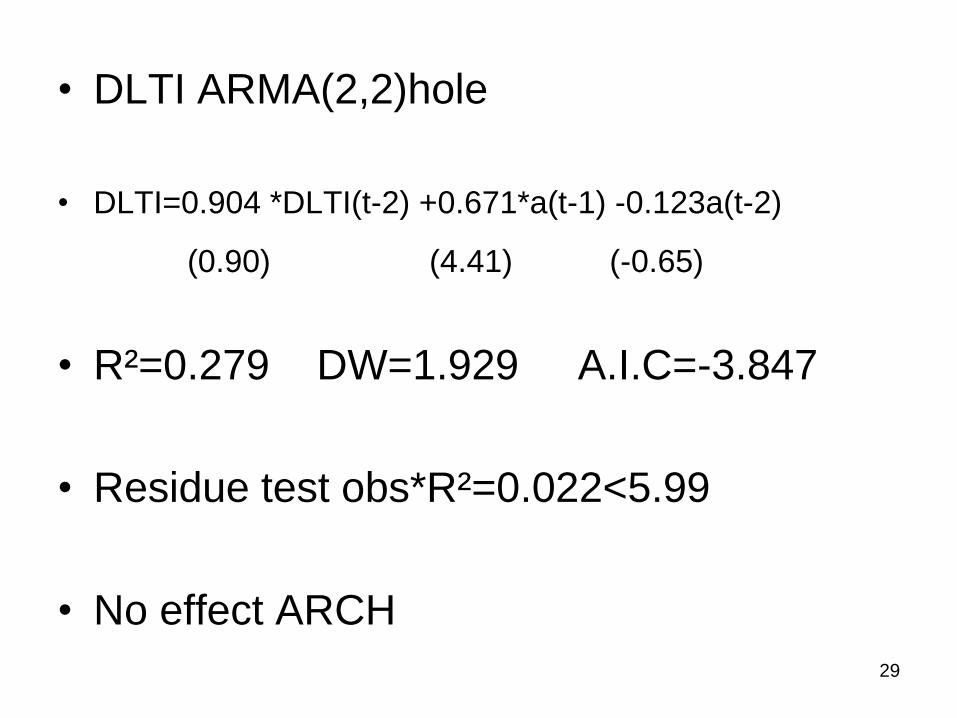
• DLTI ARMA(2,2)hole
• DLTI=0.904 *DLTI(t-2) +0.671*a(t-1) -0.123a(t-2)
(0.90) (4.41) (-0.65)
• R²=0.279 DW=1.929 A.I.C=-3.847
• Residue test obs*R²=0.022<5.99
• No effect ARCH

30
• DLHN ARMA(7,1)hole
• R²=0.145 DW=1.94 A.I.C=-1.177
• Residue test obs*R²=2.202<5.99
• No effect ARCH
31
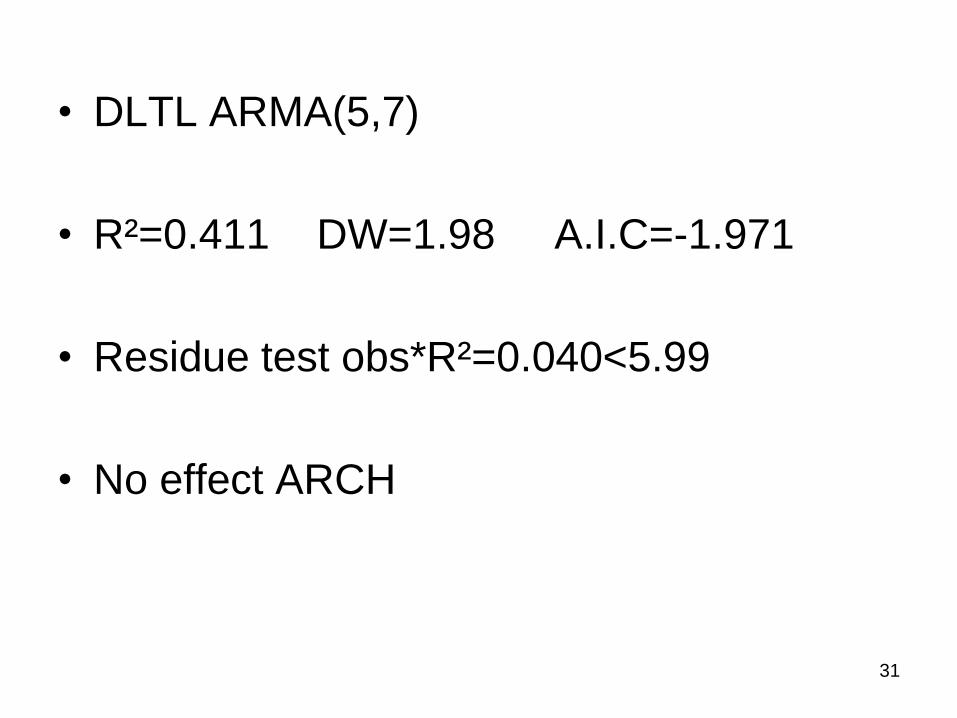
• DLTL ARMA(5,7)
• R²=0.411 DW=1.98 A.I.C=-1.971
• Residue test obs*R²=0.040<5.99
• No effect ARCH

32
• DLPH ARMA(10,10) error Garch(1,1)
• a(t)=u(t)*h(t) where h(t)→N(0,1)
• h²(t)=0.064964-0.050664a²(t-1) +0.552116h²(t-1)
33
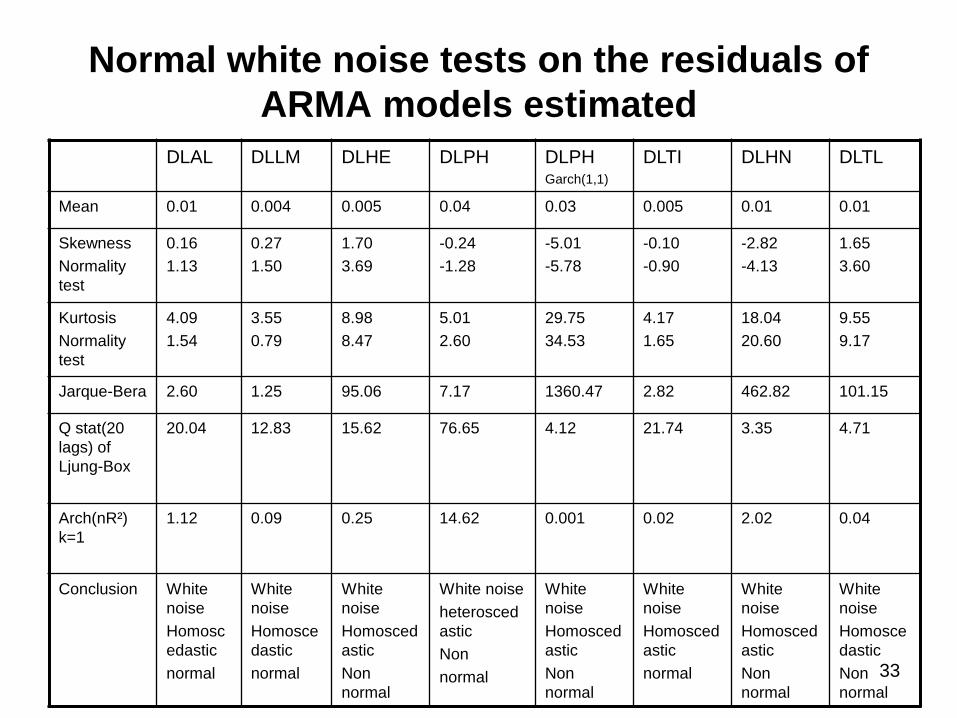
Normal white noise tests on the residuals of
ARMA models estimated
DLAL DLLM DLHE DLPH DLPHGarch(1,1)
DLTI DLHN DLTL
Mean 0.01 0.004 0.005 0.04 0.03 0.005 0.01 0.01
Skewness
Normality
test
0.16
1.13
0.27
1.50
1.70
3.69
-0.24
-1.28
-5.01
-5.78
-0.10
-0.90
-2.82
-4.13
1.65
3.60
Kurtosis
Normality
test
4.09
1.54
3.55
0.79
8.98
8.47
5.01
2.60
29.75
34.53
4.17
1.65
18.04
20.60
9.55
9.17
Jarque-Bera 2.60 1.25 95.06 7.17 1360.47 2.82 462.82 101.15
Q stat(20
lags) of
Ljung-Box
20.04 12.83 15.62 76.65 4.12 21.74 3.35 4.71
Arch(nR²)
k=1
1.12 0.09 0.25 14.62 0.001 0.02 2.02 0.04
Conclusion White
noise
Homosc
edastic
normal
White
noise
Homosce
dastic
normal
White
noise
Homosced
astic
Non
normal
White noise
heterosced
astic
Non
normal
White
noise
Homosced
astic
Non
normal
White
noise
Homosced
astic
normal
White
noise
Homosced
astic
Non
normal
White
noise
Homosce
dastic
Non
normal

34
CONCLUSION
• The series are not directly modeled by an ARMAprocess or TS. Logarithms of prices have unitroots but their first differences are oftenautocorrelated and Homoscedastic, theassumption of normal white noise can not bealways verified
• The results of the alcohol market allows us toconfirm the hypothesis of efficiency. Sets pricesAlcohol bulk, Alcohol Lua Moi, and Tiger beerare martingales with normal white noise.
• The markets for beer and wine are consideredas quasi-efficient: series of the price of beer andwine to follow martingale processes not normal