analysis of biomass prices - energistyrelsen · 5 | analysis of biomass prices, future danish...
TRANSCRIPT
Analysis of biomass prices
FUTURE DANISH PRICES FOR STRAW, WOOD CHIPS
AND WOOD PELLETS “FINAL REPORT”
18-06-2013
2 | Analysis of biomass prices, future Danish prices for straw, wood chips and wood pellets “Final Report” - 18-06-2013
Prepared by:
Christian Bang
Aisma Vitina
Jay Sterling Gregg (DTU)
Hans Henrik Lindboe
Published by:
Ea Energy Analyses
Frederiksholms Kanal 4, 3. th.
1220 Copenhagen K
Denmark
T: +45 88 70 70 83
F: +45 33 32 16 61
Email: [email protected]
Web: www.eaea.dk

3 | Analysis of biomass prices, future Danish prices for straw, wood chips and wood pellets “Final Report” - 18-06-2013
Contents
1 Resume på dansk........................................................................................ 5
2 Executive Summary .................................................................................. 12
3 Global biomass overview ......................................................................... 19
3.1 Global land use and biomass production ......................................... 19
3.2 Agriculture and forestry ................................................................... 21
4 Biomass for energy ................................................................................... 24
4.1 Biomass trade ................................................................................... 26
4.2 Future potential biomass areas ........................................................ 29
4.3 Standardisation ................................................................................. 31
4.4 Effect of sustainability on prices ....................................................... 33
5 Solid biomass prices ................................................................................. 35
5.1 Key biomass price determinants: literature review ......................... 40
6 Scenarios for supply and demand ............................................................ 45
6.1 Future demand of biomass for energy ............................................. 45
6.2 Future supply of biomass ................................................................. 49
7 Methods and models for analysing future biomass prices ...................... 53
7.1 Overview of recent studies of price development for biomass ....... 53
8 Description of model used in this study: GCAM ...................................... 70
8.1 Description of GCAM ........................................................................ 70
8.2 Other economic models of agriculture and land use ....................... 72
8.3 Scenarios ........................................................................................... 73
8.4 GCAM-DTU Results ........................................................................... 75
8.5 GCAM output prices ......................................................................... 80
9 GCAM to CIF Denmark prices ................................................................... 81
9.1 Assumptions and clarifications ......................................................... 83
9.2 GCAM Input ...................................................................................... 83
9.3 Inland transport ................................................................................ 84
9.4 Processing ......................................................................................... 85

4 | Analysis of biomass prices, future Danish prices for straw, wood chips and wood pellets “Final Report” - 18-06-2013
9.5 Sea transport .................................................................................... 87
9.6 Complete price forecast ................................................................... 90
10 Straw price formation .............................................................................. 92
11 Biomass price projection to 2050............................................................. 94
11.1 Scenario assumptions ....................................................................... 94
11.2 Methods for calculation of local wood chip and straw prices
(delivered to plant). .................................................................................. 97
12 Appendices ............................................................................................... 98
12.1 Appendix I Key parameters in wood pellet standardisation ............ 98
12.2 Appendix II Torrefied and black pellets ............................................ 99
12.3 Appendix III Pre-treatment of biomass .......................................... 100
12.4 Appendix IV biomass transport ...................................................... 101
13 References .............................................................................................. 110

5 | Analysis of biomass prices, future Danish prices for straw, wood chips and wood pellets “Final Report” - 18-06-2013
1 Resume på dansk
Denne rapport er udarbejdet af Ea Energianalyse for Energistyrelsen som bag-
grundsmateriale for udarbejdelse af langsigtede fremskrivninger af brændsels-
priser til brug for samfundsøkonomiske analyser.
Der er udarbejdet prisfremskrivninger for fast biomasse (træpiller, træflis og
halm) for perioden 2013 – 2050 med særligt fokus på perioden frem til 2035.
Priserne angivet i denne rapport skal fortolkes som CIF-priser ved en dansk
havn opgjort som faste priser (i 2012 EUR/GJ).
Der er ikke tale om egentlige prisprognoser, men prisfremskrivninger. Hermed
menes mulige prisforløb forudsat en række antagelser og forudsætninger.
Forudsætninger og metodisk tilgang
Prisfremskrivningerne er for det første baseret på en antagelse af en regional
og global efterspørgsel på biomasse til energiformål som den er beskrevet I
‘New Policy’ scenariet I IEA’s World Energy Outlook 2012 publikation. Denne
efterspørgselsstruktur for 2020 og 2035 er fremskrevet til at fortsætte frem
mod 2050.
For det andet forudsættes Danmark at være ’pristager’ på det globale marked
for fast biomasse. Med pristager menes, at ændringer i den danske efter-
spørgsel ikke påvirker de globale priser. Denne antagelse er begrundet i Dan-
marks relativt lave efterspørgselsvolumen set i global skala.
For det tredje forudsættes det, at der dannes et effektivt marked for global
handel med fast biomasse i fremtiden.
De konkrete prisfremskrivninger hindeholder følgende hovedelementer:
1) Der simuleres en række langsigtede scenarier ved anvendelse af ’Glo-
bal Change Assessment Model’ (GCAM). Modellen beregner en balan-
cepris i beregningsårene, ved i princippet at optimere det globale
langsigtede udbud og efterspørgsel på biomasse. Modellen indehol-
der en global database over arealanvendelse, og fremskriver udviklin-
gen i det globale landbrug, skovbrug, marginaljorde, konverteringstek-
nologier samt efterspørgsel efter skovprodukter, energi, fødevarer fo-
der etc.
2) Der udvælges herefter det scenarie, som på efterspørgselssiden bedst
muligt kan sammenlignes med New Energy Policy scenariet i World

6 | Analysis of biomass prices, future Danish prices for straw, wood chips and wood pellets “Final Report” - 18-06-2013
Energy Outlook 2012. Scenarieoutput er i form af én samlet prisudvik-
ling på et simuleret globalt marked for en rå ubehandlede biomasse-
ressource. Denne pris skal tolkes som ab skov.
3) Herefter efterberegnes output for at emulere en CIF Danmark pris,
under antagelse om at Danmark er importland. Efterbehandling er i
form af tillæg for bearbejdning, samt lokal og international transport.
Dette er bl.a. under antagelse om hvilke områder der i fremtiden vil
fungere som eksportlande til Danmark.
Ovennævnte modellering er under antagelse om, at den langsigtede lige-
vægtspris er omkostningsbestemt, hvilket ventes at gælde for træflis og træ-
piller. For halm anvendes derimod den antagelse, at halm til energiformål er
et mere besværligt brændsel end flis, og på den baggrund kan prissættes med
udgangspunkt i flisprisen. Baseret på historiske priser er det antaget, at halm
til energiformål i Danmark altid prissættes ca. 10 % under træflis, målt efter
energiindhold.
Baggrunden for valget af GCAM er, at denne model regnes som en af de fø-
rende integrerede analysemodeller (’Integrated Assessment Models’ - IAM’s)
brugt til økonomiske, teknologiske og samfundsmæssige analyser af den glo-
bale arealanvendelse. GCAM blev lanceret i 1975 under navnet MiniCam (Mini
Climate Assessment Model) og er siden blevet brugt i bl.a. IPPC’s arbejde.
Usikkerheder
I en langsigtet prisfremskrivning er der naturligvis betydelige usikkerheder i
valg af forudsætninger og antagelser. Nogle af de vigtigste usikkerheder for-
bundet med dette studie er fremhævet nedenfor.
Varigheden af den fremskrevne periode, knap 40 år, appellerer til forsigtig-
hed. Her kan særlig nævnes forudsætninger om global arealanvendelse, kon-
kurrerende efterspørgsel på biomasse (fødevarer, foder etc.) samt mulighe-
derne for øget udbytte.
Som et hvert andet rammeværk for modellering simplificerer GCAM virke-
ligheden, og antagelserne bag modelleringen kan have betydelig indflydelse
på resultaterne. For det første opererer GCAM i dens ligevægtsberegninger
med antagelsen om det ’perfekte marked’, som ikke eksisterer i virkeligheden.
Ligeledes er der ikke modelleret subsidier (Dog er effekten af subsidie-be-
stemt efterspørgsel indirekte er repræsenteret gennem modeltilpasning med
Varighed af den frem-
skrevne periode
Antagelser i rammerne
for GCAM modellering

7 | Analysis of biomass prices, future Danish prices for straw, wood chips and wood pellets “Final Report” - 18-06-2013
WEO 2012 efterspørgselsfremskrivninger). Der er ligeledes gjort antagelse om
et enkelt globalt biomassemarked (og et homogent biomasseprodukt.
Endelig modellerer den nuværende implementerede version af GCAM (GCAM-
DTU) ikke specifikt omkostninger forbundet med ændringer i arealanvendel-
sen. Dette betyder, at barrierer for ændret arealanvendelse sandsynligvis un-
dervurderes. (Konsekvensen heraf vurderes dog ikke at have signifikant betyd-
ning for det centrale scenario der anvendes i dette studie, Regional Policy sce-
nariet).
Der er i det ovenfor nævnte trin 3 under den metodiske tilgang gjort en række
antagelser. Særlig opmærksomhed bør rettes mod antagelser omkring udvik-
ling i transportafstand og håndteringsomkostninger, herunder ved fremstilling
af træpiller, da disse parametre påvirker CIF priserne markant.
Der er enighed om, at den biomasse der kan anvendes til energiformål skal
være bæredygtig biomasse. Der er dog ikke bred enighed om hvordan dette
præcist defineres og hvad det vil betyder for det globale udbud. Emner med
særlig betydning i denne forbindelse er biodiversitet samt CO2 påvirkning fra
direkte og indirekte ændringer i arealanvendelsen. Det er det vigtigt at poin-
tere, at en egentlig undersøgelse af bæredygtigheden af fast biomasse ikke er
fokus for denne analyse.
Formålet med denne rapport er at fremlægge langsigtede biomasse prisscena-
rier, under hensyn til bæredygtighedsspørgsmålet. I denne sammenhæng er
det oplagt, at restriktioner på udbudssiden f.eks. som følge af bæredygtig-
hedskriterier, vil påvirke prisen opad. Da der er usikkerhed om definitionen af
bæredygtig biomasse, er det særdeles vanskeligt at kvantificere effekten.
Det er dog vores vurdering, at fremtidige bæredygtighedskriterier skal være
særdeles restriktive og i betydeligt omfang ændre rammerne for skovdrift og
landbrug, hvis de skal påvirke prisfremskrivningen markant.
Estimering af danske CIF
priser
Bærdygtighed

8 | Analysis of biomass prices, future Danish prices for straw, wood chips and wood pellets “Final Report” - 18-06-2013
Samfundsøkonomiske prisfremskrivninger for biomassebrændsler
2013 – 2050 (CIF dansk havn)
Nedenstående tabel viser de danske CIF priser for halm, træflis og træpiller for
tre forskellige scenarier. Bemærk venligst, at priserne for lokalt anvendte
halm- og træflisressourcer kan ligge under CIF niveau. Halm antages at være
et lokalt brændsel gennem hele perioden med priser bestemt af priserne på
lokal træflis (se diskussionen efter tabellen).
Euro/GJ Halm Træflis Træpiller
Year Lav Med Høj Lav Med Høj Lav Med Høj
2012 5,0 5,5 5,9 5,6 6,1 6,6 7,6 8,3 8,8
2013 5,0 5,5 6,0 5,6 6,1 6,6 7,6 8,3 8,8
2014 5,0 5,5 6,0 5,6 6,1 6,7 7,6 8,3 8,9
2015 5,0 5,6 6,1 5,6 6,2 6,8 7,6 8,4 8,9
2016 5,1 5,6 6,2 5,6 6,2 6,9 7,6 8,4 8,9
2017 5,1 5,7 6,2 5,7 6,3 6,9 7,6 8,4 9,0
2018 5,1 5,7 6,3 5,7 6,4 7,0 7,6 8,5 9,0
2019 5,1 5,8 6,3 5,7 6,4 7,0 7,6 8,5 9,0
2020 5,2 5,8 6,4 5,7 6,5 7,1 7,7 8,5 9,0
2021 5,2 5,9 6,4 5,8 6,6 7,2 7,7 8,6 9,1
2022 5,2 6,0 6,5 5,8 6,6 7,2 7,7 8,6 9,1
2023 5,2 6,0 6,6 5,8 6,7 7,3 7,7 8,6 9,2
2024 5,2 6,1 6,7 5,8 6,7 7,4 7,7 8,7 9,2
2025 5,3 6,1 6,8 5,9 6,8 7,5 7,7 8,7 9,2
2026 5,3 6,2 6,9 5,9 6,9 7,6 7,7 8,7 9,3
2027 5,3 6,2 7,0 5,9 6,9 7,7 7,7 8,8 9,4
2028 5,3 6,3 7,1 5,9 7,0 7,8 7,7 8,8 9,4
2029 5,3 6,4 7,1 5,9 7,1 7,9 7,7 8,9 9,5
2030 5,3 6,4 7,2 5,9 7,1 8,0 7,7 8,9 9,5
2031 5,3 6,5 7,3 5,9 7,2 8,1 7,7 8,9 9,6
2032 5,3 6,5 7,4 5,9 7,2 8,2 7,7 9,0 9,7
2033 5,3 6,6 7,5 5,9 7,3 8,3 7,7 9,0 9,7
2034 5,3 6,6 7,6 5,9 7,3 8,4 7,7 9,0 9,8
2035 5,3 6,7 7,7 5,9 7,4 8,5 7,7 9,1 9,9
2040 5,3 6,9 8,2 5,9 7,6 9,1 7,7 9,2 10,2
2045 5,3 7,1 8,6 5,9 7,9 9,6 7,7 9,4 10,6
2050 5,3 7,4 9,1 5,9 8,2 10,2 7,7 9,6 11,0
Tabel 1: Fremskrevne biomassepriser CIF Danmark i tre givne scenarier (€/GJ).
Til trods for at nogle aktører har indikeret, at handel med træflis vil vedblive at
være et regionalt marked og ikke handles internationalt, er dette dog ikke til-
fældet i dag, eftersom træflis er blevet handlet internationalt gennem mange

9 | Analysis of biomass prices, future Danish prices for straw, wood chips and wood pellets “Final Report” - 18-06-2013
år – primært til brug i papirindustrien. Over de seneste år er træflis til energi-
formål imidlertid også set importeret til Europa fra Afrika (også til Danmark),
og europæiske energiproducenter er begyndt at undersøge mulighederne for
at importere store mængder af træflis fra Nordamerika.
På den anden side er det ikke realistisk at de danske CIF priser for træflis og
halm præcist kan reflektere leveringsomkostningerne for træflis eller halm til
et decentralt værk i Danmark, som har adgang til lokale ressourcer. I denne
sammenhæng fungerer de ovenfor listede priser som et prisloft, men det er
sandsynligt at de sammenlagte omkostninger til køb af lokal ressource + trans-
port til værk vil være lavere end ’CIF + transport’ prisen. Det anbefales derfor,
at der anvendes en særskilt prissætningsmetode til at beregne priserne for lo-
kalt halm og træflis.
Opsummering af prisfremskrivninger på fast biomasse
I sammenhæng med dette studies egen analyse af prisfremskrivninger, er der
også blevet foretaget et review af andre prisfremskrivninger. Tabel 2 og Tabel
3 herunder opsummerer nøgletallene for prisestimater for træpiller og træflis
fra central studier konverteret til en fælles enhed (EUR/GJ) for at lette sam-
menligningen. Bemærk venligst, at der er betydelige forskelligheder i form af
fokus og formål for de forskellige studier, hvorfor en sammenligning af de op-
summerede priser bør foretages med forsigtighed og med hensyn til de anta-
gelser og specifikke forhold, der ligger til grund for de enkelte studier.
Brug af lokale ressourcer

10 | Analysis of biomass prices, future Danish prices for straw, wood chips and wood pellets “Final Report” - 18-06-2013
Prisvurde-
ring
kilde
2010 2015 2020 2030 2050 Kommentarer
Træpillepriser, EUR/GJ
Sveaskog 6,98 to
8,05
5,5 to
6,71
Importerede pil-
ler
Pöyry 7,79 Højt pille- efter-
spørgsels scena-
rio
Biomass Fu-
tures - PRI-
MES
15,30 19,46 20,13
Lille-skala træbio-
masse: primært
piller. Reference
scenario
DEA 2011 9,66 9,93 10,74 Industrielle træ-
piller
IEA Task 40 8,19 ENDEX piller
E4tech 12,89 UK varme sektor,
bulk-piller, lokal
oprindelse
E4tech 13,96 UK varmesektor,
bulk-piller, im-
porterede
AEA 13,96 15,17 15,17 Bulk-piller
Nærvæ-
rende studie
DEA 2013
8,4 8,5 8,9 9,6
CIF priser ved
dansk havn
Tabel 2: Opsummering af resultater fra centrale træpille prisfremskrivningsstudier, EUR/GJ

11 | Analysis of biomass prices, future Danish prices for straw, wood chips and wood pellets “Final Report” - 18-06-2013
Prisvurdering
kilde 2010 2015 2020 2030 2050 Kommentarer
Wood chip price, EUR/GJ
Sveaskog 3,89 to
6,17
2,82 to
4,97
Træflis fra lokale
energiafgrøder
Sveaskog 6,44 to
7,52
6,17 to
7,52
Træflis fra skandi-
naviske skovbrug
(resttræ)
DEA 2011 6,58 6,98 7,79
E4tech 8,19
UK varmesektor,
UK ener-
giafgrøder
E4tech 11,68
UK varmesektor,
importeret bio-
masse
AEA 6,98 6,98 6,98 Industriel træflis,
centralt scenario
Nærværende
studie
DEA 2013
6,2 6,5 7,1 8,2
CIF priser ved
dansk havn
Tabel 3: Opsummering af resultater fra centrale træflis prisfremskrivningsstudier, EUR/GJ

12 | Analysis of biomass prices, future Danish prices for straw, wood chips and wood pellets “Final Report” - 18-06-2013
2 Executive Summary
This study, carried out by Ea Energy Analyses, has been commissioned by the
Danish Energy Agency (Ea Energy Analyses / DEA) and is a part of DEA’s peri-
odic publishing of long term projections of fuel prices for socio economic anal-
yses.
The key deliverables of this study are price projections for solid biomass fuels
(wood pellets, wood chips and straw) for the period of 2013 – 2050, with par-
ticular focus on the period until 2035. The prices hereby listed should be inter-
preted as CIF prices at a Danish port denoted in real terms (in 2012 EUR/GJ).
The socio-economic fuel price projections set forth by the DEA are to be used,
among other things, in planning and economic evaluations of prospective pro-
jects in the Danish energy industry.
The solid biomass fuel price projections hereby set forth should not be re-
garded as forecasts; rather, as a possible development path of the respective
prices provided fulfilment of a certain set of assumptions and pre-conditions.
Assumptions and approach
The basis of the projection is, firstly, an assumption of a regional and global
demand for biomass for energy as described in the New Policy scenario in the
IEA publication World Energy Outlook 2012. This demand structure for 2020
and 2035 is projected to continue towards 2050.
Secondly, Denmark is assumed to be a ‘price-taker’ in the global solid biomass
fuel market, with ‘price-taker’ in this sense meaning that changes in Danish
demand do not affect the global prices. This assumption is based on Den-
mark’s relatively small demand volumes on a global scale.
Thirdly, it is expected that global trade in solid biomass fuels will intensify in
the future, meaning, among other things, more liquidity in the market and
more competitive price-setting.
For these reasons the price estimation approach deployed in this study is
comprised of the following primary elements:
1) Global long-term biomass supply and demand dynamics are modelled
using the Global Change Assessment Model (GCAM). The model de-
rives a global energy biomass price for the modelled years, in principle
by finding an equilibrium price between global long-term supply and
demand for biomass. The model includes a global database of land

13 | Analysis of biomass prices, future Danish prices for straw, wood chips and wood pellets “Final Report” - 18-06-2013
use, and projects developments in global agriculture, forestry, land
use, conversion technologies, as well as demand for forest products,
energy, food, feed, etc.
2) Thereafter the scenario yielding a global biomass energy demand that
most closely resembles that from the World Energy Outlook 2012,
New Energy Policies pathway is selected. The scenario output is in the
form of a price path development for a simulated global market for an
unrefined biomass resource, a price that should be interpreted as ‘at
forest’.
3) This price is then further adjusted and processed to emulate a CIF
Denmark price under the assumption that Denmark is a biomass im-
porting country. This adjustment incorporates costs associated with
the treatment, processing and local and international transport of the
biomass, and reflects assumptions related to those regions that are
expected to export to Denmark in the future.
The above modelling is undertaken given the assumption that the long-term
equilibrium price is cost-related, which is expected to be the case for wood
chips and wood pellets. For straw, however, the assumption that straw for en-
ergy purposes is a more troublesome fuel than wood is applied. On that basis
straw as starting point can be priced in accordance with wood chip prices, but
always somewhat lower. Based on historical prices, it is assumed that straw
for energy purposes in Denmark will be priced roughly 10% less than wood
chips, as measured by energy content.
The rationale for using the GCAM model is that it is one of the premier inte-
grated assessment models (IAMs) used for economic, technological, and pol-
icy analysis. GCAM began in 1975 under the name MiniCAM (Mini Climate As-
sessment Model), and has since been used in the Intergovernmental Panel on
Climate Change’s (IPCC) ongoing work.
Uncertainties
In undertaking such an analysis, there is always a great deal of uncertainty re-
lated to the assumptions taken, models chosen, scenarios utilised, etc. Some
of the most relevant uncertainties relating to this study are highlighted below.
The projection period itself, almost 40 years, calls for caution, especially when
taking uncertainties about global land use, competing demands for biomass
and prospects of yield increases into account.
Duration of
projection period

14 | Analysis of biomass prices, future Danish prices for straw, wood chips and wood pellets “Final Report” - 18-06-2013
As any modelling framework, GCAM simplifies reality, and the assumptions
made can have significant impact on the results. First of all, GCAM operates
under the assumption of ‘perfect markets’ in its equilibrium calculations,
which is not the case in reality. There are also no subsidies modelled (though
subsidy-induced demand effects are indirectly represented through model
alignment with WEO 2012 demand projections).
Lastly, the current version of GCAM deployed, GCAM-DTU, does not specifi-
cally model costs associated with land use change, making land use shifts
more drastic than could be expected in reality. However, this does not appear
to have significant impact on the central scenario employed in the study, the
Regional Policy scenario.
A number of assumptions have been made in the above mentioned step 3,
and the accuracy of the price projections are subject to the materialisation of
the said assumptions. Particular attention should be paid to the assumptions
regarding transportation distance and processing costs as variations in these
parameters significantly affect the final CIF prices.
There is general agreement that biomass to be used for energy purposes
should be sustainable. However, there is not yet a general consensus on how
this is precisely defined, and what it means for the global supply. Topics of
particular importance in this context are biodiversity and the CO2 impact from
direct and indirect land use change. It is important to state that a thorough in-
vestigation of solid biomass sustainability is not the focus of this analysis.
The authors of this report have been tasked with developing a methodology
for estimating future biomass price scenarios, taking sustainability issues into
account. In this context, it is obvious that restrictions on the supply side, for
example as a result of sustainability criteria, will result in a price increase.
With the uncertainty regarding the definition of what constitutes sustainable
biomass, it is extremely difficult to quantify this effect.
However, it is our evaluation that any restrictions on the production or sale of
international biomass brought about by the implementation of sustainability
criteria would have to be quite excessive in order to influence biomass prices
in a significant fashion.
Assumptions in GCAM
modelling framework
Danish CIF price
estimation
Effect of sustainability
on prices

15 | Analysis of biomass prices, future Danish prices for straw, wood chips and wood pellets “Final Report” - 18-06-2013
Socio-economic price projections for biomass fuels 2013 – 2050 (CIF
Danish port)
The following table displays the CIF Denmark prices for straw, wood chips and
wood pellets under 3 different scenarios. Please note that in the case of lo-
cally used straw and wood chip resources the prices can be below CIF prices.
Straw is assumed to be a local fuel throughout the period, with prices set by
the price of local wood chips (see discussion below).
Euro/GJ Straw Wood Chips Wood Pellets
Year Low Med High Low Med High Low Med High
2012 5.0 5.5 5.9 5.6 6.1 6.6 7.6 8.3 8.8
2013 5.0 5.5 6.0 5.6 6.1 6.6 7.6 8.3 8.8
2014 5.0 5.5 6.0 5.6 6.1 6.7 7.6 8.3 8.9
2015 5.0 5.6 6.1 5.6 6.2 6.8 7.6 8.4 8.9
2016 5.1 5.6 6.2 5.6 6.2 6.9 7.6 8.4 8.9
2017 5.1 5.7 6.2 5.7 6.3 6.9 7.6 8.4 9.0
2018 5.1 5.7 6.3 5.7 6.4 7.0 7.6 8.5 9.0
2019 5.1 5.8 6.3 5.7 6.4 7.0 7.6 8.5 9.0
2020 5.2 5.8 6.4 5.7 6.5 7.1 7.7 8.5 9.0
2021 5.2 5.9 6.4 5.8 6.6 7.2 7.7 8.6 9.1
2022 5.2 6.0 6.5 5.8 6.6 7.2 7.7 8.6 9.1
2023 5.2 6.0 6.6 5.8 6.7 7.3 7.7 8.6 9.2
2024 5.2 6.1 6.7 5.8 6.7 7.4 7.7 8.7 9.2
2025 5.3 6.1 6.8 5.9 6.8 7.5 7.7 8.7 9.2
2026 5.3 6.2 6.9 5.9 6.9 7.6 7.7 8.7 9.3
2027 5.3 6.2 7.0 5.9 6.9 7.7 7.7 8.8 9.4
2028 5.3 6.3 7.1 5.9 7.0 7.8 7.7 8.8 9.4
2029 5.3 6.4 7.1 5.9 7.1 7.9 7.7 8.9 9.5
2030 5.3 6.4 7.2 5.9 7.1 8.0 7.7 8.9 9.5
2031 5.3 6.5 7.3 5.9 7.2 8.1 7.7 8.9 9.6
2032 5.3 6.5 7.4 5.9 7.2 8.2 7.7 9.0 9.7
2033 5.3 6.6 7.5 5.9 7.3 8.3 7.7 9.0 9.7
2034 5.3 6.6 7.6 5.9 7.3 8.4 7.7 9.0 9.8
2035 5.3 6.7 7.7 5.9 7.4 8.5 7.7 9.1 9.9
2040 5.3 6.9 8.2 5.9 7.6 9.1 7.7 9.2 10.2
2045 5.3 7.1 8.6 5.9 7.9 9.6 7.7 9.4 10.6
2050 5.3 7.4 9.1 5.9 8.2 10.2 7.7 9.6 11.0
Table 4: Projected biomass prices CIF Denmark in given three scenarios (€/GJ).
While some actors have indicated that wood chips will continue to be a re-
gional market and not be traded internationally, this is however not the case
today, as wood chips have been traded internationally for numerous years (al-
beit primarily for use in the pulp and paper industry). More recently, wood

16 | Analysis of biomass prices, future Danish prices for straw, wood chips and wood pellets “Final Report” - 18-06-2013
chips for energy purposes have also been imported to Europe from Africa (in-
cluding to Denmark), and European utilities are starting to investigate the pos-
sibility of importing large amounts of wood chips from North America.
On the other hand, the CIF Denmark price for wood chips and straw is not
likely to adequately reflect the delivered cost of wood chips or straw at a de-
centralised inland power plant in Denmark that has access to local resources.
In this regard, the above prices, plus a transport cost, would act as price cap,
but it is likely that a total ‘local resource + transport to plant’ cost would be
less than the ‘CIF + transport’ cost. It is therefore recommended that an al-
ternative pricing approach be utilised to calculate a local straw and wood chip
price.
Summary of solid biomass future price projections
In conjunction with the price projection analysis presented in this report, a re-
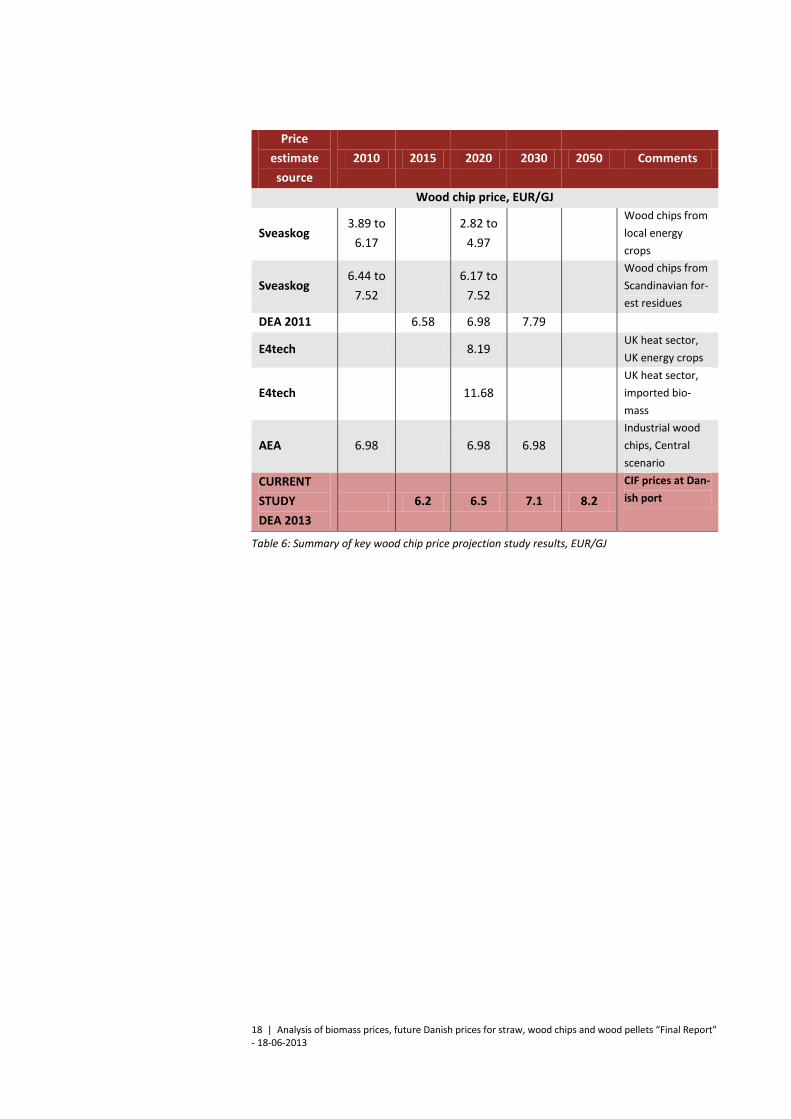
view of other projections was undertaken. Table 5 and Table 6 below summa-
rise key price estimates for wood pellets and wood chips from prior studies re-
spectively, converted to a common unit (EUR/GJ) for ease of comparison.
Please note that there are substantial differences in terms of the scope and
purpose of each of the studies reviewed, hence comparison of the values
summarised should be done with caution and with reference to the key as-
sumptions and specifications of each respective study.
Use of local resources

17 | Analysis of biomass prices, future Danish prices for straw, wood chips and wood pellets “Final Report” - 18-06-2013
Price
estimate
source
2010 2015 2020 2030 2050 Comments
Wood pellet price, EUR/GJ
Sveaskog 6.98 to
8.05
5.5 to
6.71 Imported pellets
Pöyry 7.79 High pellet de-
mand scenario
Biomass Fu-
tures -
PRIMES
15.30 19.46 20.13
Small-scale
woody biomass:
mainly pellets.
Reference sce-
nario
DEA 2011 9.66 9.93 10.74 Industrial wood
pellets
IEA Task 40 8.19 ENDEX pellets
E4tech 12.89 UK heat sector,
bulk pellets, local
origin
E4tech 13.96 UK heat sector,
bulk pellets, im-
ported
AEA 13.96 15.17 15.17 Bulk wood pellets
CURRENT
STUDY
DEA 2013
8.4 8.5 8.9 9.6
CIF prices at Dan-
ish port
Table 5: Summary of key wood pellet price projections study results, EUR/GJ
18 | Analysis of biomass prices, future Danish prices for straw, wood chips and wood pellets “Final Report” - 18-06-2013
Price
estimate
source
2010 2015 2020 2030 2050 Comments
Wood chip price, EUR/GJ
Sveaskog 3.89 to
6.17
2.82 to
4.97
Wood chips from
local energy
crops
Sveaskog 6.44 to
7.52
6.17 to
7.52
Wood chips from
Scandinavian for-
est residues
DEA 2011 6.58 6.98 7.79
E4tech 8.19 UK heat sector,
UK energy crops
E4tech 11.68
UK heat sector,
imported bio-
mass
AEA 6.98 6.98 6.98
Industrial wood
chips, Central
scenario
CURRENT
STUDY
DEA 2013
6.2 6.5 7.1 8.2
CIF prices at Dan-
ish port
Table 6: Summary of key wood chip price projection study results, EUR/GJ

19 | Analysis of biomass prices, future Danish prices for straw, wood chips and wood pellets “Final Report” - 18-06-2013
3 Global biomass overview
This chapter presents an overview of global biomass production and main uti-
lisation streams.
3.1 Global land use and biomass production
The total surface of the planet earth is approximately 500 million km2, or 50
billion ha (Gha). With land area being 29% of the total surface, land sums to
14.5 Gha. When ice sheets are deducted the resulting land area represents 13
Gha (The Geological Society of America n.d.).
In Figure 1 the distribution of this land between the major global regions and
the way it was being used in 2009 is shown. Overall, approximately 10%
(1.5Gha) was dedicated to producing arable crops, over 25% (3.5Gha) was
used for pasture (to produce meat, milk and wool), and 30% was forestry
(4Gha). The remaining ~30% (4Gha) is a broad category that includes all other
uses, including barren land and built-up areas. (Slade, et al. 2011)
Figure 1: The global distribution of land by region and use. Source: (Slade, et al. 2011)
The figure draws a picture where human life has a substantial influence on
global land use. Basically all arable land, and to some extent also pasture and
forestry is affected by human activities.

20 | Analysis of biomass prices, future Danish prices for straw, wood chips and wood pellets “Final Report” - 18-06-2013
The Net Primary Production (NPP) is a term expressing the production of plant
material based on the photosynthesis process. Different sources estimate a
global NPP from land biomass to be around 55 Gton Carbon/year (48 GT – 69
GT in the table below). With 45% carbon content in biomass and a lower heat-
ing value of 18 GJ/ton biomass the calorific value of the global terrestrial
above ground NPP is 2,200 EJ/year.
Biomass Global NPP (PG C yr-1)
Tropical forest 16.0–23.1
Temperate forest 4.6–9.1
Boreal forest 2.6–4.6
Tropical savannah and grasslands 14.9–19.2
Temperate grasslands and shrub lands 3.4–7.0
Deserts 0.5–3.5
Tundra 0.5–1.0
Croplands 4.1–8.0
TOTAL 48.0–69.0
Table 7: Estimates of Global NPP, Based on Christopher M. Gough, Virginia Commonwealth Uni-versity) © 2012 Nature Education
Since the 1970s there have been concerns voiced about the human use of
NPP. Based on data from FAOSTAT and other sources, the annual human har-
vest of global biomass can be approximated as shown below.
Biomass EJ
Global cereals 40
Crop residues 60
Pasture 75
Roundwood + energy 25
Forest residues 20
TOTAL 220
Table 8: Estimate of global human harvest of biomass (Own evaluation based on FAOSTAT and other sources).
The table shows that the total human inflicted harvest of biomass for all pur-
poses is approximately 10% of terrestrial NPP. However, according to a gen-
eral definition of the term Human Appropriated Net Primary Production
(HANPP) the percentage is somewhat larger, 20% - 25%. By this definition
HANPP measures the combined effect of all human land use induced changes
in NPP. (Erb, et al. 2009)

21 | Analysis of biomass prices, future Danish prices for straw, wood chips and wood pellets “Final Report” - 18-06-2013
3.2 Agriculture and forestry
World average per capita food available for direct consumption (after allowing
for waste, animal-feed and non-food uses, was 2,770 Kcal/day (11.5
MJ/per/day) (Alexandratos og Bruinsma 2012). With 7 billion people on the
planet, the direct food consumption seems to equal “only” 29.6 EJ/year.
2005/07 2050
Population Mio. 6,584 9,306
Cereals, food Kg/capita 158 160
Cereals, all uses Kg/capita 314 330
Meat, food Kg/capita 38.7 49.4
Oilcrops, food Kg/capita 12.1 16.2
Oilcrops all uses Kg/capita 21.9 30.5
Cereals production Mio. tonnes 2,068 3,009
Meat production Mio. tonnes 258 455
Cereals yield Tonnes/ha 3.32 4.3
Arable land Mio. ha 1,592 1,661
Table 9: Development of key variables towards 2050 (Alexandratos og Bruinsma 2012).
Table 9 shows that the average human diet consists of 18% meat on a weight
basis. The annual global production of fish is roughly 145 million tonnes (not
included in the table), with 85% used for direct food purposes. Based on these
figures, the average human diet can be calculated to consist of approximately
23% meat and fish.
The table also shows that FAO projects average cereal yields to increase with
more than 40% over the period, corresponding to 0.6% p.a. Total cereals pro-
duction will grow by 45% and meat production by 76% over the period.
With the simple assumption that 1 energy unit of meat demands 10 energy
units of biomass, the NPP value of the cereals, oilseeds and meat production
is 65 EJ in 2005/07 and 106 EJ in 2050. When including residues left in the
field and wastes, this figure could probably be doubled to 130 EJ in 2005/07
and above 200 EJ in 2050. These assumptions yield good compliance with the
figures in Table 8.
In the publication Agricultural outlook 2012-2021, OECD-FAO has analysed,
among other things, price drivers and price trends for agricultural products.
The figure below shows that cereals are expected to experience a very moder-
ate growth in prices in spite of growing demand. Note that growth is shown in
nominal terms.

22 | Analysis of biomass prices, future Danish prices for straw, wood chips and wood pellets “Final Report” - 18-06-2013
Figure 2: Price trends in nominal terms towards 2021. Source: OECD-FAO, Agricultural Outlook 2012-2021.
Forestry
According to FAO and other sources, forests cover 4 billion hectares of land,
more than 30% of total global land areas (excluding permanent ice covered
land). Primary forests – forests of native species in which there are no clearly
visible signs of past or present human activity – are estimated to occupy 36
per cent of the total forest area. Other naturally regenerated forests make up
some 57 per cent, while planted forests account for an estimated 7 per cent,
of the total forest area. (Global Forest Resourcse Assessment 2010).
The rate of deforestation shows signs of decreasing. Around 13 million hec-
tares of forest were converted to other uses – largely agriculture – or lost
through natural causes each year in the last decade. Both Brazil and Indone-
sia, which had the highest net loss of forest in the 1990s, have significantly re-
duced their rate of loss. Afforestation and natural expansion of forests in
some countries have contributed to reduced net loss of forest area at the
global level. The net change in forest area in the period 2000–2010 is esti-
mated at 5.2 million hectares per year (0.13% of total forest area). (Global
Forest Resourcse Assessment 2010)
23 | Analysis of biomass prices, future Danish prices for straw, wood chips and wood pellets “Final Report” - 18-06-2013
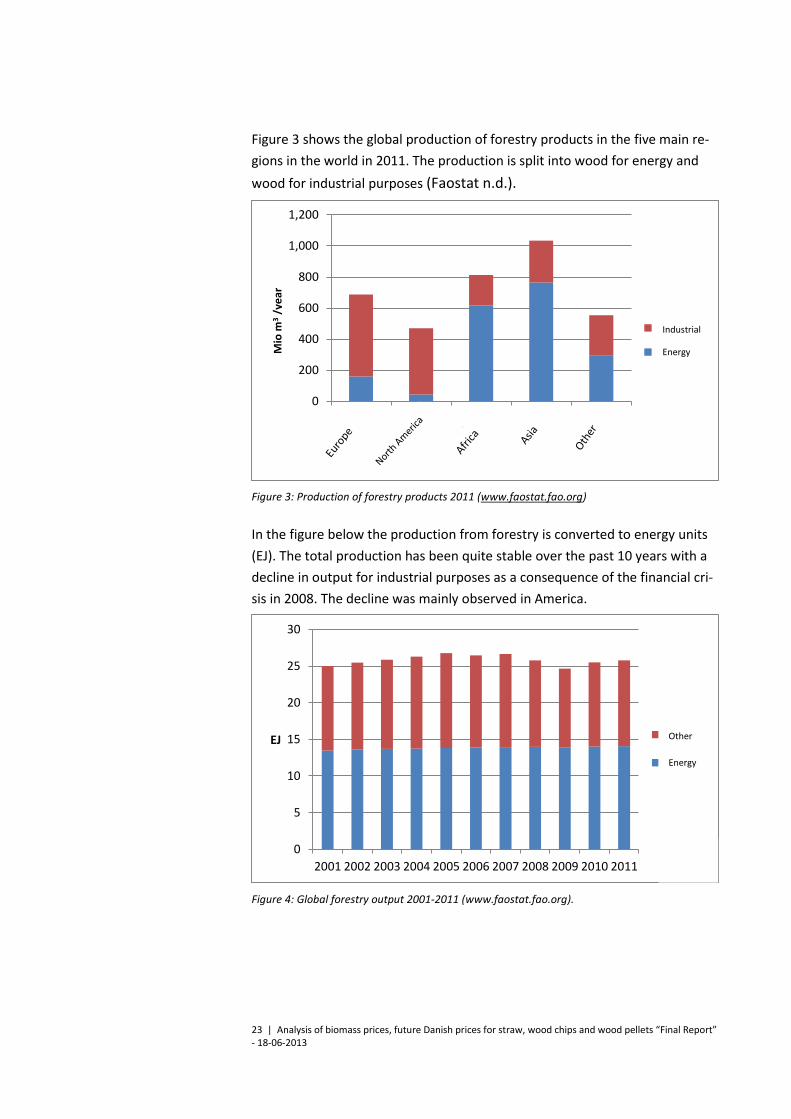
Figure 3 shows the global production of forestry products in the five main re-
gions in the world in 2011. The production is split into wood for energy and
wood for industrial purposes (Faostat n.d.).
Figure 3: Production of forestry products 2011 (www.faostat.fao.org)
In the figure below the production from forestry is converted to energy units
(EJ). The total production has been quite stable over the past 10 years with a
decline in output for industrial purposes as a consequence of the financial cri-
sis in 2008. The decline was mainly observed in America.
Figure 4: Global forestry output 2001-2011 (www.faostat.fao.org).
0
200
400
600
800
1,000
1,200
Mio
m3
/år
Industri
Energi
0
5
10
15
20
25
30
2001 2002 2003 2004 2005 2006 2007 2008 2009 2010 2011
EJ Andet
Energi
Industrial
Energy
Other
Energy
Mio
m3
/ye
ar

24 | Analysis of biomass prices, future Danish prices for straw, wood chips and wood pellets “Final Report” - 18-06-2013
4 Biomass for energy
The following chapter will review biomass used for energy, presenting the dif-
ferent types of biomass fuels and their key characteristics. An overview of
standardisation and sustainability issues will be given, as well as a review of
solid biomass markets.
According to the 2012 World Energy Outlook, global bioenergy usage was
roughly 53 EJ in 2010, with nearly 60% being classified as traditional biomass
(IEA 2012). Bioenergy usage according to sector (%) is displayed in Figure 5.
Figure 5: Global bioenergy usage by sector and for traditional usage (%) (IEA 2012)
Traditional biomass demand is primarily from developing countries, and in-
volves rather inefficient usage forms, for example direct meal preparation and
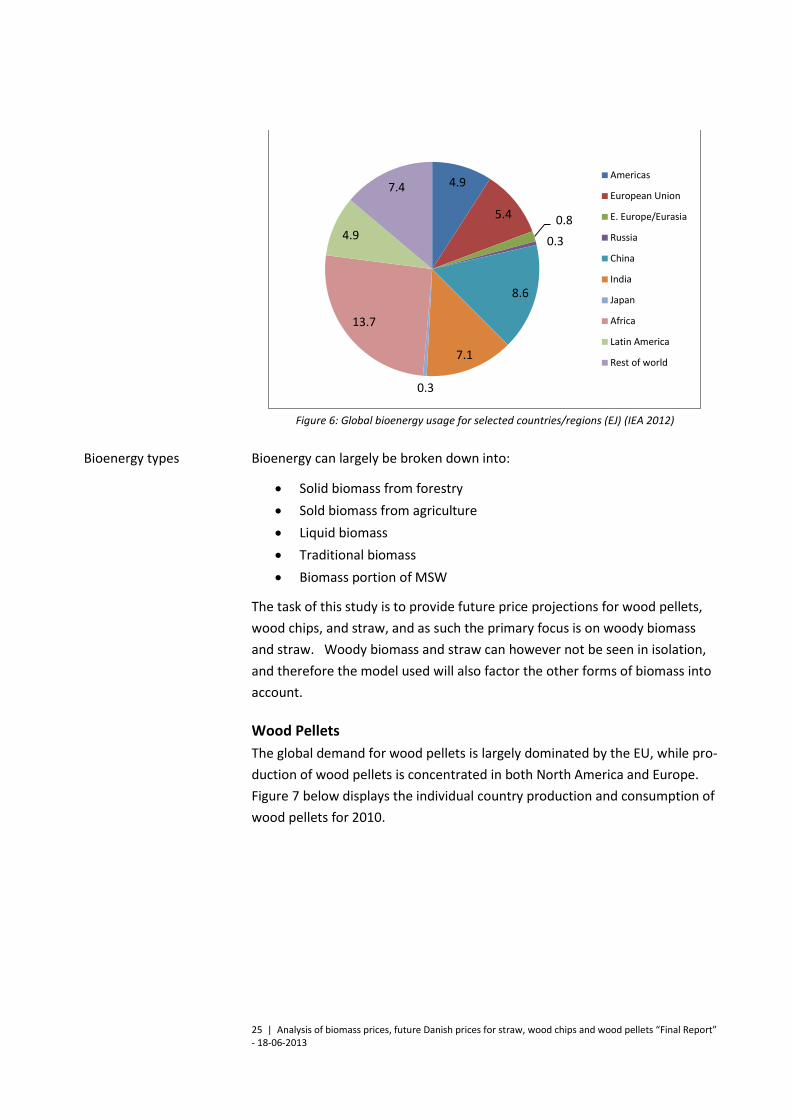
heating. Meanwhile, bioenergy usage in OECD countries is to a larger extent
attributed to power plants, industry, and transport. Perhaps it is not surprising
then that of the 53 EJ of global bioenergy, only 11 GJ were utilised in OECD
countries, while the rest was utilised in non-OECD countries. This is reflected
in Figure 6 where the global dispersion according to selected regions / coun-
tries (EJ) is displayed.
Traditional biomass
Industry
Power
Transport
Buildings
Other
Global bioenergy usage
25 | Analysis of biomass prices, future Danish prices for straw, wood chips and wood pellets “Final Report” - 18-06-2013
Figure 6: Global bioenergy usage for selected countries/regions (EJ) (IEA 2012)
Bioenergy can largely be broken down into:
Solid biomass from forestry
Sold biomass from agriculture
Liquid biomass
Traditional biomass
Biomass portion of MSW
The task of this study is to provide future price projections for wood pellets,
wood chips, and straw, and as such the primary focus is on woody biomass
and straw. Woody biomass and straw can however not be seen in isolation,
and therefore the model used will also factor the other forms of biomass into
account.
Wood Pellets
The global demand for wood pellets is largely dominated by the EU, while pro-
duction of wood pellets is concentrated in both North America and Europe.
Figure 7 below displays the individual country production and consumption of
wood pellets for 2010.
4.9
5.4 0.8
0.3
8.6
7.1
0.3
13.7
4.9
7.4 Americas
European Union
E. Europe/Eurasia
Russia
China
India
Japan
Africa
Latin America
Rest of world
Bioenergy types

26 | Analysis of biomass prices, future Danish prices for straw, wood chips and wood pellets “Final Report” - 18-06-2013
Figure 7: Individual country 2010 wood pellet production and consumption (Cocchi, et al. 2011)
Wood chips
The global demand for wood chips for energy purposes is currently primarily
used in smaller decentralised heat and electricity plants, however large dedi-
cated plants that utilise wood chips are becoming a viable alternative and sev-
eral plants are in the planning or construction stage in the Nordic countries.
Straw
Denmark is one of the very few countries that utilises a substantial amount of
straw for energy purposes. Annual usage varies, but in 2011 the figure was
just under 20 PJ. With a heating value of 14.5 GJ/tonne, this corresponds to a
little less than 1.4 million tonnes of straw.
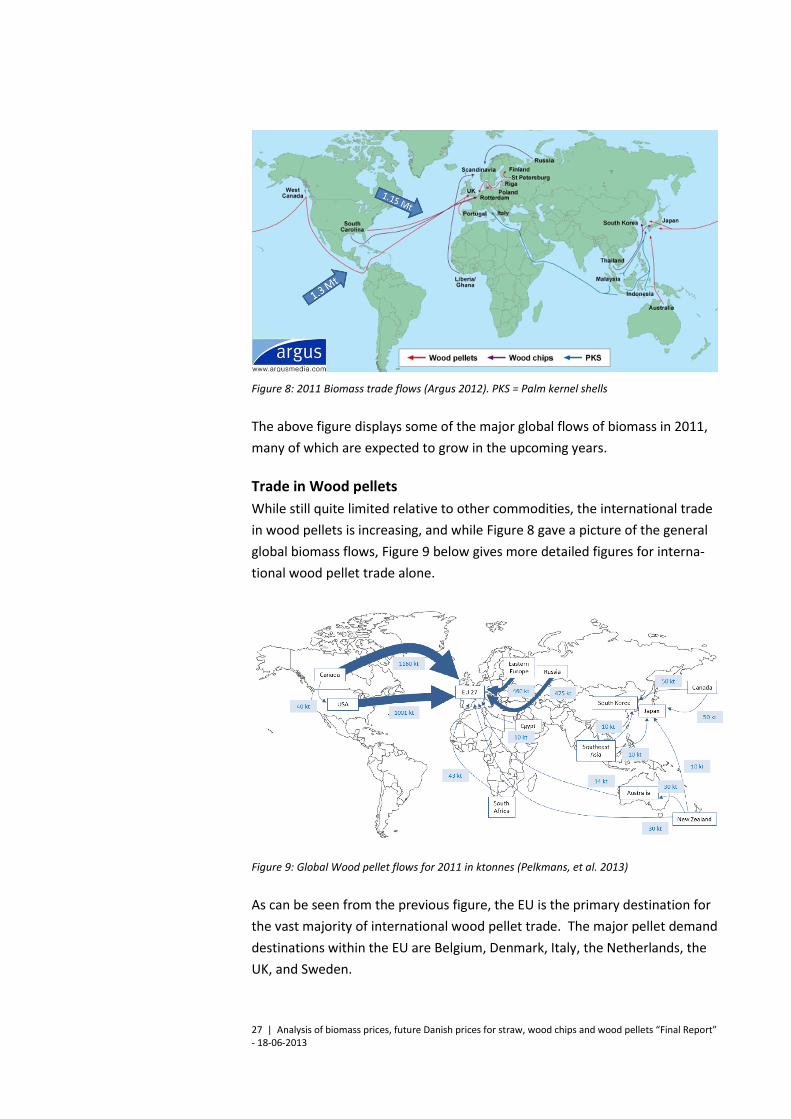
4.1 Biomass trade
Relative to other commodities the volumes of long-distance biomass trade for
non-food purposes have traditionally been quite limited, with the major im-
porters being Japan (wood chips for use in pulp and paper), and the EU for use
in pulp and paper, but also, to a growing extent, for energy purposes (primar-
ily wood pellets, but also some wood chips).
27 | Analysis of biomass prices, future Danish prices for straw, wood chips and wood pellets “Final Report” - 18-06-2013
Figure 8: 2011 Biomass trade flows (Argus 2012). PKS = Palm kernel shells
The above figure displays some of the major global flows of biomass in 2011,
many of which are expected to grow in the upcoming years.
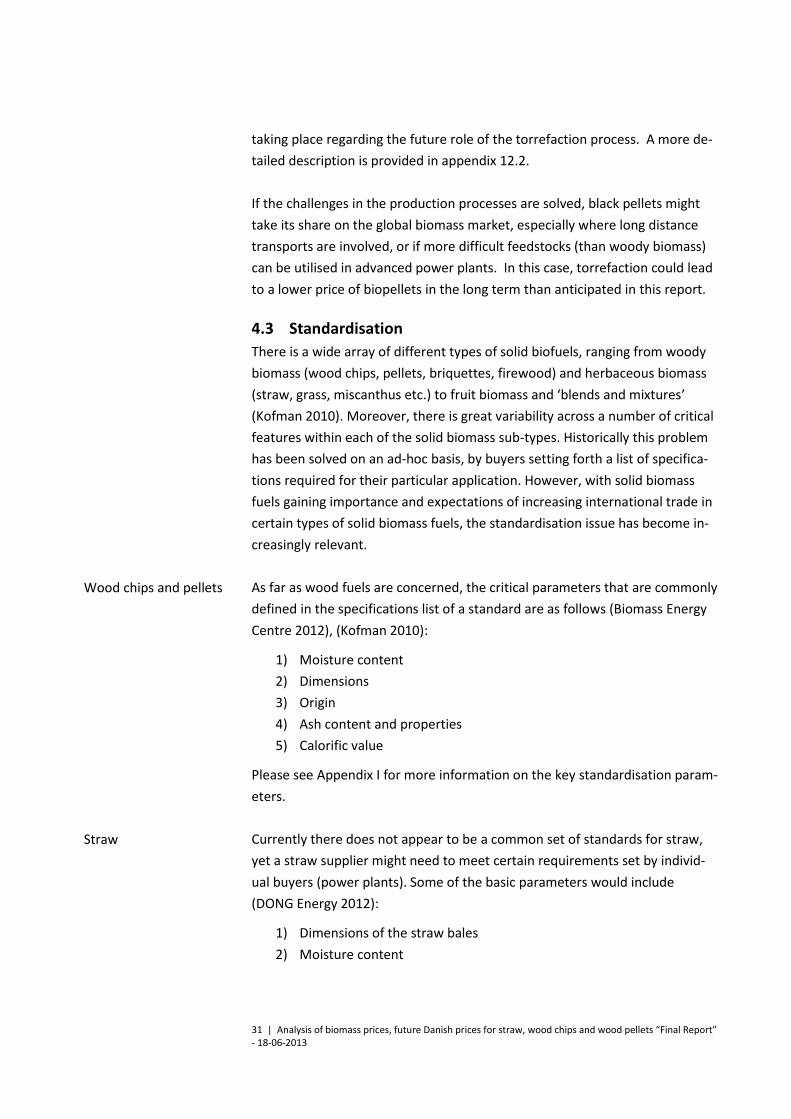
Trade in Wood pellets
While still quite limited relative to other commodities, the international trade
in wood pellets is increasing, and while Figure 8 gave a picture of the general
global biomass flows, Figure 9 below gives more detailed figures for interna-
tional wood pellet trade alone.
Figure 9: Global Wood pellet flows for 2011 in ktonnes (Pelkmans, et al. 2013)
As can be seen from the previous figure, the EU is the primary destination for
the vast majority of international wood pellet trade. The major pellet demand
destinations within the EU are Belgium, Denmark, Italy, the Netherlands, the
UK, and Sweden.

28 | Analysis of biomass prices, future Danish prices for straw, wood chips and wood pellets “Final Report” - 18-06-2013
Trade in wood chips
While international trade of wood chips for use in the pulp and paper industry
has been on-going for some time, trade in wood chips for energy purposes has
until recently been quite limited as it was regarded as more of a local re-
source.
In June of 2012 IEA Bioenergy Task 40 released a publication on the global
trade in wood chips, and the table below displays its figures for production,
import and export (Lamers, et al. 2012). It is estimated that approx. 10% of
the annual trade of wood chips is designated for energy purposes, while the
remaining trade is primarily for paper and pulp production. The study indi-
cates that trade with wood chips for energy purposes primarily involves Euro-
pean countries.
Country Production Import Export
Canada 20,725 1,312 443
Australia 4,968 1 4,759
Sweden 4,263 1,345 293
South Africa 3,561 - 2,122
China 3,536 2,766 7
Chile 2,293 - 3,695
Russia 2,035 2 1,377
Brazil 1,921 - 1,025
USA 1,650 57 2,849
Finland 1,596 1,908 227
Japan 1,556 10,478 -
Austria 964 1,007 166
Germany 860 395 1,278
Latvia 783 7 1,449
Thailand 572 6 1,253
Uruguay 315 - 860
Turkey 234 1,542 -
Italy 116 691 9
South Korea - 741 -
Norway - 619 77
Other 7,429 3,429 3,307
World 59,374 26,305 25,194
Data inconsistency 1,111
Table 10: 2009 Wood chip production, import, and export (1,000 tonnes) (Lamers, et al. 2012)
The largest wood chip -producing countries in 2009 were Canada (37%), Aus-
tralia (8%), Sweden (7%), Russia (6%), China and Finland (each 5%). All of
these countries are also producers of pulp and paper, as is Japan, which was
Global

29 | Analysis of biomass prices, future Danish prices for straw, wood chips and wood pellets “Final Report” - 18-06-2013
by far the largest importer of wood chips in 2009. There is currently a clear
trend in the paper industry to move production from the northern to south-
ern hemisphere. As a result, in the future it is expected that wood chips for
the paper industry will increasingly come from South America (e.g. Brazil) and
Southeast Asia (e.g. Vietnam) (Lamers, et al. 2012).
Within Europe it is possible to distinguish between two markets for wood
chips. The first is comprised of the countries bordering the Baltic Sea, where
Denmark and Sweden (and to a certain extent, Finland and Germany) have
been the main importers of wood chips, primarily from the Baltic States and
Russia. The second market is concentrated around Italy, which imports from
neighbouring countries, particularly the Balkan countries (Lamers, et al. 2012).
In recent years there has been an increase in the European trade of wood
chips. Instead of using locally produced wood chips, the Scandinavian coun-
tries have increasingly imported wood chips from the Baltic States and Russia.
Another more recent manifestation has been the import of wood chips across
the Atlantic from North America and South America, as well as from West Af-
rica to Europe.
Trade in straw and other agricultural residues
Today straw is primarily a local or national resource, and has not traditionally
been transported long distances for energy purposes. Meanwhile, some agri-
cultural residues are already transported long distances today for use in the
energy sector, for example palm kernel shells.
Relative to woody biomass it is more difficult for most power plants to utilise
agricultural residues, and therefore the total raw material input cost +
transport cost of straw or other input will have to be lower than the equiva-
lent cost for woody biomass. If this is the case, then there is a substantial
global potential that could eventually be traded.
4.2 Future potential biomass areas
Woody biomass
The Nordic, Baltic and remaining European countries are not expected to be
able to export large amounts of woody biomass for energy production in the
coming years as any increased production is likely to be utilised to satisfy in-
creasing domestic/regional demand. While some Nordic countries do have
ample forest resources, the remoteness and slow growth of the resource
EU

30 | Analysis of biomass prices, future Danish prices for straw, wood chips and wood pellets “Final Report” - 18-06-2013
make it difficult to compete price-wise with imports from other regions on the
global market.
With its significant resources, but challenges related to logistics and invest-
ment risk, Russia remains a wildcard.
In speaking with various market actors, the eastern US and Brazil are touted
as those areas that can supply Europe with the largest amount of secure sus-
tainable woody biomass in the near future. It is estimated that these two re-
gions could supply between 15-20 million tonnes of woody biomass per year.
While more risky, estimates for West Africa are in the neighbourhood of 3-5
million tonnes. These expectations are reflected in forecasts from for exam-
ple RWE, which is predicting over 13 million tonnes of wood pellets alone to
be imported by Europe by 2015 (see below).
Figure 10: Expected world trade flow of wood pellets for 2015 in millions of tonnes (Argus 2012)1
Torrefaction
Torrefaction is a partial pyrolysis process which transforms the biomass prop-
erties into a more dense and water repelling substance suited for transport
and open air storage. Torrefied and pelletised biomass is sometimes referred
to as black pellets. A major benefit with black pellets is their ability to replace
coal in existing coal fired power plants with only minor refurbishment costs.
The benefits mentioned above might be outweighed by the energy loss and
other costs and challenges in the production process. Black pellets have not
yet made a significant inroad on the market but a good deal of discussion is
1 Strictly wood pellets to plants with 100 MW capacity or greater. Asia may have more demand for other types of biomass due to dedicated plants coming online
31 | Analysis of biomass prices, future Danish prices for straw, wood chips and wood pellets “Final Report” - 18-06-2013
taking place regarding the future role of the torrefaction process. A more de-
tailed description is provided in appendix 12.2.
If the challenges in the production processes are solved, black pellets might
take its share on the global biomass market, especially where long distance
transports are involved, or if more difficult feedstocks (than woody biomass)
can be utilised in advanced power plants. In this case, torrefaction could lead
to a lower price of biopellets in the long term than anticipated in this report.
4.3 Standardisation
There is a wide array of different types of solid biofuels, ranging from woody
biomass (wood chips, pellets, briquettes, firewood) and herbaceous biomass
(straw, grass, miscanthus etc.) to fruit biomass and ‘blends and mixtures’
(Kofman 2010). Moreover, there is great variability across a number of critical
features within each of the solid biomass sub-types. Historically this problem
has been solved on an ad-hoc basis, by buyers setting forth a list of specifica-
tions required for their particular application. However, with solid biomass
fuels gaining importance and expectations of increasing international trade in
certain types of solid biomass fuels, the standardisation issue has become in-
creasingly relevant.
As far as wood fuels are concerned, the critical parameters that are commonly
defined in the specifications list of a standard are as follows (Biomass Energy
Centre 2012), (Kofman 2010):
1) Moisture content
2) Dimensions
3) Origin
4) Ash content and properties
5) Calorific value
Please see Appendix I for more information on the key standardisation param-
eters.
Currently there does not appear to be a common set of standards for straw,
yet a straw supplier might need to meet certain requirements set by individ-
ual buyers (power plants). Some of the basic parameters would include
(DONG Energy 2012):
1) Dimensions of the straw bales
2) Moisture content
Wood chips and pellets
Straw
32 | Analysis of biomass prices, future Danish prices for straw, wood chips and wood pellets “Final Report” - 18-06-2013
Other features specific to straw that should be considered include ash content
(cereal straw in particular has a very high ash content), ash melting tempera-
ture (some types of straw have a low ash melting point, giving rise to clinker
formation and potentially damaging the boiler) as well as trace elements (rela-
tively high content of potassium and chlorine which can be problematic).
Several notable standardisation initiatives have been taking place, among
which the standards set forth by the European Committee for Standardisation
(CEN) should be noted. CEN has established Technical Committee 335 – Solid
Biofuels, which covers a wide range of woody biomass. TC 335 first set forth
technical standards (TS) defining terminology, specifications, fuel quality as-
surance and sampling methodology, which were later revised and imple-
mented as Euro Norms (ENs) displacing all previous national standards across
the EU. The new EN would also be used as a basis for the new ISO standards
(Biomass Energy Centre 2012).
A relatively recent initiative in the US by the Pellet Fuels Institute and the
American Lumber Standard Institute entails the possibility for pellet mills to
certify their products via a third-party verification system (Geiver 2012).
ENplus in Europe is a similar certification scheme, which is based on fulfilment
of the EN 14961-2 provisions, yet requires even stricter quality criteria (ENplus
2013).
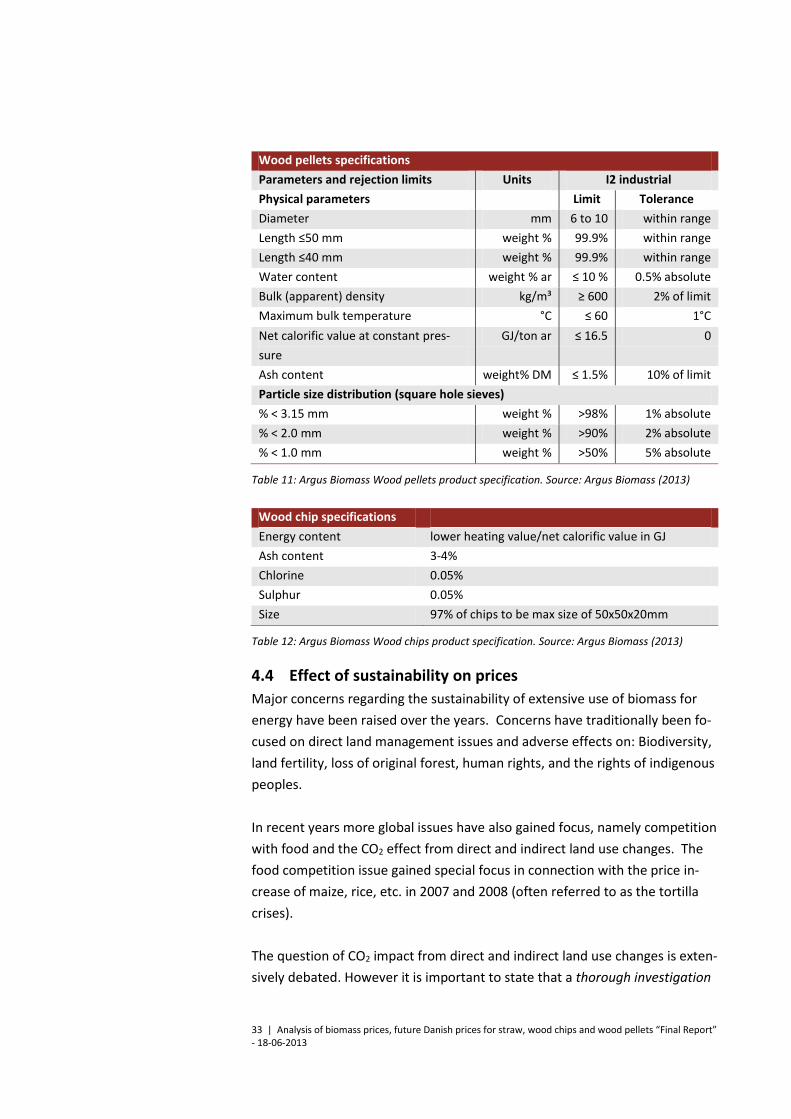
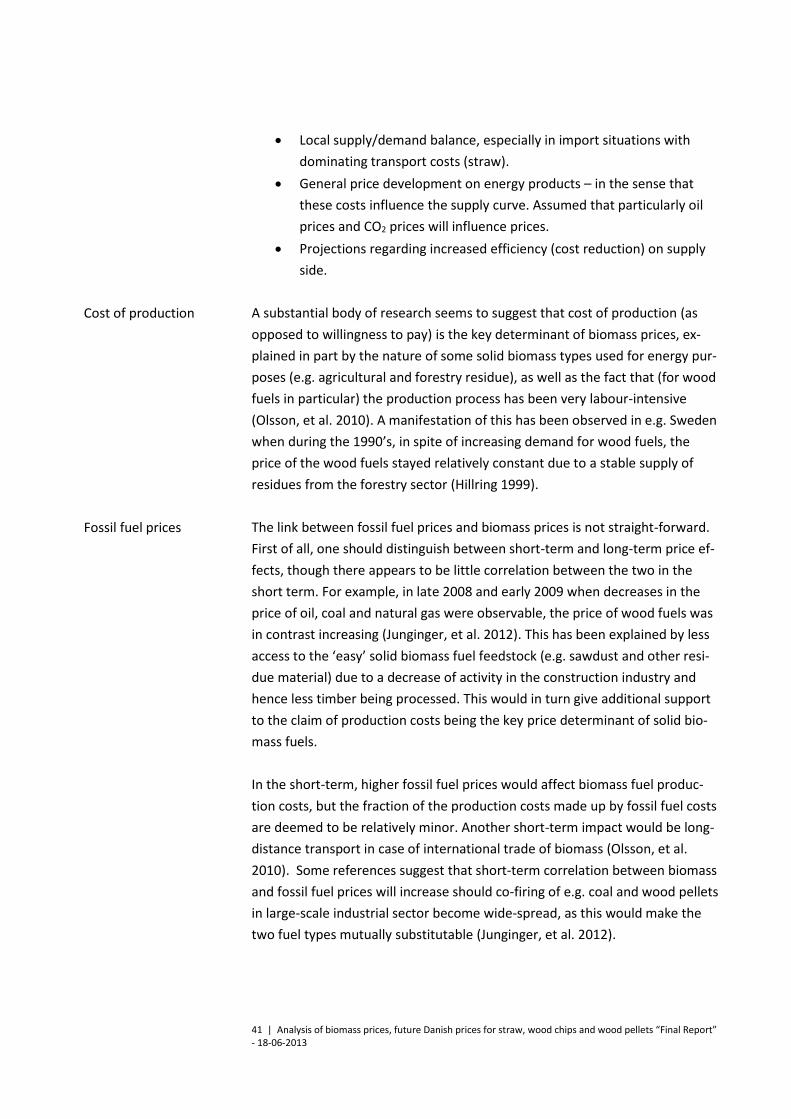
An example of a set of standards for industrial wood pellets as commodities is
presented in Table 11 (a set of standards in line with Initiative Wood Pellet
Buyers Group Industrial 2 specifications used by Argus Media for their wood
pellet international bulk spot market analysis) and Table 12 for wood chips
(Argus Media 2013). The presented set of standards is also consistent with the
wood pellet standards used by the ENDEX wood pellets biomass exchange
(Endex 2012).
Current standards
33 | Analysis of biomass prices, future Danish prices for straw, wood chips and wood pellets “Final Report” - 18-06-2013
Wood pellets specifications
Parameters and rejection limits Units I2 industrial
Physical parameters Limit Tolerance
Diameter mm 6 to 10 within range
Length ≤50 mm weight % 99.9% within range
Length ≤40 mm weight % 99.9% within range
Water content weight % ar ≤ 10 % 0.5% absolute
Bulk (apparent) density kg/m³ ≥ 600 2% of limit
Maximum bulk temperature °C ≤ 60 1°C
Net calorific value at constant pres-
sure
GJ/ton ar ≤ 16.5 0
Ash content weight% DM ≤ 1.5% 10% of limit
Particle size distribution (square hole sieves)
% < 3.15 mm weight % >98% 1% absolute
% < 2.0 mm weight % >90% 2% absolute
% < 1.0 mm weight % >50% 5% absolute
Table 11: Argus Biomass Wood pellets product specification. Source: Argus Biomass (2013)
Wood chip specifications
Energy content lower heating value/net calorific value in GJ
Ash content 3-4%
Chlorine 0.05%
Sulphur 0.05%
Size 97% of chips to be max size of 50x50x20mm
Table 12: Argus Biomass Wood chips product specification. Source: Argus Biomass (2013)
4.4 Effect of sustainability on prices
Major concerns regarding the sustainability of extensive use of biomass for
energy have been raised over the years. Concerns have traditionally been fo-
cused on direct land management issues and adverse effects on: Biodiversity,
land fertility, loss of original forest, human rights, and the rights of indigenous
peoples.
In recent years more global issues have also gained focus, namely competition
with food and the CO2 effect from direct and indirect land use changes. The
food competition issue gained special focus in connection with the price in-
crease of maize, rice, etc. in 2007 and 2008 (often referred to as the tortilla
crises).
The question of CO2 impact from direct and indirect land use changes is exten-
sively debated. However it is important to state that a thorough investigation

34 | Analysis of biomass prices, future Danish prices for straw, wood chips and wood pellets “Final Report” - 18-06-2013
of solid biomass sustainability is not the focus of this analysis. The authors of
this report have been tasked with developing a methodology for estimating
future biomass price scenarios, taking sustainability issues into account.
Anytime restrictions are placed on supply this will of course result in a price
increase. However, it is our evaluation that any restrictions on the production
or sale of international biomass brought about by the implementation of sus-
tainability criteria would have to be quite excessive in order to influence bio-
mass prices in a significant fashion. This evaluation is primarily based on the
different price scenarios developed by using the GCAM model (see following
chapters), and provided that global demand follows the path described in the
World Energy Outlook New Policies scenario.

35 | Analysis of biomass prices, future Danish prices for straw, wood chips and wood pellets “Final Report” - 18-06-2013
5 Solid biomass prices
Biomass for energy purposes is primarily traded via bilateral contracts and as
such prices vary from contract to contract. However, by combining a number
of purchases it is possible to get a general price for each commodity over a
particular time period. A good source for Danish biomass prices is the Danish
District Heating Association, which collects the prices that its members has
paid for various fuels, compiles them, and generates a weighted average for
each fuel on a quarterly basis (see Figure 11 below). Prices are in DKK/MWh
for the fuel at the plant gate, exclusive VAT, but including energy and CO2
taxes for fossil fuels (biomass is exempt from energy and CO2 taxes up until
2014). Reading from the graph and converting to DKK/GJ, the average prices
in second quarter 2012 were approximately: Wood pellets: 70 DKK/GJ; Wood
chips: 49 DKK/GJ; Straw: 42 DKK/GJ.
Figure 11: Nominal fuel prices delivered to Danish district heating plants from the 2nd quarter of 1998 till the 2nd quarter of 2012 in kr./MWh. Prices are exclusive VAT, but inclusive other taxes. Red = oil, navy blue/yellow = natural gas, turquoise with brown dots = wood pellets, darker green = wood chips, light green =straw. (Danish District Heating Association 2012)
From the figure it is apparent that over the past 10 - 15 years the prices for
various biomasses in Denmark have been quite steady, particularly when com-
pared to those for fossil fuels. It is also apparent that the prices of straw and
wood chips follow each other closely, with straw prices historically being 5%-
15% lower. The costs displayed are nominal values, and as such in real terms
the cost of straw (light green), and wood chips (dark green) have stayed quite
constant over this period, with wood pellets (turquoise with brown dots)
showing a more gradual increase. Costs for all three biomass forms have
grown and fluctuated significantly less than costs associated with natural gas
(dark blue), and oil (red).
Danish prices
Fuel
Oil
Natural gas
Straw
Wood chips
Wood pellets
Natural gas -
market

36 | Analysis of biomass prices, future Danish prices for straw, wood chips and wood pellets “Final Report” - 18-06-2013
As was indicated above, the prices in Figure 11 are a weighted average deliv-
ered at plant gate. In later years the import of solid biomass for energy pur-
poses has grown steadily, and in 2011 28 PJ of wood pellets and 6 PJ of wood
chips were imported to Denmark. (Danish Energy Agency 2012). Imports ac-
counted for 92% of pellet consumption and 34% of wood chip consumption in
that year.
Further analysis of the price statistics reveals that there is a good deal of price
variance within the above displayed average prices for all three fuels, particu-
larly so for the most local fuel, straw. There are generally two main ways of
acquiring straw in Denmark, through local contracts or via tenders.
Smaller amounts of straw are mostly traded via local contracts be-
tween the farmer and the energy producer, where the straw comes
from local farmers within a radius of 30-50 km. Under this model, the
local decentralised district heating companies enter into contracts
with one or more of the local farmers regarding the delivery of an
amount of straw for a certain price. These types of contracts typically
run for 3-5 years (Holst 2010).
Dong Energy and Vattenfall are the largest consumers of straw for en-
ergy purposes, purchasing roughly 950,000 tonnes per year.2 The vast
portion of this is purchased via tender, and the transport distance for
this type of procurement can be farther, typically within a radius of 75
km (Boldt 2009) (Holst 2010). Under this procedure the energy pro-
ducer puts out a tender containing information about which plants
demand a certain type of straw for the following period. The tender
does not reveal the amounts of straw needed, and the farmers then
submit their bids on how much straw they can deliver to the specific
plant at what price.
Under both procurement systems regional and local variations in straw prices
can occur due to local surpluses or shortfalls in the straw yield from year to
year.
Relative to other commodities there are very few financial transactions that
take place involving wood pellets and wood chips. As a result, the market li-
quidity or “trading churn rate” for both commodities is extremely low (see
text box).
2 With average national straw for energy figures of ca. 1,400,000 tonnes, these two energy producers pur-chase roughly 68% of the total average (Holst 2010).
North American and Eu-
ropean prices of woody
biomass

37 | Analysis of biomass prices, future Danish prices for straw, wood chips and wood pellets “Final Report” - 18-06-2013
In an attempt to add more liquidity and transparency to the wood chip and
pellet markets indexes such as APX-ENDEX and Argus Biomass have been es-
tablished.
APX-ENDEX
In 2008 APX-ENDEX introduced an industrial wood pellet index where a pricing
panel consisting of a number of market participants contributed to generating
reference prices for 3 month forward contracts, 3 quarter forward contracts,
and 1 year forward contracts. In 2009 the number of panel members and con-
tracts in the price index were increased. In November of 2011 APX-ENDEX
launched the world’s first biomass exchange which consisted of forward con-
tracts for industrial wood pellets covering 3 months, 3 quarters, and 3 years.
According to APX-ENDEX:
“The development of the biomass exchange follows a two-phased ap-
proach. In phase one, the exchange started with non-cleared products,
meaning the physical settlement is arranged bilaterally between the coun-
terparties after the trade has been concluded. Phase two will include the
development and implementation of clearing services for wood pellets
contracts, thereby providing further financial security to market partici-
pants.” (APX-ENDEX 2013)
The figure below displays the APX-ENDEX wood pellet future prices for March
of 2012 till February of 2013 for monthly, quarterly and yearly forward con-
tracts. Prices are in euro per metric tonne CIF Rotterdam.
Trading churn rate - is simply the amount of times an underlying good is in-
volved in a financial transaction for each time it physically changes hands (i.e.
total traded volume/physically traded volume), and for wood pellets and wood
chips this ratio is close to one. This is due to the lack of physical clearing
houses for wood pellets and chips, and as such it has only been possible to act
through trading companies or by direct contact between supplier and cus-
tomer. Oil on the other hand has a trading churn rate of 150, which implies
that for every time a barrel of oil is physically traded, it has been involved in
150 financial transactions. Other examples (and their churn rates) include sea
grains (3), wheat (10), corn (15-20), and soya (50). The international trading
company Nidera suggests that the liquidity threshold for a commodities mar-
ket is between at least 10 and 15, and thus the churn rate of just 1 for wood
pellets and wood chips suggest that these markets are still quite far from
reaching this threshold. (Nidera 2010)

38 | Analysis of biomass prices, future Danish prices for straw, wood chips and wood pellets “Final Report” - 18-06-2013
Figure 12: APX-ENDEX wood pellet future prices for March of 2012 till February of 2013 for monthly, quarterly and yearly forward contracts. Prices are in euro per metric tonne CIF Rotter-dam. (APX-ENDEX 2013). Please note that the vertical axis starts at 125 euros.
Argus Biomass
Like APX-ENDEX, Argus Biomass has a price index for wood pellets, and it also
has price indexes for wood chips. These prices are published weekly via its Ar-
gus Biomass Markets publication, and this publication is constantly adding
new CIF and FOB prices. The table on the following page gives an overview of
the current indexes tracked and published by Argus as of February 2013.

39 | Analysis of biomass prices, future Danish prices for straw, wood chips and wood pellets “Final Report” - 18-06-2013
Markets covered Location Contracts assessed
Wood pellets CIF ARA Spot, 3 quarters ahead, 3 years ahead
Wood pellets FOB Baltic Riga Spot, 3 quarters ahead, 3 years ahead
Wood pellets FOB Portugal Aveiro Spot, 3 quarters ahead, 3 years ahead
Wood pellets FOB North America Northeast US Spot
Southeast US Spot
Northwest US Spot
Southwest Canada Spot
Wood pellets US Domestic Portland, Maine Spot
Camden, NJ Spot
Wilmington, NC Spot
Port Everglades, FL Spot
Mobile, AL Spot
Chicago, IL Spot
Seattle, WA Spot
North American wood chips spot - FOB export and CIF delivery
Portland, OR Spot
Tacoma, WA Spot
Vancouver, BC Spot
Mobile, AL Spot
Moorhead City, NC Spot
Sheet Harbour, NS Spot
Wood chips CIF Northwest Europe Spot, 3 quarters ahead, 3 years ahead
Table 13: Overview of Argus Biomass indexes as of February, 2013. (Argus Biomass 2013)
According to its methodology and specifications guide, the indexes are:
“Weekly and based on two elements — a survey of market participants’
views on where prices stand, and a volume-weighted average of any trades
which fit the index specifications and which Argus has been able to verify
with more than one counterparty to the deal. Argus may apply editorial
judgment to the survey where necessary and may discard prices which, in
the editorial team’s judgement, are not repeatable and not representative
of the market price.” (Argus Biomass 2013)
In addition to the above indexes, the weekly publication also includes forward
prices and shipping costs for various ship sizes on the main trading routes.

40 | Analysis of biomass prices, future Danish prices for straw, wood chips and wood pellets “Final Report” - 18-06-2013
Argus CIF ARA wood pellet spot prices from early 2013 were for example 56
DKK/GJ, meanwhile CIF ARA wood chip prices were 44 DKK/GJ. 3
As previously mentioned, these prices are based on a survey of market partici-
pants, as well as a volume-weighted average of verified contracts considered
‘repeatable’ (Argus Biomass 2013). Thus, while these figures may be a good
indicator of current prices, actual contracts may vary from these values de-
pending on the amount, duration, etc.
Price overview
Table 14 summarises the various cost figures outlined above.
Source Straw Wood chips Wood pellets
DDHA, 2nd quarter 20124 39.9 49.4 71.35
Argus CIF ARA - early 2013 N/A 44.3 55.9
ENDEX CIF Rotterdam – early 2013 N/A N/A 56.1
Table 14: Various price indicators for straw, wood chips and wood pellets (2012 DKK/GJ).
Due to the main transport routes of pellets and wood chips it can be assumed
that CIF Denmark would be slightly above CIF ARA for pellets and slightly be-
low CIF ARA for wood chips. There is (thus far) no international price indicator
for straw. The rather large difference between the DDHA wood pellet price
and the international price indicators is not analysed but could to some extent
be caused by the following factors:
The pellet consuming DH plants are relatively small, and local handling
and transport is a factor
Some of the price contracts could be fixed prices including storage fa-
cilities
5.1 Key biomass price determinants: literature review
Biomass prices are inherently complex phenomena depending on a variety of
factors, and there does not appear to be a consensus as to the specifics of this
mechanism. Previous studies carried out on behalf of the Danish Energy
Agency have identified 13 different factors that might have an effect on bio-
mass prices (Boldt 2009). However, the four factors described below were
noted as dominating:
General development in food prices and other biomass products (land
rent).
3 In 2012 DKK. 4 Weighted average, delivered at plant gate 5 Without transport, figure is 68.2 DKK/GJ
41 | Analysis of biomass prices, future Danish prices for straw, wood chips and wood pellets “Final Report” - 18-06-2013
Local supply/demand balance, especially in import situations with
dominating transport costs (straw).
General price development on energy products – in the sense that
these costs influence the supply curve. Assumed that particularly oil
prices and CO2 prices will influence prices.
Projections regarding increased efficiency (cost reduction) on supply
side.
A substantial body of research seems to suggest that cost of production (as
opposed to willingness to pay) is the key determinant of biomass prices, ex-
plained in part by the nature of some solid biomass types used for energy pur-
poses (e.g. agricultural and forestry residue), as well as the fact that (for wood
fuels in particular) the production process has been very labour-intensive
(Olsson, et al. 2010). A manifestation of this has been observed in e.g. Sweden
when during the 1990’s, in spite of increasing demand for wood fuels, the
price of the wood fuels stayed relatively constant due to a stable supply of
residues from the forestry sector (Hillring 1999).
The link between fossil fuel prices and biomass prices is not straight-forward.
First of all, one should distinguish between short-term and long-term price ef-
fects, though there appears to be little correlation between the two in the
short term. For example, in late 2008 and early 2009 when decreases in the
price of oil, coal and natural gas were observable, the price of wood fuels was
in contrast increasing (Junginger, et al. 2012). This has been explained by less
access to the ‘easy’ solid biomass fuel feedstock (e.g. sawdust and other resi-
due material) due to a decrease of activity in the construction industry and
hence less timber being processed. This would in turn give additional support
to the claim of production costs being the key price determinant of solid bio-
mass fuels.
In the short-term, higher fossil fuel prices would affect biomass fuel produc-
tion costs, but the fraction of the production costs made up by fossil fuel costs
are deemed to be relatively minor. Another short-term impact would be long-
distance transport in case of international trade of biomass (Olsson, et al.
2010). Some references suggest that short-term correlation between biomass
and fossil fuel prices will increase should co-firing of e.g. coal and wood pellets
in large-scale industrial sector become wide-spread, as this would make the
two fuel types mutually substitutable (Junginger, et al. 2012).
Cost of production
Fossil fuel prices
42 | Analysis of biomass prices, future Danish prices for straw, wood chips and wood pellets “Final Report” - 18-06-2013
There is more evidence of fossil fuel prices and solid biomass fuel prices corre-
lation in the long term. As fossil fuel prices rise, market participants gain an in-
centive to seek alternatives (Olsson, et al. 2010). In most cases this would,
however, require investments in new technologies and equipment, as well as
other long-term decisions. Hence, it would be reasonable to expect that in-
creased fossil fuel prices in one period would affect solid biomass fuel prices
further down the line. There are some studies that would seem to suggest
that a lag of 1 to 2 years should be expected for this price effect to take place
(Boldt 2009, Junginger, et al. 2012).
Yet another factor that makes the determination of biomass and fossil fuel
price correlation difficult (or indeed, the link between solid biomass fuel
prices and any other key price driver) is the fact that large solid biomass fuel
consumers often choose to organise procurement via long-term fixed (or
regulated) price contracts (E4tech 2010). This delays or even neutralises many
of the short- to medium-term effects that variability of a certain price driver
would have otherwise brought about. Having said that, one should, however,
note that some studies have attempted estimating short-term correlation
between solid biomass fuel and fossil fuel prices. A study carried out by
Hedenus et. al (2010)6 concludes that there is no statistically significant
relation between residential wood pellet prices and the oil price. The same
result could be derived from Figure 11 above regarding industrial pellets. Fuel
price analysis done by Strauss (2012) suggests correlation between heating oil
prices and residential wood pellet prices, yet wood pellets following at a
slower rate. As an example, diesel and heating oil price increase of 4% p.a. is
said to result in wood pellet price increase of 2.8% p.a.
A graphical illustration of wood flows in Europe is presented in Figure 13,
which gives a good idea of the complex structure of the competing industries
requiring (in this case woody) biomass.
6 As per citation in Olsson et. al (2010)
Biomass demand

43 | Analysis of biomass prices, future Danish prices for straw, wood chips and wood pellets “Final Report” - 18-06-2013
Figure 13: Wood flows in Europe 2008. Illustration from Junginger et. al (2012)
As far as the selected solid biomass fuels in question are concerned, a study
carried out by the AEA (2010) with a goal to estimate the potential biomass
supply in the UK between 2010 and 2030 has set forth a methodology which,
among other things, provides an overview of the most relevant competing de-
mand industries (from the standpoint of bioenergy demand) for selected
types of solid biomass feedstock. A summary is presented in Table 15.
Type of feedstock Competing demand industries
Sawmill residues Pulp mills, panel board manufacture, animal bedding
Forest residues and small round wood none
Short rotation forestry none
Straw Animal bedding, animal feed
Table 15: Major competing biomass demand industries. Source: AEA (2010)
What Table 15 in fact demonstrates is that not all solid biomass fuel feedstock
types have alternative uses, yet again giving support to the claim that produc-
tion costs might be the main driving force behind the prices of certain biomass
fuel types. When it comes to pulp mills, several studies indicate that pulp and
paper industries are facing a weak market with demand declining over time,
especially for newsprint products (Olsson, et al. 2010), the only exception be-
ing China (Strauss 2012). Nonetheless it is also being pointed out that cur-
rently it is still more profitable to use pulpwood for paper rather than for en-
ergy production (ForestBioEnergy 2007).

44 | Analysis of biomass prices, future Danish prices for straw, wood chips and wood pellets “Final Report” - 18-06-2013
From a demand perspective it is also worth noting that the energy industry
has been found to exhibit lesser price sensitivity with regard to biomass prices
as compared to fossil fuel prices. The forestry industry has also been found to
be more price sensitive with regard to biomass as compared to the energy in-
dustry (Lundmark 2009).
Price mechanisms can also vary depending on the biomass feedstock - a study
by Hedman (1992)7 analysing the Swedish wood chip market reveals that the
main price determinant for wood chips produced out of cutting residues (e.g.
branches, wood from thinning, low quality stemwood) is the cost of produc-
tion, whereas sawmill residue price was more dependent on the willingness to
pay on the part of competing demand industries, e.g. particle board industry.
As to wood pellets and briquettes, cost of production was said to be the main
price driver, though the price level of heating oil was denoted as a natural
‘price ceiling’.
7 As per citation in Olsson et. al (2010)
Type of feedstock

45 | Analysis of biomass prices, future Danish prices for straw, wood chips and wood pellets “Final Report” - 18-06-2013
6 Scenarios for supply and demand
6.1 Future demand of biomass for energy
This section will review literature regarding anticipated future demand for bi-
omass, including official government releases, NGO reports, climate agree-
ments and consultancy reports, to provide an overview of what future bio-
mass demand may look like. Depending on the source, there is a huge varia-
tion in future estimates, due either to the competing interest of those provid-
ing the estimates, or the assumptions utilised. As such the assumptions un-
derlying the forecasts are often just as important, or perhaps even more so,
than the actual figures. Many of these assumptions are further investigated
throughout this report. The section will start with looking at estimates of fu-
ture Danish demand for biomass, before looking at the EU, and finally the
global picture.
Denmark
In terms of solid biomass for energy purposes, as of 2011 Denmark uses
roughly 120 PJ of biomass annually. Of this approximately 21 PJ is from biode-
gradable waste, thus leaving 99 PJ from straw and woody biomass. The Dan-
ish solid biomass consumption from 1980 till 2011 is displayed in Figure 14 be-
low.
Figure 14: Danish solid biomass consumption from 1980 till 2011 (Danish Energy Agency 2012).
0
20
40
60
80
100
120
140
PJ
Straw Woodchips Firewood
Wood pellets Wood waste Waste - renewable
46 | Analysis of biomass prices, future Danish prices for straw, wood chips and wood pellets “Final Report” - 18-06-2013
While straw usage has been relatively stable for the past 10 years, usage of
woody biomass, particularly wood chips and wood pellets has grown substan-
tially. This is in large part to due to large centralised power plants which have
replaced a portion of their fossil fuel inputs with woody biomass. With the
current Danish legislative incentives in place, this is a trend that it is antici-
pated to continue in the years to come.
Denmark has set a number of energy related targets and goals for future
years, including major targets in:
2020 - 50% of traditional electricity consumption is to be covered by
wind power, and more than 35% of final energy consumption from re-
newables (Ministry of Climate, Energy and Building 2012).
2030 - Phasing out coal and oil from electricity and heat supply (The
Danish Ministry of Climate, Energy and Buildings 2011)
2035 - Phasing out natural gas from electricity and heat supply (The
Danish Ministry of Climate, Energy and Buildings 2011)
2050 - Entire Danish energy supply, including transport is covered by
renewable energy (The Danish Ministry of Climate, Energy and
Buildings 2011).
In addition to the above goals, Denmark also has an EU renewable energy tar-
get of 30%. All of the above targets will affect Denmark’s future biomass de-
mand for energy purposes. Different strategies for how the above goals can
be achieved have been put forward, including that of the Danish Commission
on Climate Change Policy (Klimakommission), a panel of leading scientific ex-
perts, whom were tasked with presenting suggestions as to how Denmark can
in the future phase out fossil fuels.
According to the prognosis of the Klimakommission (Klimakommissionen
2010), the fraction of biomass in the Danish primary energy consumption un-
der various future scenarios concerning the overall economic and regulatory
framework development would consistently be in the range of ca. 100 – 120
PJ per annum by 2050, the only exception being the ‘unambitious future’ sce-
nario (characterised by high oil prices, low CO2-quota prices, low biomass
prices and no limitations on biomass use) which would result in extremely
high biomass consumption (exceeding 400 PJ per annum). The probability of
the latter scenario materialising is however questionable.

47 | Analysis of biomass prices, future Danish prices for straw, wood chips and wood pellets “Final Report” - 18-06-2013
Figure 15: Denmark's primary energy consumption (in PJ) by 2050 under various future scenar-ios. 'Reference' assumes no further environmental regulatory decisions. 'A' stands for environ-mentally ambitious global economic framework; 'U' for unambitious. Source: Klimakommissio-nen (2010).
EU
National Renewable Energy Action Plans (NREAPs) provide detailed infor-
mation on how each individual EU member state is envisioning meeting the
legally binding renewable energy targets by 2020. Hence, the cumulative solid
biomass share of future primary energy consumption in the EU (as prescribed
by the NREAPs) would serve as a sound basis for EU’s demand prognosis for
solid biomass. An overview of solid biomass8 demand projections in accord-
ance with NREAPs has been created as a part of Biomass Futures project
(Atanasiu 2010), and is expected to amount to 3,475 PJ by 2020.
EU demand for wood pellets is forecasted to be in the range of 20 – 50 million
tons by 2020 (please see an overview of prior studies in Figure 16), depending
on the assumptions on the key regulatory and economic developments, such
as (Cocchi, et al. 2011):
Policies regarding co-firing in the UK, Netherlands, Belgium, Germany
and Poland (as well as market dynamics on coal and CO2 emission al-
lowances)
Price of fossil fuels for heating and support schemes for pellet stove
and boiler purchases (determining the attractiveness of switching to
wood pellets for residential heating)
8 Includes biodegradable fraction of solid industrial and municipal waste
Wood pellets
Ambient heat
Solar heat
Wave energy
Geothermal
Solar PV
Waste
Biogas
Wind
Natural gas
Coal
Oil
2008 Reference A Future A Reference U Future U

48 | Analysis of biomass prices, future Danish prices for straw, wood chips and wood pellets “Final Report” - 18-06-2013
Figure 16: Expected 2020 wood pellet demand according to various sources (Cocchi, et al. 2011).
Extrapolation of current demand trends exponentially would lead to a con-
sumption level of almost 35 million tons by 2020 in the EU (Cocchi, et al.
2011).
World
According to the projections of the International Energy Agency in the World
Energy Outlook 2012 in their New Policies Scenario, the global primary energy
demand for bioenergy (excluding traditional biomass) would more than dou-
ble from 2010 to 2035 (from 22 EJ to over 50 EJ, respectively), growing at an
annual rate of 3.3% (International Energy Agency 2012). The projections in-
cluding traditional biomass as well as their respective uses by sector are pre-
sented in Figure 17.
Figure 17: World bioenergy use by sector and use of traditional biomass in the New Policies Sce-nario, 2010 (53 EJ) and 2035 (78 EJ). Source: (International Energy Agency 2012).

49 | Analysis of biomass prices, future Danish prices for straw, wood chips and wood pellets “Final Report” - 18-06-2013
For wood pellets, the European Union is expected to remain the main demand
driver on a global scale, yet developments in Japan, South Korea and China
could be significant for the East Asian demand for solid biomass, which is ex-
pected to be in the range of 5 – 10 million tons in 2020 (Cocchi, et al. 2011).
Global wood pellet consumption outlook per region by Pöyry is presented in
Figure 18.
Figure 18: Pöyry’s global wood pellet consumption forecast (Pöyry 2011).
Wood pellet use in the US is expected to remain limited to small-scale use in
households. The demand in Canada would be determined by the progress of
the implementation of the announced coal phase-out by the Ontario Power
Generation (Cocchi, et al. 2011).
6.2 Future supply of biomass
According to IEA’s analysis in the WEO 2012, the global bioenergy resources
should be more than sufficient to satisfy the expected global biomass demand
by 2035. In fact, the global available resources would be nearly double the ex-
pected demand of 78 EJ (International Energy Agency 2012).
There is, however, large variability in terms of biomass resource distribution in
the world. The regions with the largest resource potentials are estimated to
be Latin America (especially Brazil), the US and China. Large variance is also
expected in terms of the degree to which the domestic bioenergy demand
could be satisfied with domestic production. Figure 19 demonstrates the ex-
pected shares of imports across regions by 2035.
Wood pellets

50 | Analysis of biomass prices, future Danish prices for straw, wood chips and wood pellets “Final Report” - 18-06-2013
Figure 19: Share of bioenergy demand for biofuels and power generation from domestic produc-tion and imports, 2010 and 2035. Source: (International Energy Agency 2012).
As can be seen, Japan and the EU would be the largest importers, whereas the
US and China are expected to be fully self-sufficient.
In terms of wood pellets, significant production growth is expected in Western
Europe, the Americas, as well as China (Pöyry 2011) – see Figure 20.
Figure 20: Pöyry’s global wood pellet production forecast.
In terms of wood pellet trade, IEA’s WEO 2012 in the New Policies Scenario
projects the US, Canada and Russia to be major exporters (International
Energy Agency 2012).
The estimates on quantity of wood pellets available for exports specifically to
the EU vary significantly, and depend on the assumptions made about the key
influencing factors. A ‘business-as-usual’ scenario (presented in Figure 21) as-
sumes industry development in line with the historic dynamics (Cocchi, et al.
Wood pellets

51 | Analysis of biomass prices, future Danish prices for straw, wood chips and wood pellets “Final Report” - 18-06-2013
2011). In this scenario, there would be ca. 280 PJ of wood pellets available for
exports to the EU by 2020, the major supply sources being South-East USA
and Brazil.
Figure 21: Wood pellet supply available for export under IEA Bioenergy’s ‘business as usual sce-nario’ (Cocchi, et al. 2011).
A ‘high import’ scenario assumes large investments in additional pellet plants
triggered by the rapid growth of biomass demand in the EU, as well as a
strong development in short rotation crops and energy plantations in certain
regions of the world (e.g. Brazil, Uruguay, West Africa, Mozambique and Rus-
sia). The total quantity of wood pellets (as well as sourcing composition
thereof) is presented in Figure 22. Under the ‘high import’ scenario there is
now almost 600 PJ of wood pellets available for export to the EU in 2020, and
North-West Russia is a major exporting region. It should, however, be noted
that the ‘high import’ scenario assumes ambitious development prospects
highly diverging from the current situation in the global market.
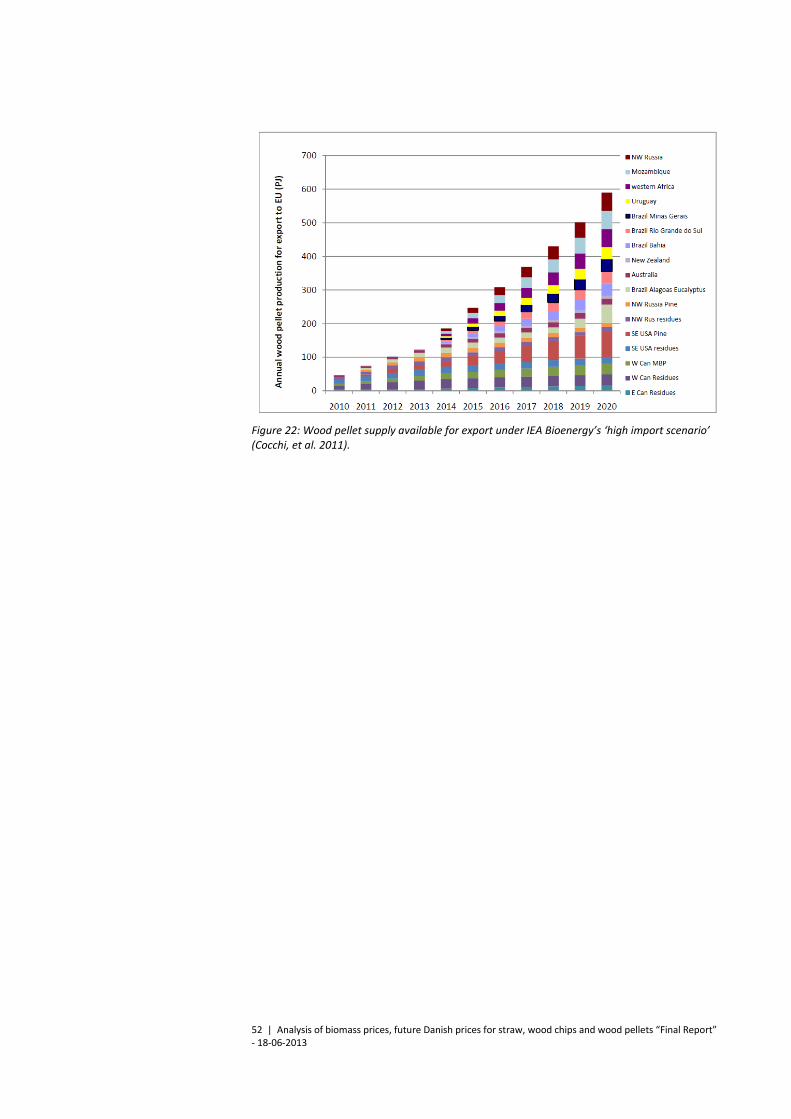
52 | Analysis of biomass prices, future Danish prices for straw, wood chips and wood pellets “Final Report” - 18-06-2013
Figure 22: Wood pellet supply available for export under IEA Bioenergy’s ‘high import scenario’ (Cocchi, et al. 2011).

53 | Analysis of biomass prices, future Danish prices for straw, wood chips and wood pellets “Final Report” - 18-06-2013
7 Methods and models for analysing future bi-omass prices
7.1 Overview of recent studies of price development for bio-mass
Despite increasing interest in bioenergy, and solid biomass as one of the
means of achieving this goal, attempts to project future prices of solid bio-
mass fuels are still relatively few and far in between. Moreover, there is cer-
tain variability in terms of the approaches used (and more importantly yet,
the results obtained). In the following section an overview is given of the most
important recent biomass future price estimation studies from a methodologi-
cal perspective, followed by an overview of their respective results.
Models used for analysing biomass prices
Key models, approaches and methodologies deployed in the most important
recent biomass price estimation studies are described below.
Cost-of-supply approach has its roots in the assumption that production costs
are the main drivers for solid biomass fuel prices. In a study carried out for the
UK’s Department of Energy and Climate Change by E4tech, biomass prices to
be paid by the UK heat and electricity sectors in 2010 and 2020 were esti-
mated. Figure 23 provides a schematic of a supply cost curve estimation pro-
cess for wood chips imported into the UK heat sector.
Figure 23: Supply cost curve estimation approach for imported wood chips. Source: E4tech (2010).
Cost-of-supply approach has also been used in a previous biomass price prog-
nosis report by the Danish Energy Authority in the report Opdatering af sam-
fundsekønomiske brændselspriser – Biomasse (EA Energianalyse and Wazee
2011).
Finally, an analysis jointly carried out by the European Climate Foundation,
Sveaskog, Södra and Vattenfall (Sveaskog, et al. 2010) has also applied a modi-
fication of cost-of-supply approach in order to assess the cost competitiveness
of biomass as a fuel for heat and power production. The approach deployed in
this report is specific in terms of its focus on cost improvement potential
across the whole value chain of biomass, from feedstock production to com-
bustion processes, as illustrated in Figure 24.
Cost-of-supply approach

54 | Analysis of biomass prices, future Danish prices for straw, wood chips and wood pellets “Final Report” - 18-06-2013
Figure 24: An example of optimised global supply chain. Cost-of-supply approach, cost improve-ment potential focus across the entire value chain of biomass. Source: Sveaskog et al. (2010).
Being a part of the Biomass Futures project, the Atlas of biomass potentials
study derives cost-supply curves at national and EU levels for 2020 and 2030
according to 2 different future scenarios. As a starting point, biomass poten-
tials for 2020 and 2030 are quantified based on region-specific data on pre-
sent technically feasible biomass potentials and various forecasting methodol-
ogies depending on the feedstock. E.g. a methodology developed by the Joint
Research Centre has been used to estimate sustainable straw potential,
whereas woody biomass potentials have been estimated using the EFISCEN
model. Next, cost estimates for the different types of feedstock are estimated
based on competing uses, costs of production, yielding and transport. The ob-
tained biomass supply potentials and cost estimates are then synthesised into
cost-supply curves (Elbersen, et al. 2012).
World Energy Model (WEM) is the underlying tool for the International Energy
Agency’s World Energy Outlook analysis (IEA 2012). The outline of the model
is presented in Figure 25.
Atlas of EU biomass po-
tentials by Biomass Fu-
tures project
World Energy Model by
IEA
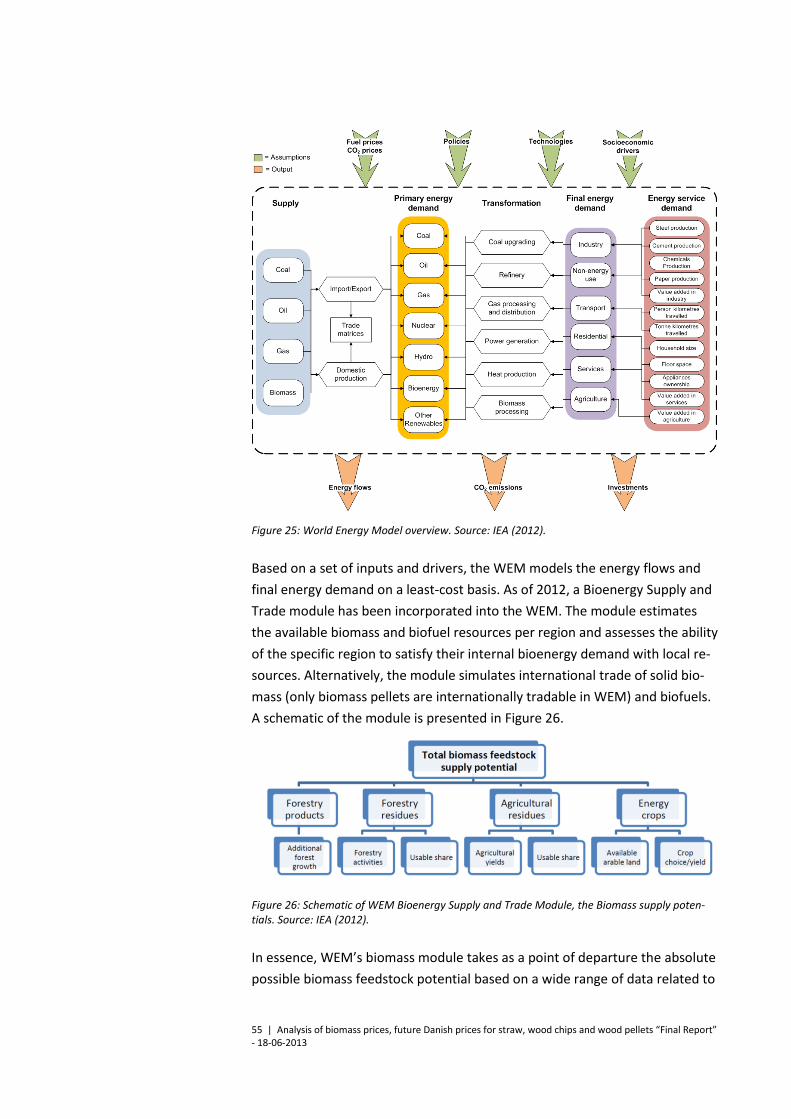
55 | Analysis of biomass prices, future Danish prices for straw, wood chips and wood pellets “Final Report” - 18-06-2013
Figure 25: World Energy Model overview. Source: IEA (2012).
Based on a set of inputs and drivers, the WEM models the energy flows and
final energy demand on a least-cost basis. As of 2012, a Bioenergy Supply and
Trade module has been incorporated into the WEM. The module estimates
the available biomass and biofuel resources per region and assesses the ability
of the specific region to satisfy their internal bioenergy demand with local re-
sources. Alternatively, the module simulates international trade of solid bio-
mass (only biomass pellets are internationally tradable in WEM) and biofuels.
A schematic of the module is presented in Figure 26.
Figure 26: Schematic of WEM Bioenergy Supply and Trade Module, the Biomass supply poten-tials. Source: IEA (2012).
In essence, WEM’s biomass module takes as a point of departure the absolute
possible biomass feedstock potential based on a wide range of data related to
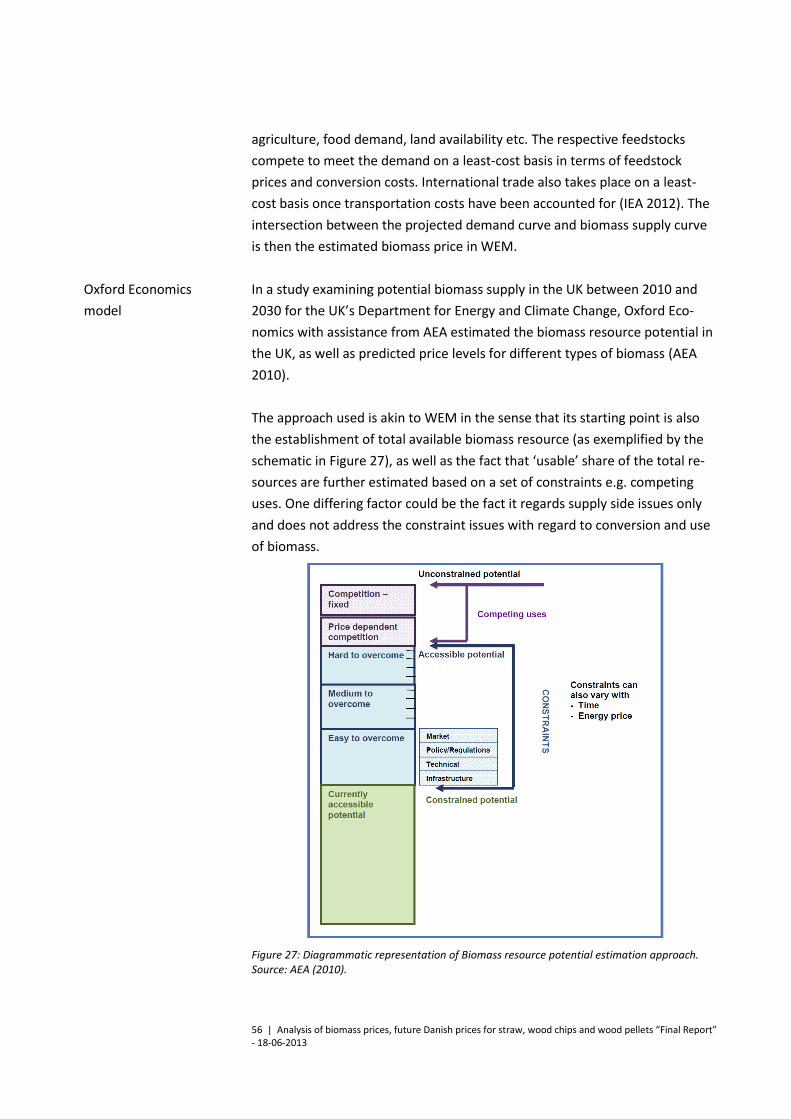
56 | Analysis of biomass prices, future Danish prices for straw, wood chips and wood pellets “Final Report” - 18-06-2013
agriculture, food demand, land availability etc. The respective feedstocks
compete to meet the demand on a least-cost basis in terms of feedstock
prices and conversion costs. International trade also takes place on a least-
cost basis once transportation costs have been accounted for (IEA 2012). The
intersection between the projected demand curve and biomass supply curve
is then the estimated biomass price in WEM.
In a study examining potential biomass supply in the UK between 2010 and
2030 for the UK’s Department for Energy and Climate Change, Oxford Eco-
nomics with assistance from AEA estimated the biomass resource potential in
the UK, as well as predicted price levels for different types of biomass (AEA
2010).
The approach used is akin to WEM in the sense that its starting point is also
the establishment of total available biomass resource (as exemplified by the
schematic in Figure 27), as well as the fact that ‘usable’ share of the total re-
sources are further estimated based on a set of constraints e.g. competing
uses. One differing factor could be the fact it regards supply side issues only
and does not address the constraint issues with regard to conversion and use
of biomass.
Figure 27: Diagrammatic representation of Biomass resource potential estimation approach. Source: AEA (2010).
Oxford Economics
model

57 | Analysis of biomass prices, future Danish prices for straw, wood chips and wood pellets “Final Report” - 18-06-2013
The pricing model developed by Oxford Economics (outlined in Figure 28) as-
sumes that the prices of the biomass fuels are primarily determined by the
price of the underlying feedstock, which in turn is determined by the supply of
the feedstock, by the respective demand (both energy and non-energy), as
well as prices of other energy sources.
Figure 28: Schematic representation of the Oxford Economics Bioenergy pricing model. Source: AEA (2010).
One key difference of the model as compared to e.g. WEM is that it does not
involve full supply-cost curves. Instead, it chooses certain price levels for bio-
mass resources and estimates the biomass resource available at the given
price levels.
PRIMES Biomass Model (PBM) is a model created by E3Mlab/ICCS of the Na-
tional Technical University of Athens and has been used to evaluate the eco-
nomics of supply of biomass and waste for energy purposes as a part of the
Biomass Futures project (Apostolaki, et al. 2012). Like WEM, PBM tries to opti-
mise the utilisation of available biomass resources to satisfy a certain demand.
Future energy demand in PBM is obtained either from PRIMES base model, or
derived from National Renewable Energy Action Plans. Also, like WEM, PBM
models biomass production pathways using inputs on land availability, crop
yields and conversion technologies. In contrast to WEM, though, PBM is
mostly focusing on the EU region, and international trade is modelled only on
main biomass trade routes, e.g. CIS and North America to Europe for woody
biomass, Brazil to Europe for bio-ethanol, etc.
In the study “Global and regional potential for bioenergy from agricultural and
forestry residue biomass” maximum sustainable amount of energy potentially
available from agricultural and forestry residues has been estimated.
PRIMES Biomass Model
GCAM

58 | Analysis of biomass prices, future Danish prices for straw, wood chips and wood pellets “Final Report” - 18-06-2013
The approach entails two parts. First, the maximum available sustainable sup-
ply of biomass residue is estimated based on crop and forestry production sta-
tistics and crop-specific parameters (input obtained from the Food and Agri-
culture Organization of the United Nations database) as well as accounting for
the requirement of soil loss mitigation and soil nutrient preservation. Sec-
ondly, using an integrated assessment model, a market is simulated to esti-
mate the fraction of the maximum sustainable supply of residue biomass that
would be collected and utilised for 14 aggregated regions of the world all the
way up to 2095.
The economics of harvesting residue biomass is simulated using data gener-
ated for the EIA NEMS (Energy Information Administration National Energy
Modeling System), a model developed by the US Department of Energy to
forecast US energy markets (supply, demand, prices, etc.) in order to inform
energy policy decisions. For each region, the model estimates GDP based on
assumptions about labour productivity and then estimates energy demand by
end use. The model is designed to simulate, under various carbon markets,
the integrated interactions between energy production (coal, petroleum, nat-
ural gas, nuclear, solar, geothermal, hydro, wind, biomass, and future exotic
energy sources), energy transformation (e.g., refining, electricity production,
hydrogen production), energy end use (buildings, industry, transportation),
agricultural production (corn, wheat, rice, other grains, oil crops, sugar crops,
fiber crops, fodder crops, miscellaneous, and biomass crops), forestry and
forest production (both for managed and unmanaged forestland), rangeland
and animal production, as well as land allocation dynamics (Gregg og Smith
2010). An overview of agriculture and land use model structure in GCAM is
presented in Figure 29.
Figure 29: Agriculture and land use model structure of GCAM. Source: Kim (2010).

59 | Analysis of biomass prices, future Danish prices for straw, wood chips and wood pellets “Final Report” - 18-06-2013
Pöyry Management Consulting have developed a model that forecasts future
wood pellet price development by constructing forward supply and demand
curves based on data on power plants, pellet mills and assumptions on future
markets and regulatory environment (O'Carroll 2012). An overview of supply
and demand factors deployed in the model is presented in Figure 30.
Figure 30: An overview of supply and demand factors underlying Pöyry Management Consult-ing's pellet pricing model. Source: O'Carroll (2012)
The key demand and supply factors are then quantified and incorporated into
the model to construct demand (see Figure 31 for demand model structure)
and supply curves (see Figure 32) respectively.
Figure 31: Model structure for Demand of the Pöyry Management Consulting's pellet pricing model. Source: O'Carroll (2012).
Pöyry’s pellet pricing
model

60 | Analysis of biomass prices, future Danish prices for straw, wood chips and wood pellets “Final Report” - 18-06-2013
Figure 32: Model structure for Supply of the Pöyry Management Consulting's pellet pricing model. Source: O'Carroll (2012).
Arguably the key differentiating factor distinguishing Pöyry’s approach from
most other observed models is the fact that Pöyry’s model does not consider
supply factors at the top of the biomass supply chain e.g. the total volume of
theoretically / technically feasible global / regional biomass resource. Instead,
the supply focus has been shifted further up the value chain to points of pro-
cessing of biomass (i.e. the pellet mills) and respectively matched by specific
focus on points of demand (i.e. power plants).
Biomass price projections: overview of estimates in prior analyses
In the following section an overview is given of the key assumptions and re-
sults of the most important recent biomass future price estimation studies.
Sveaskog/Vattenfall – Biomass for heat and power
Not a forecast. Instead, an aggressive European supply mobilisation sce-
nario for 2020 estimating how much supply Europe could mobilise by
2020 if European countries set the ambition to utilise this resource to the
furthest extent possible, given sustainability constraints.
Focus on cost, not the price of biomass. Cost defined as the cost accrued
by a fully backwards-integrated power or heat producer (Sveaskog, et al.
2010).
Key assumptions:

61 | Analysis of biomass prices, future Danish prices for straw, wood chips and wood pellets “Final Report” - 18-06-2013
Figure 33: Cost reduction potential for biomass fuel delivered to power and heat plants in conti-nental Europe. Source: Sveaskog et al (2010).
Pöyry – Biomass pellet prices
‘High scenario’ for 2015 being modelled, entailing high pellet demand and
high paying capability (driven by high coal, power and carbon prices and
high level of conversion and co-firing) as well as highest supply costs
(driven by higher transportation costs, indexed to high oil price).
Forward supply and demand curves are being modelled, each point on the
curves representing an individual pellet mill or power plant, respectively
(O'Carroll 2012).
Figure 34: Pöyry future pellet price High Scenario for 2015. Source: O'Carroll (2012).
Results:
Key assumptions:
Results:

62 | Analysis of biomass prices, future Danish prices for straw, wood chips and wood pellets “Final Report” - 18-06-2013
Biomass Futures – Atlas of EU Biomass potentials
Cost estimates for biomass as it is received at the gate of the conversion /
pre-treatment plant are made. The projections are made for 2020 and
2030 according to the Reference scenario and the Sustainability scenario
for each year.
In the Reference scenario GHG mitigation requirement (50% as compared
to fossil fuels) as well as limitations on the use of biomass from biodiverse
land or land with high carbon stock are only applied to biofuels and bioliq-
uids consumed in the EU. In the Sustainability scenario all the limitations
above (which are moreover applied in a stricter form, e.g. 70 % GHG miti-
gation requirement for biofuels as well as bioelectricty and heat in 2020
and 80% in 2030, respectively) apply to all bioenergy consumed in the EU,
as well as GHG mitigation requirement includes compensation for indirect
land use changes (Elbersen, et al. 2012).
Table 16: Biomass Futures project, Atlas of EU biomass potentials results. Overview of biomass potential (MTOE) per price class for 2020 and 2030 in the Reference and Sustainability scenarios for EU-27. Source: Elbersen et al (2012).
Biomass Futures – PRIMES biomass model projections
Consumer prices of the final biomass products used for energy purposes
are modelled based on 4 different scenarios.
Reference scenario assumes the implementation of the entire EU Climate
and Energy package for 2020 and successful implementation of all policies
adopted by the EU until March 2010. Reference NREAP scenario updates
the demand side of the Reference scenario so that it would be in line with
the set-up set forth in NREAPs. Decarbonisation scenario assumes compli-
ance with the EU long-term target of 80% GHG emission reduction in the
EU by 2050. Sustainability scenario models tightening of sustainability re-
quirements in line with the EU’s fuel quality directive (EC 2009). Maximum
biomass scenario assumes all biomass potential as available and maxim-
ises bioenergy demand (Apostolaki, et al. 2012).
Key assumptions:
Results:
Key assumptions:

63 | Analysis of biomass prices, future Danish prices for straw, wood chips and wood pellets “Final Report” - 18-06-2013
Scenario 2020 2030 2050
Small-scale solid biomass (mainly pellets), EUR / toe
Reference 645 818 844
Reference NREAP 680 812 844
Decarbonisation 688 901 1022
Sustainability 742 957 1032
Maximum biomass 691 917 1052
Table 17: Commodity price estimates of small-scale solid woody biomass for 2020, 2030 and 2050 as per Biomass Futures - PRIMES biomass model projections, EUR/toe. Source: Apostolaki et al (2012).
Scenario 2020 2030 2050
Large-scale solid (woody biomass for use in power generation), EUR / toe
Reference 625 636 558
Reference NREAP 662 708 594
Decarbonisation 651 649 585
Sustainability 648 707 605
Maximum biomass 657 684 631
Table 18: Commodity price estimates of large-scale solid woody biomass for 2020, 2030 and 2050 as per Biomass Futures - PRIMES biomass model projections, EUR/toe. Source: Apostolaki et al (2012).
Danish Energy Authority – Socio-economic biomass price prognosis
Price-at-power plant among others has been estimated for a range of
solid biomass types.
It was set forth that biomass prices in Denmark will increasingly be de-
pendent on international price developments as opposed to variations in
Danish demand. The price projections were mainly based on future pro-
duction costs estimates combined with expectations in terms of relevant
transportation cost developments (Energistyrelsen 2012).
Results:
Key assumptions:

64 | Analysis of biomass prices, future Danish prices for straw, wood chips and wood pellets “Final Report” - 18-06-2013
2011 DKK/GJ Straw Wood chips Wood pellets
(industrial)
2012 41.5 47.3 70.2
2013 41.8 47.8 70.8
2014 42.1 48.4 71.3
2015 42.3 48.9 71.8
2016 42.6 49.5 72.3
2017 42.9 50.1 72.9
2018 43.2 50.6 73.4
2019 43.5 51.2 73.9
2020 43.8 51.8 74.4
2021 44.1 52.4 75.0
2022 44.4 53.0 75.5
2023 44.7 53.7 76.0
2024 45.1 54.3 76.5
2025 45.4 54.9 77.0
2026 45.7 55.6 77.6
2027 46.0 56.3 78.1
2028 46.3 56.9 78.6
2029 46.7 57.6 79.1
2030 47.0 58.3 79.7
2031 47.3 59.0 80.2
2032 47.7 59.7 80.7
2033 48.0 60.4 81.2
2034 48.4 61.2 81.8
2035 48.7 61.9 82.3
Table 19: Socio-economic biomass price prognosis (price-at-power plant) by the Danish Energy Authority. Source: Energistyrelsen (2012).
IEA Bioenergy Task 40 – Global market for wood pellets and price de-
velopment
Expected price developments for wood pellets until 2015 based on EN-
DEX-Pellet index, Rotterdam.
Market development and price factors assumed include the effect of tor-
refaction technology, increasing demand (based on NREAPs in the EU and
national initiatives in e.g. Japan, South Korea, UK), as well as possible price
increases due to indirect land use change relating to the expected high
sustainability standards (IEA and DTI 2012).
2011 2012 2013 2014 2015
ENDEX wood pellet price, EUR / tonne
Wood pellets 128 132.5 136.8 139.5 142.3
Table 20: Expected price development for wood pellets until 2015 (ENDEX-pellet index, Rotter-dam). Source: IEA and DTI (2012).
Results:
Key assumptions:
Results:
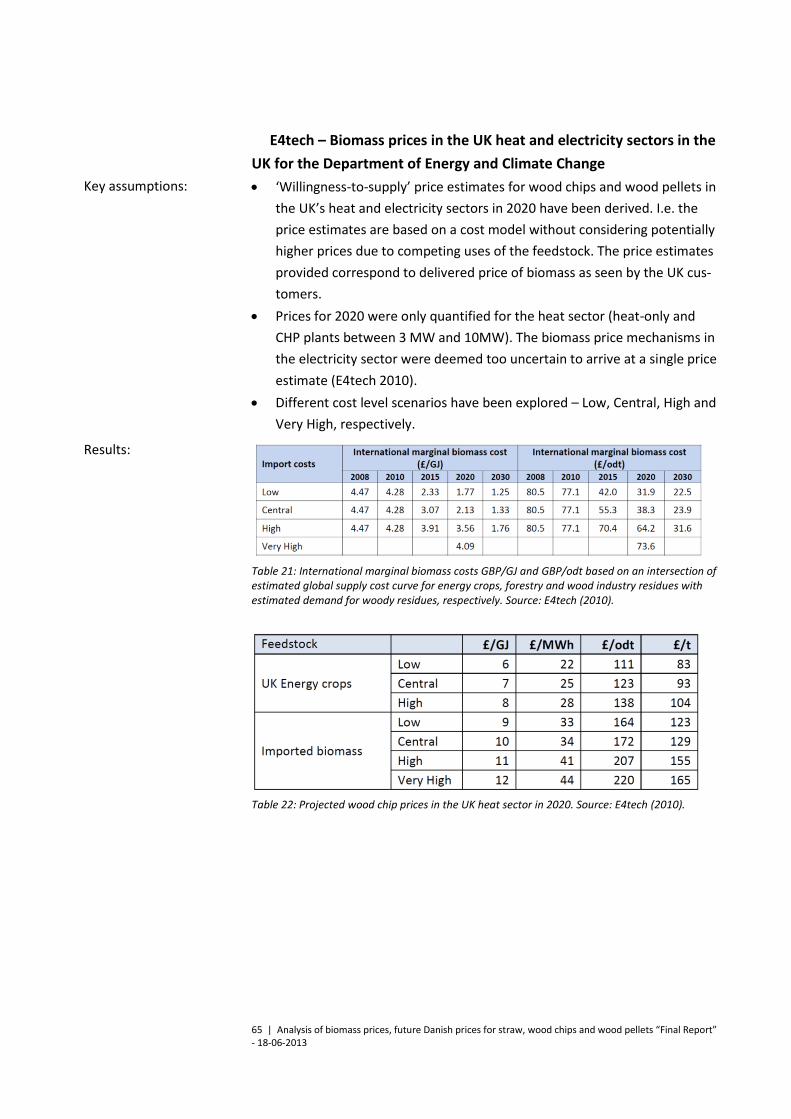
65 | Analysis of biomass prices, future Danish prices for straw, wood chips and wood pellets “Final Report” - 18-06-2013
E4tech – Biomass prices in the UK heat and electricity sectors in the
UK for the Department of Energy and Climate Change
‘Willingness-to-supply’ price estimates for wood chips and wood pellets in
the UK’s heat and electricity sectors in 2020 have been derived. I.e. the
price estimates are based on a cost model without considering potentially
higher prices due to competing uses of the feedstock. The price estimates
provided correspond to delivered price of biomass as seen by the UK cus-
tomers.
Prices for 2020 were only quantified for the heat sector (heat-only and
CHP plants between 3 MW and 10MW). The biomass price mechanisms in
the electricity sector were deemed too uncertain to arrive at a single price
estimate (E4tech 2010).
Different cost level scenarios have been explored – Low, Central, High and
Very High, respectively.
Table 21: International marginal biomass costs GBP/GJ and GBP/odt based on an intersection of estimated global supply cost curve for energy crops, forestry and wood industry residues with estimated demand for woody residues, respectively. Source: E4tech (2010).
Table 22: Projected wood chip prices in the UK heat sector in 2020. Source: E4tech (2010).
Key assumptions:
Results:

66 | Analysis of biomass prices, future Danish prices for straw, wood chips and wood pellets “Final Report” - 18-06-2013
Table 23: Projected wood pellet prices in the UK heat sector in 2020. Source: E4tech (2010).
AEA and Oxford Economics – UK and Global Bioenergy resource
Prices of internationally traded wood chips and wood pellets to 2030 have
been estimated. Wood pellet prices are related to use in the heat sector.
Wood chip price estimates are provided both for industrial/commercial
heat and domestic heat users. Large scale electricity sector is not a part of
this price estimation due to its reliance on large bilateral agreements.
Price projections have been made for 3 different scenarios. Central – busi-
ness-as-usual scenario for global biomass supply, Low – a scenario of
weaker economic growth and lower energy prices, as well as less invest-
ment in biomass supply and hence lower level of biomass supply, High – a
scenario of stronger global economic growth and higher energy prices, as
well as more investment in biomass supply (AEA 2010).
Table 24: Bioenergy price projections for wood chips (GBP/GJ) 2010 prices. Source: AEA (2010).
Key assumptions:
Results:

67 | Analysis of biomass prices, future Danish prices for straw, wood chips and wood pellets “Final Report” - 18-06-2013
Table 25: Bioenergy price projections for wood pellets (GBP/GJ) 2010 prices. Source: AEA (2010).
GCAM – Global and regional potential for bioenergy from agricul-
tural and forestry residue biomass
The global price for residue biomass is estimated based on total energy
demand and the prices for competing sources of energy (Gregg og Smith
2010).
Two climate policy scenarios are modelled – Reference (with no carbon
price) and Policy (where 450 mm atmospheric concentration of CO2 by the
end of century is reached). In addition, the impact of variation in crop
yields on biomass price is modelled (Default – modest increases in crop
yields in line with historic averages, Low – no increase in yield rates, High
– double yield rates in the next century) as well as impact of variation in
the average costs of collecting, processing and delivering biomass (Mid-
price Default – base value, Midprice Low – 50% of the base value, Mid-
price High – 200% of the base value).
Figure 35: Projected biomass total resource and price for different agricultural productivity sce-narios across Reference and Policy climate scenarios. Source: Gregg and Smith (2010).
Key assumptions:
Results:
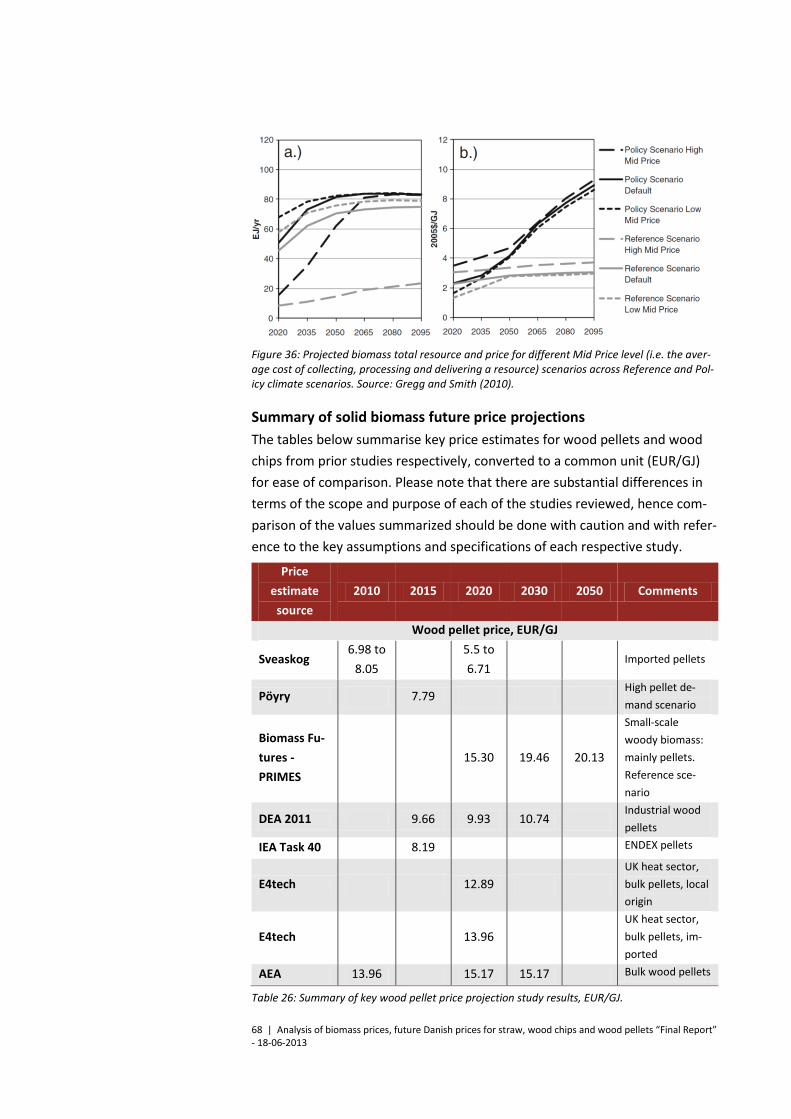
68 | Analysis of biomass prices, future Danish prices for straw, wood chips and wood pellets “Final Report” - 18-06-2013
Figure 36: Projected biomass total resource and price for different Mid Price level (i.e. the aver-age cost of collecting, processing and delivering a resource) scenarios across Reference and Pol-icy climate scenarios. Source: Gregg and Smith (2010).
Summary of solid biomass future price projections
The tables below summarise key price estimates for wood pellets and wood
chips from prior studies respectively, converted to a common unit (EUR/GJ)
for ease of comparison. Please note that there are substantial differences in
terms of the scope and purpose of each of the studies reviewed, hence com-
parison of the values summarized should be done with caution and with refer-
ence to the key assumptions and specifications of each respective study.
Price
estimate
source
2010 2015 2020 2030 2050 Comments
Wood pellet price, EUR/GJ
Sveaskog 6.98 to
8.05
5.5 to
6.71 Imported pellets
Pöyry 7.79 High pellet de-
mand scenario
Biomass Fu-
tures -
PRIMES
15.30 19.46 20.13
Small-scale
woody biomass:
mainly pellets.
Reference sce-
nario
DEA 2011 9.66 9.93 10.74 Industrial wood
pellets
IEA Task 40 8.19 ENDEX pellets
E4tech 12.89 UK heat sector,
bulk pellets, local
origin
E4tech 13.96 UK heat sector,
bulk pellets, im-
ported
AEA 13.96 15.17 15.17 Bulk wood pellets
Table 26: Summary of key wood pellet price projection study results, EUR/GJ.

69 | Analysis of biomass prices, future Danish prices for straw, wood chips and wood pellets “Final Report” - 18-06-2013
Price
estimate
source
2010 2015 2020 2030 2050 Comments
Wood chip price, EUR/GJ
Sveaskog 3.89 to
6.17
2.82 to
4.97
Wood chips from
local energy
crops
Sveaskog 6.44 to
7.52
6.17 to
7.52
Wood chips from
Scandinavian for-
est residues
DEA 2011 6.58 6.98 7.79
E4tech 8.19 UK heat sector,
UK energy crops
E4tech 11.68
UK heat sector,
imported bio-
mass
AEA 6.98 6.98 6.98
Industrial wood
chips, Central
scenario
Table 27: Summary of key wood chip price projection study results, EUR/GJ.

70 | Analysis of biomass prices, future Danish prices for straw, wood chips and wood pellets “Final Report” - 18-06-2013
8 Description of model used in this study: GCAM
8.1 Description of GCAM
The Global Change Assessment Model (GCAM) is one of the premier inte-
grated assessment models (IAMs) used for economic, technological, and pol-
icy analysis. GCAM began in 1975 under the name MiniCAM (Mini Climate As-
sessment Model), and has since been used in every Intergovernmental Panel
on Climate Change (IPCC) assessment report, and is one of four IAMs chosen
to develop the new representative concentration pathways (RCPs) for future
anthropogenic CO2 emissions in the fifth assessment report. GCAM has also
been one of the IAMs used in the Climate Change Science Program (CCSP) and
the Climate Change Technology Program (CCTP), assessments of the Climate
Change Research Initiatives by the US Government. GCAM has also been a
part of every Energy Modeling Forum (EMF), a forum for IAM modeling teams,
climate study.
GCAM is designed as a model to understand the socioeconomic dimension of
global change. It combines an economic energy module, an integrated land
use agroforestry model, and a climate model to assess how these human driv-
ers impact the global environment. GCAM is a partial equilibrium model and
as such it focuses on aggregate human drivers: population demographics, la-
bour productivity, gross domestic product, and the corresponding food, tim-
ber, and energy demands from the industrial, transportation, and buildings
sector for 14 geopolitical regions of the world. The energy system contains re-
source data for all of the major energy sources (petroleum, coal, natural gas,
nuclear, solar, wind, bioenergy, geothermal, hydro, exotic sources) and con-
tains a detailed technology demand representation. The integrated land use
model is a particular strength of GCAM in comparison to many other IAMs
(Table 28) and includes representation of 12 crop types, 6 animal product cat-
egories, forestry, pasture, and biomass crops. While not a detailed Global Cli-
mate Model (GCM), GCAM’s integrated climate module analyses the climatic
effect of energy and land use emissions for 16 different greenhouse gases and
short lived species.
GCAM takes an economic equilibrium approach and solves for all energy and
land markets simultaneously by finding a vector of prices that balance supply
and demand. Markets can be set up as regional, multi-regional, or global, de-
pending on user specifications. The model is dynamic recursive, meaning that
GCAM solves each period in a stepwise fashion, and then takes the solution
71 | Analysis of biomass prices, future Danish prices for straw, wood chips and wood pellets “Final Report” - 18-06-2013
from a given period and applies the appropriate initial conditions to the next
time step (Wise og Calvin 2011).
In GCAM, biomass is produced from agroforestry land as purpose grown en-
ergy crops (dedicated plantations), as crop residues (stalks and stover from
agricultural products), forestry residue (slash from timber operations), mill
residue (sawdust and pulping liquors), and municipal solid waste. Biomass
crops compete with other land uses, based on equalising marginal profit rates
against competing land uses. However, GCAM is not winner-take-all, and this
allocation is subject to a share weight function that prescribes the ease at
which land can be converted from one use to another. Furthermore, food de-
mand is relatively inelastic and crop yields are fixed within each region for
each crop for a given time step and by default is based on estimates produced
by the Food and Agriculture Organisation (FAO) (Bruinsma 2009). All biomass
crops are aggregated into one generic energy crop in the version of GCAM
employed in this study, GCAM-DTU. Agroforestry residues are a by-product of
other activities, namely food and forestry, and the amount of residue biomass
harvested (the proportion of the sustainable technical potential) that enters
the energy stream is a function of the equilibrium price for the biomass mar-
ket. The sustainability constraint requires a portion of the residue to remain
on the land to retain soil nutrient levels and to reduce soil loss through ero-
sion. Production of municipal solid waste is estimated via a function of the per
capita GDP for each region at each time step.
Biomass is on a global market in GCAM, and though interregional trade is not
explicitly modelled, the supply of biomass is considered a global resource
from which all regional demand is met. The equilibrium price represents the
average cost of production for biomass, including collection and aggregation
(per crop variable costs, which in essence set a price floor for production), and
marginal land rent (with the exception of conversion of unmanaged land,
which does not produce a product, and in such cases the average land value is
used). Variation in profit is due to variation in cost of production: As the area
devoted to one land use expands, cost increases. In the case of a climate pol-
icy where there is a price on carbon emissions, then emissions associated with
land use change and conversion are also included in the biomass price, based
on the difference of the estimated carbon stocks within the different land
classes (Wise og Calvin 2011).
It should, however, be noted that the version of GCAM employed in this
study, GCAM-DTU, does not include cost of land use change. I.e. should a

72 | Analysis of biomass prices, future Danish prices for straw, wood chips and wood pellets “Final Report” - 18-06-2013
switch in land use from e.g. forest to agricultural land be modelled for a given
area, there would be no cost associated with this switch per se. As such, it
represents a departure from reality (as in practice there would be possibly sig-
nificant costs associated with turning a forest into agricultural land, e.g. defor-
estation, soil preparation etc.) and allows for too extensive land use changes
than one would expect in reality.
GCAM assumes a perfect market in its equilibrium calculations: that is, a free
market, perfect knowledge, and no tariffs, subsides, quotas, mandates or
other market distortions. Trade in GCAM is not modelled explicitly, and while
some goods have transportation costs added, this is done in a simplistic fash-
ion where a flat rate is added; i.e., there is no geographical representation of
transportation distances with trade. For the purposes of this study, we con-
sider only the global biomass price where the GCAM transportation costs are
neglected. Finally, hereafter we refer to the model as GCAM-DTU (GCAM Den-
mark Technical University), which is built on the GCAM 2.0 architecture, but
has slightly more optimistic assumptions on future modernisation of the Afri-
can industrial sector.
8.2 Other economic models of agriculture and land use
In this section a brief overview of other prominent economic models of agri-
culture and land use will be given, as well as their comparison alongside
GCAM-DTU across critical model characteristics. Table 28 summarises the key
models and provides an overview of their respective critical attributes.
Model Regional
Scope
Number
of Land
Regions
Economic
Sector
Scope
Land Type
Coverage
Crop
Production
Modelling
Economic
Solution
Approach
Time
Horizon
FASOM
US
(curves
non-US)
60 Ag. &
Forest
Crop, Pas-
ture, Comm.
Forest
Discrete
Crop Tech-
nologies
Constrained
Optimisation 100 years
Polysys US 300 Ag. Crop, Pasture
Discrete
Crop Tech-
nologies
Constrained
Optimisation 20 years
GLOBIOM Global 27 Ag. &
Forest
Crop, Pas-
ture, Comm.
Forest
Discrete
Crop Tech-
nologies
Constrained
Optimisation 30+ years
GTAP Global 117+ Everything
Crop, Pas-
ture, Comm.
Forest
Economic
Production
Functions
General Equi-
librium Static
FAPRI Global dozens Ag. Non-spatial Economic
Equations
Market Equi-
librium 10+ years
GCAM 3.0 Global 151+
Ag.,
Forest,
Energy
All
Discrete
Crop Tech-
nologies
Market Equi-
librium
100+
years
Table 28: Comparison of most prominent economic models of agriculture and land use across key attributes. Source: Wise and Calvin (2011)

73 | Analysis of biomass prices, future Danish prices for straw, wood chips and wood pellets “Final Report” - 18-06-2013
Overall, given the specifics of the research question underlying the current re-
port, one can argue that GCAM-DTU is one of the best fits based on several of
the critical attributes. First of all, regional scope should be global given the
fact that the main area of investigation is Denmark and prospective global bio-
mass import flows should also be considered. Secondly, given the energy in-
dustry focus, it is imperative that the model deployed would have the capabil-
ity of reflecting energy industry and economic interrelations therein. Finally,
the time horizon covered by the model should be sufficient to provide an esti-
mate for 2050. High resolution of regional difference representation and
broad land type coverage are additional factors that should enhance the rela-
tive accuracy of the GCAM-DTU results.
8.3 Scenarios
Eight scenarios were run for the analysis. The first, a reference scenario, is the
default assumptions of GCAM-DTU: no climate policy, FAO future diet and
yield projections. Two climate policy scenarios were run, the RCP 4.5, a global
carbon policy that stabilises the climate at 4.5 W/m2 radiative forcing, equiva-
lent to an atmospheric concentration of about 525 ppm CO2 and roughly 2.5o
C warming by 2100. The price path is seen in Figure 37 below. A regional pol-
icy was also considered, with the same prices in RCP 4.5, but in contrast to the
RCP 4.5, the market included only the developed regions (US, Canada, West-
ern Europe, Eastern Europe, Former Soviet Union, Australia/New Zealand, Ja-
pan, and South Korea).
Figure 37: Carbon price for RCP 4.5. The price is defined by a global carbon cap and trade system designed to stabilise the greenhouse gas concentration by 2100 such that the radiative forcing is 4.5 W/m2 above preindustrial times. The same price path is used in the regional policy, but only applied to develop regions of the world.
0
10
20
30
40
50
60
2020 2025 2030 2035 2040 2045 2050
20
12
$/
ton
ne
CO
2
Carbon Price RCP 4.5

74 | Analysis of biomass prices, future Danish prices for straw, wood chips and wood pellets “Final Report” - 18-06-2013
One of the major input assumptions is the FAO assumption for future yield
from (Bruinsma 2009). This scenario has generally increasing crop yields
(based on historic levels) to 2050, specific to each region and each crop. The
High Yield scenario is even more optimistic about future agricultural technolo-
gies to improve global crop yields. The Low Yield scenario is a pessimistic case
where there are no regional crop specific yield improvements beyond 2005.
These are summarised for the world’s three major grains (maize, wheat, and
rice) weighted by global calorie output per unit of planted land in Figure 38.
Note, that even in the reference scenario, global average crop yields will de-
cline as the production moves to areas of the world and land types with lower
yields. Furthermore, while yield improvements are assumed in biomass plan-
tations, no yield improvements are assumed for roundwood production in the
forestry sector in any scenario.
Figure 38: Global crop yield projections for three scenarios, weighted by calorific output per unit of land.
Finally, three additional diet scenarios were considered in addition to the ref-
erence scenario. First, a constant diet is run, where the current regional per
capita caloric intake is projected into the future. Second, a western diet sce-
nario is run, where the world evolves to diet similar to that of US, Canada,
Western Europe and Australia/New Zealand by 2100. This diet is approxi-
mately 3700 kcal/cap/day, of which about 35% comes from animal products.
Finally, a vegetarian diet is considered, where the world evolves to a diet pat-
terned off of the current average diet of India by 2100: about 2500 kcal/cap/
day, 10% of which are from animal products. In these scenarios, the regional
proportional consumption of crops and animal products remains the same
(i.e., the Middle East prefers sheep and goat to pork, etc.); only the relative
0
0.2
0.4
0.6
0.8
1
1.2
1.4
1.6
1.8
20
05
20
10
20
15
20
20
20
25
20
30
20
35
20
40
20
45
20
50
Glo
bal
Yie
ld I
nd
ex
(20
05
= 1
)
Crop Yield ProjectionsFAO Maize
FAO Wheat
FAO Rice
High Yield Maize
High Yield Wheat
High Yield Rice
Low Yield Maize
Low Yield Wheat
Low Yield Rice

75 | Analysis of biomass prices, future Danish prices for straw, wood chips and wood pellets “Final Report” - 18-06-2013
proportion of animal products to vegetal products are scaled. This is done to
keep the cultural aspects of the diets similar, but to evolve them in such a way
that the regions can consume more or less animal products. Also, these diet
scenarios are not considered likely scenarios, but rather demonstrate logical
extremes in order to better understand the effect this parameter has on fu-
ture biomass prices.
In summary, the scenarios are:
1. Reference: A scenario where the default GCAM-DTU assumptions on
future yield and diet and no climate policy
2. RCP 4.5: A scenario with an ambitious global climate policy designed
to stabilise the climate at 4.5 W/m2 radiative forcing
3. Regional Policy: a scenario with a partial participation climate policy,
where only the developed regions of the world see a carbon price;
emissions are free in developing regions
4. High Yield: a scenario with optimistic improvements in future crop
yields
5. Low Yield: a pessimistic scenario where there are no future crop yield
improvements
6. Current Diet: a scenario where the per capita calorific consumption
for each food type in each region is held constant through time and
population is the only driver for changing food demand
7. Western Diet: a scenario where the world evolves to the current west-
ern diet (in terms of animal product proportions and total calorific in-
take)
8. Vegetarian Diet: a scenario where the world evolves to the current In-
dian diet (in terms of animal product proportions and total calorific in-
take).
8.4 GCAM-DTU Results
The presence of a climate policy, particularly a global policy, encourages more
biomass crops to be grown and a greater proportion of the crop residues to
be collected. Compare Figure 39 and Figure 40, where the total bioenergy
supplied to the market increases from around 90 EJ/yr. in 2050 to over 140
EJ/yr. in 2050. The regional policy falls in between these two extremes.

76 | Analysis of biomass prices, future Danish prices for straw, wood chips and wood pellets “Final Report” - 18-06-2013
Figure 39: Global biomass supplied to the market under a no policy scenario.
Figure 40: Global biomass supplied to the market under a RCP 4.5 scenario.
Yield assumptions did not have much effect on biomass supply, varying be-
tween 91 to 106 EJ/yr. by 2050 for the low yield and high yields respectively.
These did make large difference for land use, however, where low yield as-
sumptions caused a large expansion of crop land (Figure 41), where nearly
0
20
40
60
80
100
120
140
2005 2010 2015 2020 2025 2030 2035 2040 2045 2050
EJ/y
r
No Policy
biomass crop
Forest
Mill
Corn
Wheat
Rice
OtherGrain
OilCrop
SugarCrop
MiscCrop
MSW
traditional biomass
0
20
40
60
80
100
120
140
2005 2010 2015 2020 2025 2030 2035 2040 2045 2050
EJ/y
r
RCP4.5
biomass crop
Forest
Mill
Corn
Wheat
Rice
OtherGrain
OilCrop
SugarCrop
MiscCrop
MSW
traditional biomass

77 | Analysis of biomass prices, future Danish prices for straw, wood chips and wood pellets “Final Report” - 18-06-2013
half of the world’s arable land is devoted to crop production by 2050 and for-
ests are squeezed out.
Figure 41: Land Use for the low yield scenario.
A similar effect is seen in the Western Diet scenario (Figure 42). In this sce-
nario, even more land is dedicated to crop production than the low yield sce-
nario, and approximately half of the world’s forestland is converted to other
uses by 2050. As such, this scenario does not allow much space for dedicated
biomass crops, and nearly the entire supply of biomass (91 EJ/yr.) comes from
residue sources (Figure 43).
Figure 42: Land Use for the Western Diet scenario.
0
1
2
3
4
5
6
7
8
9
10
11
12
13
2005 2010 2015 2020 2025 2030 2035 2040 2045 2050
Gh
a
Low YieldNon Arable Land
Forest
Shrubland
Pasture
Other Arable Land
Grassland
Cropland
Biomass
0
1
2
3
4
5
6
7
8
9
10
11
12
13
2005 2010 2015 2020 2025 2030 2035 2040 2045 2050
Gh
a
Western DietNon Arable Land
Forest
Shrubland
Pasture
Other Arable Land
Grassland
Cropland
Biomass
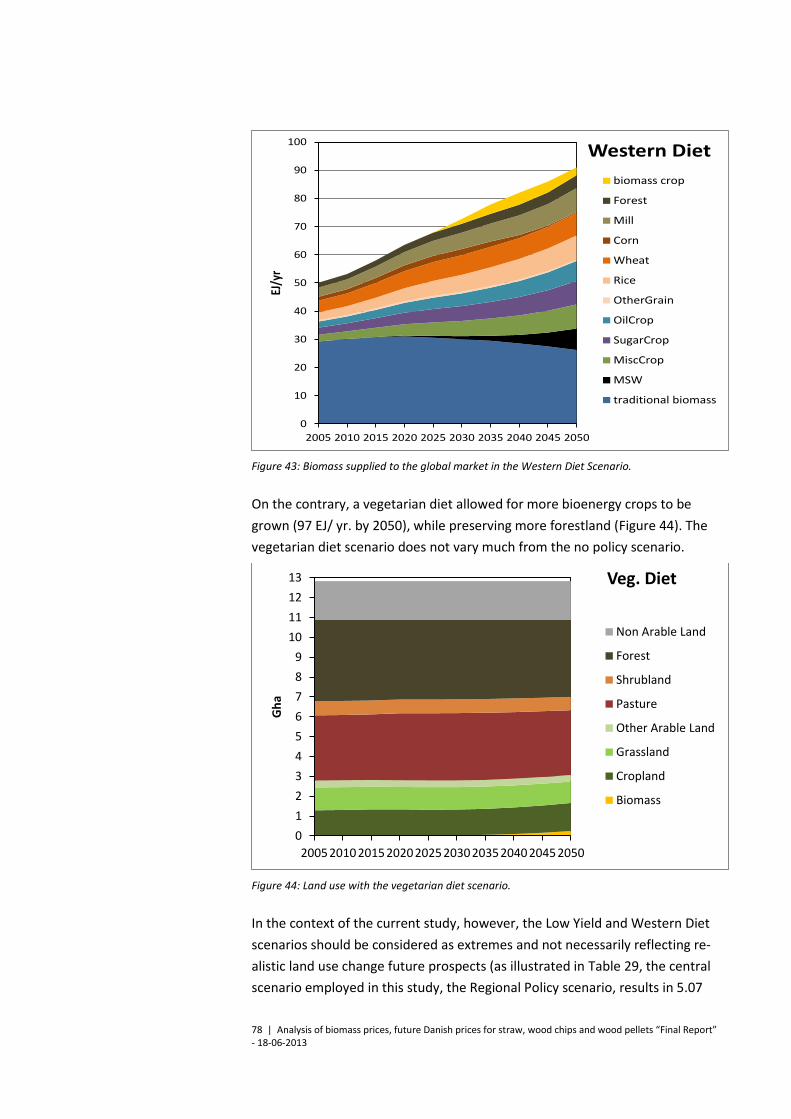
78 | Analysis of biomass prices, future Danish prices for straw, wood chips and wood pellets “Final Report” - 18-06-2013
Figure 43: Biomass supplied to the global market in the Western Diet Scenario.
On the contrary, a vegetarian diet allowed for more bioenergy crops to be
grown (97 EJ/ yr. by 2050), while preserving more forestland (Figure 44). The
vegetarian diet scenario does not vary much from the no policy scenario.
Figure 44: Land use with the vegetarian diet scenario.
In the context of the current study, however, the Low Yield and Western Diet
scenarios should be considered as extremes and not necessarily reflecting re-
alistic land use change future prospects (as illustrated in Table 29, the central
scenario employed in this study, the Regional Policy scenario, results in 5.07
0
10
20
30
40
50
60
70
80
90
100
2005 2010 2015 2020 2025 2030 2035 2040 2045 2050
EJ/y
r
Western Diet
biomass crop
Forest
Mill
Corn
Wheat
Rice
OtherGrain
OilCrop
SugarCrop
MiscCrop
MSW
traditional biomass
0
1
2
3
4
5
6
7
8
9
10
11
12
13
20052010 20152020 20252030 20352040 20452050
Gh
a
Veg. Diet
Non Arable Land
Forest
Shrubland
Pasture
Other Arable Land
Grassland
Cropland
Biomass
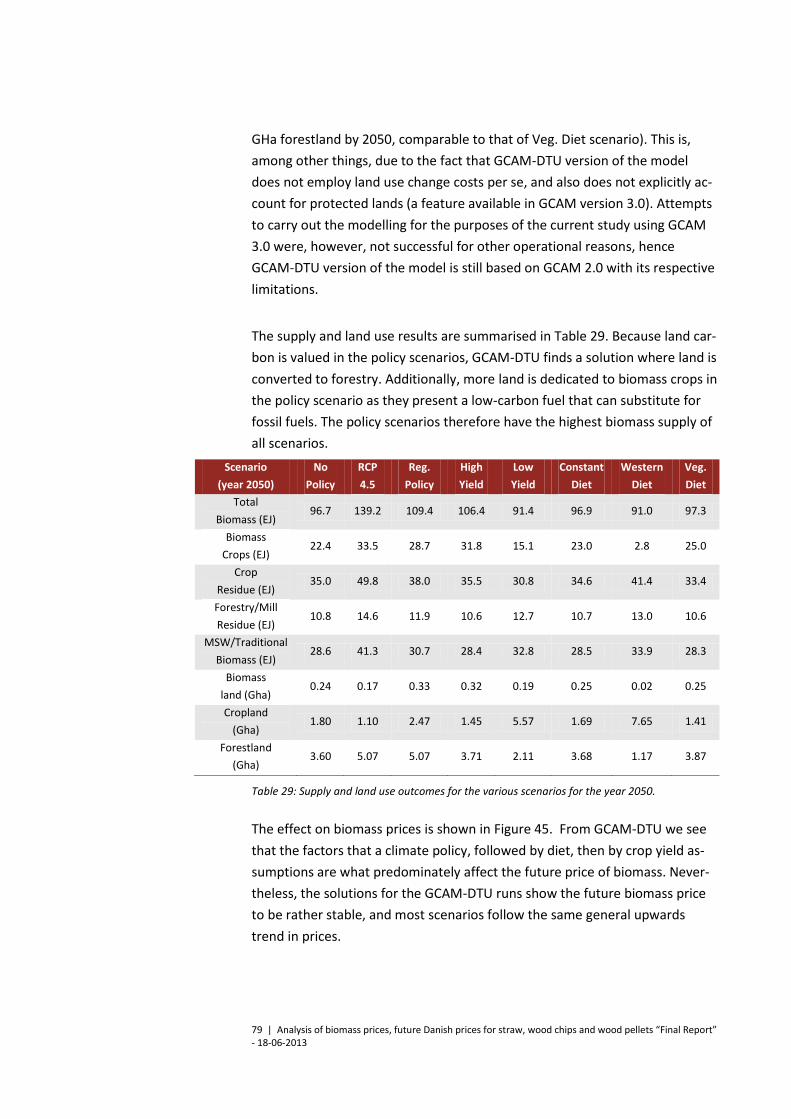
79 | Analysis of biomass prices, future Danish prices for straw, wood chips and wood pellets “Final Report” - 18-06-2013
GHa forestland by 2050, comparable to that of Veg. Diet scenario). This is,
among other things, due to the fact that GCAM-DTU version of the model
does not employ land use change costs per se, and also does not explicitly ac-
count for protected lands (a feature available in GCAM version 3.0). Attempts
to carry out the modelling for the purposes of the current study using GCAM
3.0 were, however, not successful for other operational reasons, hence
GCAM-DTU version of the model is still based on GCAM 2.0 with its respective
limitations.
The supply and land use results are summarised in Table 29. Because land car-
bon is valued in the policy scenarios, GCAM-DTU finds a solution where land is
converted to forestry. Additionally, more land is dedicated to biomass crops in
the policy scenario as they present a low-carbon fuel that can substitute for
fossil fuels. The policy scenarios therefore have the highest biomass supply of
all scenarios.
Scenario
(year 2050)
No
Policy
RCP
4.5
Reg.
Policy
High
Yield
Low
Yield
Constant
Diet
Western
Diet
Veg.
Diet
Total
Biomass (EJ) 96.7 139.2 109.4 106.4 91.4 96.9 91.0 97.3
Biomass
Crops (EJ) 22.4 33.5 28.7 31.8 15.1 23.0 2.8 25.0
Crop
Residue (EJ) 35.0 49.8 38.0 35.5 30.8 34.6 41.4 33.4
Forestry/Mill
Residue (EJ) 10.8 14.6 11.9 10.6 12.7 10.7 13.0 10.6
MSW/Traditional
Biomass (EJ) 28.6 41.3 30.7 28.4 32.8 28.5 33.9 28.3
Biomass
land (Gha) 0.24 0.17 0.33 0.32 0.19 0.25 0.02 0.25
Cropland
(Gha) 1.80 1.10 2.47 1.45 5.57 1.69 7.65 1.41
Forestland
(Gha) 3.60 5.07 5.07 3.71 2.11 3.68 1.17 3.87
Table 29: Supply and land use outcomes for the various scenarios for the year 2050.
The effect on biomass prices is shown in Figure 45. From GCAM-DTU we see
that the factors that a climate policy, followed by diet, then by crop yield as-
sumptions are what predominately affect the future price of biomass. Never-
theless, the solutions for the GCAM-DTU runs show the future biomass price
to be rather stable, and most scenarios follow the same general upwards
trend in prices.
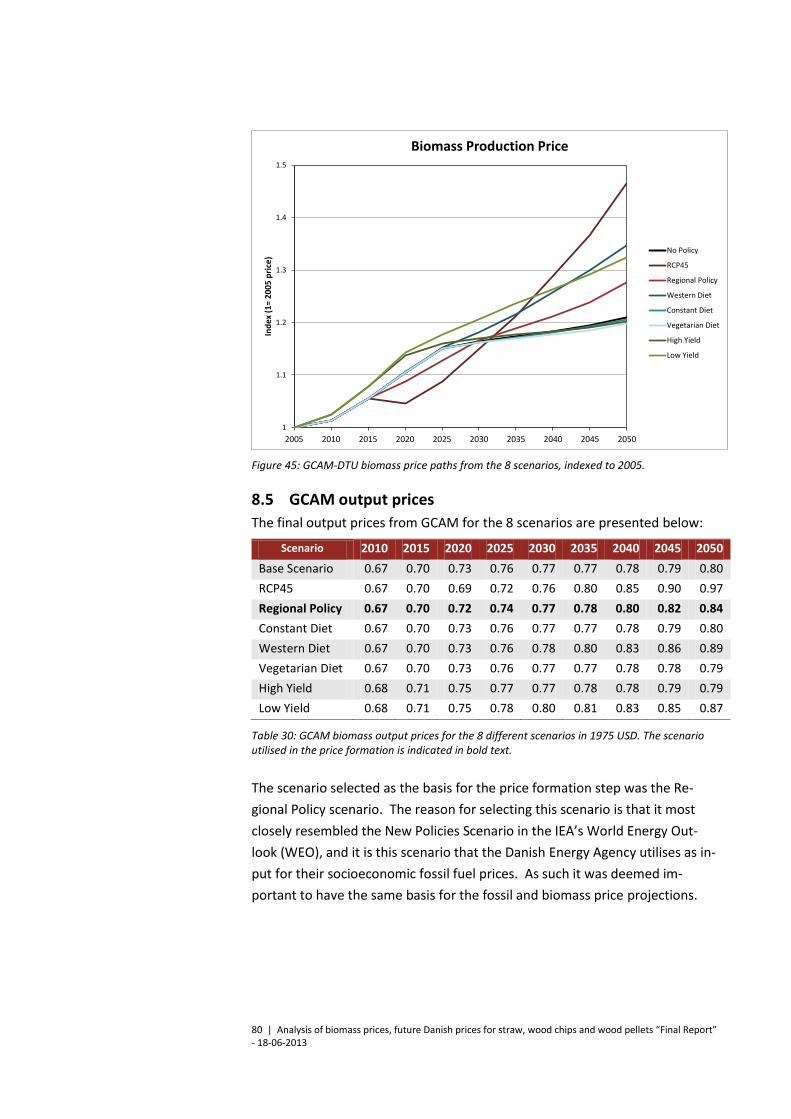
80 | Analysis of biomass prices, future Danish prices for straw, wood chips and wood pellets “Final Report” - 18-06-2013
Figure 45: GCAM-DTU biomass price paths from the 8 scenarios, indexed to 2005.
8.5 GCAM output prices
The final output prices from GCAM for the 8 scenarios are presented below:
Scenario 2010 2015 2020 2025 2030 2035 2040 2045 2050
Base Scenario 0.67 0.70 0.73 0.76 0.77 0.77 0.78 0.79 0.80
RCP45 0.67 0.70 0.69 0.72 0.76 0.80 0.85 0.90 0.97
Regional Policy 0.67 0.70 0.72 0.74 0.77 0.78 0.80 0.82 0.84
Constant Diet 0.67 0.70 0.73 0.76 0.77 0.77 0.78 0.79 0.80
Western Diet 0.67 0.70 0.73 0.76 0.78 0.80 0.83 0.86 0.89
Vegetarian Diet 0.67 0.70 0.73 0.76 0.77 0.77 0.78 0.78 0.79
High Yield 0.68 0.71 0.75 0.77 0.77 0.78 0.78 0.79 0.79
Low Yield 0.68 0.71 0.75 0.78 0.80 0.81 0.83 0.85 0.87
Table 30: GCAM biomass output prices for the 8 different scenarios in 1975 USD. The scenario utilised in the price formation is indicated in bold text.
The scenario selected as the basis for the price formation step was the Re-
gional Policy scenario. The reason for selecting this scenario is that it most
closely resembled the New Policies Scenario in the IEA’s World Energy Out-
look (WEO), and it is this scenario that the Danish Energy Agency utilises as in-
put for their socioeconomic fossil fuel prices. As such it was deemed im-
portant to have the same basis for the fossil and biomass price projections.
1
1.1
1.2
1.3
1.4
1.5
2005 2010 2015 2020 2025 2030 2035 2040 2045 2050
Ind
ex (
1=
20
05
pri
ce)
Biomass Production Price
No Policy
RCP45
Regional Policy
Western Diet
Constant Diet
Vegetarian Diet
High Yield
Low Yield
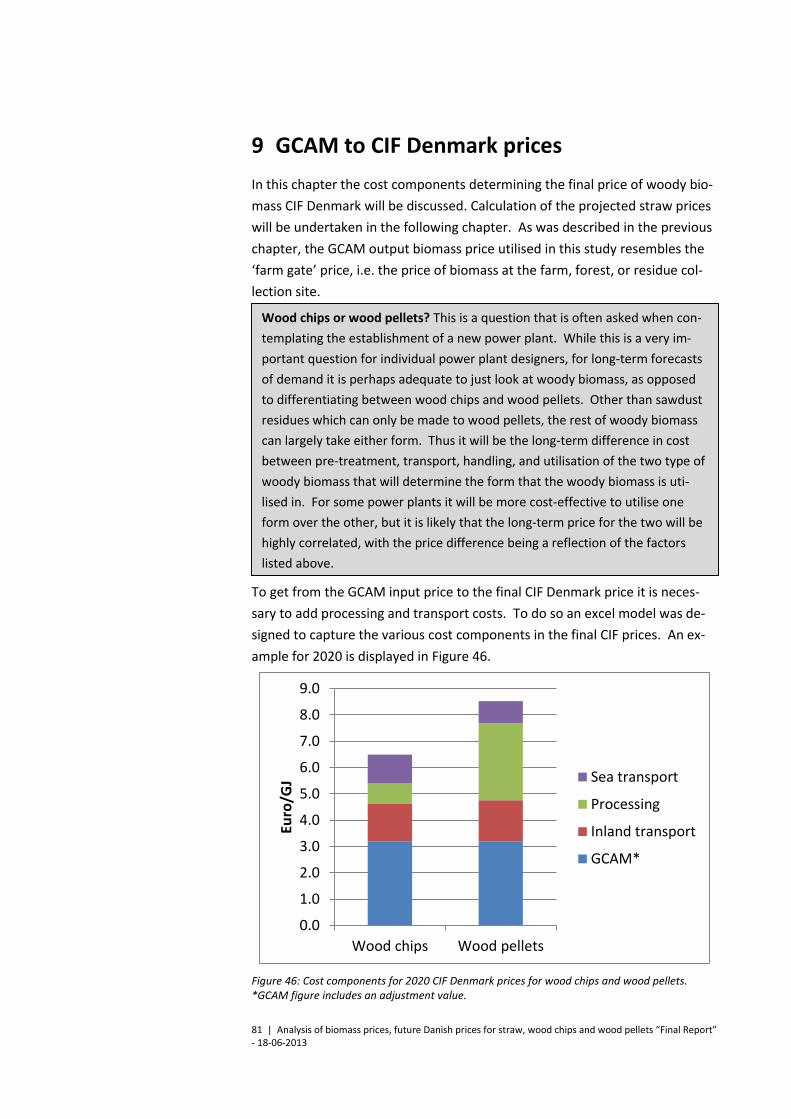
81 | Analysis of biomass prices, future Danish prices for straw, wood chips and wood pellets “Final Report” - 18-06-2013
9 GCAM to CIF Denmark prices
In this chapter the cost components determining the final price of woody bio-
mass CIF Denmark will be discussed. Calculation of the projected straw prices
will be undertaken in the following chapter. As was described in the previous
chapter, the GCAM output biomass price utilised in this study resembles the
‘farm gate’ price, i.e. the price of biomass at the farm, forest, or residue col-
lection site.
To get from the GCAM input price to the final CIF Denmark price it is neces-
sary to add processing and transport costs. To do so an excel model was de-
signed to capture the various cost components in the final CIF prices. An ex-
ample for 2020 is displayed in Figure 46.
Figure 46: Cost components for 2020 CIF Denmark prices for wood chips and wood pellets. *GCAM figure includes an adjustment value.
0.0
1.0
2.0
3.0
4.0
5.0
6.0
7.0
8.0
9.0
Wood chips Wood pellets
Euro
/GJ Sea transport
Processing
Inland transport
GCAM*
Wood chips or wood pellets? This is a question that is often asked when con-
templating the establishment of a new power plant. While this is a very im-
portant question for individual power plant designers, for long-term forecasts
of demand it is perhaps adequate to just look at woody biomass, as opposed
to differentiating between wood chips and wood pellets. Other than sawdust
residues which can only be made to wood pellets, the rest of woody biomass
can largely take either form. Thus it will be the long-term difference in cost
between pre-treatment, transport, handling, and utilisation of the two type of
woody biomass that will determine the form that the woody biomass is uti-
lised in. For some power plants it will be more cost-effective to utilise one
form over the other, but it is likely that the long-term price for the two will be
highly correlated, with the price difference being a reflection of the factors
listed above.

82 | Analysis of biomass prices, future Danish prices for straw, wood chips and wood pellets “Final Report” - 18-06-2013
For both wood chips and wood pellets the sea transport, processing, and in-
land transport components are comprised of sub-components. Examples for
the processing component for the two fuels are displayed below.
Figure 47: Processing costs for wood chips from North America and global wood pellets.9
In terms of transport, Figure 48 below depicts a simplified logistical transport
chain for wood chips and pellets. In reality the picture may of course be
more/less complex with additional/less transport links throughout, i.e. inland
shipping, storage, etc.
Figure 48: Simplified transport logistics for wood chips and wood pellets
9 Wood chips from North America are assumed to require heat treatment.
0.00
0.50
1.00
1.50
2.00
2.50
3.00
Euro
/GJ
Wood chips
Profit margin
Open air storage
Heat treatment
Chipping
0.00
0.50
1.00
1.50
2.00
2.50
3.00
Wood pellets
Profit margin
Bunker storage
Drying and pelletising
Chipping
Processing
Transport

83 | Analysis of biomass prices, future Danish prices for straw, wood chips and wood pellets “Final Report” - 18-06-2013
As the figure shows, the costs from forest to ship can vary from area to area,
while costs incurred once on board the ship are essentially the same for simi-
lar distances and types of vessels. However, costs vary whether the biomass
shipped is wood chips or wood pellets, and there are also different price
structures for short sea vs. deep sea shipping. As a result, the following four
major logistic supply chains were modelled:
Wood chips deep sea
Wood chips short sea
Wood pellets deep sea
Wood pellets short sea
For each of the above four logistic supply chains, variations of the transport
distances were considered to see their effect on the final CIF prices. In addi-
tion to the ‘medium’ distances used in calculating the final prices displayed in
the report, variations with ‘short’ and ‘long’ distances were also calculated.
In the description below, all distances will refer to the medium distances sce-
nario.
Each supply chain was comprised of the following categories of sub-compo-
nents which will be described below:
GCAM input
Inland transport
Processing
Sea transport
9.1 Assumptions and clarifications
Within the study it was assumed that efficiency gains would take place in pro-
cessing and transport logistics. In addition, all cost components were ad-
justed for projected oil price increases. This was done by assuming oil price
elasticities for each component and applying future projected oil prices ac-
cording to the IEA WEO New Policies Scenario as depicted below. (IEA 2012).
2012 USD / barrel
2012 2015 2020 2025 2030 2035 2040 2045 2050
Oil price 110.8 119.4 123.0 125.5 127.3 128.7 130.0 131.2 132.2
Table 31: Projected oil prices utilised in study from IEA WEO New Policies Scenario (IEA 2012)
9.2 GCAM Input
The excel spreadsheet has as an input from GCAM prices for the period 2010-
2050 at 5 year intervals. These values are in 1975 USD/GJ, and the first step is
thus to convert them to 2012 €/GJ. As detailed above, prices for each 5th year
Supply chain

84 | Analysis of biomass prices, future Danish prices for straw, wood chips and wood pellets “Final Report” - 18-06-2013
are available for 8 different scenarios, with the selected scenario being the
‘Regional Policy scenario’.10
The GCAM model was primarily utilised to give the slope of the price curve
that would be used throughout the period of the analysis. To match current
biomass resource costs it was then necessary to shift the curve, and through
analysis of current biomass prices it was determined that a 20% shift of this
curve resulted in prices that resemble those seen today. The chosen percent-
age adjustment is held constant over the period of the analysis.
A sensitivity analysis was done on this parameter, and due to the fact that the
initial raw material price is quite a small portion of the total end price (particu-
larly for wood pellets), and falls over the analysis period, the end price is ra-
ther insensitive to such changes. For example, the effect of altering this ad-
justment factor to 10% or 30% from the current 20% only alters the end price
by a maximum of 4.5% for wood chips, and 3.5% for wood pellets.
Lastly, after the above GCAM adjustment has been made, a 10% profit margin
for the biomass producer is applied.
9.3 Inland transport
It is assumed that the marginal price for woody biomass will mainly come
from dedicated forests/plantations, and as such the first step in the transport
process is the transport of whole trees. For all 4 logistic supply chains this dis-
tance is assumed to be 50 km in 2012 and growing to 100 km in 2050 as in-
creasing demand requires foresters to go further into the forest to acquire
raw material. The cost of doing so is assumed to be 0.97 €/GJ/100 km in
2012, growing to 1.02 €/GJ/100 km in 2050.11
After having been converted to wood chips they must be transported to the
destination port. Depending on the exporting area this may be via truck or
rail, or in some cases not be required as the chipping may occur near a port
facility. It is assumed that this transport distance is 50 km in 2012, and for
deep sea it grows to 75 km by 2050, while it grows to 100 km for short sea by
2050.12 For both short and deep sea the handling costs are assumed to be
10 Please see section 8, Description of model used in this study: GCAM for more on the policy scenarios. 11 Please see the appendices for a more detailed description of transport related cost components and the assumptions taken. 12 For both short and deep sea it is assumed that transport distances will increase as overall demand in-creases – buyers have to go further to accesses more distant markets. The study only assume a slight in-crease in transport distances of the chipped materials for deep sea, as large production facilities in the US or Latin America will likely go further to get the raw materials and utilise existing large scale chipping plants
GCAM adjustment
Transport of whole trees
Wood chips

85 | Analysis of biomass prices, future Danish prices for straw, wood chips and wood pellets “Final Report” - 18-06-2013
roughly 0.23 €/GJ for the entire period, while the cost per 100 km is assumed
to be 0.97 €/GJ in 2012, growing to 1.01 €/GJ km in 2050.
In the case of wood pellets, in some situations transport may be required
from the place of chipping to the pellet plant. For both short and deep sea
pellets a transport distance of 10 km and handling costs of roughly 0.23 €/GJ
over the entire time period have been assumed, while the cost per 100 km is
assumed to be 0.97 €/GJ in 2012, growing to 1.01 €/GJ km in 2050.
For the processed pellets a distance to port of 50 km in 2012 for short and
deep sea has been assumed. For deep sea this is expected to grow to 150 km
by 2050, while for short sea it is expected to grow to 200 km.13 For both deep
sea and short sea a handling cost of 0.19 €/GJ is assumed for the entire pe-
riod, while costs per 100 km are assumed to be 0.54 €/GJ in 2012, growing to
0.56 €/GJ km in 2050.
9.4 Processing
The costs associated with processing for wood chips include chipping, heat
treatment (for wood chips coming from North America), storage and a profit
margin. The chipping of woody biomass for short sea is assumed to cost 0.64
€/GJ in 2012 falling to 0.55 €/GJ in 2012. Chipping of woody biomass for deep
sea is assumed to be roughly 5% less due to larger economies of scale utilised
in the South Eastern United States. The cost of open air storage is assumed
to be relatively constant over the period for both deep sea and short sea, and
is 0.05 €/GJ.
To avoid potential problems with infested wood, EU regulations require that
wood chips from North America undergo a heat treatment that achieves a
wood temperature of at least 56°C for 30 minutes.14 The estimated cost of
this process is 0.39 €/GJ in 2012, falling to 0.32 €/GJ by 2050.15
For wood pellet processing the costs are comprised of chipping, drying and
palletising, bunker storage and profit margin. For the chipping component
the costs as indicated above were utilised. For drying and pelletising the
costs for deep sea are assumed to be 2.04 €/GJ in 2012 and falling to 1.64
13 For both short sea and deep sea it is assumed that transport distances will increase as overall demand increases. The study assumes a smaller increase in transport distances of pellets relative to short sea mar-kets, as large production facilities in the US or Latin America will likely go further to get the raw materials and utilise existing large scale pellet plants close to rivers and the ocean. One could also assume a larger increase in this transport distance, and a lower transport of whole trees if one assumes that new pellet fa-cilities are built close to the wood baskets. 14 Wood pellets are not subject to these rules as the pelletisation process eliminates the risk of infection. 15 For a more detailed cost breakdown of this process, please see the appendices.
Wood pellets
Wood chips
Wood pellets

86 | Analysis of biomass prices, future Danish prices for straw, wood chips and wood pellets “Final Report” - 18-06-2013
€/GJ in 2050. For short sea the assumed costs are slightly higher as the 2012
and 2050 figures are 2.14 and 1.77 €/GJ respectively. As was the case for
wood chips, the cost of bunker storage is assumed to be relatively constant
over the period for both deep sea and short sea, and is 0.05 €/GJ.
Lastly, for both wood pellets and wood chips a profit margin of 10% has been
assumed.
Total processing
As an example of one of the 4 woody biomass logistic supply chains, Figure 49
displays the total processing costs associated with deep sea wood pellets.
Drying and pelletising is by far the largest component and overall processing
reductions are largely due to cost reductions to this component.
Figure 49: Evolution of total processing costs for deep sea wood pellets in 2012 €/GJ
Total processing costs for the 4 woody biomass logistic supply chains is dis-
played in Figure 50.
0.0
0.5
1.0
1.5
2.0
2.5
3.0
3.5
2012 2015 2020 2025 2030 2035 2040 2045 2050
Euro
/GJ
Chipping Drying and pelletising
Bunker storage Profit margin

87 | Analysis of biomass prices, future Danish prices for straw, wood chips and wood pellets “Final Report” - 18-06-2013
Figure 50: Processing costs for the 4 woody biomass logistic supply chains.
For both wood pellets and wood chips the chipping and storage costs are
largely the same. The difference between the two is due to the drying and
palletising costs, which are much higher than the heat treatment costs re-
quired of North American wood chips. Deep sea pellet production costs are
slightly lower than short sea due to assumed larger economies of scale.
Meanwhile, short sea wood chips have lower processing costs than deep sea
wood chips as the former do not require heat treatment.
9.5 Sea transport
Once in wood chip or wood pellet form and transferred to a port, the last
stage of the logistic chain is shipping of the biomass to Danish waters. This
phase includes storage at the shipper, loading of the biomass, and the actual
shipping cost. Within this study the shipping link has been classified as either
deep sea (typically trans-Atlantic on large ships), or short sea (typically shorter
intra-continental distances on smaller ships). For a more detailed description
of the sea transport assumptions and figures used in the study, please see the
appendices.16
16 One particular cost component worth noting is the use of bunker fuels for shipping of specification (IFO 180/IFO 380), which at the time of writing had a market price of roughly 675 USD/tonne. In the future it is expected that emissions from bunker fuels will have to be reduced, and this may result in a more expensive form of bunker fuel being utilised, and/or the installation of scrubbing equipment which would also in-crease shipping costs.
0.0
0.5
1.0
1.5
2.0
2.5
3.0
3.5
2012 2015 2020 2025 2030 2035 2040 2045 2050
Euro
/GJ
Wood chips - deep sea Wood chips - short sea
Wood pellets - deep sea Wood pellets - short sea

88 | Analysis of biomass prices, future Danish prices for straw, wood chips and wood pellets “Final Report” - 18-06-2013
It is anticipated that the quantities of biomass that will be transported over
long distances will greatly increase in the future, particularly for woody bio-
mass and other pellets. As a result, the percentage that is transported via
deep sea increases over the study period (see Table 32). The distance utilised
for deep sea shipping within this study is 7,900 km, which is roughly the dis-
tance from Mobile, Alabama to Denmark.
2012 2015 2020 2025 2030 2035 2040 2045 2050
Wood chips Deep sea (%)
0 0 5 10 15 20 25 30 35
Wood pellets Deep sea (%)
20 24 31 37 44 50 57 63 70
Table 32: Proportion of transported woody biomass that is assumed to arrive in Denmark via deep sea shipping transport over the study period.
Due to the high volume of wood chips it is assumed that ships that specialise
in high volume cargos (often referred to as wood chip carriers) are utilised for
wood chips, while large Panamax sized ships are used for the long distance
transport of wood pellets.
For deep sea wood chips, handling costs (storage and loading) are roughly
0.19 €/GJ over the entire time period, while the transport cost per 1,000 km
stays relatively constant around 0.29 €/GJ from 2012 to 2050. The cost per
km is largely unchanged as increased oil prices are offset by increases efficien-
cies related to transport logistics.17
For wood pellets, the handling costs are roughly 0.26 €/GJ over the study pe-
riod, while the transport cost per 1,000 km of 0.09 €/GJ is nearly constant due
to the same reasons highlighted above for wood chips. Relative to wood
chips, the higher handling costs for wood pellets are due to the fact that they
are more difficult to handle. Meanwhile, shipping costs for pellets are lower
due to the much higher energy content per cubic meter.
The distance utilised for short sea shipping within this study is 850 km, corre-
sponding to a typical shipping distance from the Baltics to Denmark.
For short sea wood chips, handling costs (storage and loading) are roughly
0.33 €/GJ over the entire time period, while the transport cost per 1,000 km
falls slightly from 0.79 €/GJ in 2012 to 0.77 €/GJ in 2050.
17 It is for example assumed that the % of time ships will sail back empty or partially laden will fall over the period studied.
Deep sea
Short sea
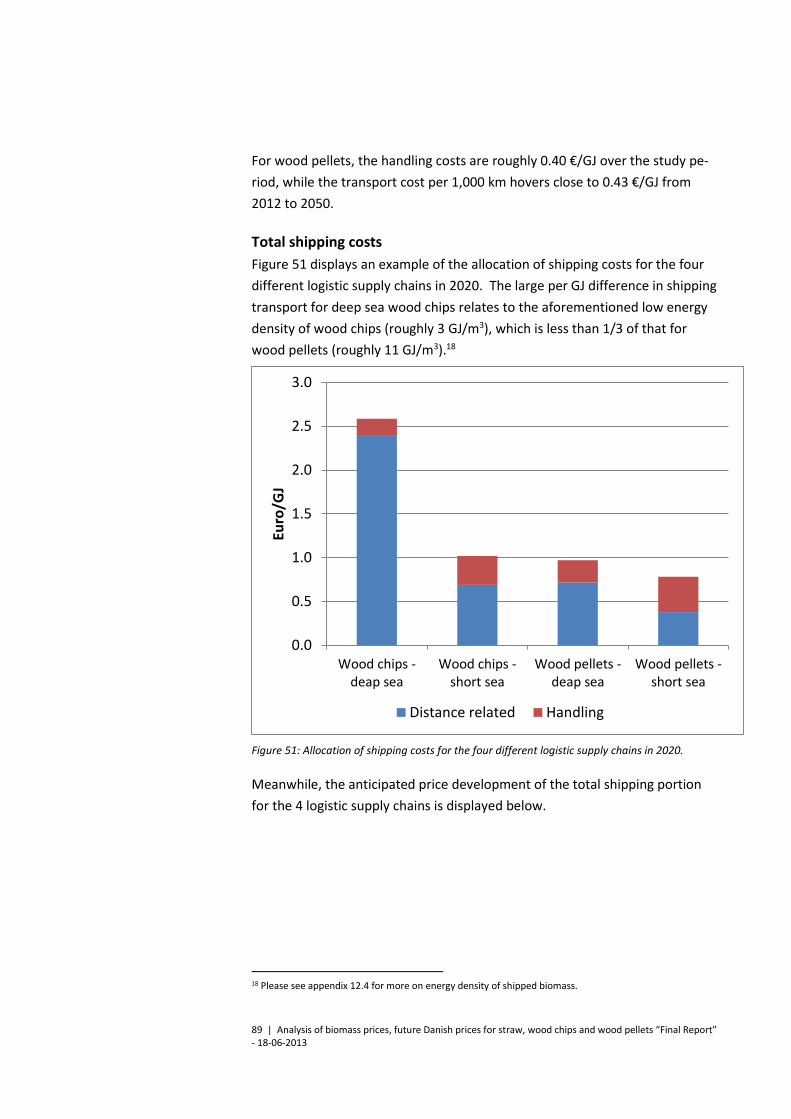
89 | Analysis of biomass prices, future Danish prices for straw, wood chips and wood pellets “Final Report” - 18-06-2013
For wood pellets, the handling costs are roughly 0.40 €/GJ over the study pe-
riod, while the transport cost per 1,000 km hovers close to 0.43 €/GJ from
2012 to 2050.
Total shipping costs
Figure 51 displays an example of the allocation of shipping costs for the four
different logistic supply chains in 2020. The large per GJ difference in shipping
transport for deep sea wood chips relates to the aforementioned low energy
density of wood chips (roughly 3 GJ/m3), which is less than 1/3 of that for
wood pellets (roughly 11 GJ/m3).18
Figure 51: Allocation of shipping costs for the four different logistic supply chains in 2020.
Meanwhile, the anticipated price development of the total shipping portion
for the 4 logistic supply chains is displayed below.
18 Please see appendix 12.4 for more on energy density of shipped biomass.
0.0
0.5
1.0
1.5
2.0
2.5
3.0
Wood chips -deap sea
Wood chips -short sea
Wood pellets -deap sea
Wood pellets -short sea
Euro
/GJ
Distance related Handling

90 | Analysis of biomass prices, future Danish prices for straw, wood chips and wood pellets “Final Report” - 18-06-2013
Figure 52: Sea transport costs for the 4 woody biomass logistic supply chains
As was indicated above, the sea transport cots are fairly constant throughout
the period as projected oil price increases are offset by projected increases in
transport efficiency logistics.
9.6 Complete price forecast
Assembling the above price components gives wood chip and wood pellet
price projects as displayed in the following two figures.
Figure 53: CIF Denmark price projects for wood chips according to price component. *GCAM fig-ure includes an adjustment value.
0.0
0.5
1.0
1.5
2.0
2.5
3.0
2012 2015 2020 2025 2030 2035 2040 2045 2050
Euro
/GJ
Wood chips - deep sea Wood chips - short sea
Wood pellets - deep sea Wood pellets - short sea
0.0
1.0
2.0
3.0
4.0
5.0
6.0
7.0
8.0
9.0
10.0
2012 2015 2020 2025 2030 2035 2040 2045 2050
Euro
/GJ
GCAM* Inland transport Processing Sea transport
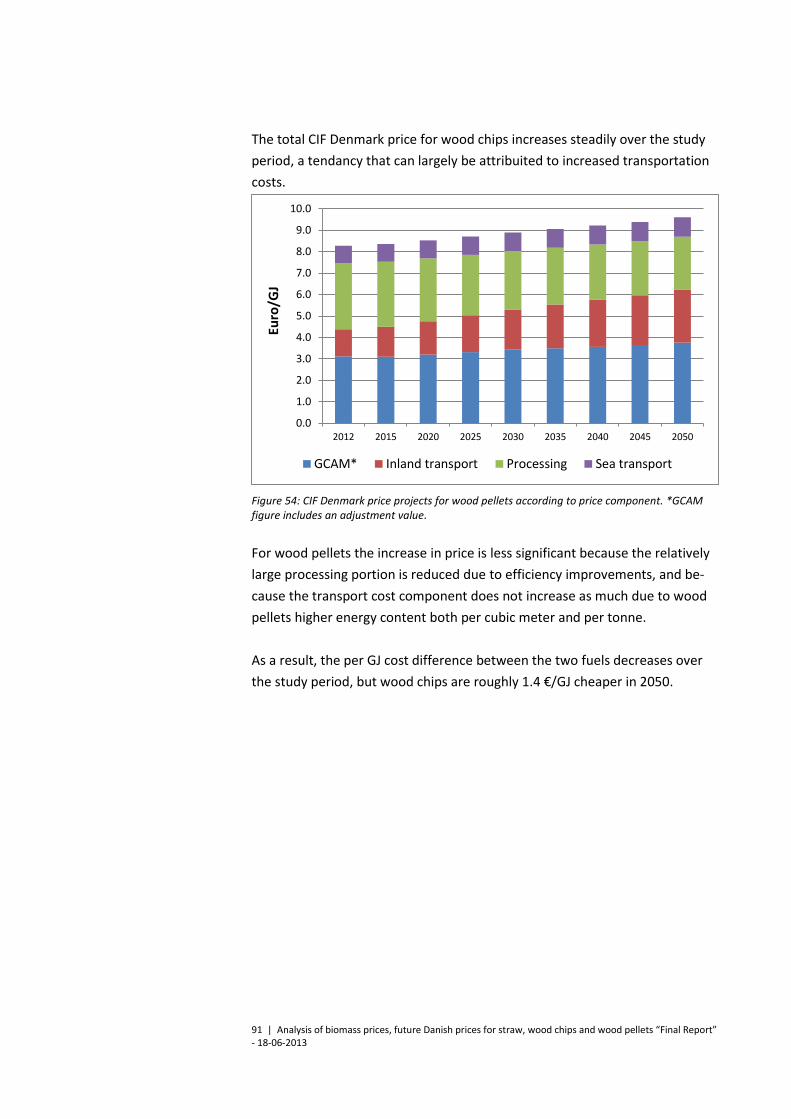
91 | Analysis of biomass prices, future Danish prices for straw, wood chips and wood pellets “Final Report” - 18-06-2013
The total CIF Denmark price for wood chips increases steadily over the study
period, a tendancy that can largely be attribuited to increased transportation
costs.
Figure 54: CIF Denmark price projects for wood pellets according to price component. *GCAM figure includes an adjustment value.
For wood pellets the increase in price is less significant because the relatively
large processing portion is reduced due to efficiency improvements, and be-
cause the transport cost component does not increase as much due to wood
pellets higher energy content both per cubic meter and per tonne.
As a result, the per GJ cost difference between the two fuels decreases over
the study period, but wood chips are roughly 1.4 €/GJ cheaper in 2050.
0.0
1.0
2.0
3.0
4.0
5.0
6.0
7.0
8.0
9.0
10.0
2012 2015 2020 2025 2030 2035 2040 2045 2050
Euro
/GJ
GCAM* Inland transport Processing Sea transport

92 | Analysis of biomass prices, future Danish prices for straw, wood chips and wood pellets “Final Report” - 18-06-2013
10 Straw price formation
In Denmark more than 60% of the residue from the fields is gathered and uti-
lised for different purposes. In Figure 55 it can be seen that 25% is used for
fuel, and the rest is primarily used for bedding and fodder in animal produc-
tion farms.
Figure 55: Production and utilisation of agricultural residue (straw) in Denmark 2006 – 2011. (Danmarks Statistik n.d.)
Roughly 50% of the straw used for fuel purposes is used at centralised heat
plants, and the main part of the rest is used in decentralised heat only boilers.
A minor part is used at single farm boilers.
In (Ea Energy Analyses 2010), the marginal production price of straw for en-
ergy purposes is calculated to be 2.4 – 2.6 €/GJ, including profits. Comments
from the Danish Agriculture & Food Council point at higher cost calculations.
As was shown in Figure 11, the price of straw delivered at the district heating
plants have been quite stable for the last 10-15 years, always being 5%-15%
lower than the price of wood chips (measured on an energy basis), and cur-
rently around 5.5 €/GJ including transport.
It is generally acknowledged that straw is a more complex fuel for use in
power plants than woody biomass due to higher volumes and chemical con-
tents. Particular when used in high temperature steam boilers (centralised
CHP plants) the content of chlorides and potassium has proven to increase
maintenance costs. Therefore it is the simple assumption in this report, that
straw will continue to be priced (at point of delivery) between production
0
10
20
30
40
50
60
70
80
90
100
2006 2007 2008 2009 2010 2011
PJ/
year
For fuel For fodder For bedding etc. Not collected

93 | Analysis of biomass prices, future Danish prices for straw, wood chips and wood pellets “Final Report” - 18-06-2013
costs and the price of wood chips. It is thus assumed that the price will con-
tinue to be 10% below the price of wood chips.
In addition, we see no indications of straw becoming an internationally traded
commodity in the foreseeable future. Therefore the calculation of a CIF Den-
mark price on straw is a theoretical value to be quoted with utmost care.

94 | Analysis of biomass prices, future Danish prices for straw, wood chips and wood pellets “Final Report” - 18-06-2013
11 Biomass price projection to 2050
The CIF Denmark woody biomass prices arrived at are for the Regional GCAM
Policy scenario and assume medium transport distances and a growing in-
crease in woody biomass coming from ‘deep sea’ as indicated in Table 32. To
give an indication of the potential range of future prices if these assumptions
were altered, two alternative scenarios are presented below, a ‘low price’ sce-
nario, and a ‘high price’ scenario.
11.1 Scenario assumptions
In the low price scenario the GCAM input scenario is the ‘Vegetarian’ scenario,
as this results in the lowest 2050 GCAM biomass input price.
With respect to the portion of woody biomass that comes from deep sea, in
the low price scenario this portion is held constant from 2012 and thus in con-
trary to the other scenarios, sees no growth.
In terms of the transport distances, in the low price scenario they are lower
and do not grow much over the course of the study period.
In the high price scenario the GCAM input scenario is the ‘RCP45’ scenario, as
this results in the highest 2050 GCAM biomass input price.
Regarding the portion of woody biomass that comes from deep sea, in the
high price scenario this is considerably larger and sees more growth than in
the ‘medium’ transport distance scenario.
In terms of the transport distances, in the high price scenario they are longer
and grow significantly over the course of the study period.
The main assumptions for the scenarios are summarised below:
Low price scenario
High price scenario

95 | Analysis of biomass prices, future Danish prices for straw, wood chips and wood pellets “Final Report” - 18-06-2013
Parameter 2012 2015 2020 2025 2030 2035 2040 2045 2050
GCAM price input (2012 Euro/GJ):
Low: Vegetarian Diet
2.8 2.8 3.0 3.1 3.1 3.1 3.1 3.2 3.2
Medium: Regional Policy
2.8 2.8 2.9 3.0 3.1 3.2 3.2 3.3 3.4
High: RCP45
2.8 2.8 2.8 2.9 3.1 3.2 3.4 3.7 3.9
Wood chips Deep sea (%):
Low 0 0 0 0 0 0 0 0 0
Medium 0 0 5 10 15 20 25 30 35
High 0 5 10 20 30 40 50 60 70
Wood pellets Deep sea (%):
Low 20 20 20 20 20 20 20 20 20
Medium 20 24 31 37 44 50 57 63 70
High 20 26 37 47 58 68 79 89 100
Transport distances in various logistic stages
Low Short
Medium Medium
High Long
Table 33: Core assumptions in the various pricing scenarios.
The resulting prices are presented in Figure 56 and Table 34 below. Please
note that from 2035 to 2050 price estimates are solely on a 5 year basis.
Figure 56: Projected biomass prices CIF Denmark in given three scenarios (€/GJ).
0.0
1.0
2.0
3.0
4.0
5.0
6.0
7.0
8.0
9.0
10.0
11.0
20
12
20
13
20
14
20
15
20
16
20
17
20
18
20
19
20
20
20
21
20
22
20
23
20
24
20
25
20
26
20
27
20
28
20
29
20
30
20
31
20
32
20
33
20
34
20
35
20
40
20
45
20
50
Euro
/GJ
Straw Low Straw Medium Straw High
Wood Chips Low Wood Chips Medium Wood Chips High
Wood Pellets Low Wood Pellets Medium Wood Pellets High

96 | Analysis of biomass prices, future Danish prices for straw, wood chips and wood pellets “Final Report” - 18-06-2013
The following table displays the CIF Denmark prices for straw, wood chips and
wood pellets under 3 different scenarios. Please note that in the case of lo-
cally used straw and wood chip resources the prices can be below CIF prices.
Straw is assumed to be a local fuel throughout the period, with prices set by
the price of local wood chips (see discussion below).
Euro/GJ Straw Wood Chips Wood Pellets
Year Low Med High Low Med High Low Med High
2012 5.0 5.5 5.9 5.6 6.1 6.6 7.6 8.3 8.8
2013 5.0 5.5 6.0 5.6 6.1 6.6 7.6 8.3 8.8
2014 5.0 5.5 6.0 5.6 6.1 6.7 7.6 8.3 8.9
2015 5.0 5.6 6.1 5.6 6.2 6.8 7.6 8.4 8.9
2016 5.1 5.6 6.2 5.6 6.2 6.9 7.6 8.4 8.9
2017 5.1 5.7 6.2 5.7 6.3 6.9 7.6 8.4 9.0
2018 5.1 5.7 6.3 5.7 6.4 7.0 7.6 8.5 9.0
2019 5.1 5.8 6.3 5.7 6.4 7.0 7.6 8.5 9.0
2020 5.2 5.8 6.4 5.7 6.5 7.1 7.7 8.5 9.0
2021 5.2 5.9 6.4 5.8 6.6 7.2 7.7 8.6 9.1
2022 5.2 6.0 6.5 5.8 6.6 7.2 7.7 8.6 9.1
2023 5.2 6.0 6.6 5.8 6.7 7.3 7.7 8.6 9.2
2024 5.2 6.1 6.7 5.8 6.7 7.4 7.7 8.7 9.2
2025 5.3 6.1 6.8 5.9 6.8 7.5 7.7 8.7 9.2
2026 5.3 6.2 6.9 5.9 6.9 7.6 7.7 8.7 9.3
2027 5.3 6.2 7.0 5.9 6.9 7.7 7.7 8.8 9.4
2028 5.3 6.3 7.1 5.9 7.0 7.8 7.7 8.8 9.4
2029 5.3 6.4 7.1 5.9 7.1 7.9 7.7 8.9 9.5
2030 5.3 6.4 7.2 5.9 7.1 8.0 7.7 8.9 9.5
2031 5.3 6.5 7.3 5.9 7.2 8.1 7.7 8.9 9.6
2032 5.3 6.5 7.4 5.9 7.2 8.2 7.7 9.0 9.7
2033 5.3 6.6 7.5 5.9 7.3 8.3 7.7 9.0 9.7
2034 5.3 6.6 7.6 5.9 7.3 8.4 7.7 9.0 9.8
2035 5.3 6.7 7.7 5.9 7.4 8.5 7.7 9.1 9.9
2040 5.3 6.9 8.2 5.9 7.6 9.1 7.7 9.2 10.2
2045 5.3 7.1 8.6 5.9 7.9 9.6 7.7 9.4 10.6
2050 5.3 7.4 9.1 5.9 8.2 10.2 7.7 9.6 11.0
Table 34: Projected biomass prices CIF Denmark in given three scenarios (€/GJ).
The variance in the biomass prices in the low, medium, and high scenarios is
largely due to transport related assumptions, both respect to the % that is
short and deep sea, and the distances. Meanwhile, the GCAM scenario selec-
tion has a much lesser effect.

97 | Analysis of biomass prices, future Danish prices for straw, wood chips and wood pellets “Final Report” - 18-06-2013
11.2 Methods for calculation of local wood chip and straw prices (delivered to plant).
The CIF Denmark price for wood chips and straw is not likely to adequately re-
flect the delivered cost of wood chips or straw at a decentralised inland power
plant in Denmark that has access to local resources. In this regard, the above
prices, plus a transport cost, would act as price cap, and the raw production
costs including transport would act as a price floor. The actual price at a given
end-use location will depend on the distance to local resources and the local
demand supply balance. When supply is abundant, the local production costs
including transport will determine prices. Only in the case where the local and
regional demand exceeds local supply, the CIF Denmark price including
transport from harbour can be expected to determine prices.
It is therefore recommended that alternative pricing approaches are utilised
to calculate local straw and wood chip prices. Below a simple suggestion for
two calculation methods are presented. Other methods could include the de-
velopment of a national biomass market model.
A: Scenarios where inland supply of straw and wood chips exceed de-
mand
Use updated price statistics as presented in Figure 11, combined with
the general price development calculated in this report (slope of price
curve).
B: Scenarios where inland demand of straw and wood chips exceed
supply
Use CIF Denmark prices calculated in this report and add average
transport costs as calculated in previous price projection report (EA
Energianalyse and Wazee 2011).
Use of local resources

98 | Analysis of biomass prices, future Danish prices for straw, wood chips and wood pellets “Final Report” - 18-06-2013
12 Appendices
12.1 Appendix I Key parameters in wood pellet standardisation
As far as woodfuels are concerned, the critical parameters that need to be de-
fined in a specifications list of a standard are as follows (Biomass Energy
Centre 2012), (Kofman 2010):
1) Moisture content
- Denoted as a percentage of the total weight of the wet sample
(wet basis) or with the weight of the water given as a percentage
of the mass of dry biomass (dry basis).
- Different types of boilers have different tolerance limits as to the
moisture content of the solid biofuel
2) Dimensions
- For wood pellets the diameter is the most important parameter,
accompanied by an acceptable range of lengths for each diameter
- For woodchips range of sizes of 75% of the sample are usually
given, measured using sieves
- Dimensions of e.g. woodchips are crucial both from combustion
efficiency perspective (abundance of small, fine material would
reduce the efficiency) as well as from the operational perspective
of the feed system (too large pieces would jam the system)
3) Origin
- States what the wood fuel is made of and where it comes from.
E.g., whether it is woody biomass, herbaceous biomass, fruit bio-
mass or a blend. Each of the groups is further divided into sub-
groups, e.g. for trees, it can be stemwood, branches, stumps etc.
4) Ash content and properties
- Ash content is denoted in percentage on a dry basis, and occa-
sionally ash melting temperature is also provided
- Permissible ash content depends on whether the boiler/stove is
equipped with automatic de-ashing. In addition, low ash melting
temperature can give rise to formation of lumps of clinker or slag-
ging.
5) Calorific value
- Denoted as the energy content per unit of weight. Alternatively,
energy density can be indicated, i.e., energy content per unit of
volume.

99 | Analysis of biomass prices, future Danish prices for straw, wood chips and wood pellets “Final Report” - 18-06-2013
12.2 Appendix II Torrefied and black pellets
Torrefaction is the process of heating biomass so as to remove moisture, as
well as some volatiles, thereby producing a higher density product. The ther-
mochemical process is typically carried out at roughly 300°C (though can vary
from 250-350) in an extremely low oxygen environment, thereby resulting in
the biomass being ‘roasted’ as opposed to burned.
Figure 57: Process diagram for a typical torrefaction process (Koppejan, et al. 2012)
The process results in the partial breakdown of the cellulose, hemicellulose
and lignin, thus altering the chemical composition to a torrefied product. For
torrefied pellets, after the moisture from the biomass has been removed, and
the torrefied product cooled, the biomass is ground and then fed through a
pellet mill where water and binders are added to create a torrefied pellet.
The reported benefits of torrefaction include (Koppejan, et al. 2012):
Relative to regular wood pellets they are more moisture resistant,
making handling easier.
Biological activity is ceased, thus risks related to fire and decomposi-
tion are reduced.
It’s much higher energy density (15-19 GJ/m3)19 relative to conven-
tional wood pellets (8.5-10 GJ/m3) reduces transport costs.
A heating value of 20 – 24 GJ/tonne.
Torrefied pellets grind very similar to coal and therefore are easier to
utilise in existing coal plants.
Due to the higher energy content, higher co-firing ratios with coal can
be achieved.
Allows for various biomass feedstocks.
19 This correlates to a bulk density of 800 kg/m3
Torrefaction

100 | Analysis of biomass prices, future Danish prices for straw, wood chips and wood pellets “Final Re-port” - 18-06-2013
Meanwhile, the drawbacks of torrefaction are the cost and energy losses as-
sociated with the process. The energy ‘loss’ to the process is generally esti-
mated to be around 10% of initial biomass energy content.
A trademarked black pellet called the ‘Zilkha Black Pellet’ claims to utilise an
alternative process to develop a somewhat similar product.20 They describe
their process as one that utilises an external energy source to drive the pro-
cess, thus not using energy from the biomass itself. They state that this pro-
cess uses less energy than torrefaction and that it does not utilise bindings or
additives. Their end product is stated to typically have a moisture content of
2%, a heating value of 19.5 GJ/tonne, and a density of 770 kg/m3. In addition,
the product is reportedly waterproof, thus allowing for outdoor storage and
the usage of water to extinguish fires. It is claimed to be very durable, thus al-
lowing for bulldozing to trim loads, as well as having less dust, thus reducing
explosion risk during handling. In addition to various traditional softwood and
hardwood biomass inputs, Zilkha has also experimented with bamboo, sweet
sorghum, switchgrass, mesquite, miscanthus and eucalyptus and bagasse
(Weick 2012).
12.3 Appendix III Pre-treatment of biomass
Technically speaking the wood chips do not need to be dried to live up to the
EU regulations, but by heating them to at least 56°C for 30 minutes will result
in a partial drying of the chips. Here we have assumed that the chips are dried
from 45% to 40% via the heat treatment. The energy consumption associated
with heating and drying 1 tonne of wood chips (9.46 GJ) to 40% moisture con-
tent is displayed in Table 35 below. In addition, the energy consumption as a
% of the dried wood chips is also calculated.
Energy consumption for 1 tonne
of wood chips with 45% m/c
Energy consumption as
a % of dried wood chips
Heating to 56 °C 185 MJ 1.9 %
Drying to 40% m/c 201 MJ 2.1 %
Total 386 MJ 4.0 %
Table 35: Energy required for heating and drying wood chips with moisture content (m/c) of 45%
It is estimated that the heating and drying of the wood chips to a moisture
content of 40% utilises roughly 4% of the dried wood chips energy content. If
the wood chips have to be heated to satisfy EU and US requirements, it may
prove cost-effective to continue the process and further reduce the moisture
20 http://www.zilkha.com/our-waterproof-pellet/
Zilkha black pellets
Phytosanitation

101 | Analysis of biomass prices, future Danish prices for straw, wood chips and wood pellets “Final Re-port” - 18-06-2013
content, thereby reducing transportation costs. As such, additional calcula-
tions were undertaken where the moisture content was further reduced. If
the process is continued to 30% moisture content the total energy consump-
tion is estimated to be 6.9%, and at 20% moisture content it is 8.9%.
In addition to the energy consumption calculations, the costs of undertaking
this process was also estimated. It is assumed that a facility for heating and
drying can be established for the same cost as a wood chip drier without con-
densation heat recovery. Such a drier with a capacity of 50 tonnes/hour is es-
timated to cost approximately 23 million DKK.21 The annual cost of capital is
based on an interest rate of 10% and a 5 year term. Operations and mainte-
nance are estimated to be 10% of the annual capital costs. It is assumed that
the wood chips are heated and dried via natural gas, and that this process has
a 90% efficiency. The natural gas price is based on the current price of gas at
the Henry Hub exchange, plus transportation costs, thus totalling approxi-
mately 30 kr./GJ.
Cost of phytosanitation
Investment 1.4 kr./GJ
Natural gas 1.3 kr./GJ
Various O&M 0.1 kr./GJ
Total 2.9 kr./GJ
Table 36: Costs of heating and drying wood chips with an initial 45% moisture content to 56 °C and drying them to 40% moisture content.
If the drying is to be further carried out to 30% and 20% moisture content, the
estimated respective costs of doing so would be 3.6 and 4.1 kr./GJ.
12.4 Appendix IV biomass transport
The following section will sketch out the most common transport logistics for
the various biomass types in focus and highlight some of the assumptions and
elements that were taken into consideration.
In the case of wood chips, the first link in the supply chain is either the forest
or a plant, as the chips can be sourced either directly from the forest, or as
residues from the wood and paper industries. In the forest (or plant) the
trees must either be chipped or transported as whole logs.
21 Assessed in conjunction with TK Energi.
Wood chips – To port

102 | Analysis of biomass prices, future Danish prices for straw, wood chips and wood pellets “Final Re-port” - 18-06-2013
In many cases, transport from the forest to the port will be carried out by
large trucks. The cost of transporting wood chips via truck depends on the ve-
hicle type, capacity and specific country/region. A rough rule of thumb in the
transport industry is 1 kr./tonne/ km, however market actors interviewed
have indicated slightly lower figures. A 2010 Ea Energy Analyses survey of 30
district heating plants in Denmark indicated that truck transportation costs for
wood chips in Denmark was on average 7-10 kr. / GJ, equivalent to 65-95 kr. /
tonne.
In countries with well-developed rail infrastructure between forest areas and
port facilities (for example in British Columbia, Canada), the transportation of
wood chips from forest to port takes place via rail. The cost of transportation
of wood chips via rail will largely depend on local conditions such as rail ca-
pacity and competing goods, however the per km/tonne cost can be assumed
to be cheaper than transport via truck.
Upon arrival at the port, the truck or railcar must be unloaded and the wood
chips either transported to a temporary storage, or loaded directly to a wait-
ing ship. The cost and duration of the offloading/storage/loading can vary
substantially depending on the local conditions. In some ports the loading of
a small ship may take the better part of a day, while others such as the termi-
nal in Vancouver, Canada can load up to 1,000 metric tonnes per hour
(Fibreco 2010).
For wood pellets there is an extra initial step as the input material (whether it
be wood from dedicated forests, or residues from another industry) are first
transported to a pellet plant for pelletisation. Once in pellet form the pellets
must either be transported by bulk trucks or rail cars, with bottom-discharging
or walking floor systems being some of the most often used due to the mini-
mal wood pellet damage (Janzé 2010). Rail cars for transport of wood pellets
can typically carry 100 tonnes and represent a much cheaper alternative for
long distance transport. Pacific Bioenergy in Canada for example uses railcars
to transport its wood pellets 900 km from Prince George to Vancouver port
for shipment.
It is worth noting that for pellets in particular, the more they are handled, the
more they break up. This has two main repercussions; firstly this produces a
fine dust that comprises a fire and explosion risk, and secondly, the more the
pellets break up, the greater the fibre loss. As such it is highly preferable and
cost-effective to limit the number of times wood pellets are handled.
Wood pellets – To port

103 | Analysis of biomass prices, future Danish prices for straw, wood chips and wood pellets “Final Re-port” - 18-06-2013
Bulk shipping can generally be categorised as either ‘deep sea’ or ‘short sea’.
Deep sea typically involves large ships transporting goods on intercontinental
routes and/or across oceans, while short sea generally encompasses smaller
ships travelling shorter distances.
In a previous study Ea Energy Analyses carried out a bottom up cost analysis
of both categories, with the point of departure being a deep sea route consist-
ing of North America to Europe, and short sea referring to routes such as
those from Scandinavia, the Baltics and Russia to Denmark.
Deep Sea
Figure 58 illustrates the evolution in average freight rates over a five year pe-
riod for three ship types. As can be seen, rates have a tendency to vary dra-
matically from year to year, thus making it difficult to base a projection of fu-
ture rates on current rates.
Figure 58: Average daily spot prices for the four main shipping routes over a 5 year period for three different ship classes (Cape, Panamax, Handy). (www.drywhips.com)
Due to this volatility a bottom up cost analysis of freight rates was undertaken
involving a variety of ship sizes and types. The results of this analysis are dis-
played in Table 37, while a brief description of the components follows below:
Ship size - Ship sizes are often given in 'deadweight tonne' (dwt). Dwt
is neither an expression of the weight of the ship or cargo capacity per
se, but rather a measure of how much a ship can carry including all
the necessary elements required to operate the vessel. As such dwt is
a measure of the maximum weight of: cargo + provisions + crew +
Ship transport
104 | Analysis of biomass prices, future Danish prices for straw, wood chips and wood pellets “Final Re-port” - 18-06-2013
+passengers+ fuel + ballast water, etc. The maximum cargo weight is
therefore typically within a range of 85-95% of the reported
deadweight tonnes.22
Ship volume - For biomass, cargo volume is often a more appropriate
measure than ship size (particularly for wood chips) as it usually is this
value which determines how much cargo a ship can carry.
Stowage factor - Stowage factor expresses how much space one
tonne of a specific type of cargo occupies, and is typically measured in
m3/tonne (or cubic feet / tonne). This factor can vary significantly be-
tween different products. For example, typical stowage factors meas-
ured in m3/tonne for selected commodities include: iron ore (0.4),
coal (1.4), pellets (1.5), palm kernel shells (1.7) wood chips (2.5-3.5)23
and straw (7.2). This variation has a significant impact on how much of
a given commodity can be loaded on a particular type of ship. As a re-
sult, specially designed ships are utilised, particularly for goods with
considerably low or high stowage factors, i.e. iron ore carriers, or, of
greater relevance in this context, wood chip carriers.
Draft – Draft is a measure of the vertical distance from the waterline
to the bottom of the ships lowest point when fully loaded.
22 “Technically speaking, the deadweight tonnage (DWT) is the difference between the number of tonnes of water the vessel displaces when submerged to its load line and the number of tonnes of water the vessel displaces light. The DWT is usually given at full summer saltwater draught (referred to as the scantling draught), but can also correspond to the design draught, thus resulting in a lower value”. (MAN Diesel, 2010). 23 The density can vary significantly depending on the moisture content and type of tree. In these calcula-tions a moisture content of 45% and density of 3.08 (325 kg/m3) was used. The moisture content (MC) fig-ure was in line with what actors in the Eastern states indicated the shipped wood chips would likely be at, while the density of 325 kg /m3 was selected as this is roughly the density of Pine wood chips at 45% MC. (Franceescato, Antonini and Bergomi 2008) Pine was selected as the reference wood as the majority of softwood from the South-eastern states used for wood chips is likely to be pine. (Pöyry Managment Consulting (UK) 2012)

105 | Analysis of biomass prices, future Danish prices for straw, wood chips and wood pellets “Final Re-port” - 18-06-2013
Handymax Panamax Chip carrier
Ship size (tdw) 51,000 65,000 53,896
Ship volume (m3) 64,935 80,000 115,687
Length (m) 190 220 20424
Width (m) 32.3 32.6 37.2
Draft (m) 12.0 13.1 10.9
Wood chips:
Cargo wood chips (tonnes)25 21,104 26,000 37,598
Cargo wood chips (GJ)26 197,743 243,620 352,296
Ship transport costs
(kr./GJ/1,000 km)27 2.46 2.34 2.17
CO2 emissions (kg CO2 pr.
tonne wood chips/1,000 km) 9.9 8.9 8.7
CO2 emissions (kg CO2 pr. GJ
wood chips/1,000 km) 1.05 0.95 0.92
Energy usage relative till cargo
pr. 1,000 km (%) 1.45 1.31 1.27
Wood pellets:
Cargo wood pellets (tons)28 42,466 52,318 45,394
Cargo wood pellets (GJ) 29 721,920 889,407 791,231
Ship transport costs
(kr./GJ/1,000 km) 0.67 0.64 0.97
CO2 emissions (kg CO2 pr.
tonne wood pellets/1,000 km) 4.9 4.4 7.0
CO2 emissions (kg CO2 pr. GJ
wood pellets /1,000 km) 0.29 0.26 0.41
Energy usage relative till cargo
pr. 1,000 km (%) 0.40 0.36 0.57
Table 37: Various deep sea ship sizes and characteristics. Data based on current prices and ac-tual ships from each category.
Regarding the costs of shipping, the most important factor is fuel costs, as this
is estimated to constitute approx. 2/3 of operating costs, and more than half
of the total shipping costs (excluding loading and unloading).30
24 Some are also 210 meters. 25 Based on a stowage factor of 109 cubic feet/tonne (3.1 m3/ tonne or 325 kg / m3) (Franceescato, Antonini and Bergomi 2008) 26 Based on a heating value of 9.37 GJ/tonne 27 Shipping Costs (CAPEX + OPEX) related to ship transport. Does not include loading and unloading. Entails a
number of assumptions, including capital costs, personnel, engine size, efficiency, speed, etc. Particularly
important variables include oil prices, and the % of time a ship sails back empty. In this analysis it is as-
sumed that Handymax, Panamax, and Wood chip Carriers sail empty, i.e. without return cargo, 15, 20, and
50% of the time respectively. As ships get bigger and more specialised, it is assumed that it will be difficult
to use them 100% of the time. 28 Based on a stowage factor of 54 cubic feet / tonne (1.5 m3/ tonne or 667 kg / m3) (Melin 2008) 29 Based on a heating value of 17.0 GJ/tonne 30 Based on today's fuel prices. In the future, these are expected to be higher and, therefore, will constitute a higher share of the total transport costs.

106 | Analysis of biomass prices, future Danish prices for straw, wood chips and wood pellets “Final Re-port” - 18-06-2013
Short Sea
In the Baltic Sea area, vessels that sail with wood chips typically have a maxi-
mum capacity of 2,200 – 2,600 tonnes, while ships sailing with wood pellets
typically have a capacity of up to 4,000 tonnes. These ships are usually 100-
110 meters in length and have a draft of 5-7 meters. In an earlier study car-
ried out by Ea Energy Analysis the cost of ship transport alone from a typical
Baltic harbour was estimated to be roughly 5.0 kr./GJ for wood chips, and a
little over half of that for wood pellets.
The size of short sea ships have traditionally been largely determined by the
size and capacity of port infrastructure in the Baltic countries. In recent years
some of these ports undergone renovations and can now easily accommodate
larger ships. It is likely that this trend will continue and that short sea vessels
in the future will be larger. On the other hand, some other players the in short
sea market, such as Copenhagen Merchants, indicated that it may not neces-
sary be cost effective to operate on the shorter distances with ships much
larger than those used today.
Table 38 takes the above transport cost figures and applies them to four se-
lected biomass supply regions, thus giving approximate costs of transport to a
Danish harbour for both wood chips and pellets.
From Wood chips (kr./GJ) Wood pellets (kr./GJ)
Maine, USA 13.7 4.1
Savannah, USA 17.1 5.1
Mobile, USA 21.3 6.3
Baltics 5.0 2.731
Table 38: Cost of shipping to a Danish harbour from selected biomass supply ports.32 Costs are for shipping alone, and do not include loading/unloading, port fees, etc.33
As revealed by the table, the transportation cost in kr./GJ terms is almost
twice as much for wood chips relative to wood pellets, with the difference
growing in accordance with the trip distance. The above figures are solely
transport costs, and as such do not incorporate the difference in FOB prices
which arise due to costs associated with drying and pelletizing wood pellets,
and the costs of heat treatment for North American wood chips.
31 Estimate 32The nautical shipping distances from the North American destinations to Denmark are 6,300 km. from Maine, 7,900 km from Savannah, Georgia and 9,800 km from Mobile, Alabama. 33 Ships are assumed to sail empty or partially empty part of the time (50% for small vessels, 15% for Handymax, 20% for Pannamax, and 50% for wood chip carriers.)
Transport costs:
selected examples
107 | Analysis of biomass prices, future Danish prices for straw, wood chips and wood pellets “Final Re-port” - 18-06-2013
Straw and other agricultural residues
While there is no specific limit on how far straw is transported from farm to
plant, the price of straw is sensitive to the transport distance, which is why
contracts are most often entered into with farms close to the plant.
For both straw and other agricultural residues it is not unthinkable that more
long distance transport could take place if sufficient financial incentives are in
place. However, one important difference between wood chips and straw is
that wood chips are well suited to bulk handling (i.e. conveyor belts or pneu-
matic transfer), whereas straw is transported in large bales. This makes the
handling of straw much more expensive, and according to a 2007 study, the
per tonne fixed costs (i.e. loading and unloading) for shipping straw is over 3
times higher than that for wood chips (Flynn, Searcy og Ghafoori, et al. 2007).
Another big drawback with straw is its extremely low energy density. Hay
bales typically have an energy density of 139 kg/m3 (equivalent to a stowage
factor of 7.2 m3/tonne) which means that vessels with extremely high ship
volume would be required to make long distance sea transport cost effective
on a kr./GJ basis (Videncenter for Halm- og Flisfyring 2002). If for example we
utilised the same chip carrier as outlined in Table 37, which had a wood chip
shipping cost of 2.12 kr./GJ/1,000 km, the costs of shipping hay bales with an
energy density of 139 kg /m3, and a moisture content of 15% would be 3.17
kr./GJ/1,000 km. Combined with the aforementioned higher costs associated
with loading and unloading the straw means that the initial input cost would
have to much lower for straw relative to woody biomass.
Due to the fact that shipping is usually limited by the volume of the vessel, in
computing the above transport costs two of the most important factors are
the aforementioned stowage factor, and energy content of the fuels. If we
combine these two factors we have the energy density per cubic meter as dis-
played in Table 39.

108 | Analysis of biomass prices, future Danish prices for straw, wood chips and wood pellets “Final Re-port” - 18-06-2013
Fuel Energy content
(GJ/tonne
Stowage factor
(kg/m3)
Stowage factor
(m3/tonne)
Energy density (GJ/m3)
Ship transport costs*
(kr./GJ/1,000 km)
Wood pellets 17.0 65034 1.5 11.1 0.64A
PKS 16.935 60036 1.7 10.1 0.70A
Wood chips 9.4 32537 3.1 3.0 2.17B
Straw 15.038 13939 7.2 2.1 3.17B
Table 39: Energy contents, volumes, and resulting energy density and transport costs for se-lected fuels. *Does not include loading and unloading, harbour fees, etc. AWith the panamax ship indicated in Table 37. B With the wood chip carrier indicated in Table 37.
The table explains why the transport costs for wood pellets are lowest, and
why transport costs are so much higher for straw than wood chips. Despite
the fact that wood chips and straw utilise a high volume chip carrier in the
cost calculations, due to their low energy content per m3, they still incur
higher transport costs.
As was noted earlier, palm kernel shells (PKS) are already today shipped over
long distances and as such they were included in Table 39. Their relatively
high energy content (in GJ/tonne) and stowage factors (in kg/m3), result in
PKS having a high energy density, and thus relatively low shipping costs (ex-
cluding loading and unloading). Looking forward, agricultural residues with
similar characteristics will be relevant to look at.
Other pellets
The transport of other pellets, whether they be torrefied or not, will be quite
similar to that of wood pellets, however there are some potential differences.
Firstly, depending on the material used, the pellets may have a higher energy
density, and as a result the GJ/ship ratio is higher, thus reducing transport
costs. The question for torrefied pellets for example will then be whether this
additional cost related to torrefaction can be recouped by the reduction in
transportation costs and/or through other benefits derived through utilising
torrefied pellets.
34 Interview with Norden, some other sources indicate higher figures, i.e. 705 kg/m3 (Melin 2008) 35 (Flynn, Searcy and Ghaffori, et al. 2007) 36 (West Biofuels n.d.) 37 See (Franceescato, Antonini and Bergomi 2008) 38 (Videncenter for Halm- og Flisfyring 2002) 39 (Videncenter for Halm- og Flisfyring 2002)

109 | Analysis of biomass prices, future Danish prices for straw, wood chips and wood pellets “Final Re-port” - 18-06-2013
If torrefied pellets prove to be hydrophobic in nature then one major differ-
ence would be that they would not have to be stored under cover, thus reduc-
ing the storage costs. In addition, this could potentially also allow for
transport on open barges, thus reducing the transport cost.
Traditional wood pellets also have risks associated with potential explosions
due to dust, and as a result dry bulk carriers are now installing CO2 systems in
their transatlantic ships. If the risks and problems with dust can be reduced
or eliminated via torrefaction this will lower the costs associated with both
transport and storage.

110 | Analysis of biomass prices, future Danish prices for straw, wood chips and wood pellets “Final Re-port” - 18-06-2013
13 References
AEA. UK and Global Bioenergy resource – Annex 1 report: details of analysis.
Report to DECC, Department of Energy and Climate Change, 2010.
AEA. UK and Global Bioenergy Resource - Final Report. Report to DECC,
Department of Energy and Climate Change, 2010.
Alexandratos, Nikos, and Jelle Bruinsma. WORLD AGRICULTURE TOWARDS
2030/2050, the 2012 revision. FAO, 2012.
Apostolaki, E., N. Tasios, A. DeVita, and P. Capros. PRIMES Biomass model
projections. Deliverable 5.7, Biomass Futures, 2012.
APX-ENDEX. ENDEX Wood Pellets. February 2013. (accessed February 14,
2013).
"Argus." Arugus Biomass Trading Conference. 2012.
Argus Biomass. Argus Biomass Markets: Issue 11 - 45. Weekly, Argus Media,
2011.
Argus Biomass. Methodology and Specifications guide. Guide,
Argusmedia.com, 2013.
Argus Media. Argus Media. March 2013.
http://www.argusmedia.com/~/media/Files/PDFs/Meth/argus_bioma
ss.ashx (accessed March 5, 2013).
Atanasiu, Bogdan. The role of bioenergy in the National Renewable Energy
Action Plans: a first identification of issues and uncertainties. Biomass
Futures Project, 2010.
Biomass Energy Centre. Summary of woodfuel standards. Woodheat
Solutions, 2012.
Boldt, Jørgen. Fremtidige priser på biomasse til energiformål. København:
Energistyrelsen, 2009.
Bruinsma, J. The resource outlook to 2050: by how do land, water, and crop
yields need to increase by 2050? . Rome: FAO, 2009.
Cocchi, Maurizio, Lars Nikolaisen, Martin Junginger, Jussi Heinimö, and
Douglas Bradlely. Global Wood Pellet Industry Market and Trade
Study. IEA Bionergy, 2011.
Concito. Reducerer brug af biomasse atmosfærens indhold af CO2 ? CONCITO,
2011.
Danish District Heating Association. Brændselsprisstatistik nr. 167. Danish
District Heating Association, 2012.
Danish District Heating Association. Brændselsprisstatistik nr. 168. Danish
District Heating Association, 2012.
Danish District Heating Association. Fuel price curves.
MEDLEMSINFORMATION, Danish District Heating Association, 2012.

111 | Analysis of biomass prices, future Danish prices for straw, wood chips and wood pellets “Final Re-port” - 18-06-2013
Danish Energy Agency. Energy Statistics 2011. Copenhagen: Danish Energy
Agency, 2012.
Danmarks Statistik. n.d. www.dst.dk.
DONG Energy. “Dong Energy.” Halm licitation. 1 December 2012.
http://www.dongenergy.dk/SiteCollectionDocuments/PDF_filer/Halm
licitation/Leveringsbetingelser%20AG,%201.december%202012.pdf
(accessed March 7, 2013).
E4tech. Biomass prices in the heat and electricity sectors in the UK.
Department of Energy and Climate Change, 2010.
EA Energianalyse and Wazee. Opdatering af samfundsekønomiske
brændselspriser – Biomasse. Prisfremskrivninger, København:
Energistyrelsen, 2011.
Ea Energy Analyses. Opdatering af Samfundsøkonomiske brændselspriser,
biomasse. Copenhagen: Ea Energianalyse, 2010.
EC. “DIRECTIVE 2009/28/EC OF THE EUROPEAN PARLIAMENT AND OF THE
COUNCIL of 23 April 2009 on the promotion of the use of energy from
renewable sources.” EUR-Lex. 23 April 2009. http://eur-
lex.europa.eu/LexUriServ/LexUriServ.do?uri=OJ:L:2009:140:0016:006
2:en:PDF (accessed February 15, 2013).
Elbersen, Berien , Igor Startisky, Geerten Hengeveld, Mart-Jan Schelhaas, and
Han Naeff. Atlas of EU biomass potentials. EU: Biomass Futures, 2012.
Endex. Endex Trading. 3 October 2012. http://www.endextrading.com/wp-
content/uploads/ENDEX-Rules-V20.3-201210-Appendix-C.10-Product-
specs-Wood-Pellets.pdf (accessed March 5, 2013).
Energianalyse, EA, and Wazee. n.d.
Energistyrelsen. “Samfundsøkonomiske beregnings-forudsætninger.”
Energistyrelsen. September 2012. http://www.ens.dk/da-
DK/Info/TalOgKort/Fremskrivninger/beregningsforudsatninger/Sider/
Forside.aspx (accessed Januar 31, 2013).
ENplus. ENplus. 2013. http://www.enplus-pellets.eu/ (accessed March 5,
2013).
Erb, Karl Heinz, et al. “Analyzing the global human appropriation of net
primary production.” Ecological Economics, 2009: 250-259.
Faostat. n.d. www.faostat.fao.org.
Fibreco. “Wood chips - Wood pellets.” Fibreco. January 2010.
http://www.fibreco.com/images/Brochure%20Vers2010Jan.pdf
(accessed February 13, 2013).
Flynn, Peter, Erin Searcy, Emad Ghaffori, and Amit Kumar. “The Relative Cost
of Biomass Energy Transport.” Applied Biochemistry and
Biotechnology, 2007: 136-140.

112 | Analysis of biomass prices, future Danish prices for straw, wood chips and wood pellets “Final Re-port” - 18-06-2013
Flynn, Peter, Erin Searcy, Emad Ghafoori, and Amit Kumar. “The Relative Cost
of Biomass Energy Transport.” Applied Biochemistry and
Biotechnology, 2007: 136-140.
ForestBioEnergy. “Supply of Forest Biomass for energy: determinants and
estimation.” Fact Sheet 6.1, 2007.
Franceescato, Valter, Eliseo Antonini, and Luca Zuccoli Bergomi. Wood fuels
Handbook. Handbook, Legnaro: AIEL, 2008.
Geiver, Luke. Biomass Magazine. 25 October 2012.
http://biomassmagazine.com/articles/8232/pellet-producers-group-
first-to-start-standards-program/ (accessed March 5, 2013).
Global Forest Resourcse Assessment. FAO, 2010.
Gregg, Jay S., and Steven J. Smith. Global and regional potential for bioenergy
from agricultural and forestry residue biomass. Springer
Science+Business Media, 2010.
Hedenus, Fredrik, Christian Azar, and Daniel J.A. Johansson. Energy security
policies in EU-25 - The expected cost of oil supply disruptions. Volume
38, Issue 3, Energy Policy, 2010.
Hedman, Jan. Prisbildning på biobränslen: förstudie. Vattenfall Research
report, Vattenfall, 1992.
Hillring, Bengt. “The Swedish wood fuel market.” Renewable Energy, 1999:
1031-1036.
Holst, Thomas, interview by Ea Energy Analyses. Danish Agriculture and Food
Council (January 2010).
IEA and DTI. Global Market for Wood Pellets and Price Development. IEA
Bioenergy Task 40, 2012.
IEA. International Energy Agency. 2012.
http://www.worldenergyoutlook.org/weomodel/documentation/
(accessed February 7, 2013).
International Energy Agency. World Energy Outlook 2012. International
Energy Agency, 2012.
Janzé, Paul G.F. “Handling Pellets – Things to Consider.” Biomass Handling . 3
October 2010. http://www.advancedbiomass.com/2010/10/handling-
pellets-%E2%80%93-things-to-consider/ (accessed February 13, 2013).
Junginger, Martin, et al. EUBIONET III - Solutions to biomass trade and market
barriers. EUBIONET III Project, Elsevier, 2012.
Kim, Sonny. Overview of GCAM. Pacific Northwest National Laboratory, 2010.
Klimakommissionen. Grøn Energi - vejen mod et dansk energisystem uden
fossile brændsler . Klimakommissionen, 2010.
Kofman, Pieter D. Preview of European standards for solid biofuels. Dublin:
COFORD, 2010.

113 | Analysis of biomass prices, future Danish prices for straw, wood chips and wood pellets “Final Re-port” - 18-06-2013
Koppejan, Jaap, Shahab Sokhansanj, Staffan Melin, and Sebnem Madrali.
Status overview of torrefaction technologies. Enschede: IEA Bioenergy
Task 32, 2012.
Lamers, Patrick, Martin Junginer, Didier Marchal, Peter Paul Schouwenberg,
and Maurizio Cocchi. Global Wood Chip Trade for Energy. IEA
Bioenergy, 2012.
Lundmark, Robert. Factor Demand and Price Sensitivity of Forest-Based
Biomass in the European Energy and Forest Sectors. Volume 1, Issue 3,
Journal of Natural Resources Policy Research, 2009.
Melin, Staffan. “What are wood pellets.” pellets-wood. 2008. http://pellets-
wood.com/what-are-wood-pellets-o39.html (accessed April 12, 2012).
Ministry of Climate, Energy and Building. The Danish Energy Agreement of
March 2012. Copenhagen: Ministry of Climate, Energy and Building,
2012.
Nidera. 2010.
O'Carroll, Cormac. Biomass pellet prices - drivers and outlook. What is the
worst that can happen? Presentation, London: Poyry Management
Consulting Ltd., 2012.
Olsson, Olle, Johan Vinterback, Anders Dahlberg, and Charlotte Porso. Price
mechanisms for wood fuels. Deliverable 3.2, Uppsala: EUBIONET3,
2010.
Pelkmans, Luc, et al. Impacts of sustainability certification on bioenergy
markets and trade. IEA Bionergy, 2013.
Pöyry. Evaluation of options to enhance the Nordic cooperation in the field of
solid biomass for energy purposes. Pöyry Management Consulting,
2012.
Pöyry Managment Consulting (UK). Availability and sustainability of biomass
supply options in selected global regions. Advisory Services -
Opportunities and challenges in global biomass markets, Pöyry
Managment Consulting (UK), 2012.
Pöyry. Pellets - Becoming a global commodity? London: Pöyry Management
Consulting, 2011.
Slade, Raphael, Saunders Robert, Robert Gross, and Ausilio Bauen. Energy
from biomass: The size of the lobal resource. London: Imperial College
Centre for Energy Policy and Technology and UK Energy Research
Centre., 2011.
Stetson, Stephen. “Woodchip exports from USA and phytosanitation.” Argus
Biomass Trading Conference. London, 2012.

114 | Analysis of biomass prices, future Danish prices for straw, wood chips and wood pellets “Final Re-port” - 18-06-2013
Strauss, William. An Analysis of the Future of Natural Gas Prices and Wood
Pellet Prices: Natural gas will become much more costly than wood
pellets. FutureMetrics, 2012.
Sveaskog, Vattenfall, Södra, and European Climate Foundation. “Biomass for
heat and power - Opportunity and economics.” 2010.
The Danish Ministry of Climate, Energy and Buildings. Our Future Energy.
Copenhagen: The Danish Ministry of Climate, Energy and Buildings,
2011.
The Geological Society of America. n.d. http://www.geosociety.org/ (accessed
March 15, 2013).
Videncenter for Halm- og Flisfyring. “Bioenergi.” Udstilling på Agromek 21 - 26
Januar 2002. 2002.
Weick, Larry. “Zilkha Black Pellets.” Argus Biomass Trading Conference.
London, 2012.
West Biofuels. Palm kernel shells. n.d.
http://www.palmkernelshell.com/characteristics.html (accessed
February 11, 2013).
Wise, Marshall, and Kate Calvin. GCAM 3.0 Agriculture and Land Use:
Technical Description of Modeling Approach. Report for the US
Department of Energy, Pacific Northwest National Laboratory, 2011.

115 | Analysis of biomass prices, future Danish prices for straw, wood chips and wood pellets “Final Re-port” - 18-06-2013