analysis of cap ~i rf - nasa
TRANSCRIPT

8 I 8 1 8 8 ~I 8 ,I I 1 8 8 I I 8 8 1 1
ANALYSIS OF POLAR CAP ABSORPTION EXZXTS 11. TIME RELATION OF M O R FLARES
AND RF EMISSIONS CENT-
By .IR Fred C. Jonah
LTV Astronautics Division
Report No. 00.802 ---HQasws6
LTV ASTRONAUTICS DMSION LTV AEROSPACE CORPORATION
F i r st Quarterly Report Prepared Under Contract NAS 9-4911
Supplemental Agreement 1 with National Aeronautics & Space Administration
Manned Spacecraft Center

1.0
1.1
1.2
1.3
1.4
1.5
2.0
2.1
2.2
2.3
2.4
3.0
3.1
3.2
3.3
4.0
4.1
4.2
RESULTS AND ccNcLus1oNs
Flares and RE' Peak M s s i o n s
Flares and Sunspot Areas on Flare Day
Flares and Sunspot Magnetic Class on Flare Day
Percentage of the Flares i n Each Classification
CLASSIFICATIm OF lElpoRTANcE 3 AND 3+ FLARES
All Flares of Importance 3 and 3+
Importance 3 and 3+ Fla res Followed by a PCA Event
Importance 3 and 3+ F l a r e s 'Followed by Very small PCA Events
Importance 3 and 3+ Flares Not Followed by a Known PCA Event
Flares Followed by Important PCA Events
Flares Followed by Very Smal l PCA Events
Flares of Importance 3 and 3+ Not Followed by PCA Events
Probability that an Importance 3 or 3+ Flare W i l l or Will not be Folluwed by a PCA Event
SUNSPOT GROUP AREA AND MAGNETIC CLASSIFICATION ONFWDAY
Sunspot Area on Flare Day
Sunspot Group Magnetic Classification on Flare Day
SOURCES
APPENDIX A i
Page 1
5
10
12
13
13
16
19
30

8
1
1.1
1.2
1.3
1.4
1.5
1.6
1.7
2
2.1
2.2
2.3
3
3.1
Master L i s t of All Importance 3 and 3+ Flsres 1%4=1963
Number of Importance 3 and 3+ Flares and Associated PCA Events
Page
21
6
Classification of a l l Importance 3 and 3+ Flares i n Terms of the Algebraic Sign of A t 12
Distribution of Sunspot Areas for a l l Importance 3 and 3+ FLarres and Those Followed by a PCA Event 13
Distribution by Years of Importance 3 and 3+ Flares w i t h the Area of the Sunspot G r o u p on Flare Day 14
Distribution of Importance 3 and 3+ Flares Followed by a PCA Event with the Area of the Sunspot Group on Flare Day 15
Distribution of Importance 3 and 3+ Flares with Sunspot Magnetic Classification an Flare Day 17
Distribution of Irrrportance 3 and 3+ Flares Followed by an Important PCA Event with Sunspot Magnetic Class 18
Importance 3 and 3+ F l a r e s Followed by Important PCA Events
23
Relation Between the Intensity of the PCA Events and t h e Algebraic Sign of A t 7
Relation Between the Peak Intensity of the RF Flux and the S i g n of A t 8
Relation Between the Intensity of the PCA Events and Peak Intensity of RF Emissions 9
Importance 3 and 3+ Fla.res with Reported S m a l l PCA Events
25
A t for Flares Followed by SnaU PCA Events 10
ii

I I 8 1 1
4
4.1
A-1
A-2
A-3
A-4
Page
Importance 3 and 3+ Flares with No Known 26 Associated PCA Event
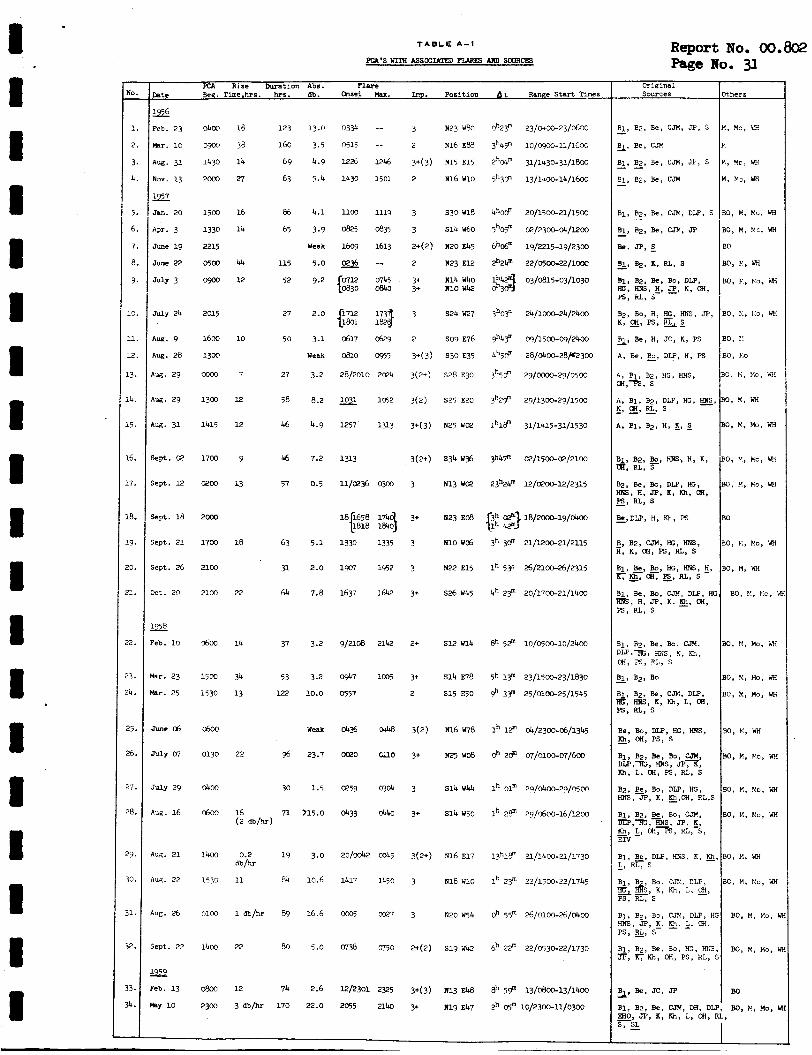
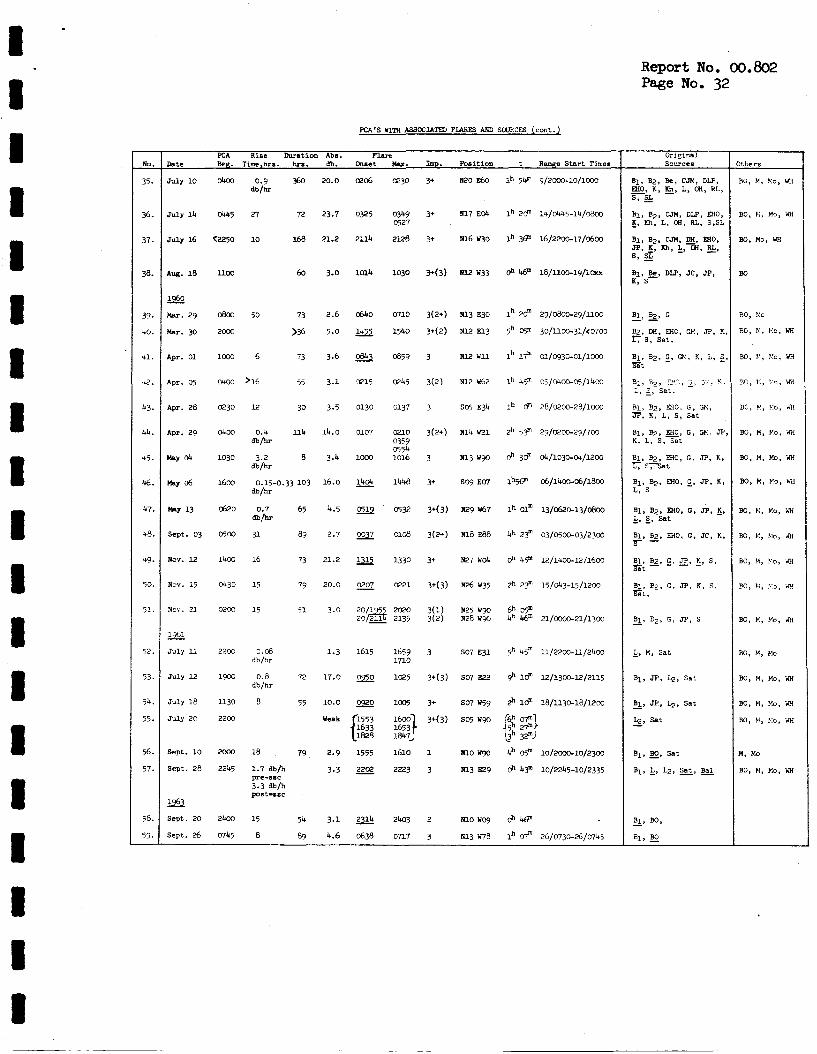
Rela.tim Between the Intensity of the Rp Flux and bt u. Master L i s t of PCA Events with Associated Flazes and Sources
31
Sources Used for Polar Cap Absorption Data 33
S m a l l PCA's Reported by Two or More & m n d e n t - 14 Observers
PCA's During 1960 Reported by Gregory Only 35
iii

I c
R e p o r t No. 00.802 Page No. 1
1.0 RESULTS AND CONCLUSICNS
This sttlay has Seen devoted t o the analysis of 142 flares
tha t w e r e observed during the years 1954 thraugh 1963, and assigned an
importance of 3 or 3+ in the McMath-Hulbert Working L i s t .
studied the relationship of these flares t o all known radio frequency
emissions at 1500, 2000, 2800, 2980, 3000, and 3750 Mc/s, that occurred
at the time of the flare.
sunspot groups on flare &y, and the age of the associated plage region
i n solar rotations have been considered.
1.1
W e have +
The area and magnetic classification of the
TIME RELATION OF FLARES AND RF' EMISSIONS
We find that fo r flaxes followed by an important PCA event
the time of RF peak intensi ty coincided with or followed the time of
the f lare maximum intensity ( A t ? 0) i n 76.5% of the cases; while
A t < 0 fo r 92$ of the flares not followed by a PCA event.
1.2 FLARES AND RF' PEAK EMISSION
The FP peak intensity exceeded 500 x w (rn2c/s)-l for
87'$ of the flares that were followed by a PCA event while the f lux was
less than 500 x W (xn'c/s)-' for 7% of the flares not followed by
a PCA event (including cases where the flare occurred during the nonnal
observing time of at least one observatory and no flux was reported).
1.3 FUIRES AND SuNspoT AREAS CX? FLARE DAY
O f the major flares during 1954 through 1959, 71.s
occurred i n sunspot groups that on flare day had an area 3 500 millionths
8 Report No. 00.802 Page No. 2
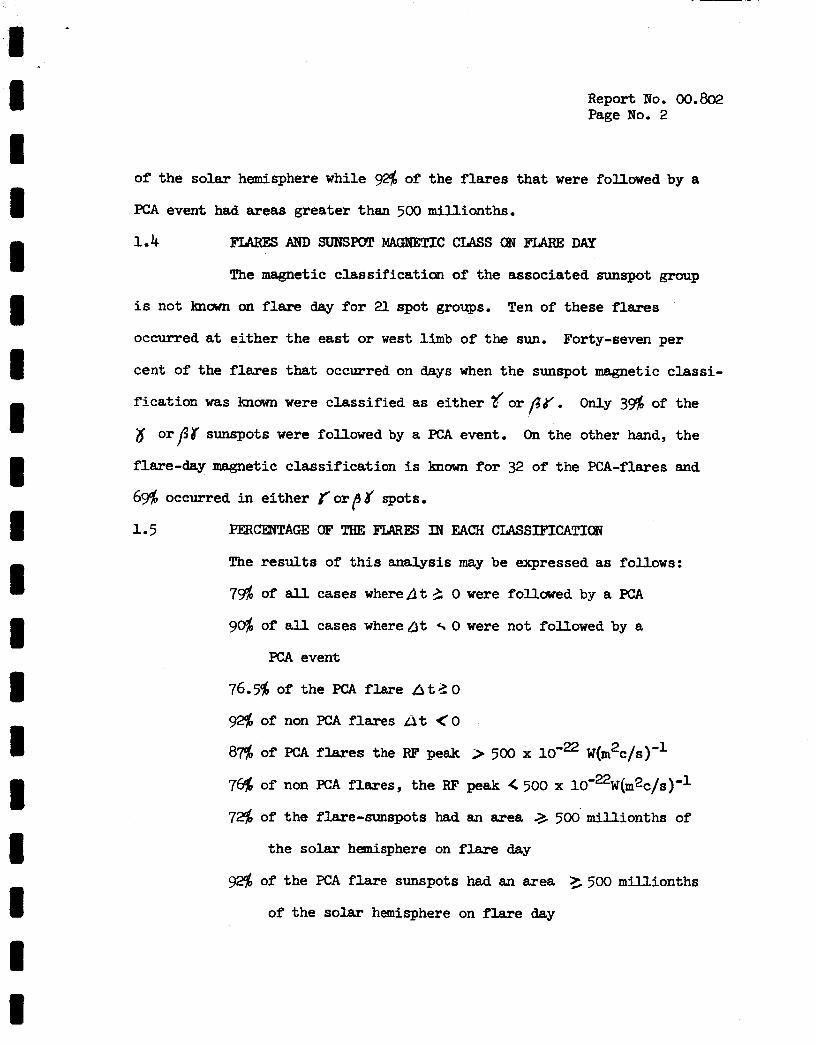
of the solar hemisphere while
PCA event had areas greater than 500 millionths.
of the flares that were followed by a
1.4 FWSES AM, SUNSPOT M4-c CLASS (E? Fww3 DAY The magnetic classification of the associated sunspot group
is not known on flare! day f o r 21 spot groups.
occurred at ei ther the east or west limb of the sun.
cent of the f l a r e s tha t occurred on days when the sunspot magnetic classi-
f icat ion was known were classified as e i ther 'f or /3&' . Only 3 6 of the
8 orFr sunspots were followed by a PCA event. On the other hand, the
flare-day magnetic classification is known fo r 32 of the PCA-flares and
69$ occurred in ei ther t 'o rpd ' spots.
1.5 PERCENTAGE OF T€E F'LARES IN EACH CLASSIFICATION
Ten of these flares
Forty-seven per
The results of t h i s analysis may be expressed as follows:
7~ of all cases wherebt 6 0 were followed by a PCA
9@ of all cases whereht 5 0 were not followed by a
E A event
76.5% of the PCA f la re at2 0
929% of non PCA f lares at t o
8 6 of PCA f l a r e s the RF peak > 500 x looE W(m2c/s)-l
769 of non PCA f la res , the RF peak < 500 x 10'22W(m2c/s)-1
729% of t h e flare-sunspots had an area a 500 millionths of
the solar hemisphere on flare day
92$ of the PCA f la re sunspots had an area >, 500 millionths
of the solar hemisphere on f l a r e day
I I U I I 1 I I I I t I I 1 I
Report No. 00.802 Page No. 3
47$ of the flare sunspots had a or ,4'# classification
~n flare day
6 6 of the PCA flare sunspots had a r or f I y classification
on f W e thy
N m :
during a meeting of the Joint MSC-GSFC Working Group on Space Radiation.
Dr. Prince suggested that the time difference between the maximum of the
lU? emissions and the optical H-alpha maximum should be investigated.
This study was based on a suggestion by Dr. Helen Dodson-Prince

1 I I I I I I 1 1 I I 1 I t I 1 I I
Report No. 00,802 Page No. 4
2.0 CIASSIFICATIm OF IMPORTANCE 3 AND 3+ mAREs
The 142 flases with Lmpurtw-ce 3 or 3+ i n the MWth-Hulbert
working l ist of flares (Table 1 ) were placed i n three groups:
(1)
(2)
Flares followed by an important PCA event (Table 2).
Flares followed by a s m a l l or very small PCA event
(Table 3).
(3) Flares not followed by a known FCA event (Table 4).
ALL FLARES OF IMPORTANCE 3 AND 3+
Table 1 lists all flares of importance 3 or 3+ that occurred
2.1
during the years 1954 through 1963.
We have included the McMath Plage Number and plage age i n
rotations, the M t . Wilson sunspot number, the M t . Wilson magnetic classi-
f ication, the sunspot area based on the Royal Greenwich Observatory
photoheliographic results, and the Zurich classification are given for
flare day when the values are available.
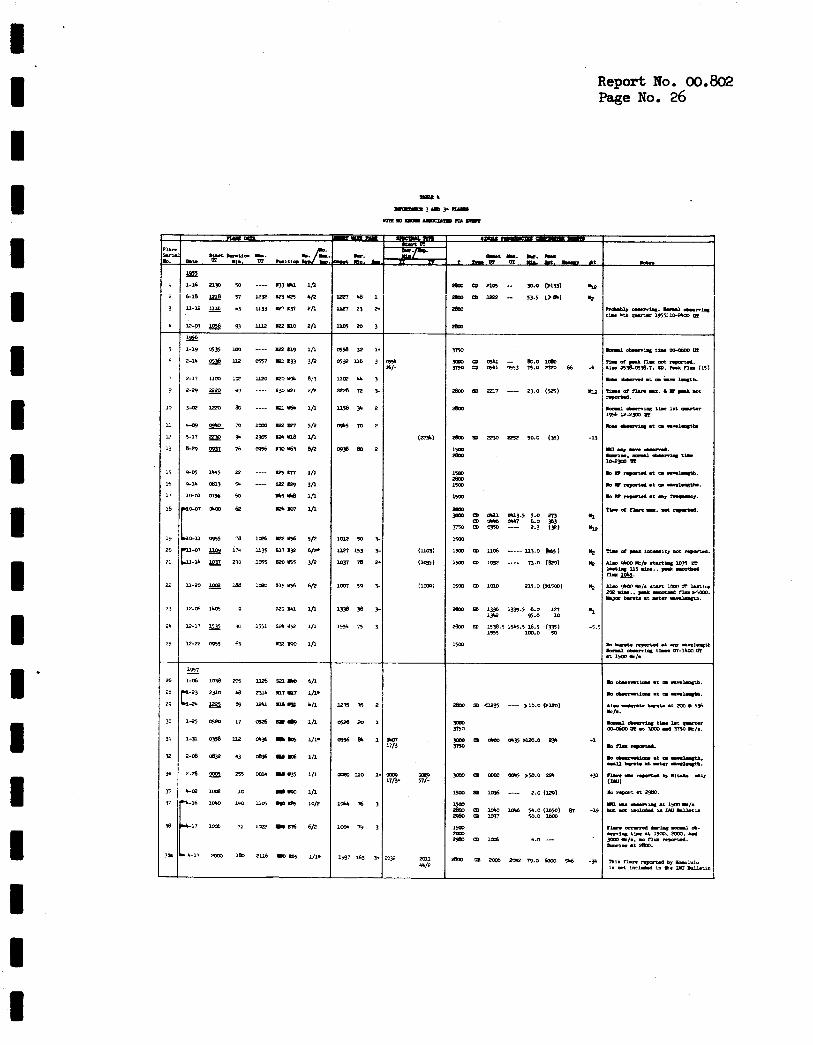
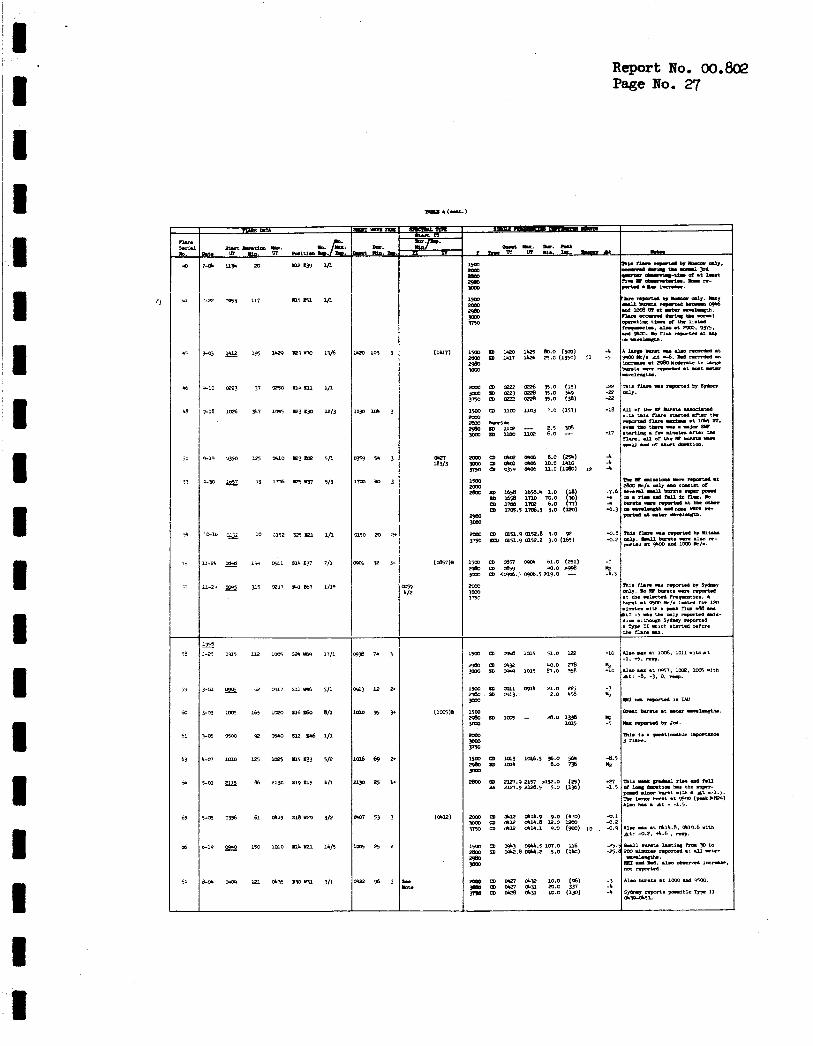
2.2 IMPORTANCE 3 AM) 3+ FLARES FOLLOWED BY A PCA EVENT
Table 2 lists al l f lares of importance 3 or 3+ tha t were
This table in- followed by an important PCA event (from Table A-1).
cludes the flare, PCA, and shortwave fade data. It also includes a l l
known spectral emissions of Type II and Ill associated with the flare,
and single frequency data for frequencies 1500, 2000, 2800, 2980, 3000,
and 3750 Mc/s.
above lo$ of the peak flux in units of
We have also included the value of the RF burst energy
joules (m2c/s)” for 2800

and 375 Mc/s when a value is given i n the NAS
R e p o r t No. 00,802 Page No. 5
Program Apollo working
paper No. 1193 (January 28, 1w). is the time of the RJ? burst peakminus the t ime of flare maximum intensity.
2.3
The time difference i n minutes A t
3 " C E 3 AXD 3+ FIARES FOIUMED BY VERY SMALL PCA EVENTS
Table 3 lists the reported small PCA events that were not
included in Table 2 and those that were derived by Gregory based on the
use of high sensi t ivi ty ver t ica l incidence back sca t te r sounding of
the lower ionosphere at a frequency of 2.3 Mc/s.
2.4 IMPORTANCE 3 AND 3+ FLARES NOT Fy)LLcTwED BY A KNOWN PCA EVENT
Finally Table 4 l ists all importance 3 and 3+ flares that were
This table gives a l l of the reported not followed by a known PCA event.
radio emissions i n the frequency range f r a n 1500 t o 3750 Mc/s range as
we= as short wave radio fadeouts and reported spectral emssions of Type I1
and Type I V .
The number of importance 3 and 3+ flares for each year and
the number followed by PCA events is sunmaxized i n Table 1.1.
that approximately 2* of the flares were followed by a PCA event i f the
E A ' S reported by Gregory only are not included.
This shows
For the purpose of uur analysis of the difference (A t )
between the time of RF emission peak flux and the time of the flares
maximum intensi ty we have grouped the sma l l PCA events w i t h the flares
not followed by PCA's.

i 8 I I 8 U I I E t C I I I t 1 I t I
TOTAL
No. of Flares
CmP. 3, 3 + 4
21
32
20
32
19
10
2
2
142
Report No. 00.802 Page No. 6
PCA With S m a l l Gregory PCA PCA
0 0
2 0
ll 1
6 0
6 1
7 1 7
5 0
0 0
1 0
38 3 7
TABLE 1.1 Number of Importance 3 and 3+ Flares and Associated PCA Events

I 1 8 I 1 1
3.0
Report No. 00.802 Page No. 7
RELATIONSHIP OF FLARE MAXIMUM INTENSITY AND PEAK RADIO FLUX I"sm
3.1 FLARES FoJamED BY m m m PCA EMOTS
This list contains 38 PCA events, that w i t h one exception,
are included in one or more of the catalogues by Bailey, Modisette,
Malitson, and Warwick and Haurwitz (Table A-2). Four of the events
(Numbers 12, 17, 18, and 55, Table A-2, Flares Numbers 43, 47, 49,
and 156, Table 1) were reported with a weak absorption and the i r in-
clusion i n Table 2 rather than Table 3 is quite arbi t rary.
A l l of the flares in t h i s group were followed by a short
wave radio fadeout and radio emissicms at one or more of the frequencies
between 1500 and 3750 Mc/s.
the f l a r e and the RF' emission are reported f o r 34 of the events.
The time of the maximum in tens i ty of both
The time of the RF' maximum occurred simultaneiously wi th
or a f t e r the f l a r e maximum ( A t 5 0 , where 3t = time of RF maximum
minus the time of the flare maximum) fo r 26 of the events (76.58)
(Table 2.1). The eight cases where A t < 0 w i l l be discussed in de ta i l
l a t e r when other factors w i l l be considered.
I 1 I 1 Unknown Positive Zero Ne gat ive T o t a l I
6 t o f 10
0 6 2 2 3 6 0 3
0 2 0 1
10 I 2
3
TABLE 2.1 Relation Between the Intensity of the PCA Events and the Algebraic Sign of A t
I Report No. 00.802 Page NO. 8
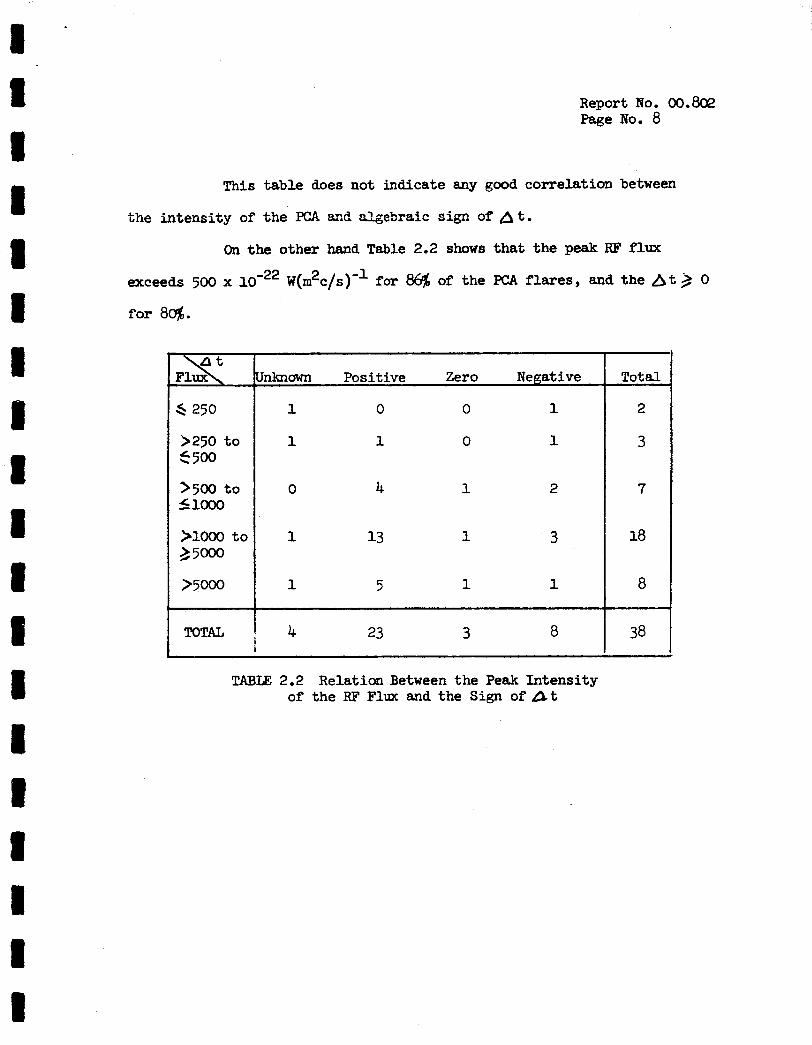
This table does not indicate any good correlation between
the i n t e ~ s i t y of the PCA as,d algebraic si@ of t.
On the other hand Table 2.2 shows that the peak Rp flux
exceeds 500 x W(m2c/s)'' for of the PCA flares, and the A t 3 0
TOTAL
Jnknawn Positive Zero Ne gat i ve
1 0 0 1
1 1 0 1
0 4 1 2
1 13 1 3
1 5 1 1
4 23 3 8 -
TABU 2.2 Relation Between the Peak Intensity of the RJ? Flux and the Sign of At
Total
2
3
7
18
a
38

I
! @
rbs.db. x 5 3
>3 t o 6 6
> 6 t o 5 10
? 10
I
Report no. 00,802 Page No. 9
~ 2 5 0 t o >500 t o 310oO t o $250 < 500 5 1000 r' 5Ooo ,5000
1 2 3 4 0
1 1 3 7 0
0 0 0 3 0
0 0 1 4 0
2 3 7 18 0 I mAL
T a t d
10
12
-
3
13
TABLE 2.3 Relation Between the Intensity of the PCA Events and Peak Intensity of RF Emissions
Table 2.3 does not indicate any good correlation between the
intensi ty of the PCA absorpticm and the peak flux of the RF emission.
3.2 FLARES FOLLOWED BY VERY SMALL PCA EVEXITS
We have ten events i n this group of snaU or very small PCA
events including seven events derived by Gregory based on the use of high
sens i t iv i ty ver t ical incidence back sca t te r sounding of the lower ionosphere
at a frequency of 2.3 Mc/s.
The times of both f lare maxll~l * um and RFpeak flux at one or
m c r e of the f'requencies i n t h e range from 1500 t o 3750 Mc/s are known
f o r nine of the events.
RF maximum follows the flare maximum (At 2 0) while major RF bursts were
reported (flux 2500 x
At was negative.
I n th i s case w e f ind only two events where the
W n ~ - ~ ( c / s ) - ~ ) for three of the cases where

'I t 8 I
Report No. 00.802 Page No. 10
I Unknown Positive Zero Negative \Qt I Flux
t Total
1 , 5 0 0
>, 500 t o < ~ O O o
> lo00 0
T(TrAL
TABU 3.1 & t fo r Flares Followed by Small PCA Events
1 0 0 4 5
0 1 0 2 3
0 1 0 1 2
1 2 0 7 10
Because of the probable very low absorption during these
events we w i l l combine these flares with those not followed by PCA
events . 3.3 FLARES OF IMPORTANCE 3 AND 3+ NOT F0IJX)WED BY PCA EvENlls
Thirty-eight of the flares of importance 3 or 3+ were followed
by important PCA events and ten more have been assoicated with very
small events. I n addition three of the PCA events occurred within three
hours of the associated PCA f l a re and may have contributed t o the in-
tens i ty of the PCA event (flares s, 100, and 137) although i n two
cases (95 and loo), the start of t h e flare followed the reported start
time of t h e PCA.
not followed by a known PCA event (Table 4).
This leaves 91 importance 3 and 3+ fWes that were
We find that eleven f la res occurred during the normal ob-
serving times of two or more RF frequencies and eight during the normal
observing t h e of at least one RF' frequency w i t h no increase i n flux
reported .
I

Report 00.802 Fkge No. ll
t
I t I 1 I I I t 1 8 8 I
There was no known RF observations at the times of f ive
flares (ambers 7, 11, 26, 28, md 32).
The times of flare maximum and/or RF peak intensity is not
reported fo r 13 flares. The values of A t for the 54 flares fo r which
the times of flare maximum and RF peak intensity is negative f o r 49 of
the flares. If w e assume that a t l ea s t one observatory was observing
at the time of the II f la res that occurred dur ing the observing times
of two or more frequencies, we have 60 (and possible 68) cases where
A t was negative or no RF flux w a s emitted as shown in Table 4.1.
see that fo r the importance 3 and 3+ fWes tha t were not followed by
a PCA event there was probably no R F emissiagl from eleven (and possibly
l9) , and the RF emission was less than 500 x loo2* W (m*c/s)'l for 47
We
of the f lares .
lo known zn obs.
?o flux :eported
> 500 t o 4 lo00
No Flux Unlslown Positive Zero Negative
5
19
10 4 1 32
2 0 0 5
1 0 0 I 2
!WAL I 19 18 4 1 49
Total
5
19
47
7
13
91
TABLE 4.1 Relation Between the Intensity of the RF Flux and b t

Report No. 00.802 Page No. 12
Others * Three of d e PCA events may have been influenced by two major f la res , 4 64 ll, 0 3 29 c 23
7%- 90$ b!AL 1 ACCURACY ,PRowuITy
We also f ind thatetwas negative (the time of the RF f l u
maximum preceded the time of f lare maximum) in 92$ of the cases where
the times of both maxima were knawn,
The fwr cases (Flares 34, 48, 54, 48) where At > 0 and the
one case of d t = 0 riii be &ned in Getail later.
If we include the nine cases where (Table 3 and 3.1) very
smaJ.l or doubtful PCA events were reported with the 65 cases f’rm
Table 4 and 4.1, we find that i n 9U$ of the cases the time of RE’ emis-
sion peak precedes the time of flare maximum.
3.4 PROBABILITY !I!HAT AN IMPORTAMX 3 OR 3+ FLARE WILL CB WILL NOT BE FOU(MED BY A P C A EVENT
Table 1.2 shows that if we include all cases where A t 3 0,
Similarly, the
when A t < 0, o r no flux is reported when the flare occurs during the
normal operating time of two or more frequencies (ll flares), the flare
w a s not followed by a PCA event in 90$ of the cases.
f l a r e w a s followed by a PCA event i n 7s of the cases.
Non-PCA Flaxes
Important PCA
Total Number
91
10
38
No Flux Unknown Positive Zero Negative Reported
18 4 1 49 1 1 8
1 2 0 7 0
4 23 3 8 0

Report 00.802 F%ge No, 13
unknm EL, WL sunspot 500 t o 1000 t o 1500 t o or Not Area < 5 0 0 (lo00 (1500 42000 a2000 Observed
I
4.0
4.1
SUNSPOT GROUP AREA AND MAGXEZIC CLASSIE'ICATION ON FLARE DAY
SUNSPm AREA ON FLARE DAY
FFZS
The 142 flares of importance 3 or 3+ were observed i n 101
30 33 22 14 5 5
2 12 7 3 1 0
different sunspot groups. O f the lOg flares reported during 1 9 5
area equal t o or greater than 500 millionths of the solar hemisphere.
The distribution wi th sunspot mea is shown i n Table 1.3.
Twenty-three of the 25 major flares that were followed by
a PCA event occurred i n a sunspot w i t h an mea greater than 500 millionths.
TABJX 1 .3 Distribution of Sunspot Areas for A l l Enportance 3 and 3+ Flares
and Those Followed by a PCA Event
During t h i s period 23 of the sunspot groups were the source
of two or more major flares. In eleven cases at least one of the f h e s
w a s followed by a PCA event.
We have limited the correlation of flares t o sunspot mea
t o the period through 1959 f o r which w e have Greenwich Observatory d a i l y
sunspot area data.
MYI'AL
FCA
500 t o lo00 t o 1500 t o c 500 41OoO (1500 42000 a2000
0 3 1 0 0
6 5 4 5 0
Il* 10 4 2 3
4 9 3 4 0
9 6 10 3 2
2 1 1 1 0
1 0 1 0 0
0 1 0 0 0
33" 35 24 15 5
3 14 a 4 1
Report No. 00.802 Page No. 14
unknown
0
1
2
0
2
3 2
1
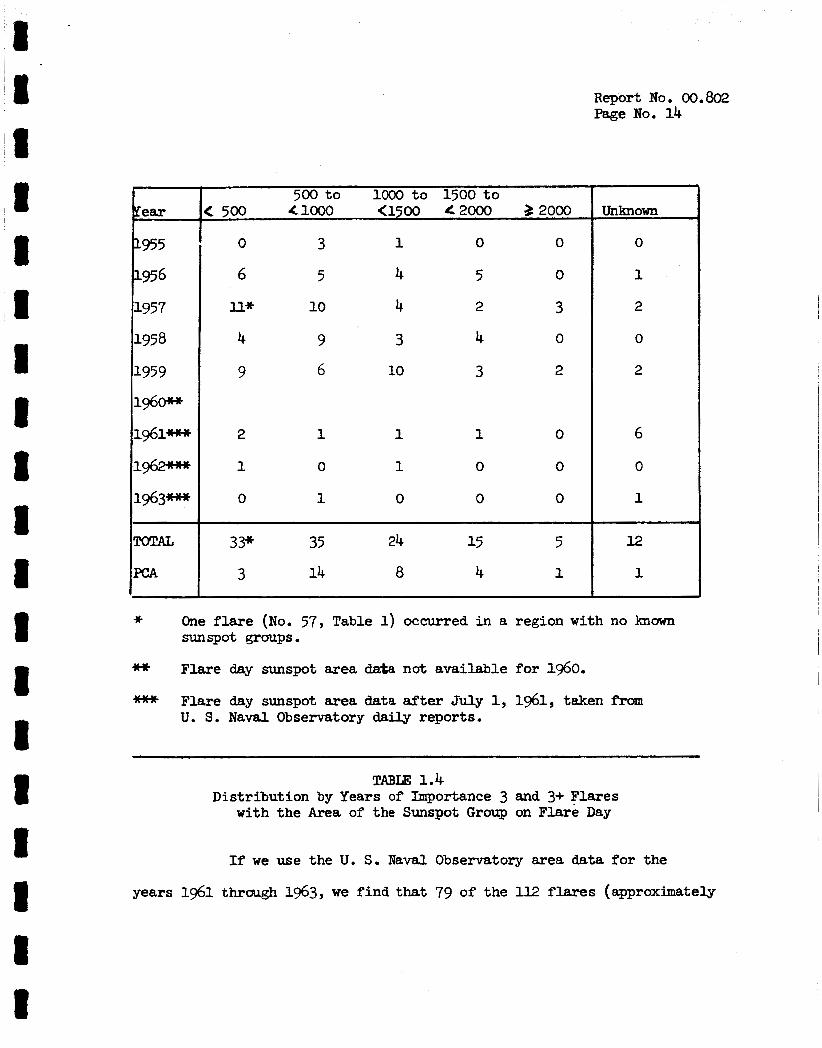
* One flare (No. 57, Table 1) occurred in a region with no known sunspot groups .
* Flare day sunspot area dah not available for 1960.
Flare day sunspot area data after July I, 1961, taken from U. S. N a v a l Observatory daily reports.
TABLE 1.4 Distribution by Years of Importance 3 and 3+ Flares
with the Area of the Sunspot G r o u p on Flare Day
If w e use the U. S. Naval Observatory area data fo r the
years 1961 through 1963, we f ind that 79 of the 112 flares (appraximately
Report No. 00.802 Page Bo. 15
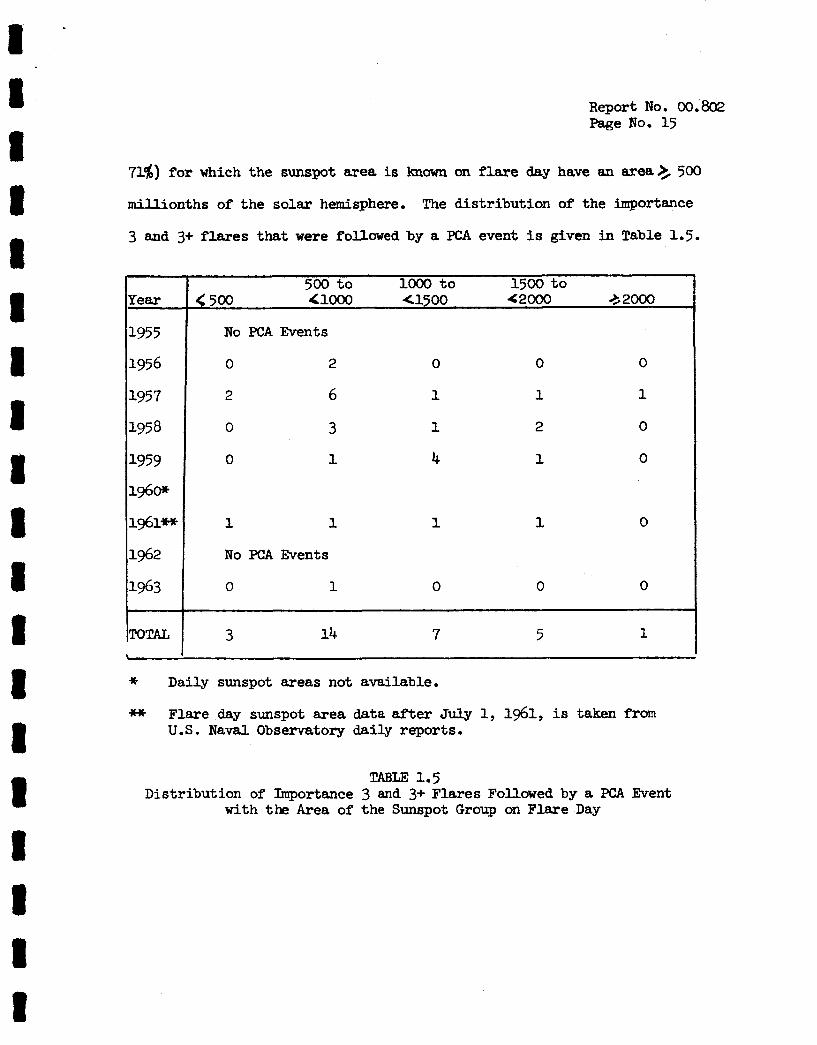
71$) for which the sunspot area is known on flare df~y have an area a 500
millionths of the solar hemisphere. The distribution of the importance
3 and 3+ flares that were followed by a PCA event is given in Table 1.5.
500 t o lo00 t o 1500 t o < 500 <lo00 41500 42000 32000
No PCA Events
0 2 0 0 0
2 6 1 1 1
0 3 1 2 0
0 1 4 1 0
1 1
No PCA Events
0 1
1 1 0
0 0 0
3 14 7 5 1
* Daily sunspot areas not available.
* Flare day sunspot area data af'ter July 1, 1961, is taken from US. N a v a l Observatory daily reports.
!l%BIZ 1.5 Distribution of Importance 3 and 3+ Flares Followed by a PCA Event
w i t h the Area of the Sunspot Group on Flare -Day
I .
Report N o . 00.802 Page N o . 16
4.2 SUNSPOT GROUP MAGNE2IC CLASSIFICATION ON FLARe DAY
The magnetic classification on flare day of the sunspot groups
associated with the importance 3 and 3+ flares is known for 121 of the 142
flares as shown i n Table 1.6.
Twenty-seven of the 30 PCA flare sunspot groups for which an
area on flare day is known had an area greater than 500 millionths of
the solar hemisphere.
sunspot area are known for 27 o f t h e PCA flares.
an area greater than 500 millionths and a 75 o r f l u magnetic classificaticn.
Both the sunspot magnetic classification and the
Nineteen of these had
Both the flare day magnetic classification and area are
known for 93 of t h e importance 3 and 3+ flares.
had a
millionths.
large and magnetically complex sunspot groups were followed by PCA events.
Forty-three of these
or /Sfmagnetic classification and an mea greater than 500
Only 4.4 per cent of the importance 3 and 3+ flares from 1

.
1
5
2
1
11
5
0
0
0
0
2
ll
4
7
3
3
1
1
3
10
6
14
8
4
3
1
1
0
2
3
1
1
5
2
0
0
25 32 50 14
Report No. 00.802 Page No. 17
UnlmaWn WL EL Not Rep
0
2
2
0
0
1
2
0
0
0 0
0 0
1 7*
0 0
2 3
0 1
0 0
0 0
0 0
7 3 11
* One flare (No. 57, Table 1) occurred in a region with no known sunspot group.
TABLE 1.6 Distribution of Importance 3 and 3+ Flares with Sunspot Magnetic Classification on Flare Day

t
8 I I I
TOTAL
m, All Major Flares Percent with PCA S m a l l PCA
1
2
0
4
2
0
None
0
none
0
5
2
1
1
3
1 0 0
9 13 8 2
25 32 50 14
36 41 16 14
2 3 2 2 - JTable 3) .
i l l 16 10 4 A l l PCA
Report No. 00.802 Page No. 18
Not WL EL Reported
0
0
0
0
0
0
0 0 0
2 0 3
7 3 11
28 0 27
0 0 1
2 0 4
TABLF, 1.7 Distribution of Importance 3 and 3+ Flares
Followed by an Important PCA Event with Sunspot Magnetic Class
The sunspot magnetic classification on fhre day is knuwn
for 121 of the importance 3 and 3+ flares.
ated with sunspots that on flare day had a 4 or f l l f magnetic classification.
Only 22 (39$) were followed by a PCA event.
Fifty-seven (47$) were associ-

8 1 1 I 8 1 1:
8 8 I 8 1 1 t 1 I 8 I
Report No. 00.802 Page No. 19
SOURCES
-. 1 Catdwies of Polar Cag Absorption Events
Bailey, D. K., "Polar Cap Absorption," Planet. Space Sci,, E ( 5 ) (1964) 9 495-541
( 1 w i t s o n , H a r r i e t m., "Tabie of Solar h-oton Events, i n - Solar Proton Manual, Ed. Frank B. McDonald, NASA TR-R-169 {Dee. l963), 109-117.
Modisette, J. L., T. M. Vinson, and A. C. Hardy, Model Solar Proton Environment for Manned Spacecraft Design, NASA, TND-2746, April 1965.
Warwick, C. S., and M, W. Haurwitz, "A Study of Solar Activity Associated with Polar-Cap Absorption," J. Geaphys. Res., 67(4) (1962) 9 1317-1332s
Other sources l i s t e d i n Table A-2, page 33.
2. Daily sunspot areas fo r the years 1954 through 1959 were obtained from the Royal Greenwich Observatory Bulletins - Photoheliographic Results
1955 - Published in 1958 1956 - Bulletin No. 14 1957 - Bulletin No. 26 1958 - Bulletin No. 60 1959 - Bulletin N o , 103
3. Solar Flare Data
Dodson, Helen W., and E. Ruth Hedeman, McMath Hulbert Observatory, Working L i s t of Flares.
IGY Flares, Solar Activity Report Series 12 (June 25, 1960) 1959 Flares, Solar Activity Report Se r i e sy5 (June 26, 1961) 1960 Flares, Solar Activity Report Series i8 (May 17, 1962) 1961 Flares, Solar Activity Report Series 21 (March 15, 1963) 1962 Flares, Solar Activity Report Series 5 - (April 1, 1964) Polax Cap and Related Data 4.
Jonah, F. C., Analysis of Polar Cap Absorption Events. I Effects of Solar and Solar Induced Conditions Prior t o the PCA Event, LTV Astronautics Division Report No. 00.740, 17 December 165 .

Report No. oO.802 Page No. 20
Jonah, F. C., Helen Dodson-Prince, and E. Ruth Hedeman, Solar Activity Catalogue for the 19th Solar Cycle, in 5 Volumes,
1 1954-1956, LTV Report 00.594 2 Year 2957, LTV Report 00.538 3 Year 1958, L W Report 00.503 4 Year 199, LTV Report 00.650 5 Years i960-l963, LTV Report 00.654

R e p o r t Iio. 00.802 Page No. 21
r c

R e p o r t No. 00,802 Page No. 22
-. r S F . .

1 I I - I 8 I 1
a
R e p o r t 100. 00.8Oe Page No. 23

II I I I I I I I I I I I I I I I I I I
Report No. 00.802 Page No. 24

1 Report No. 00.8@ Page No. 25
I I I 1 il I 8 I I 1 1 I I 1 I I I I
N N N m N N m N + .-.
D N f ' R e t w L3 8 2 n *
N
f F: i? 6 8 : 2 N 4 4 3
8 X
m m I c L L c I E L
9-05 lh5 22
9-lb 0813 5b
10-01 0756 bo
.l%W lloD 62
12-6 lbo3 9
12-17 m
12-zz Eqs5 63
4-11 1- R 1(pz I* R6 6 h
Report No. 00.802 Page NO. 26
1.
3
3
3
2
2
3
3
2
3
3
3
Lxllo l lo 1
l a I 3
Imr 79 3
1937 163 E
. .
5 9 61-
15W moo 1W
1W
9m cn CUI -3.5 5.0 m m OM6 -7 6.0 363 3?% W 0 3 0 --_- 2.3 (9)
ZBm BD 1336 1339.5 6.0 Ur i* 95.0 10
1 ~ 5 100.0 50 ZBX, SD 1538.5 15b5.5 l6.5 (335)
15m
jm, 3750
jm, m * * 3 5 > M . O w 1 3m
Report No. 00.8W Page No. 27
ZD
u 7
195
37
3"l
125
3
10
1-
3 5
(lU71
M 10313
10850s
Ip)
12
Iu
15m m 0857 09* 61.0 (251) rpes m a 5 9 kv.0 4 jmo m ' 6 . 5 aa6.5 m9.0 -- xn: 3 w 3750
+ I 8
*17
a 4 a
-7.6 .4 A e . 3
15.m en wll Wlb 21.0 2Ei * SD 0913.5 2.0 rss )am
raa w ~ ~ 7 . 9 2 1 5 7 > w . n Y m . 9 d . 5 5.0 Jg]

I Report No. 00.802 Page No. 28
I
18 13
5 3 I3
20 13.
16 '13
2.
3-
1
3
1.
3
I.
3-
2.
2
3-
2
2.
2.
1-
-' I
.2
1
1% SD a32 * 12.0 232 29% 3x0 CD W a32 c830 WQ 13.5 16.7 282 3lb
pm 15m

Report No. 00.802 Page No. 29
i n 9 u 3
752 108 3
ue 8.2
xu7 IXP I ) 7013
1741 1739 W E 35113
r m ) * W.311 RP-
1533 50/3
Iy.i lB39 ,612 6312-3
2Luo -- 15.E
1m.s _- ln.0 174S.B 60.0
135l.L 1355.L 50.0 1353.5 13% 20.0
1.6 N.O 9u1, r t . 153.8 m, 59.8 u.. -1. 0 I kl T1.U 155. .* . -1.4
i5m 2Bw . 1U.O hirilv -2 oMrrir.8 t U Qr M
m.0 Imp 23L 5 3 -5 A.2 Imo c tEo5 zw 8.0 110
3750 c ZZWl zxrp 6.0 Bo A
1500 s 1M.L 1420.1 1.5 3
28m L 2432 lbj6.3 1b.O 9 -14.7 A a n l b p , u 162). P5Wn.n-
Al.0 w M 10311 -1. bo . zzm zw.e 9.0
-92.1 Also 111435. u 1MD.7, ,240 .In., IlE 2 9 6 . a t - k . l
*,At=. 4.5 W3 E 1433 lLji.5 -79.7
1 I I 1 U I

I
Report No. 00.802 Page No. 30
AFTENDM A
For the sake of convenience we have included Tables 1, 2,
7, and 8 fran Source 4, as Tables A-1, A-2, A-3, and A-4.
F i
Report NO. 00.802 Page No. 33
1 I
- YO -
1
2
3
4
5
6
7
8
9
1s
11
12
.3
.4.
.5,
.6.
.7.
.8.
9.
io.
'1.
'2.
'3.
'4.
!j
35
'7
'8
'9,
IO.
:1,
12.
:3.
;4.
-
FCA Rise h u a t i o n Ahs. Flare Date Beg. Tia.e,hrs. hrs. db. Cmset Mnx. XmP . . Position dt Rnnqe Start Times
LZzi Feb. 23
War. 10
Rug. 31
Nsv. 13
195z Jan. 20
Rpr. 3
June 19
June 22
July 3
July 24
kw. 9
R u g . 28
U . 29
LW. 29
Lug. 31
kpt. 02
iept. 12
kpt . 18
sept. 21
tept. 26
k t . 20
22E 'eb. 10
lar. 23
!ar. 25
lune 06
ruly 07
ruly 29
Lw. 16
Lug. 21
'U?. 22
LUG. 26
mept. 22
9.22 'eb. 13
iay 10
0400
1430
2000
1503
1330
2215
0500
ogoo
2015
1600
1300
oooo
1300
1415
1700
0200
2000
1703
2103
2100
3500
1500
1530
o600
0130
0400
0600
1400
1530
3100
1403
o800
2300
18
38
14
27
16
14
44
12
10
7
12
12
9
13
18
22
14
34
13
22
16 (2
0.2 19
11 %
a b
1 dh/hr 89
22 80
12 74
3 dh/hr 170
123
160
69
63
86
65
u 5
52
27
50
27
58
46
46
57
63
31
64
37
53
E2
'36
30
71
13.0
3.5
4.9
5.4
4.1
3.9
Weak
5.0
9.2
2.0
3-1
Wemk
3.2
8.2
4.9
7.2
0.5
5.1
2.0
7.8
3.2
3.2
10.0
Weak
23.7
1.5
715.0
3.0
10.6
16.6
5.0
2.6
22.0
0334 -- 0515 -- l226 l246
1430 1501
0617 6 2 9
0810 0955
28/2010 2m4
a 1052
1257 1 9 3
1313
=/E36 0303
18 1658 174 {818 14
1330 1335
1907 1952
1637 16bz
9/2108 21b2
0947 1035
0557
0436 0448
we0 CLZO
0259 0304
0433 0440
20/0042 0045
1417 1450
5225 CQ27
0738 mjo
l2/2301 2325
2055 2110
3
2
3+(3)
2
3
3
2+(2)
2
3+ 3+
3
2
3+(3)
3(2+)
3(2)
3+(3)
3(2+)
3
3+
3
3
3+
2+
3'
2
3(2)
3+
3
3+
3(2+)
3
3
2+(2)
3+(3)
3+
N23 ii&
N16 E%
N15 E15
N16 W 1 0
S30 Wl8
514 w60
N 2 0 EA5
1123 EU
N14 W40 N 1 0 W42
524 w27
so9 ~ 7 6
S30 E35
S28 E30
S25 E20
N25 Yo2
534 w36
n i 3 wo2
N23 E08
til0 w c 4
N 2 2 E15
s26 w45
512 v14
S14 E78
515 E50
N16 W8
N25 w08
S14 W 4 4
S14 W50
Nl6 El?
Nl8 wlo
N 2 0 W54
s i 9 ,ab2
n i 3 ~ 4 8
Nl9 E47
lhlp 31/1415-31/1530
3h 3@ 21/1200-21/2ll5
l h 53h 26/2100-26/2315
4h 2? 20/1700-21/1400
eh 5 P 10/0500-10/2400
1p19" 2l/14W-21/1730
lh 2r 22/1500-22/1745
oh 55" 26/0100-26/db00
Sh 2? 22/0530-22/1730
OriKirl.%l Ssurces
Be, Bo, DLP, HG, HAS, E, 0% =, s
Bi, B2, Be, Bo, CJn, DIP,=, HNS, JP, K, Rh, L, O H , €5, RL, S
B1, E, DLP, HNS, K, L, RL, S
5. Be, Jc, JP
:hers
, nc, IX
, Mc. WH
, Me, w
>, !!, Ma, VH
>, M , Mt, UH 3
3 , K, 'JH
3, E, KO, -ai
3 , 1.;. I.:=, w
3 , 1:
3 , ).:o
I , I<, KO, irx
I , x , UH
), K, KO, .m
I , n, MG, w
1, M, KO,
1
I , I:, MO, w
1, 14, WH
BO, I.!, KO, i
3 , It, Mo, kW
3 , M, MO, m
3 , M, no, w
0, K, w
0, I, KO, w
0, K, NO, WH
0, K, No,
3, x , WH
3 , K, ko, WH
BO, M, KO, 1
BO, M, Mo, 1
Bo
BO, K, Mo, I
Report No. 00.802 Page No. 32
- No.
35.
-
36.
37.
38.
39.
40.
41.
42.
43.
44.
45.
46.
47.
48.
49.
50.
51.
52.
53.
54.
55.
56.
57.
58.
59. -
FtA'S U r n ASSDClATED PIARes AND SCURCES (cont.1
FCA Rise k t i o n Aba. P l a E Date Beg. Time,bra. bra. db. h a e t Hax. Imp. Position t Range Sta r t Times
July 10
July 14
July 16
Aug. 18
s?s hr. 29
War. 30
Apr. 01
Apr. 05
Apr. 28
AT. 29
k Y * r y r 6
MY 13
Sept. 03
mov. v
R X . is
Ne,. . 21
J u l y 11
Jilly 12
July 18
J u l y 20
Sept. 10
Sept. 28
s?3 Sept. 20
Sept. 26
0'445 27 72
CU50 10 168
lloc 60
C&X 50 73
Zoo0 >36
1003 6 73
040€ '16 55
0230 12 30
o400 0.4 114 db h
1030 3.2 8 ab/-
1600 0.15-0.33 103 db/hr
1400 16
0430 15
0200 15
2ooo 18
2245 1.7 d b h pre-sac 3.3 db/h pst-fisc
2400 15
0745 8
65
E?
73
7Q
51
72
55
79
54
89
20.0
23.7
21.2
3.0
2.6
5.0
3.6
3.1
3.5
14.0
3.4
16.0
4.5
2.7
21.2
20.0
3.0
1.3
17.0
10.0
Weak
-30
0349 0527
2 2 8
1030
0710
1540
0859
0245
0137
0210 0359 0554 1016
1448
0532
0108
1330
x 2 1
1615 1659 i n o 1025
2.9 1555 1610
3.3 2223
3.1 2403
4.6 0638 o n 7
3+ N20 E60
3+ m 7 ~ 0 4
3+ A16 0 0
3 SO7 E31
1 mowgo
3 m 3 p29
lh 5@ 9/2000-10/1000
lh 2dc 14/Wbi-lk/C&X
lh 3@ 16/22CG-17/600
oh WP 1 8 / 1 1 0 0 - 1 9 / 1 ~
gh 4$: l l /22Wll /2400
sh Id" 12/1300-l2/2115
9 1 9 18/ll30-18/1200
L, K, Sat
Xhera
BO, Y.. KO, W i
BO, I:, Mo, 'UH
BO, Mo, YH
BO
BO, No
BO, r.: , I.:O , UH
Bo, I., C O , mi
BO, l:, I'o, "4
BO. b!, 1.10, Mi
BG, X, Lo, Wn
Bo, !.!, no, UH
BO, M, Yo, UH
Bo, K, LO, 'W
Bo, K, 610, an
BO, r4, LO,
30, t.:, !?>, 'a
BO, L, YO, mi
BO, M , Mo
BO, H, Lo, UH
BO, PI, I:o,
I, No
BO, M, Io, UH

R
A
Bi
B;I 3e
Bo
Bo
m
DH
DLP
M O
Fd
GO
c
w,
3
H3
mis
J C
JF
K
Ktl
L1
L. I ’
f Y
1*:0
OH
Pa
x S
SL
iJH
Anderson
Pailey
Bailey
Besprorvkmayc
Bookin
Basler b Ouren
Collins, J e l ly h Natthcrs
Dodsm b Hedemn
Dvoryashin, Levitakii b Prnlnatov
%geland, Hultw-ist & Ortner
Freier & Webber
3osl i iy
OreCory
;reensta*t & !bretx
:e11
iiainva & Goh
Hakura, Ragai & Sam
Je l l / & Collins
Jenkins k Panhis
Kahle
Ktlocholava
kinbach
Leinbach
Ynlitson
Malitson k Webber
I h i i s e t :e
Obayash ?r Hakura
Pil;eott k Shapley
Reid k Leinbfich
Sinno
Snapley b Lincoln
i larvick h Haurwitz
T A B L E A-2
SOURCES USED m m m CAP R B S ~ I D R DATA
J. Ceophys. Res.
Planet. Space Sei.
J. Pnys. SOC. Jam
J. E % p . 3nr. ?*pan
3. Pnys. SOC. Japan
U. AlMaba CeophYB. -St.
Can. J. Fbys.
Ark. Geofyaik
Soviet Astron. A.J .
Ark. Geofysik
J . Geophys. Res.
J. Ceopbys. Res.
J. Geophys. Res.
J. jeophys. Res.
J. E y s . Scc. Japan
J. Rsdio Iles. lab. Japm
Rep. Ionnsph. Space Res. Japm Can. J. Pnys.
Can. J. Phys.
U. A l s g l a Seophys. Inst.
Ce5az. Aeroncny .
U. Alaska Geophys. Inst.
U. Alaska Geophys. Inst .
1ASA Til
NASA w
9 lz
17 A-1
17 A-1
17 A - l
R-152
- - - -
3.2 1 2 7 s
63
22
-
a 6 i
- - 17 A - 1
5
- - Y 4
41
R - l z ?
- -
2 - 1 A- 3.27
R - 1 2 6
R-160
R-169
Mamed Spacecraft Center Erq. Des. k Oper, Ed.Purser, e t .a l .
J. rmophp. Res. g Antarctica Res. Geophys. Mon.
7 - 6A J. Geophys. Res. - 11 J. Gemag. Cecelect.
AM. IGY 16
67 J. Geophys. Res. - -
3113-3148
u1-120
1801-laOj
1-10
280 pp.
1317-1332

Report NO. o0.802 Page NO. 34
:I-"< 003c
12-1: 1310
12-29 2300
1-3
3-11 ?4Y
- 3-14 2295
3-31 15%
i-l? - ix
1-26 liy.
- - I ? 1233
?-e2 *;:
1-11 2 2 3
;-25 31m
I&
* 11-13 ;iio
2-31 203':
k-15 1230
4 0 2
a
7 2 - 6
12 66
74
1s 46
30
63
2
-d
123
j.2
Jeak
2.6
Wemk
ileak
Yenk
4.4
i.i
very S-al
-1.5
E
2 db
2 db
1-26
I
134- 1132 2
0134 0137 2
2229 2230 2
0330 c&2 1
1454 1507 2
3113035 W14 2 3Of2345 2 3 7 1 31/153" KJ52 2 31fWXKi 9-31 2
I
2041 2 1 3 3
X25 -37 1+
14% 1U l+
w1 OgaT 2
1034 1125 2
A20 E41 17/03ml7/16CC H , E, FS N25 di0 28/2300-28/2400 H, Jc. 2
N l l EO2 11/03oO-ll/lOxI Be, J'. €5, 5
s21 USL 14/1503-14/22w Be, E, Tp&s,s
31/nc -3l/l6oC J C , 'Tp
Bi. BP. Be, WH JP, K, L i r €5, 1
s10 uy Sa? W 2 3 A31 E57
A16 U6l JC, Jp
817 E78 13/MXX-13/133> Be, JC. 5 ll? €53 S12 i i 2 NW yli N17 E21
9. M O . c 1 N22 E03 11/22W-l2/07CO B1. 4
13/16m-13/2030 J C , S
S22 U64 25/2100-26/2303 G, J C . E. K
3 6 5 1 2 1 8 61
yIn ~ 5 % 324
3 6 6 l2140 10
3101 1???5 2 l l
11314 12855 313
UYl l2874 263
4449 13016
1 3 6 3
44% !fi%l WIRL
S
W6q 13878
14211
-354 14414 5340 5344 734r
+527 lUOb0
5858 15043
6261, 15461
6 9 6 15507
67% 15714
N36
Sl'i
ni'
Sli
s72
s13
n23
S24
AIS
N22
R11
SI5
S13
N17
N17
l a 2
Klo
SlO
am
N 1 0
s1;

w -.. G2 1-15 03
C3 2-7 07
C 4 2-15 10
Gj 2-29 16
00 3-10 18
G7 3-17 18
w
Cll 4-15 10
...I
C16 5 4 9 OB
u
Gl8 5-1, 15
Glg i-20 10
W'3 6-Ol 14
C2l 0-15 10
622 -25 17
023 6-21 23
2 4 6-28 19
325 8-11 24
326 9-26 10
UI
Y
1
4
4
8
2.5
3
4
> 3
2
3
6
2
> 2
>1
1.5
7
5
10
E
> 1
>1
> 1
>2
6
R e p o r t No. 00.802 Page no- 35
T A B L E A - 4
P U ' S B? (RlgMRI aar IuRm lgbo
134
1546
1-0
1620
0719 0957
0734
dl25 1418
W8
ogoo
0653
1215
2156
1217 l & 5
1 9 9
08y
1030
lCe3
0340
2 V O
1059
1839
2
1 2
1 2
1
1
1 1
3
l+ 1-
2+
?.+
2
3
3
1 1
2+
1
3
3
2
1+
1
3*
- * 4 v AaP.
14
17-5
<1
1
1
2.5
1
ll
2
6
4
6
1.5
7
5
1
1.3
8
1
1
2
ll
-
snvee Strtim
818
swtt B.
SCOtt i).
5525
5551
5585
5592
5597
5627
5657
5663
5669
56eo
5695
5 n 3
5791,
5-
5903
5%
5959
l e Y 5
1423-3
1424-21
1&4-39
1125-1
l&ll
lkzl-ll
1427-28
1&7*
1428-cp
1426-27
1428-39
1430-3
1430-23
1433-19
1433-39
1434-33
14657
l47Ol
14738
14751
14796
1483
14840
lW 14867
14885
1W
11981 149%
l 5 W
lSu4
15l51