analysis of causes of major train derailment and their ... papers/2012/liu et al 2012... · enable...
TRANSCRIPT

154
Transportation Research Record: Journal of the Transportation Research Board, No. 2289, Transportation Research Board of the National Academies, Washington, D.C., 2012, pp. 154–163.DOI: 10.3141/2289-20
Analysis of the causes of train accidents is critical for rational allocation of resources to reduce accident occurrence in the most cost-effective manner possible. Train derailment data from the FRA rail equipment accident database for the interval 2001 to 2010 were analyzed for each track type, with accounting for frequency of occurrence by cause and number of cars derailed. Statistical analyses were conducted to examine the effects of accident cause, type of track, and derailment speed. The analysis showed that broken rails or welds were the leading derailment cause on main, yard, and siding tracks. By contrast to accident causes on main tracks, bearing failures and broken wheels were not among the top accident causes on yard or siding tracks. Instead, human factor–related causes such as improper use of switches and violation of switching rules were more prevalent. In all speed ranges, broken rails or welds were the leading cause of derailments; however, the relative frequency of the next most common accident types differed substantially for lower- versus higher-speed derailments. In general, at derailment speeds below 10 mph, certain track and human factor causes—such as improper train handling, braking operations, and improper use of switches—dominated. At derailment speeds above 25 mph, those causes were nearly absent and were replaced by equipment causes, such as bearing failure, broken wheel, and axle and journal defects. These results rep-resent the first step in a systematic process of quantitative risk analysis of railroad freight train safety, with an ultimate objective of optimizing safety improvement and more cost-effective risk management.
Train accidents cause damage to infrastructure and rolling stock as well as service disruptions, and may cause casualties and harm the environment. Accordingly, improving train operating safety has long been a high priority of the rail industry and the government. Train accidents occur as a result of many different causes; however, some are much more prevalent than others. Furthermore, the fre-quency and severity of accidents also varies widely, depending on the particular accident cause (1–3). Efficient allocation of resources to prevent accidents in the most cost-effective manner possible requires understanding which factors account for the greatest risk, and under which circumstances. Assessment of the benefits and costs of strat-egies to mitigate each accident cause can then be evaluated and resources allocated so that the greatest safety improvement can be
achieved for the level of investment available. This paper presents statistical results representing the first step in a systematic process of quantitative risk analysis and risk management for railroad freight train safety.
ApproAch
The approach taken in this research is to conduct detailed analysis of the train accident data supplied by the railroads to FRA of the U.S. Department of Transportation. FRA regularly publishes sta-tistical summaries of these data; however, the results are generally presented at a highly aggregated level. Further insights are possible by analyzing the results in more detail and considering other statis-tical approaches. In addition, there are various metrics that can be used to assess train safety. The effectiveness of specific risk reduc-tion strategies needs to be understood when the cost-effectiveness of research, development, and implementation of new strategies is considered. Consequently, in the final section of this paper a pre-liminary sensitivity analysis of several groups of accident causes is conducted to understand how changes in practice or failure preven-tion technology might affect the overall accident rate. The results enable objective comparison of different approaches that could be used to inform decision making by industry and government con-cerning which research, development, or implementation strategies to invest in.
DAtA SourceS AnD AnAlySiS
FRA requires railroads to submit detailed reports of all significant accidents or incidents associated with railroad train operation. It is useful to review briefly the FRA databases in the larger context of railroad safety and analysis, including how the databases relate to one another and the hierarchical organization of the train accident database, which is the subject of the research described in this paper. These databases can be considered at increasing levels of detail as follows: type of incident (corresponding to particular FRA databases) and, within the database on train accidents, by track type, accident type, and accident cause.
FrA DAtAbASeS
FRA maintains three major databases, each related to a different aspect of train operating safety: train accidents, employee casual-ties, and railroad and highway grade crossing incidents. A particular
Analysis of Causes of Major Train Derailment and Their Effect on Accident Rates
Xiang Liu, M. Rapik Saat, and Christopher P. L. Barkan
Rail Transportation and Engineering Center, Department of Civil and Environmen-tal Engineering, University of Illinois at Urbana–Champaign, 205 North Mathews Avenue, Urbana, IL 61801. Corresponding author: X. Liu, [email protected].

Liu, Saat, and Barkan 155
reportable event may require that reports be submitted to any or all of these, alone or in combination, depending on the circumstances. Of principal interest for the research described in this study is the first database describing the circumstances, physical characteristics, and other information related to damage to rolling stock and infra-structure. Within this database the interest lies in the type of track—main, siding, yard, or industry—that an accident occurred on. At the next level down, interest is focused on the type of accident, that is, derailment, collision, or various other types. Finally, within each of these track and accident types the particular cause of the accident and other circumstances, notably derailment speed, are the focus of interest.
event category and corresponding FrA Database
The Rail Equipment Accident/Incident Report (REAIR) form (FRA F 6180.54) is used by railroads to report all accidents that exceed a monetary threshold of damages to infrastructure and roll-ing stock. [The form accounts for damage to on-track equipment, signals, track, track structures, and roadbed. The reporting thresh-old is periodically adjusted for inflation and increased from $7,700 in 2006 to $9,400 in 2011 (4).] FRA compiles these reports into the rail equipment accident (REA) database, which records rail equip-ment accident data dating back to 1975. In addition to the REAIR, the Highway–Rail Grade Crossing Accident/Incident Report (FRA F 6180.57) and Death, Injury, or Occupational Illness Summary (FRA F 6180.55a) are the other two principal eponymous railroad accident and incident reporting forms. A single accident may require more than one report, depending on its circumstances. For example, if a train accident occurs that results in damages to track and equip-ment exceeding the threshold, an FRA F 6180.54 report must be submitted, and if the accident involved a highway user at a highway–rail crossing, regardless of impact, a Form FRA F 6180.57 must also be completed. All casualties resulting from a reportable rail equipment accident, in addition to being recorded on Form FRA F 6180.54, must also be reported individually on Form FRA F 6180.55a (4). This study used data exclusively from the FRA REA database. Depending on the nature of one’s interest in train accident analysis, additional useful information may be found in the other databases and these databases can be linked to pursue additional questions not possible with a particular database alone (5).
FrA rail equipment Accident Database
The FRA REA database records railroad, accident type, location, accident cause, severity, and other information important for accident analysis and prevention. This paper focuses on Class I freight rail-roads (operating revenue exceeding $378.8 million in 2009), which account for approximately 68% of U.S. railroad route miles, 97% of total ton-miles transported, and 94% of the total rail freight revenue (6). In addition to analysis of the number of freight trains derailed due to various causes, consideration of statistics on the number of cars derailed and the circumstances of their derailment is necessary because accident severity varies among different accident causes. To understand the effect of various derailment prevention strategies, first there is a need to quantify how much different accident causes contribute to derailment risk and also how accident characteristics affect the risk.
AcciDent by trAck type
Four types of tracks are recorded in the FRA REA database—main, siding, yard, and industry tracks. These track types are used for different operational functions and consequently have different associated accident types, causes, and consequences. Train accidents are categorized into derailment, collision, highway–rail grade cross-ing accident, and several other less frequent types. When there is more than one type of accident, the type of accident that occurred first would be designated for all reports related to it. For example, a derailment caused by a collision would be classified as a “collision.” Highway–rail grade crossing accidents in the REA database include only those that occur at the highway–rail interface and involve at least one highway user (4).
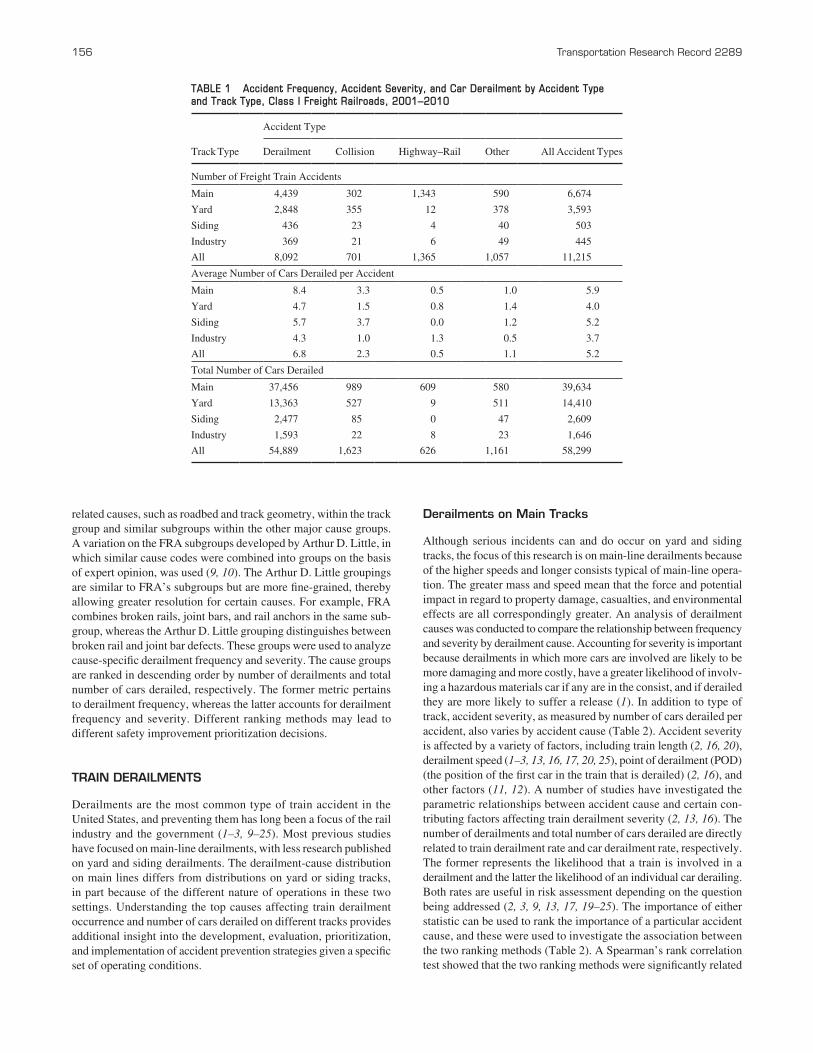
FRA-reportable freight train accident data for Class I railroads for the period 2001 to 2010 were compiled to show the number of FRA-reportable accidents, the average number of cars derailed per accident, and the total number of cars derailed by accident type and track type (Table 1). Train derailment was the most common type of accident on each track type, and train collision was the least frequent (excluding highway–rail grade crossing accidents on siding, yard, and industry tracks). Ninety-eight percent of highway–rail grade crossing accidents occurred on main track and accounted for 20% of all types of Class I main-line train accidents. By definition, these accidents exceeded the FRA reporting threshold for damages, but often did not result in a derailment (5). Accident severity is defined in this study as the number of cars derailed per accident and varies by track type and accident type. Train derailments on main and siding tracks had a greater average accident severity than did other types of accidents and tracks. Highway–rail grade crossing accidents had fewer cars derailed per accident because many reportable highway–rail grade crossing accidents resulted in no derailment (5).
Total number of cars derailed accounts for accident frequency and severity. The majority of cars derailed on Class I freight railroads were derailed as a result of train derailments. Derailments on main and siding tracks accounted for 65% of freight train accidents and correspondingly 87% of the cars derailed on all types of track.
It is evident that the distribution of accident types varied by track type. For example, 98% of highway–rail grade crossing accidents occurred on main tracks, whereas far fewer occurred on yard tracks. A chi-square test was used to examine the association between track type (main, siding, yard, and industry) and accident type (derailment, collision, highway–rail grade crossing accident, and other) by accident frequency. The chi-squared test showed that the accident frequency distributions of different accident types varied by track type (χ2 = 1,054, df = 9, P < .01). This result was significant even when only derailment and collision were included in the analysis (χ2 = 68, df = 3, P < .01). The association between accident type and track type implies that different track types have different acci-dent cause distributions, which will be discussed in the following sections. Train collisions and highway–rail grade crossing accidents have been analyzed in other recent studies, so this research focused on train derailments (5, 7, 8).
trAin AcciDent cAuSe
FRA train accident cause codes are hierarchically organized and categorized into major cause groups—track, equipment, human factors, signal, and miscellaneous. Within each of these major cause groups, FRA organizes individual cause codes into subgroups of
156 Transportation Research Record 2289
related causes, such as roadbed and track geometry, within the track group and similar subgroups within the other major cause groups. A variation on the FRA subgroups developed by Arthur D. Little, in which similar cause codes were combined into groups on the basis of expert opinion, was used (9, 10). The Arthur D. Little groupings are similar to FRA’s subgroups but are more fine-grained, thereby allowing greater resolution for certain causes. For example, FRA combines broken rails, joint bars, and rail anchors in the same sub-group, whereas the Arthur D. Little grouping distinguishes between broken rail and joint bar defects. These groups were used to analyze cause-specific derailment frequency and severity. The cause groups are ranked in descending order by number of derailments and total number of cars derailed, respectively. The former metric pertains to derailment frequency, whereas the latter accounts for derailment frequency and severity. Different ranking methods may lead to different safety improvement prioritization decisions.
trAin DerAilmentS
Derailments are the most common type of train accident in the United States, and preventing them has long been a focus of the rail industry and the government (1–3, 9–25). Most previous studies have focused on main-line derailments, with less research published on yard and siding derailments. The derailment-cause distribution on main lines differs from distributions on yard or siding tracks, in part because of the different nature of operations in these two settings. Understanding the top causes affecting train derailment occurrence and number of cars derailed on different tracks provides additional insight into the development, evaluation, prioritization, and implementation of accident prevention strategies given a specific set of operating conditions.
Derailments on main tracks
Although serious incidents can and do occur on yard and siding tracks, the focus of this research is on main-line derailments because of the higher speeds and longer consists typical of main-line opera-tion. The greater mass and speed mean that the force and potential impact in regard to property damage, casualties, and environmental effects are all correspondingly greater. An analysis of derailment causes was conducted to compare the relationship between frequency and severity by derailment cause. Accounting for severity is important because derailments in which more cars are involved are likely to be more damaging and more costly, have a greater likelihood of involv-ing a hazardous materials car if any are in the consist, and if derailed they are more likely to suffer a release (1). In addition to type of track, accident severity, as measured by number of cars derailed per accident, also varies by accident cause (Table 2). Accident severity is affected by a variety of factors, including train length (2, 16, 20), derailment speed (1–3, 13, 16, 17, 20, 25), point of derailment (POD) (the position of the first car in the train that is derailed) (2, 16), and other factors (11, 12). A number of studies have investigated the parametric relationships between accident cause and certain con-tributing factors affecting train derailment severity (2, 13, 16). The number of derailments and total number of cars derailed are directly related to train derailment rate and car derailment rate, respectively. The former represents the likelihood that a train is involved in a derailment and the latter the likelihood of an individual car derailing. Both rates are useful in risk assessment depending on the question being addressed (2, 3, 9, 13, 17, 19–25). The importance of either statistic can be used to rank the importance of a particular accident cause, and these were used to investigate the association between the two ranking methods (Table 2). A Spearman’s rank correlation test showed that the two ranking methods were significantly related
TABLE 1 Accident Frequency, Accident Severity, and Car Derailment by Accident Type and Track Type, Class I Freight Railroads, 2001–2010
Accident Type
Track Type Derailment Collision Highway–Rail Other All Accident Types
Number of Freight Train Accidents
Main 4,439 302 1,343 590 6,674
Yard 2,848 355 12 378 3,593
Siding 436 23 4 40 503
Industry 369 21 6 49 445
All 8,092 701 1,365 1,057 11,215
Average Number of Cars Derailed per Accident
Main 8.4 3.3 0.5 1.0 5.9
Yard 4.7 1.5 0.8 1.4 4.0
Siding 5.7 3.7 0.0 1.2 5.2
Industry 4.3 1.0 1.3 0.5 3.7
All 6.8 2.3 0.5 1.1 5.2
Total Number of Cars Derailed
Main 37,456 989 609 580 39,634
Yard 13,363 527 9 511 14,410
Siding 2,477 85 0 47 2,609
Industry 1,593 22 8 23 1,646
All 54,889 1,623 626 1,161 58,299

Liu, Saat, and Barkan 157
TABLE 2 Derailment Frequency and Severity by Accident Cause on Class I Main Lines, Sorted by Frequency
Cause Group Description
Derailments Cars Derailed Average Number of Cars Derailed per DerailmentNumber Percentage Number Percentage
08T Broken rails or welds 665 15.3 8,512 22.7 12.8
04T Track geometry (excluding wide gauge) 317 7.3 2,057 5.5 6.5
10E Bearing failure (car) 257 5.9 1,739 4.6 6.8
12E Broken wheels (car) 226 5.2 1,457 3.9 6.4
09H Train handling (excluding brakes) 201 4.6 1,553 4.1 7.7
03T Wide gauge 169 3.9 1,729 4.6 10.2
01M Obstructions 153 3.5 1,822 4.9 11.9
05T Buckled track 149 3.4 1,891 5.0 12.7
04M Track–train interaction 149 3.4 1,110 3.0 7.4
11E Other axle or journal defects (car) 144 3.3 1,157 3.1 8.0
03M Lading problems 134 3.1 791 2.1 5.9
07E Coupler defects (car) 133 3.1 771 2.1 5.8
13E Other wheel defects (car) 129 3.0 668 1.8 5.2
09E Sidebearing, suspension defects (car) 126 2.9 816 2.2 6.5
10T Turnout defects: switches 118 2.7 601 1.6 5.1
11H Use of switches 104 2.4 407 1.1 3.9
06E Centerplate or carbody defects (car) 98 2.3 507 1.4 5.2
01H Brake operation (main line) 95 2.2 881 2.4 9.3
12T Miscellaneous track and structure defects 80 1.8 687 1.8 8.6
01T Roadbed defects 67 1.5 665 1.8 9.9
07T Joint bar defects 66 1.5 1,040 2.8 15.8
10H Train speed 61 1.4 403 1.1 6.6
09T Other rail and joint defects 56 1.3 1,132 3.0 20.2
19E Stiff truck (car) 55 1.3 365 1.0 6.6
05M Other miscellaneous 54 1.2 422 1.1 7.8
15E Locomotive trucks, bearings, wheels 50 1.1 177 0.5 3.5
18E All other car defects 47 1.1 248 0.7 5.3
06T Rail defects at bolted joint 46 1.1 927 2.5 20.2
12H Miscellaneous human factors 44 1.0 377 1.0 8.6
02T Nontraffic, weather causes 43 1.0 331 0.9 7.7
02H Handbrake operations 41 0.9 177 0.5 4.3
20E Track–train interaction (hunting) (car) 40 0.9 419 1.1 10.5
05E Other brake defect (car) 37 0.9 187 0.5 5.1
08E Truck structure defects (car) 35 0.8 265 0.7 7.6
07H Switching rules 30 0.7 198 0.5 6.6
02E Brake rigging defect (car) 27 0.6 148 0.4 5.5
01E Air hose defect (car) 19 0.4 148 0.4 7.8
01S Signal failures 17 0.4 121 0.3 7.1
17E All other locomotive defects 13 0.3 155 0.4 11.9
11T Turnout defects: frogs 11 0.3 97 0.3 8.8
08H Mainline rules 11 0.3 56 0.1 5.1
16E Locomotive electrical and fires 10 0.2 28 0.1 2.8
04E UDE (car or locomotive) 8 0.2 86 0.2 10.8
03H Brake operations (other) 4 0.1 47 0.1 11.8
05H Failure to obey or display signals 4 0.1 23 0.1 5.8
04H Employee physical condition 3 0.1 41 0.1 13.7
06H Radio communications error 3 0.1 13 0.0 4.3
14E TOFC–COFC defects 2 0.0 2 0.0 1.0
03E Handbrake defects (car) 1 0.0 2 0.0 2.0
Total 4,352 100 37,456 100 8.6
Note: UDE = undesired emergency (brake application); TOFC = trailer on flat car; COFC = container on flat car.

158 Transportation Research Record 2289
(Spearman rho = 0.95, P < .01). Certain derailment causes, notably broken rails or welds, are the most frequent when using either metric; consequently, efforts to prevent these high-frequency, high-severity accidents receive considerable attention.
Derailment frequency and severity (average number of cars derailed) were plotted against one another, with frequency on the abscissa and severity on the ordinate (Figure 1). The graph is divided into four quadrants on the basis of the average derailment frequency and severity along each axis. The graph enables easy comparison of the relative frequency and severity of different causes. Those causes in the upper right quadrant are most likely to pose the greatest risk because they are both more frequent and more severe than the average. The five cause groups are
• Broken rails or welds,• Wide gauge,• Buckled track,• Obstructions, and• Main-line brake operation.
Four other cause groups that are notable because of their high frequency of occurrence are
• Track geometry (excluding wide gauge),• Bearing failure (car),
• Broken wheels (car), and• Train handling (excluding brakes).
Three other cause groups are notable because of the high average severity of the resultant derailments and because they all have related causes:
• Rail defects at bolted joints,• Other rail and joint defects, and• Joint bar defects.
These three causes, along with the related cause group, broken rails or welds, are of particular interest, because when combined they accounted for almost 20% of all derailments and more than 30% of all derailed cars on Class I main lines (Table 2).
Derailments on Siding and yard tracks
As discussed above, main track derailments are likely to be the most serious, but understanding the causes of derailments on siding and yard tracks is worthwhile because certain causes and solutions may apply to both. A chi-square test was conducted to compare the distributions of derailment frequency by the top 20 main-line derail-ment causes on main, yard, and siding tracks. The distribution of
0
5
10
15
20
25
0 100 200 300 400 500 600 700
Ave
rag
e N
um
ber
of
Car
s D
erai
led
Number of Derailments
Broken Rails or WeldsBuckled Track
Obstructions
Wide Gauge
Track Geometry(excl. Wide Gauge)
Bearing Failure (Car)
Broken Wheels(Car)
Train Handling (excl. Brakes)
Average frequency = 89
Average severity = 8.6
Other Rail and Joint Defects
Rail Defects atBolted Joints
Joint BarDefects
Mainline Brake Operation
FIGURE 1 Frequency and severity graph of Class I main-line freight train derailments, 2001–2010.

Liu, Saat, and Barkan 159
derailment causes varied significantly by track type (χ2 = 1,780, df = 38, P < .01). Tables 3 and 4 show the top 10 accident causes by derailment frequency and total number of cars derailed, respectively, on different track types.
Comparison of main tracks with yard and siding tracks using either metric, derailment frequency or number of cars derailed, reveals that broken rails or welds were the leading derailment cause on all
three track types. However, by contrast to main tracks, bearing failures and broken wheels were not among the top accident causes on yard and siding tracks, probably because of lower operating speeds. Instead, human factor–related causes such as improper use of switches and violation of switching rules were more prevalent. Misaligned switches caused 14% of yard derailments, and this cause has received particular attention in recent years. The higher incidence
TABLE 3 Top 10 Accident Causes of Freight Train Derailments by Track Type: Number of Derailments
Freight Train Derailments
Main Siding Yard
Rank Cause Group Percentage Cause Group Percentage Cause Group Percentage
1 Broken rails or welds 15.3 Broken rails or welds 16.5 Broken rails or welds 16.4
2 Track geometry (excluding wide gauge)
7.3 Wide gauge 14.2 Use of switches 13.5
3 Bearing failure (car) 5.9 Turnout defects—switches 9.7 Wide gauge 13.5
4 Broken wheels (car) 5.2 Switching rules 7.7 Turnout defects—switches 11.1
5 Train handling (excluding brakes)
4.6 Track geometry (excluding wide gauge)
7.2 Train handling (excluding brakes)
6.7
6 Wide gauge 3.9 Use of switches 5.8 Switching rules 6.2
7 Obstructions 3.5 Train handling (excluding brakes)
3.5 Track geometry (excluding wide gauge)
3.6
8 Buckled track 3.4 Lading problems 2.3 Miscellaneous track and structure defects
3.4
9 Track–train interaction 3.4 Roadbed defects 2.1 Track–train interaction 3.1
10 Other axle or journal defects (car)
3.3 Miscellaneous track and structure defects
2.1 Other miscellaneous 3.0
TABLE 4 Top 10 Accident Causes of Freight Train Derailments by Track Type: Number of Cars Derailed
Freight Cars Derailed Because of Train Derailments
Main Siding Yard
Rank Cause Group Percentage Cause Group Percentage Cause Group Percentage
1 Broken rails or welds 22.7 Broken rails or welds 23.2 Broken rails or welds 19.3
2 Track geometry (excluding wide gauge)
5.5 Wide gauge 13.8 Wide gauge 18.2
3 Buckled track 5.0 Turnout defects—switches 10.4 Use of switches 10.0
4 Obstructions 4.9 Track geometry (excluding wide gauge)
6.2 Turnout defects—switches 9.8
5 Bearing failure (car) 4.6 Use of switches 4.8 Train handling (excluding brakes)
7.7
6 Wide gauge 4.6 Switching rules 4.0 Miscellaneous track and structure defects
4.2
7 Train handling (excluding brakes)
4.1 Train handling (excluding brakes)
3.5 Switching rules 3.9
8 Broken wheels (car) 3.9 Obstructions 3.0 Track geometry (excluding wide gauge)
3.3
9 Other axle or journal defects (car)
3.1 Buckled track 2.8 Track–train interaction 3.2
10 Other rail and joint defects 3.0 Brake operation (main line) 2.7 Brake operation (main line) 2.7

160 Transportation Research Record 2289
of switch-related derailments in yards and sidings compared with main lines is probably due to the greater number and more frequent use of turnouts on these tracks and thus the greater likelihood of error. Another consequence of the more frequent use of switches is the greater prevalence of switch defects. Switch defects caused approx-imately 10% of derailments on yard and siding tracks, but only 3% on main lines. The reason for this is probably twofold: the more frequent use of switches on these types of tracks subjects them to greater exposure and thus more opportunity to cause a derailment, and because of their heavy use, the switches are subject to more wear and tear and consequently faster deterioration. The switch points are typically the most vulnerable parts of switches, so their protec-tion and lubrication, along with improved wheel profile and truck steering performance, may offer means to prevent switch-defect derailments (26–28). Another difference between main tracks com-pared with yard and siding tracks is that wide gauge accounted for 14% of derailments on siding and yard tracks but for only 4% on main lines. Again, this difference is probably due to the lower speed characteristic of yard and siding tracks but with a different expla-nation; the lower operating speed permits greater tolerances in the
track gauge standards, and therefore these tracks may be more prone to this type of derailment (29).
eFFect oF DerAilment SpeeD
So far this paper has considered accident and track type as factors affecting the likelihood that a train or rail car will derail, but another important parameter affecting derailments is train speed at the time of derailment. Indeed, speed may be a contributing factor to some of the differences cited above. Common sense demands that speed is a factor affecting derailment severity, and previous research has estab-lished several qualitative and quantitative relationships between derailments and speed (1). The top 10 accident causes of main-line train derailments were sorted into different groups, corresponding to the FRA track class speed ranges, and compared, again by derailment frequency and number of cars derailed (Figure 2) (29).
In all speed ranges, broken rails or welds were the leading cause of derailments; however, the relative frequency of the next most common accident types differed substantially for lower versus
0
50
100
150
200
0
50
100
150
200
0
50
100
150
200
0
50
100
150
200
Nu
mb
er o
f D
erai
lmen
ts
Nu
mb
er o
f D
erai
lmen
ts
Nu
mb
er o
f D
erai
lmen
ts
Nu
mb
er o
f D
erai
lmen
ts
Track Equipment Human Factors Miscellaneous
(a) (b)
(c) (d)
FIGURE 2 Number of freight train derailments by speed and accident cause on Class I main lines: (a) derailment speed 0–10 mph, (b) derailment speed 10–25 mph, (c) derailment speed 25–40 mph, and (d) derailment speed 40–80 mph.

Liu, Saat, and Barkan 161
higher speed derailments. At speeds below 10 mph, certain track-related and human factor–related causes occurred more frequently than equipment-related causes. But at derailment speeds greater than 25 mph, human factors accidents such as improper train handling, braking operations, and improper use of switches were almost completely absent, replaced by equipment causes, such as bearing failure, broken wheel, and axle and journal defects. The derailment frequency distribution for 49 main-line accident causes and three derailment-speed groups (<10 mph, 11–25 mph, and >25 mph) were compared in a chi-square analysis, and the results were significant (χ2 = 1,192, df = 96, P <.01), indicating an association between accident cause and derailment speed.
AcciDent prevention StrAtegy
To gain insights into the potential safety benefits of strategies to reduce various types of derailments, a sensitivity analysis was conducted (Figure 3, a and b). An estimation was done to determine by what percentage main track train and car derailment rates would be reduced in the event that certain accident causes were reduced or eliminated. Four of the leading main-line accident causes were considered: broken rails or welds (08T), track geometry defects (04T), bearing failure (10E), and broken wheels (12E). There are a number of approaches in practice or being developed that may address these. Broken rail preventive measures include rail inspection, rail grinding, rail repair,
FIGURE 3 Percentage reduction in derailment rates by derailment prevention strategy: (a) train derailment rate reduction and (b) car derailment rate reduction.
0%
5%
10%
15%
20%
25%
0% 20% 40% 60% 80% 100%
Per
cen
tag
e R
edu
ctio
n in
Tra
in D
erai
lmen
t R
ate
Track Geometry Defect
Bearing Failure
Broken Wheel
Effectiveness of Accident Prevention Strategy
Broken Rail
0%
5%
10%
15%
20%
25%
0% 20% 40% 60% 80% 100%
Per
cen
tag
e R
edu
ctio
n in
Car
Der
ailm
ent
Rat
e
Track Geometry DefectBearing Failure
Broken Wheel
Effectiveness of Accident Prevention Strategy
Broken Rail
(a)
(b)

162 Transportation Research Record 2289
and renewal (30). Track geometry inspection and maintenance are often based on some measurable indices, such as the track qual-ity index (31, 32). Wayside and onboard detection systems aim to identify and inform railroads and car owners about the need to remove or repair rolling stock defects before they cause an accident. Hot bearing detectors and wheel impact load detectors are commonly used to detect problems with those components (33, 34). Never-theless, these techniques and technologies are not 100% effective in eliminating all the accident causes they are intended to prevent, and research and development are ongoing to further develop their capability. The effectiveness of an accident prevention strategy is defined here as the percentage of the maximum safety benefit it might potentially realize. The sensitivity analysis helps illustrate the rele-vant potential safety benefit that might be realized if technologies or techniques were implemented with varying degrees of effectiveness. For example, broken rails or welds caused 15.3% of train derailments and 22.7% of cars derailed (Table 2); thus, if all broken-rail-related causes were eliminated, train and car derailment rates would decline by a corresponding amount. Even if only 50% of broken rails or welds could be prevented, the prevention would result in a larger percentage reduction in train and car derailment rates than would any of the other accident prevention strategies at 100% effectiveness.
The effects of different accident prevention strategies may not necessarily be independent of one another. For example, improved wheel condition can reduce dynamic loading of track, thereby reducing track defect rates, and vice versa. The interactive damage forces between track and equipment have been discussed in previous studies (35, 36). Resor and Zarembski proposed an engineering model to estimate the change in relative damage to track and equipment given the change in impact load (35). With the use of their model, it was estimated that a 1% reduction in impact load would result in a 1.3% reduction in damage to track and a 0.6% reduction in dam-age to wheels and axles. Nevertheless, the authors are unaware of any research that quantifies the reduction in track and equipment damages, with the corresponding reduction in accident probability. Further research is needed to understand better what the possible interactive effects are, how to quantify them where they exist, and what their effects are on accident rate estimation and safety policy evaluation. For purposes of illustration, independence of individual derailment prevention strategies was assumed in the sensitivity analyses presented here. To the extent that interactive effects among different accident prevention strategies reduce the safety benefits due to another, the analyses here may slightly overstate the benefit of a particular derailment cause prevention measure if other related measures were implemented.
This paper focuses on developing an analytical framework to understand the relative importance of different accident causes under various operating conditions. The analyses presented here are just the first step in a risk-based approach to derailment prevention. The implementation costs of different risk reduction measures may be affected by the effectiveness of technology, extent of implementa-tion, installation and maintenance practices, and many other factors. Schafer and Barkan estimated $900 per track mile as the annual cost for ultrasonic and geometric track inspection and $1,900 per track mile for rail grinding on one Class I railroad (30). Robert et al. reported a total cost of $86 million for implementing wayside detectors in the United States from 1994 to 2008 (37). However, the proportion of the costs directly related to safety improvement is not well understood and further study is required. An additional complexity is that safety improvement activities may affect operational efficiency differently in different time periods. For example, track maintenance may cause
train delay in the short term but improve efficiency in the long term by reducing the potential service disruptions due to accidents.
Further research is needed to understand the relationship between accident rates and occurrence in regard to accident frequency and corresponding traffic exposure. This research will enable a better comparison of the accident risk under different operating conditions, such as main lines versus yard tracks. The next step is to quantify the benefits and costs of specific risk reduction measures, thereby allowing integration of the multiple trade-offs involving safety, effi-ciency, and cost. In that way, interactive effects between strategies can be accounted for, and the optimal combination of investment strategies selected for any given level of financial resources.
concluSionS
Accident cause distribution varies by accident type, track type, and speed. Derailments are the most common type of train accident on each track type, and the majority of cars derailed are due to train derailments. Track and equipment failures are the primary causes of train derailments on main tracks, whereas the use of switches and switching rules has a substantial effect on derailment frequency on siding and yard tracks. Some accident causes tend to occur more frequently at higher speeds, whereas others are more likely at lower speeds. The interactive effects of derailment speed and accident cause affect train accident frequency and severity.
The safety benefits of accident prevention strategies were evalu-ated according to the percentage reduction in train and car derailment rates. Prevention of broken rails or welds is expected to yield a larger percentage reduction in train and car derailment rates than other accident prevention strategies. However, the cost-effectiveness of this and other accident prevention strategies must be properly compared to select the most efficient means of improving railroad train operating safety. Ultimately these strategies should be considered as part of an integrated framework to optimize investment that maximizes safety benefits and minimizes risk.
AcknowleDgmentS
The first author was supported in part by grants from BNSF Rail-way and ABSG Consulting. The authors are grateful to Donald Bullock and Laura Ghosh of the University of Illinois for their com-ments on the revised manuscript. The authors greatly appreciate the useful comments from four anonymous reviewers. This research was partially supported by a grant from the NEXTRANS University Transportation Center.
reFerenceS
1. Barkan, C. P. L., C. T. Dick, and R. Anderson. Railroad Derailment Fac-tors Affecting Hazardous Materials Transportation Risk. In Transporta-tion Research Record: Journal of the Transportation Research Board, No. 1825, Transportation Research Board of the National Academies, Washington, D.C., 2003, pp. 64–74.
2. Anderson, R. T. Quantitative Analysis of Factors Affecting Railroad Accident Probability and Severity. MS thesis. University of Illinois at Urbana–Champaign, 2005.
3. Liu, X., C. P. L. Barkan, and M. R. Saat. Analysis of Derailments by Acci-dent Cause: Evaluating Railroad Track Upgrades to Reduce Transportation Risk. In Transportation Research Record: Journal of the Transportation Research Board, No. 2261, Transportation Research Board of the National Academies, Washington, D.C., 2011, pp. 178–185.

Liu, Saat, and Barkan 163
4. FRA Guide for Preparing Accident/Incident Reports. FRA, U.S. Department of Transportation, 2011.
5. Chadwick, S., M. R. Saat, and C. P. L. Barkan. Analysis of Factors Affecting Train Derailment at Highway–Rail Grade Crossings. Pre-sented at 91st Annual Meeting of the Transportation Research Board, Washington, D.C., 2012.
6. Association of American Railroads. Class I Railroad Statistics. http://www.aar.org/∼/media/aar/Industry%20Info/AAR%20Stats%202010% 201123.ash.
7. Saccomanno, F. F., J. H. Shortreed, and M. Van Aerde. Assessing the Risks of Transporting Dangerous Goods by Truck and Rail. Institute for Risk Research, University of Waterloo, Waterloo, Ontario, Canada, 1988.
8. Austin, R. D., and J. L. Carson. An Alternative Accident Prediction Model for Highway–Rail Interfaces. Accident Analysis and Prevention, Vol. 34, 2002, pp. 31–42.
9. Arthur D. Little, Inc. (ADL). Risk Assessment for the Transportation of Hazardous Materials by Rail, Supplementary Report: Railroad Accident Rate and Risk Reduction Option Effectiveness Analysis and Data, 2nd rev. ADL, Cambridge, Mass., 1996.
10. Schafer, D. H., II, and C. P. L. Barkan. Relationship Between Train Length and Accident Causes and Rates. In Transportation Research Record: Journal of the Transportation Research Board, No. 2043, Trans-portation Research Board of the National Academies, Washington, D.C., 2008, pp. 73–82.
11. Yang, T. H., W. P. Manos, and B. Johnstone. A Study Continuation of Derailment Behavior Final Report (Phase 08 Report on Computer Derailment Study). RPI/AAR Report RA-08-1-12 (R-135). Railroad Tank Car Safety Research and Test Project. Association of American Railroads, Washington, D.C., 1972.
12. Yang, T. H., W. P. Manos, and B. Johnstone. Dynamic Analysis of Train Derailments. 72-WA/RT-6. Rail Transportation Proceedings. The American Society of Mechanical Engineers, New York, 1973, p. 8.
13. Nayak, P. R., D. B. Rosenfield, and J. H. Hagopian. Event Probabilities and Impact Zones for Hazardous Materials Accidents on Railroads. Report DOT/FRA/ORD-83/20. FRA, U.S. Department of Transportation, 1983.
14. Glickman, T. S., and D. B. Rosenfield. Risks of Catastrophic Derailments Involving the Release of Hazardous Materials. Management Science, Vol. 30, No. 4, 1984, pp. 503–511.
15. Coppens, A. J., J. D. E. Wong, A. Bibby, A. M. Birk, and R. J. Anderson. Development of a Derailment Accident Computer Simulation Model. Transport Canada Report No. TP 9254E. Prepared for the Transportation Development Centre and Transport of Dangerous Goods, Ottawa, Ontario, Canada, 1988.
16. Saccomanno, F. F., and S. El-Hage. Minimizing Derailments of Rail-cars Carrying Dangerous Commodities Through Effective Marshaling Strategies. In Transportation Research Record 1245, TRB, National Research Council, Washington, D.C., 1989, pp. 34–51.
17. Treichel, T. T., and C. P. L. Barkan. Working Paper on Mainline Freight Train Accident Rates. Research and Test Department, Association of American Railroads, Washington, D.C., 1993.
18. Dick, C. T., C. P. L. Barkan, E. R. Chapman, and M. P. Stehly. Multi-variate Statistical Model for Predicting Occurrence and Location of Broken Rails. In Transportation Research Record: Journal of the Trans-portation Research Board, No. 1825, Transportation Research Board of the National Academies, Washington, D.C., 2003, pp. 48–55.
19. Anderson, R. T., and C. P. L. Barkan. Railroad Accident Rates for Use in Transportation Risk Analysis. In Transportation Research Record: Journal of the Transportation Research Board, No. 1863, Transportation
Research Board of the National Academies, Washington, D.C., 2004, pp. 88–98.
20. Anderson, R. T., and C. P. L. Barkan. Derailment Probability Analyses and Modeling of Mainline Freight Trains. Proc., 8th International Heavy Haul Railway Conference, International Heavy Haul Association, Rio de Janeiro, Brazil, 2005.
21. Saat, M. R., and C. P. L. Barkan. Tank Car Safety Design vs. Infrastructure Improvements in Reducing Hazardous Materials Transportation Risks. Presented at INFORMS Annual Meeting, Pittsburgh, Pa., 2006.
22. Liu, X., M. R. Saat, and C. P. L. Barkan. Benefit–Cost Analysis of Infra-structure Improvement for Derailment Prevention. Proc., ASME-IEEE-ASCE-AREMA-TRB Joint Rail Conference (CD-ROM), University of Illinois at Urbana-Champaign, 2010.
23. Kawprasert, A. Quantitative Analysis of Options to Reduce Risk of Hazardous Materials Transportation by Railroad. PhD dissertation. University of Illinois at Urbana-Champaign, Urbana, 2010.
24. English, G. W., G. Higham, M. Bagheri, T. W. Moynihan, and F. F. Saccomanno. Evaluation of Risk Associated with Stationary Dangerous Goods Railway Cars. Transport Canada Report No. TP 14690E. Prepared for the Transportation Development Centre (TDC), Montreal, Quebec, Canada, 2007.
25. Liu, X., C. P. L. Barkan, and M. R. Saat. Probability Analysis of Haz-ardous Materials Releases in Railroad Transportation. Presented at INFORMS Annual Meeting, Austin, Tex., 2010.
26. Zarembski, A. M. Derailment of Transit Vehicles in Special Trackwork. Transit Cooperative Research Program, 1997.
27. Wolf, G. Switch Point Derailments: Is It the Point or the Wheel? Interface, Journal of Wheel–Rail Interaction, July 2006.
28. Wu, H., and N. Wilson. Railway Vehicle Derailment and Prevention. In Handbook of Railway Vehicle Dynamics, Taylor and Francis Group, Boca Raton, Fla., 2006.
29. Track Safety Standards. FRA. 49 CFR 213, 2003.30. Schafer, D. H., and C. P. L. Barkan. A Prediction Model for Broken Rails
and an Analysis of Their Economic Impact. Proc., American Railway Engineering and Maintenance of Way Association (AREMA) Annual Conference, Salt Lake City, Utah, Sept. 2008.
31. Uzarski, D. R. Development of a Track Structure Condition Index. PhD dissertation. University of Illinois at Urbana-Champaign, 1991.
32. El-Sibaie, M., and Y.-J. Zhang. Objective Track Quality Indices. In Trans-portation Research Record: Journal of the Transportation Research Board, No. 1863, Transportation Research Board of the National Acad-emies, Washington, D.C., 2004, pp. 81–87.
33. Schlake, B. Impact of Automated Condition Monitoring Technologies on Railroad Safety and Efficiency. MS thesis. University of Illinois at Urbana-Champaign, 2010.
34. Kalay, S., P. French, and H. Tournay. The Safety Impact of Wagon Health Monitoring in North America. Proc., 9th World Congress on Railway Research Conference, World Congress on Railway Research, Lille, France, 2011.
35. Resor, R. R., and A. M. Zarembski. Factors Determining the Economics of Wayside Defect Detectors. Presented at 83rd Annual Meeting of the Transportation Research Board, Washington, D.C., 2004.
36. Bladon, K., D. Rennison, G. Lzbinsky, R. Tracy, and T. Bladon. Predictive Condition Monitoring of Railway Rolling Stock. Proc., Conference on Railway Engineering, Darwin, Australia, June 2004.
37. Robert, W., A. Aeppli, and P. Little. Post-Audit of Wayside Detector Costs and Benefits. Cambridge Systematics Inc., Cambridge, Mass., Sept. 2009.
The Railroad Operational Safety Committee peer-reviewed this paper.