analysis of clinical knowledge, absenteeism and
TRANSCRIPT
1Di Giorgio L, et al. BMJ Global Health 2020;5:e003377. doi:10.1136/bmjgh-2020-003377
Analysis of clinical knowledge, absenteeism and availability of resources for maternal and child health: a cross- sectional quality of care study in 10 African countries
Laura Di Giorgio,1 David K Evans ,2 Magnus Lindelow,1 Son Nam Nguyen,1 Jakob Svensson,3 Waly Wane,4 Anna Welander Tärneberg5
Original research
To cite: Di Giorgio L, Evans DK, Lindelow M, et al. Analysis of clinical knowledge, absenteeism and availability of resources for maternal and child health: a cross- sectional quality of care study in 10 African countries. BMJ Global Health 2020;5:e003377. doi:10.1136/bmjgh-2020-003377
Handling editor Seye Abimbola
► Additional material is published online only. To view, please visit the journal online (http:// dx. doi. org/ 10. 1136/ bmjgh- 2020- 003377).
Received 7 July 2020Revised 22 September 2020Accepted 23 September 2020
For numbered affiliations see end of article.
Correspondence toDr David K Evans; devans@ cgdev. org
© Author(s) (or their employer(s)) 2020. Re- use permitted under CC BY- NC. No commercial re- use. See rights and permissions. Published by BMJ.
ABSTRACTObjective Assess the quality of healthcare across African countries based on health providers’ clinical knowledge, their clinic attendance and drug availability, with a focus on seven conditions accounting for a large share of child and maternal mortality in sub- Saharan Africa: malaria, tuberculosis, diarrhoea, pneumonia, diabetes, neonatal asphyxia and postpartum haemorrhage.Methods With nationally representative, cross- sectional data from ten countries in sub- Saharan Africa, collected using clinical vignettes (to assess provider knowledge), unannounced visits (to assess provider absenteeism) and visual inspections of facilities (to assess availability of drugs and equipment), we assess whether health providers are available and have sufficient knowledge and means to diagnose and treat patients suffering from common conditions amenable to primary healthcare. We draw on data from 8061 primary and secondary care facilities in Kenya, Madagascar, Mozambique, Nigeria, Niger, Senegal, Sierra Leone, Tanzania, Togo and Uganda, and 22 746 health workers including doctors, clinical officers, nurses and community health workers. Facilities were selected using a multistage cluster- sampling design to ensure data were representative of rural and urban areas, private and public facilities, and of different facility types. These data were gathered under the Service Delivery Indicators programme.Results Across all conditions and countries, healthcare providers were able to correctly diagnose 64% (95% CI 62% to 65%) of the clinical vignette cases, and in 45% (95% CI 43% to 46%) of the cases, the treatment plan was aligned with the correct diagnosis. For diarrhoea and pneumonia, two common causes of under-5 deaths, 27% (95% CI 25% to 29%) of the providers correctly diagnosed and prescribed the appropriate treatment for both conditions. On average, 70% of health workers were present in the facilities to provide care during facility hours when those workers are scheduled to be on duty. Taken together, we estimate that the likelihood that a facility has at least one staff present with competency and key inputs required to provide child, neonatal and maternity care that meets minimum quality standards is 14%. On average, poor clinical knowledge is a greater constraint in
Key questions
What is already known? ► Country- specific studies have shown that low- income and middle- income countries suffer short-ages of providers, drugs, equipment and medical supplies.
► Individual country reports of Service Delivery Indicator surveys from Kenya, Niger, Senegal, Tanzania and Uganda use summary statistics to show low rates of knowledge and high rates of ab-senteeism among health service providers.
What are the new findings? ► This study offers a single metric that quantifies the relative contribution of staff knowledge, staff availability and other facility inputs to the probabil-ity of care readiness which meets minimum quality standards.
► Our work shows severe gaps in care readiness in various countries in sub- Saharan Africa, and health provider knowledge is a particularly severe con-straint on the readiness of care across countries. Across the countries sampled and the evaluated medical conditions, which account for major loss of life across the continent, healthcare providers were able to correctly diagnose only 64% of cases, and the treatment plan was aligned with the correct di-agnosis in 45% of cases.
What do the new findings imply? ► While effective healthcare systems need to include a variety of components (knowledge, effort, equipment and essential medicines), not all components merit the same initial priority.
► Our findings suggest that in the absence of provider knowledge, even improvements in other key areas such as effort, medication and equipment cannot save patients’ lives.
► As a result, health systems will need to invest in bet-ter knowledge for their health providers along with other resources.
on February 6, 2022 by guest. P
rotected by copyright.http://gh.bm
j.com/
BM
J Glob H
ealth: first published as 10.1136/bmjgh-2020-003377 on 17 D
ecember 2020. D
ownloaded from
2 Di Giorgio L, et al. BMJ Global Health 2020;5:e003377. doi:10.1136/bmjgh-2020-003377
BMJ Global Health
care readiness than drug availability or health workers’ absenteeism in the 10 countries. However, we document substantial heterogeneity across countries in the extent to which drug availability and absenteeism matter quantitatively.Conclusion Our findings highlight the need to boost the knowledge of healthcare workers to achieve greater care readiness. Training programmes have shown mixed results, so systems may need to adopt a combination of competency- based preservice and in- service training for healthcare providers (with evaluation to ensure the effectiveness of the training), and hiring practices that ensure the most prepared workers enter the systems. We conclude that in settings where clinical knowledge is poor, improving drug availability or reducing health workers’ absenteeism would only modestly increase the average care readiness that meets minimum quality standards.
BACKGROUNDThere is a growing consensus that poor- quality care is a major constraint in further improving health outcomes in low- income and middle- income countries (LMICs).1–3 Based on the most recent estimates, 8.6 million people per year in LMICs die from conditions that could be treated by health systems, and a majority of these deaths are due to receipt of poor quality care.4
Measuring quality at various levels of the health system—especially where the system fails the people in need—remains rare in LMICs. Existing indicators of structural quality, such as availability of medicine, equip-ment and qualified health attendants, are not sufficient to adequately capture the quality of care being offered.1 The lack of quality measurement can help to explain both why there is limited research on how to effectively transform low- quality health systems into high- quality ones, and why there are few such successful reforms in LMICs. Actionable and credible data on quality, if prop-erly disseminated, can play an important role in holding country health systems accountable for effective and safe care and can form the basis for quality improvement.5
Our paper reports on large- scale assessments of clinical knowledge, health provider absenteeism and means to provide care in sub- Saharan Africa. We use data collected through clinical vignettes, unannounced visits and visual inspections of over 20 000 providers in over 8000 facili-ties in 10 sub- Saharan African countries, which together represent over 40% of the region’s total population. We focus on conditions that account for a large proportion of maternal and child mortality. We include the Strength-ening the Reporting of Observational Studies in Epide-miology checklist for cross- sectional, observational data analysis in online supplemental appendix section S1.6
We use these data to measure dimensions we would argue are essential for providing quality care. Clinical vignettes tell us what providers know. Unannounced visits to facilities tell us if providers are available at health facilities. Visual inspections of facilities provide informa-tion as to the means that health workers have at their disposal. To put this work in context, the provider assess-ment falls within the framework set out by Miller, that a
holistic assessment of health worker competence should assess their clinical knowledge, if they know how to apply that knowledge, if they can show how to apply that knowl-edge, and if they actually apply that knowledge in prac-tice.7 Our vignette data capture a combination of clinical knowledge and their knowledge of how to apply it. Other, complementary methods (specifically, standardised patient studies) demonstrate whether health workers can show how to apply their knowledge and whether they actually apply that knowledge in practice.8–10 Nationally representative standardised patient data are unavailable in the settings and for the wide array of conditions we study, but limitations revealed in the first aspects of the health worker assessment (what they know and if they know how to apply it) and to one aspect of practice (absenteeism) potentially imply even further limitations on the latter part (whether they can and do actually apply knowledge in practice).
METHODSDataWe draw on data from the Service Delivery Indicators (SDI) programme—an ongoing initiative to collect informative and standardised measures of what providers know, what they do and what they have to work with. The SDI programme—piloted in 2010–2011—grew out of concern about quality of services in health and educa-tion, especially in sub- Saharan Africa, most clearly (and perhaps most damagingly) manifested at the facility level, in fast- expanding systems of primary health provision.11 12 To date, the SDI programme has collected data from ten countries: Kenya (2018), Madagascar (2016), Mozam-bique (2014), Nigeria (2013), Niger (2017), Senegal (2010), Sierra Leone (2018), Tanzania (2016), Togo (2014) and Uganda (2013), and has since expanded to countries outside the Africa region.13–17 While every context is different, these 10 countries serve as a reason-able proxy for much of sub- Saharan Africa, with an average income per capita, life expectancy and infant mortality similar to those of the continent as a whole (online supplemental appendix table S2).
SamplingAll country datasets were representative at the national level except for Nigeria which, mainly owing to security concerns, covered 12 of 37 states and was representative at the state level. The surveys used a multistage cluster- sampling design to ensure data were representative of rural and urban areas, private and public facilities and of each facility type (eg, primary care clinics vs secondary care hospitals).
The surveys collected a broad set of facility and provider specific information, using standardised instruments, with an approach that relied on clinical vignettes, direct physical verification of provider presence through unan-nounced visits and visual inspections of the equipment and facilities. Every interview respondent was asked for
on February 6, 2022 by guest. P
rotected by copyright.http://gh.bm
j.com/
BM
J Glob H
ealth: first published as 10.1136/bmjgh-2020-003377 on 17 D
ecember 2020. D
ownloaded from
Di Giorgio L, et al. BMJ Global Health 2020;5:e003377. doi:10.1136/bmjgh-2020-003377 3
BMJ Global Health
their consent to participate in the survey. Sample instru-ments are publicly available.18–22
In total, the sample includes information from 89 826 vignettes across 13 754 providers and absenteeism obser-vations from 22 747 providers across 8061 facilities in 10 countries. In each country, the sample size was selected in order to provide representative data for the country and for subgroups (eg, rural vs urban areas).
Empirical methodsThere are three essential conditions for health workers to provide quality care. First, providers have sufficient knowl-edge to diagnose and treat patients suffering from condi-tions that are amenable to care. Second, they are avail-able to provide care when patients seek service. Third, providers have the means (eg, equipment and drugs) to diagnose and treat patients. We operationalise the assess-ment of these necessary, but not sufficient, conditions for quality primary care using three methods. Diagnostic and treatment accuracy (knowledge) were measured using clinical vignettes focused on seven common conditions associated with the main causes of child and maternal mortality in sub- Saharan Africa: malaria, tuberculosis, diarrhoea, pneumonia, diabetes, neonatal asphyxia and postpartum haemorrhage. All seven of these are major global health challenges, with three of them—diarrhoea, neonatal asphyxia and malaria—together causing more than 180 000 000 disability- adjusted life- years (online supplemental appendix table S3). Whether providers are available to provide care at regular opening hours was assessed by verifying their presence through unan-nounced visits at the health facilities. Availability of drugs and functionality of equipment was assessed by visual inspections of storage facilities and consulting rooms at the health facilities.
Clinical vignettes have been used extensively in the medical literature to assess clinical knowledge of health workers. Data from vignette studies are directly policy relevant as they are closely linked to the quality of medical training and quality improvement programmes. Valida-tion studies show that clinical vignettes, for scenarios such as those assessed as part of the SDI programme, are an effective way to capture provider knowledge.23 24 Although a health worker’s clinical vignette performance is not a measure of quality of care per se, it represents the highest level of quality care which she/he can deliver given his/her current knowledge, assuming that there are no constraints in drugs, equipment and motivations. (More details on the clinical vignettes are provided in online supplemental appendix S4.) For a measure of providers’ actual performance, studies often use stan-dardised patients, in which actors are trained to portray a given medical condition, appear incognito at facilities for recommended treatment and report on provider activity.
The clinical vignettes were adjusted to country- specific diagnostic and treatment protocols. The enumerators presented the provider with the patient’s symptoms and prompted the provider to take the patient’s history,
suggest physical examination and diagnostic tests that in principle could be conducted on- site, make a diag-nosis and prescribe a course of treatment and follow- up management plan.
For this study, we identified the lowest common denominators across the country- specific protocols to define comparable criteria across countries for diag-nostic and treatment accuracy for each of the conditions. This methodological choice implies that knowledge is assessed at a lower standard than more stringent WHO protocols. We discuss cross- country variation in country- specific protocols in online supplemental appendix S6. Based on the responses to each vignette, we generated two binary variables: diagnostic accuracy and treatment accuracy, which are the percentage of respondents who provided an accurate diagnosis and—separately—an accurate treatment for a given condition. Both outcomes should be viewed as measuring the minimum required knowledge to prescribe correct diagnostic and treatment services. (See online supplemental table S7 for informa-tion on the coding of the two knowledge scores.) These outcomes do not represent the ideal level of knowledge; for example, they do not account for co- morbidities.
To quantify whether providers are available to provide medical service when patients seek care, we followed a standard procedure in which enumerators visited each facility twice.25 During the first visit, information on all staff working at the facility, by professional cadre, was collected. Provider availability does not, of course, fully capture provider effort, but it is a necessary condition for treating patients. (See online supplemental appendix S8 for details on the selection of staff, drugs and equipment for surveys.) Vignettes were administered to a random sample of doctors, medical assistants, nurses and nurse- midwives (ie, any staff that provide outpatient or mater-nity services) who were present in the facility on the day of the first, announced visit. The first visit also included a visual inspection of drugs and equipment.
A few days after the first visit, enumerators made a second, unannounced visit to the facility and assessed the presence of a randomly preselected list of providers (or all providers, if fewer than 10 providers were available). Only staff on duty that day were included in the absen-teeism measure. Staff who were away from the facility due to outreach or fieldwork were counted as present. Country- level averages for each assessment were calcu-lated using country- specific sampling weights. This gives us a mean of the outcome in question that is representa-tive of the country population.
Estimates of care readinessCombining data from the clinical vignettes (to measure knowledge) with data from the unannounced visit (to measure the extent to which providers are present in the facility at regular opening hours), and visual inspections (to quantify the availability of drugs and equipment), we estimate the probability that a facility is ready to provide care that meets minimum quality standards. A facility
on February 6, 2022 by guest. P
rotected by copyright.http://gh.bm
j.com/
BM
J Glob H
ealth: first published as 10.1136/bmjgh-2020-003377 on 17 D
ecember 2020. D
ownloaded from
4 Di Giorgio L, et al. BMJ Global Health 2020;5:e003377. doi:10.1136/bmjgh-2020-003377
BMJ Global Health
is defined as being ready to provide care that meets minimum quality standards for a given condition if there is at least one provider present in the clinic at a given day who can correctly diagnose and treat that condition, and the facility has a minimum set of drugs to treat it. (See online supplemental appendix S9 for further details of the calculation.) The probability of care readiness that does not meet minimum quality standards represents the sum of two important quality gaps: the gap between what health workers are supposed to know and what health workers actually know, and the gap between what health workers know and what health workers can do (either due to absenteeism or a lack of essential drugs). By varying the underlying parameters used to construct the measure, we can assess the relative importance of these two gaps. This research does not examine an additional important gap, between what workers can do and what they actually do in practice. We report three estimates for care readiness for each condition. Our main estimate is based solely on the survey data. We then consider a hypo-thetical scenario in which all health workers are present: we replace the survey- based estimate of absenteeism at the facility level for a type of worker with 0, and re- esti-mate care readiness. We then repeat the same procedure, but instead of replacing the estimate for absenteeism at the facility level, we assume all facilities have the essential drugs for the condition(s) in question.
We present averages and 95% confidence intervals (CIs) by first averaging all observations across facilities (or health workers) in each country (using country- specific facility weights to calculate a representative country average), and then averaging over the country means to calculate an overall average for the whole sample. (This is a suitable approach if we treat the country as the core unit of observation; that is, we want to know how coun-tries compare and how they perform as a group.) This procedure is equivalent to calculating a weighted average and its SE across all observations in the sample, where the weight on observation i in country j is ωij =
∏k̸=j Fk × fij ,
where fij denotes the (facility) weight of observation i in country j and Fk =
∑r frk is the sum of the facility weights
in country k .
Ethical considerationsEach of these surveys was carried out in collaboration with the Ministry of Health in the target country. Each inter-view respondent provided consent to participate in the survey and was made aware that they could desist from the survey at any point. The study involved no deception of participants. The current study involves secondary analysis of the SDI data.
Patient and public involvementNeither patients nor the public were involved in the design of this study. However, each SDI survey was discussed—both at design and results stage—at length with representatives of the country where the survey was
carried out. This research article presents the analysis of data across ten countries.
Role of the funding sourceThe funding source did not have any role in the design, data collection, data analysis, data interpretation or writing of the report.
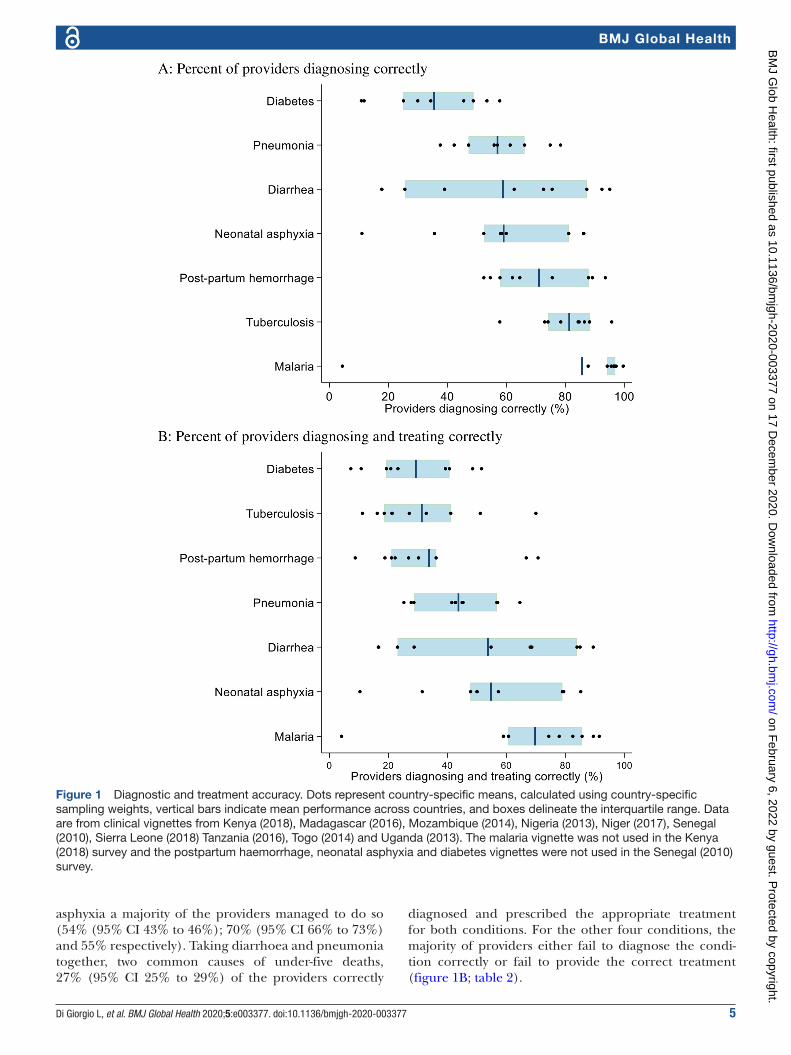
RESULTSDiagnostic accuracyAcross all conditions and countries, healthcare providers correctly diagnose 64% (95% CI 62% to 65%) of the cases. The poorest diagnostic performance is for diabetes, with only 35% (95% CI 33% to 37%) of the health workers providing a correct diagnosis (figure 1A; table 1). For the three main killer diseases for children in sub- Saharan Africa, accounting for approximately one- third of all deaths among children under age 5 in the countries surveyed, average diagnostic accuracy is 57% (95% CI 54% to 59%) for pneumonia, 59% (95% CI 56% to 61%) for diarrhoea and 85% (95% CI 82% to 89%) for malaria.
There are large variations in diagnostic accuracy across conditions and across countries (figure 1A, table 1). For example, only 11% (95% CI 04% to 18%) of the providers in Togo correctly diagnose neonatal asphyxia, compared with 86% (95% CI 85% to 87%) of the providers in Kenya, and only 18% (95% CI 9% to 26%) of the providers in Togo correctly diagnose diarrhoea, compared with 95% (95% CI 93% to 97%) of the providers in Sierra Leone. The within- country variation also shows different patterns (see online supplemental figure S10), varying from rela-tively good performance, although still low in absolute terms, across the whole distribution of providers in the country (Kenya), to countries with relatively poor perfor-mance across the whole distribution (Madagascar), and countries that span the breadth of diagnostic accuracy (Nigeria). Online supplemental figure S11 provides additional information on the clustering of diagnostic performance. Overall, 32% of the providers manage to diagnose all or almost all of the conditions (no more than one condition not correctly diagnosed), while 27% of the providers diagnose less than half of the condi-tions. There are again large differences across countries. Online supplemental figure S11 divides the countries into two groups based on performance. In the higher performance group, 49% of the health workers diagnose all or almost all of the conditions, compared with 11% in the lower performing group.
Accuracy in prescribing treatmentDiagnostic knowledge is associated with knowledge of correct treatment, but a correct diagnosis is not a guar-antee for prescribing correct treatment. The providers prescribed the correct (minimum) treatment following a correct diagnosis in 72% of the cases. Across all condi-tions and countries, healthcare providers were able both to correctly diagnose and treat 45% (95% CI 43% to 46%) of the cases. For diarrhoea, malaria and neonatal
on February 6, 2022 by guest. P
rotected by copyright.http://gh.bm
j.com/
BM
J Glob H
ealth: first published as 10.1136/bmjgh-2020-003377 on 17 D
ecember 2020. D
ownloaded from
Di Giorgio L, et al. BMJ Global Health 2020;5:e003377. doi:10.1136/bmjgh-2020-003377 5
BMJ Global Health
asphyxia a majority of the providers managed to do so (54% (95% CI 43% to 46%); 70% (95% CI 66% to 73%) and 55% respectively). Taking diarrhoea and pneumonia together, two common causes of under- five deaths, 27% (95% CI 25% to 29%) of the providers correctly
diagnosed and prescribed the appropriate treatment for both conditions. For the other four conditions, the majority of providers either fail to diagnose the condi-tion correctly or fail to provide the correct treatment (figure 1B; table 2).
Figure 1 Diagnostic and treatment accuracy. Dots represent country- specific means, calculated using country- specific sampling weights, vertical bars indicate mean performance across countries, and boxes delineate the interquartile range. Data are from clinical vignettes from Kenya (2018), Madagascar (2016), Mozambique (2014), Nigeria (2013), Niger (2017), Senegal (2010), Sierra Leone (2018) Tanzania (2016), Togo (2014) and Uganda (2013). The malaria vignette was not used in the Kenya (2018) survey and the postpartum haemorrhage, neonatal asphyxia and diabetes vignettes were not used in the Senegal (2010) survey.
on February 6, 2022 by guest. P
rotected by copyright.http://gh.bm
j.com/
BM
J Glob H
ealth: first published as 10.1136/bmjgh-2020-003377 on 17 D
ecember 2020. D
ownloaded from
6 Di Giorgio L, et al. BMJ Global Health 2020;5:e003377. doi:10.1136/bmjgh-2020-003377
BMJ Global Health
The required treatments varied in complexity across conditions, from prescribing a single drug or treatment (artemisinin- based combination therapies—ACTs—for malaria, dehydration therapy for diarrhoea, amoxicillin or similar antibiotic for pneumonia) to prescribing a combination of drugs for tuberculosis. There is substan-tive heterogeneity in providers’ ability to reach a correct treatment after correctly diagnosing the condition. As a result, the relative ranking in ability to diagnose differs from the relative ranking in diagnosing and treating patients. For some conditions, the key constraint appears
to be at the diagnostic stage, as with diarrhoea, where 59% of the providers diagnosed correctly but 91% of those who did so prescribed the correct treatment, and neonatal asphyxia, where 59% of the providers diag-nosed correctly but 93% of those who did so prescribed the correct treatment. For other conditions, the key constraint instead appears to be prescribing the correct treatment, as with tuberculosis, where 81% of the providers correctly diagnosed the condition but only 37% of these providers prescribed the correct treatment and postpartum haemorrhage, where 71% of the providers
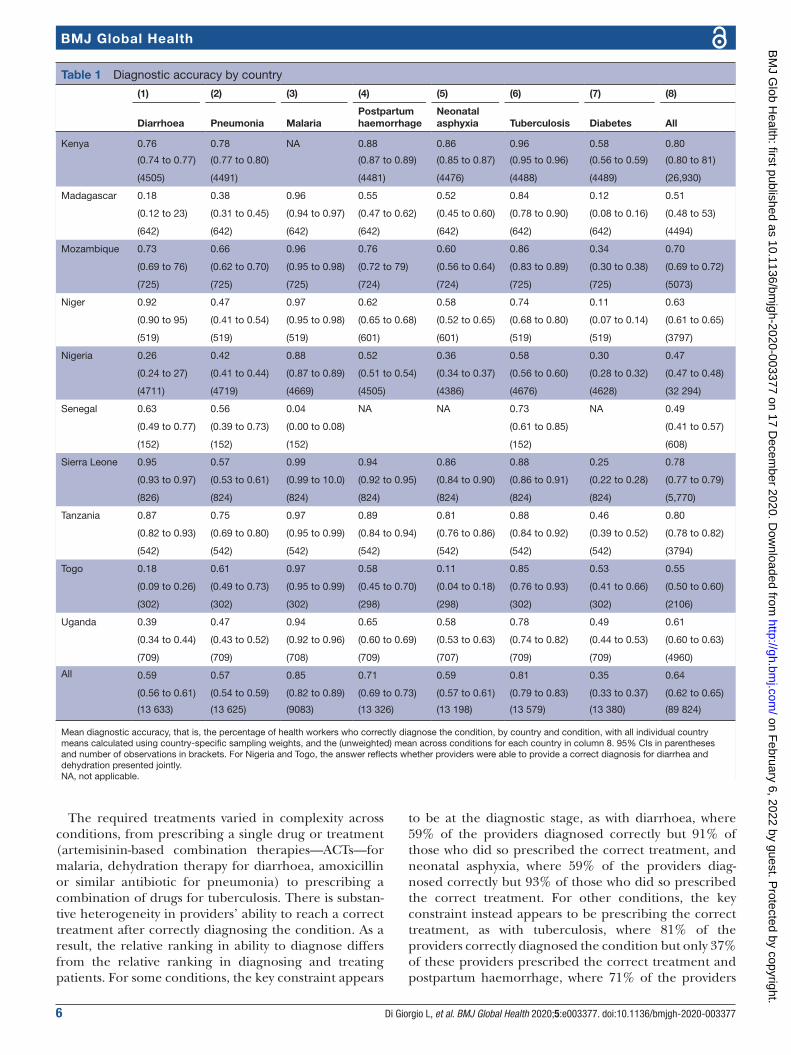
Table 1 Diagnostic accuracy by country
(1) (2) (3) (4) (5) (6) (7) (8)
Diarrhoea Pneumonia MalariaPostpartum haemorrhage
Neonatal asphyxia Tuberculosis Diabetes All
Kenya 0.76 0.78 NA 0.88 0.86 0.96 0.58 0.80
(0.74 to 0.77) (0.77 to 0.80) (0.87 to 0.89) (0.85 to 0.87) (0.95 to 0.96) (0.56 to 0.59) (0.80 to 81)
(4505) (4491) (4481) (4476) (4488) (4489) (26,930)
Madagascar 0.18 0.38 0.96 0.55 0.52 0.84 0.12 0.51
(0.12 to 23) (0.31 to 0.45) (0.94 to 0.97) (0.47 to 0.62) (0.45 to 0.60) (0.78 to 0.90) (0.08 to 0.16) (0.48 to 53)
(642) (642) (642) (642) (642) (642) (642) (4494)
Mozambique 0.73 0.66 0.96 0.76 0.60 0.86 0.34 0.70
(0.69 to 76) (0.62 to 0.70) (0.95 to 0.98) (0.72 to 79) (0.56 to 0.64) (0.83 to 0.89) (0.30 to 0.38) (0.69 to 0.72)
(725) (725) (725) (724) (724) (725) (725) (5073)
Niger 0.92 0.47 0.97 0.62 0.58 0.74 0.11 0.63
(0.90 to 95) (0.41 to 0.54) (0.95 to 0.98) (0.65 to 0.68) (0.52 to 0.65) (0.68 to 0.80) (0.07 to 0.14) (0.61 to 0.65)
(519) (519) (519) (601) (601) (519) (519) (3797)
Nigeria 0.26 0.42 0.88 0.52 0.36 0.58 0.30 0.47
(0.24 to 27) (0.41 to 0.44) (0.87 to 0.89) (0.51 to 0.54) (0.34 to 0.37) (0.56 to 0.60) (0.28 to 0.32) (0.47 to 0.48)
(4711) (4719) (4669) (4505) (4386) (4676) (4628) (32 294)
Senegal 0.63 0.56 0.04 NA NA 0.73 NA 0.49
(0.49 to 0.77) (0.39 to 0.73) (0.00 to 0.08) (0.61 to 0.85) (0.41 to 0.57)
(152) (152) (152) (152) (608)
Sierra Leone 0.95 0.57 0.99 0.94 0.86 0.88 0.25 0.78
(0.93 to 0.97) (0.53 to 0.61) (0.99 to 10.0) (0.92 to 0.95) (0.84 to 0.90) (0.86 to 0.91) (0.22 to 0.28) (0.77 to 0.79)
(826) (824) (824) (824) (824) (824) (824) (5,770)
Tanzania 0.87 0.75 0.97 0.89 0.81 0.88 0.46 0.80
(0.82 to 0.93) (0.69 to 0.80) (0.95 to 0.99) (0.84 to 0.94) (0.76 to 0.86) (0.84 to 0.92) (0.39 to 0.52) (0.78 to 0.82)
(542) (542) (542) (542) (542) (542) (542) (3794)
Togo 0.18 0.61 0.97 0.58 0.11 0.85 0.53 0.55
(0.09 to 0.26) (0.49 to 0.73) (0.95 to 0.99) (0.45 to 0.70) (0.04 to 0.18) (0.76 to 0.93) (0.41 to 0.66) (0.50 to 0.60)
(302) (302) (302) (298) (298) (302) (302) (2106)
Uganda 0.39 0.47 0.94 0.65 0.58 0.78 0.49 0.61
(0.34 to 0.44) (0.43 to 0.52) (0.92 to 0.96) (0.60 to 0.69) (0.53 to 0.63) (0.74 to 0.82) (0.44 to 0.53) (0.60 to 0.63)
(709) (709) (708) (709) (707) (709) (709) (4960)
All 0.59 0.57 0.85 0.71 0.59 0.81 0.35 0.64
(0.56 to 0.61) (0.54 to 0.59) (0.82 to 0.89) (0.69 to 0.73) (0.57 to 0.61) (0.79 to 0.83) (0.33 to 0.37) (0.62 to 0.65)
(13 633) (13 625) (9083) (13 326) (13 198) (13 579) (13 380) (89 824)
Mean diagnostic accuracy, that is, the percentage of health workers who correctly diagnose the condition, by country and condition, with all individual country means calculated using country- specific sampling weights, and the (unweighted) mean across conditions for each country in column 8. 95% CIs in parentheses and number of observations in brackets. For Nigeria and Togo, the answer reflects whether providers were able to provide a correct diagnosis for diarrhea and dehydration presented jointly.NA, not applicable.
on February 6, 2022 by guest. P
rotected by copyright.http://gh.bm
j.com/
BM
J Glob H
ealth: first published as 10.1136/bmjgh-2020-003377 on 17 D
ecember 2020. D
ownloaded from
Di Giorgio L, et al. BMJ Global Health 2020;5:e003377. doi:10.1136/bmjgh-2020-003377 7
BMJ Global Health
correctly diagnosed the condition but only 45% of them prescribed the correct treatment.
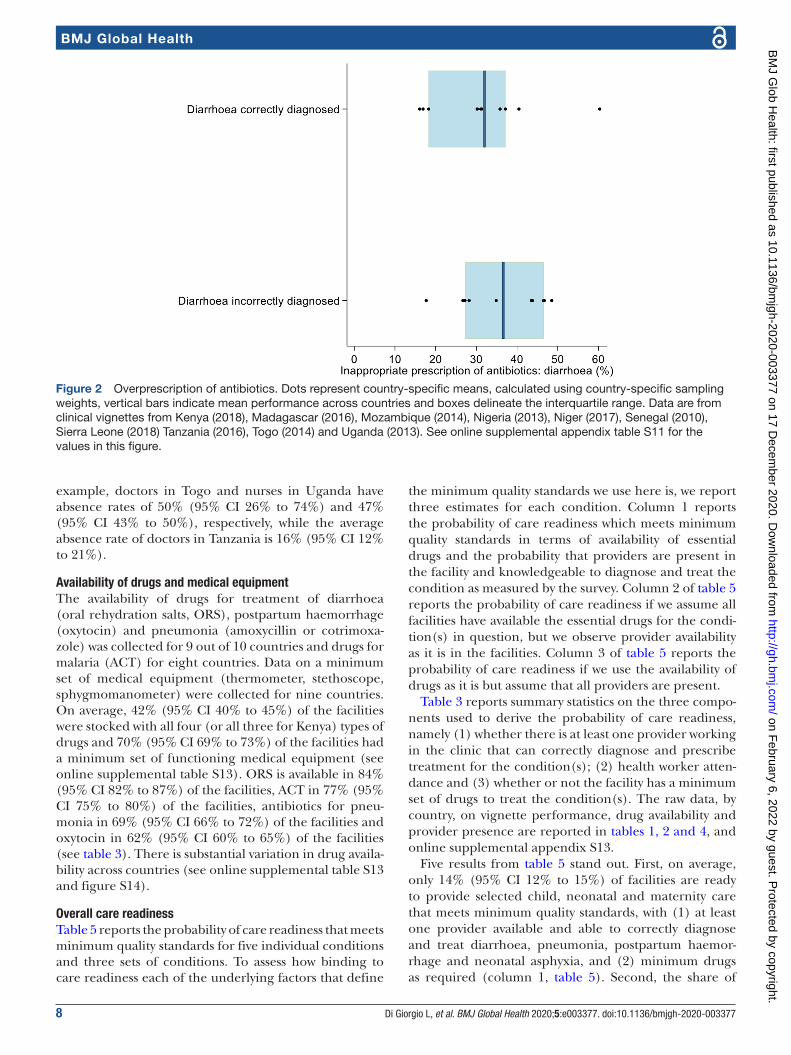
Misdiagnosis or poor knowledge about correct treat-ment can result in inappropriate prescription of anti-biotics. The vignette for diarrhoea does not call for prescription of antibiotics. However, prescription of antibiotics for diarrhoea is common among providers both when the providers diagnosed the condition correctly—32% (95% CI 29% to 35%) of the providers then prescribed antibiotics—and when they did
not—36% (95% CI 32% to 40%) of the providers then prescribe antibiotics (figure 2; online supplemental table S12).
Provider absenteeismFor quality care to be provided, providers must have sufficient knowledge to diagnose and treat patients. But providers must also be available. The rate of provider absence is, on average, 30% (95% CI 29% to 32%), with large variations across countries (see tables 3 and 4). For
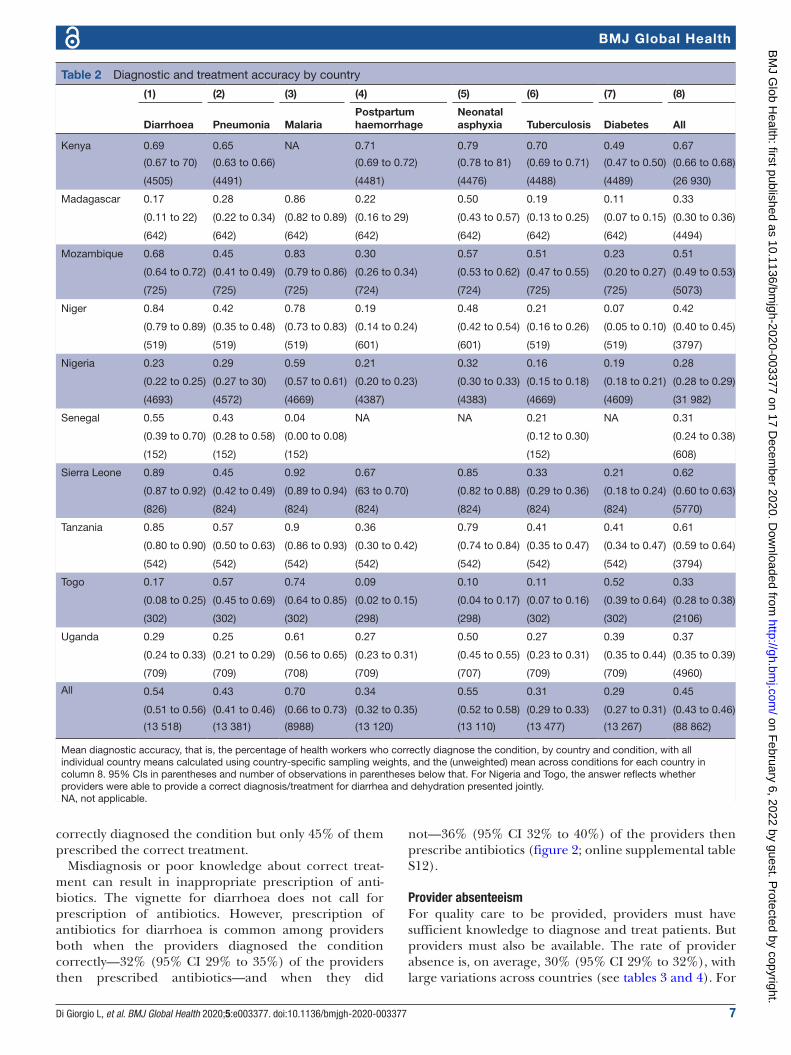
Table 2 Diagnostic and treatment accuracy by country
(1) (2) (3) (4) (5) (6) (7) (8)
Diarrhoea Pneumonia MalariaPostpartum haemorrhage
Neonatal asphyxia Tuberculosis Diabetes All
Kenya 0.69 0.65 NA 0.71 0.79 0.70 0.49 0.67
(0.67 to 70) (0.63 to 0.66) (0.69 to 0.72) (0.78 to 81) (0.69 to 0.71) (0.47 to 0.50) (0.66 to 0.68)
(4505) (4491) (4481) (4476) (4488) (4489) (26 930)
Madagascar 0.17 0.28 0.86 0.22 0.50 0.19 0.11 0.33
(0.11 to 22) (0.22 to 0.34) (0.82 to 0.89) (0.16 to 29) (0.43 to 0.57) (0.13 to 0.25) (0.07 to 0.15) (0.30 to 0.36)
(642) (642) (642) (642) (642) (642) (642) (4494)
Mozambique 0.68 0.45 0.83 0.30 0.57 0.51 0.23 0.51
(0.64 to 0.72) (0.41 to 0.49) (0.79 to 0.86) (0.26 to 0.34) (0.53 to 0.62) (0.47 to 0.55) (0.20 to 0.27) (0.49 to 0.53)
(725) (725) (725) (724) (724) (725) (725) (5073)
Niger 0.84 0.42 0.78 0.19 0.48 0.21 0.07 0.42
(0.79 to 0.89) (0.35 to 0.48) (0.73 to 0.83) (0.14 to 0.24) (0.42 to 0.54) (0.16 to 0.26) (0.05 to 0.10) (0.40 to 0.45)
(519) (519) (519) (601) (601) (519) (519) (3797)
Nigeria 0.23 0.29 0.59 0.21 0.32 0.16 0.19 0.28
(0.22 to 0.25) (0.27 to 30) (0.57 to 0.61) (0.20 to 0.23) (0.30 to 0.33) (0.15 to 0.18) (0.18 to 0.21) (0.28 to 0.29)
(4693) (4572) (4669) (4387) (4383) (4669) (4609) (31 982)
Senegal 0.55 0.43 0.04 NA NA 0.21 NA 0.31
(0.39 to 0.70) (0.28 to 0.58) (0.00 to 0.08) (0.12 to 0.30) (0.24 to 0.38)
(152) (152) (152) (152) (608)
Sierra Leone 0.89 0.45 0.92 0.67 0.85 0.33 0.21 0.62
(0.87 to 0.92) (0.42 to 0.49) (0.89 to 0.94) (63 to 0.70) (0.82 to 0.88) (0.29 to 0.36) (0.18 to 0.24) (0.60 to 0.63)
(826) (824) (824) (824) (824) (824) (824) (5770)
Tanzania 0.85 0.57 0.9 0.36 0.79 0.41 0.41 0.61
(0.80 to 0.90) (0.50 to 0.63) (0.86 to 0.93) (0.30 to 0.42) (0.74 to 0.84) (0.35 to 0.47) (0.34 to 0.47) (0.59 to 0.64)
(542) (542) (542) (542) (542) (542) (542) (3794)
Togo 0.17 0.57 0.74 0.09 0.10 0.11 0.52 0.33
(0.08 to 0.25) (0.45 to 0.69) (0.64 to 0.85) (0.02 to 0.15) (0.04 to 0.17) (0.07 to 0.16) (0.39 to 0.64) (0.28 to 0.38)
(302) (302) (302) (298) (298) (302) (302) (2106)
Uganda 0.29 0.25 0.61 0.27 0.50 0.27 0.39 0.37
(0.24 to 0.33) (0.21 to 0.29) (0.56 to 0.65) (0.23 to 0.31) (0.45 to 0.55) (0.23 to 0.31) (0.35 to 0.44) (0.35 to 0.39)
(709) (709) (708) (709) (707) (709) (709) (4960)
All 0.54 0.43 0.70 0.34 0.55 0.31 0.29 0.45
(0.51 to 0.56) (0.41 to 0.46) (0.66 to 0.73) (0.32 to 0.35) (0.52 to 0.58) (0.29 to 0.33) (0.27 to 0.31) (0.43 to 0.46)
(13 518) (13 381) (8988) (13 120) (13 110) (13 477) (13 267) (88 862)
Mean diagnostic accuracy, that is, the percentage of health workers who correctly diagnose the condition, by country and condition, with all individual country means calculated using country- specific sampling weights, and the (unweighted) mean across conditions for each country in column 8. 95% CIs in parentheses and number of observations in parentheses below that. For Nigeria and Togo, the answer reflects whether providers were able to provide a correct diagnosis/treatment for diarrhea and dehydration presented jointly.NA, not applicable.
on February 6, 2022 by guest. P
rotected by copyright.http://gh.bm
j.com/
BM
J Glob H
ealth: first published as 10.1136/bmjgh-2020-003377 on 17 D
ecember 2020. D
ownloaded from
8 Di Giorgio L, et al. BMJ Global Health 2020;5:e003377. doi:10.1136/bmjgh-2020-003377
BMJ Global Health
example, doctors in Togo and nurses in Uganda have absence rates of 50% (95% CI 26% to 74%) and 47% (95% CI 43% to 50%), respectively, while the average absence rate of doctors in Tanzania is 16% (95% CI 12% to 21%).
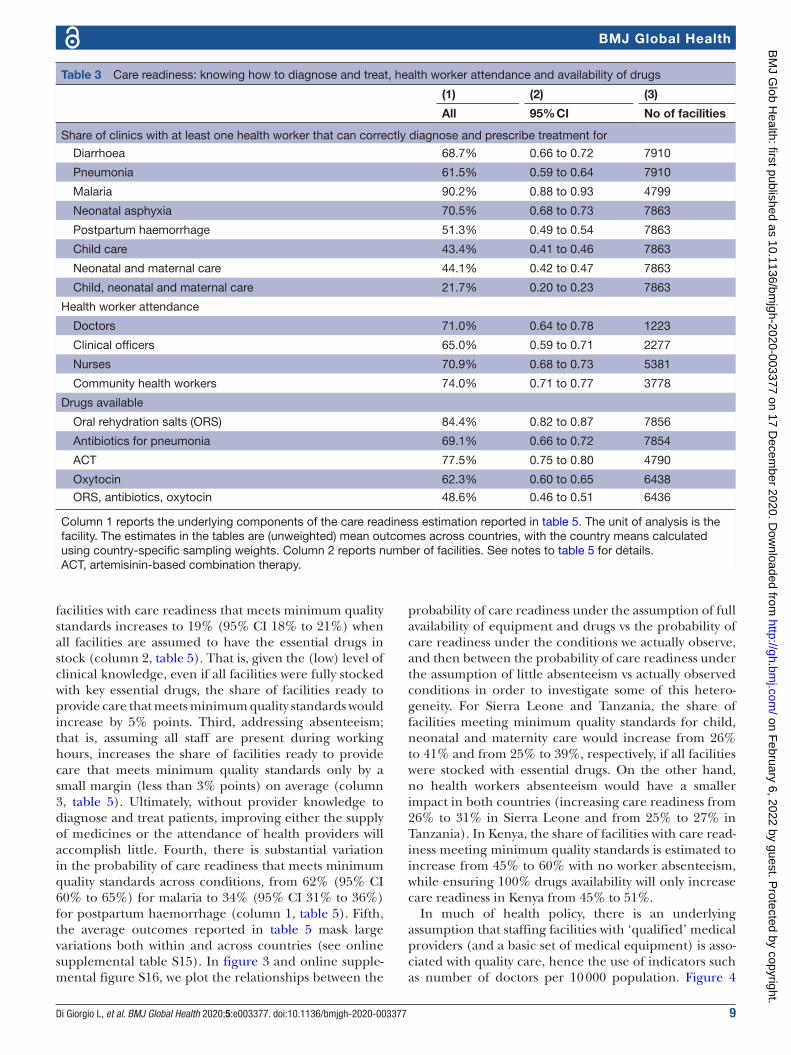
Availability of drugs and medical equipmentThe availability of drugs for treatment of diarrhoea (oral rehydration salts, ORS), postpartum haemorrhage (oxytocin) and pneumonia (amoxycillin or cotrimoxa-zole) was collected for 9 out of 10 countries and drugs for malaria (ACT) for eight countries. Data on a minimum set of medical equipment (thermometer, stethoscope, sphygmomanometer) were collected for nine countries. On average, 42% (95% CI 40% to 45%) of the facilities were stocked with all four (or all three for Kenya) types of drugs and 70% (95% CI 69% to 73%) of the facilities had a minimum set of functioning medical equipment (see online supplemental table S13). ORS is available in 84% (95% CI 82% to 87%) of the facilities, ACT in 77% (95% CI 75% to 80%) of the facilities, antibiotics for pneu-monia in 69% (95% CI 66% to 72%) of the facilities and oxytocin in 62% (95% CI 60% to 65%) of the facilities (see table 3). There is substantial variation in drug availa-bility across countries (see online supplemental table S13 and figure S14).
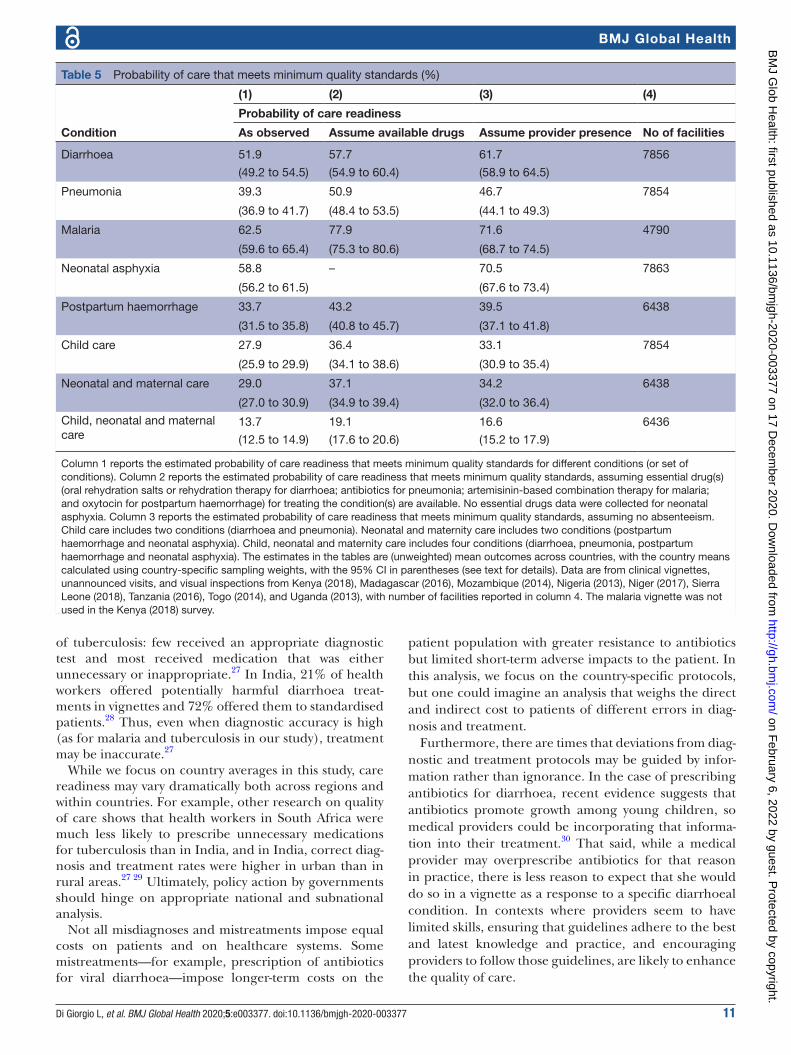
Overall care readinessTable 5 reports the probability of care readiness that meets minimum quality standards for five individual conditions and three sets of conditions. To assess how binding to care readiness each of the underlying factors that define
the minimum quality standards we use here is, we report three estimates for each condition. Column 1 reports the probability of care readiness which meets minimum quality standards in terms of availability of essential drugs and the probability that providers are present in the facility and knowledgeable to diagnose and treat the condition as measured by the survey. Column 2 of table 5 reports the probability of care readiness if we assume all facilities have available the essential drugs for the condi-tion(s) in question, but we observe provider availability as it is in the facilities. Column 3 of table 5 reports the probability of care readiness if we use the availability of drugs as it is but assume that all providers are present.
Table 3 reports summary statistics on the three compo-nents used to derive the probability of care readiness, namely (1) whether there is at least one provider working in the clinic that can correctly diagnose and prescribe treatment for the condition(s); (2) health worker atten-dance and (3) whether or not the facility has a minimum set of drugs to treat the condition(s). The raw data, by country, on vignette performance, drug availability and provider presence are reported in tables 1, 2 and 4, and online supplemental appendix S13.
Five results from table 5 stand out. First, on average, only 14% (95% CI 12% to 15%) of facilities are ready to provide selected child, neonatal and maternity care that meets minimum quality standards, with (1) at least one provider available and able to correctly diagnose and treat diarrhoea, pneumonia, postpartum haemor-rhage and neonatal asphyxia, and (2) minimum drugs as required (column 1, table 5). Second, the share of
Figure 2 Overprescription of antibiotics. Dots represent country- specific means, calculated using country- specific sampling weights, vertical bars indicate mean performance across countries and boxes delineate the interquartile range. Data are from clinical vignettes from Kenya (2018), Madagascar (2016), Mozambique (2014), Nigeria (2013), Niger (2017), Senegal (2010), Sierra Leone (2018) Tanzania (2016), Togo (2014) and Uganda (2013). See online supplemental appendix table S11 for the values in this figure.
on February 6, 2022 by guest. P
rotected by copyright.http://gh.bm
j.com/
BM
J Glob H
ealth: first published as 10.1136/bmjgh-2020-003377 on 17 D
ecember 2020. D
ownloaded from
Di Giorgio L, et al. BMJ Global Health 2020;5:e003377. doi:10.1136/bmjgh-2020-003377 9
BMJ Global Health
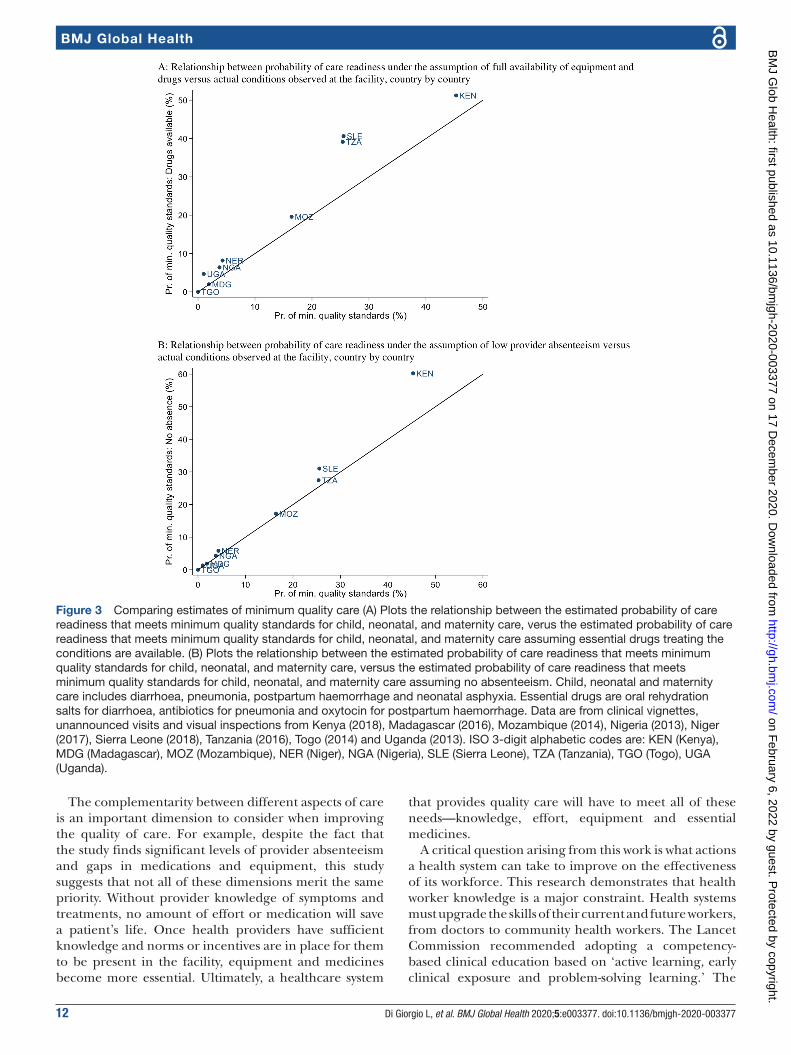
facilities with care readiness that meets minimum quality standards increases to 19% (95% CI 18% to 21%) when all facilities are assumed to have the essential drugs in stock (column 2, table 5). That is, given the (low) level of clinical knowledge, even if all facilities were fully stocked with key essential drugs, the share of facilities ready to provide care that meets minimum quality standards would increase by 5% points. Third, addressing absenteeism; that is, assuming all staff are present during working hours, increases the share of facilities ready to provide care that meets minimum quality standards only by a small margin (less than 3% points) on average (column 3, table 5). Ultimately, without provider knowledge to diagnose and treat patients, improving either the supply of medicines or the attendance of health providers will accomplish little. Fourth, there is substantial variation in the probability of care readiness that meets minimum quality standards across conditions, from 62% (95% CI 60% to 65%) for malaria to 34% (95% CI 31% to 36%) for postpartum haemorrhage (column 1, table 5). Fifth, the average outcomes reported in table 5 mask large variations both within and across countries (see online supplemental table S15). In figure 3 and online supple-mental figure S16, we plot the relationships between the
probability of care readiness under the assumption of full availability of equipment and drugs vs the probability of care readiness under the conditions we actually observe, and then between the probability of care readiness under the assumption of little absenteeism vs actually observed conditions in order to investigate some of this hetero-geneity. For Sierra Leone and Tanzania, the share of facilities meeting minimum quality standards for child, neonatal and maternity care would increase from 26% to 41% and from 25% to 39%, respectively, if all facilities were stocked with essential drugs. On the other hand, no health workers absenteeism would have a smaller impact in both countries (increasing care readiness from 26% to 31% in Sierra Leone and from 25% to 27% in Tanzania). In Kenya, the share of facilities with care read-iness meeting minimum quality standards is estimated to increase from 45% to 60% with no worker absenteeism, while ensuring 100% drugs availability will only increase care readiness in Kenya from 45% to 51%.
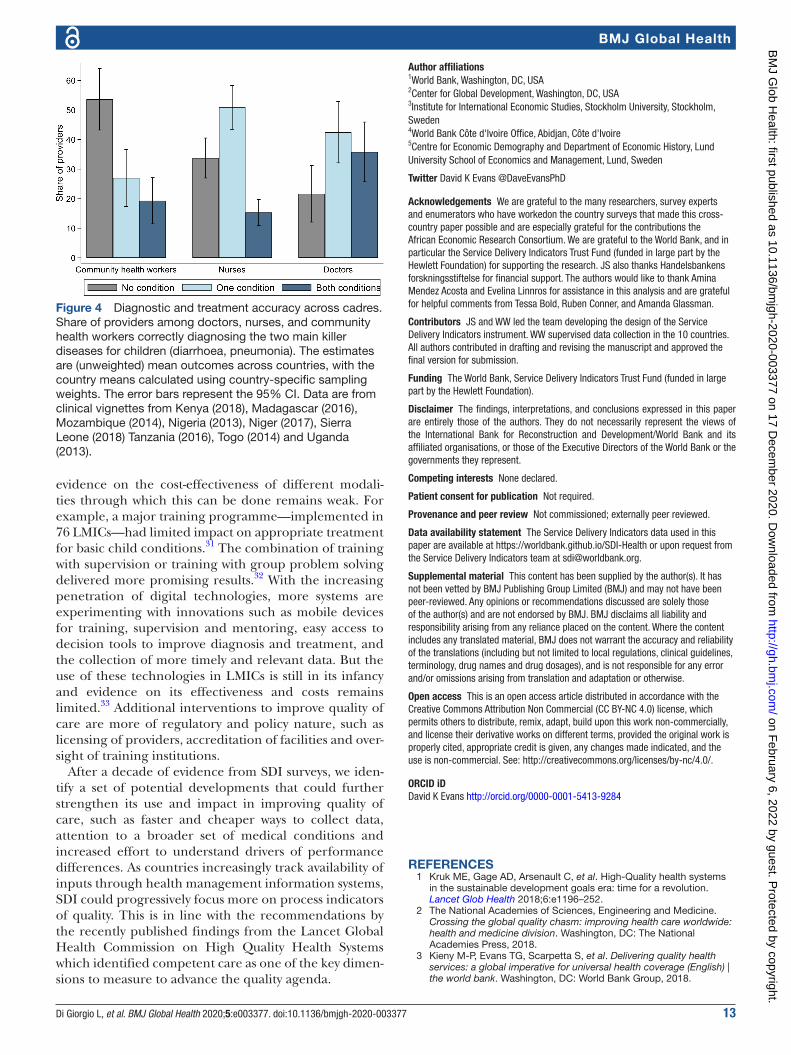
In much of health policy, there is an underlying assumption that staffing facilities with ‘qualified’ medical providers (and a basic set of medical equipment) is asso-ciated with quality care, hence the use of indicators such as number of doctors per 10 000 population. Figure 4
Table 3 Care readiness: knowing how to diagnose and treat, health worker attendance and availability of drugs
(1) (2) (3)
All 95% CI No of facilities
Share of clinics with at least one health worker that can correctly diagnose and prescribe treatment for
Diarrhoea 68.7% 0.66 to 0.72 7910
Pneumonia 61.5% 0.59 to 0.64 7910
Malaria 90.2% 0.88 to 0.93 4799
Neonatal asphyxia 70.5% 0.68 to 0.73 7863
Postpartum haemorrhage 51.3% 0.49 to 0.54 7863
Child care 43.4% 0.41 to 0.46 7863
Neonatal and maternal care 44.1% 0.42 to 0.47 7863
Child, neonatal and maternal care 21.7% 0.20 to 0.23 7863
Health worker attendance
Doctors 71.0% 0.64 to 0.78 1223
Clinical officers 65.0% 0.59 to 0.71 2277
Nurses 70.9% 0.68 to 0.73 5381
Community health workers 74.0% 0.71 to 0.77 3778
Drugs available
Oral rehydration salts (ORS) 84.4% 0.82 to 0.87 7856
Antibiotics for pneumonia 69.1% 0.66 to 0.72 7854
ACT 77.5% 0.75 to 0.80 4790
Oxytocin 62.3% 0.60 to 0.65 6438
ORS, antibiotics, oxytocin 48.6% 0.46 to 0.51 6436
Column 1 reports the underlying components of the care readiness estimation reported in table 5. The unit of analysis is the facility. The estimates in the tables are (unweighted) mean outcomes across countries, with the country means calculated using country- specific sampling weights. Column 2 reports number of facilities. See notes to table 5 for details.ACT, artemisinin- based combination therapy.
on February 6, 2022 by guest. P
rotected by copyright.http://gh.bm
j.com/
BM
J Glob H
ealth: first published as 10.1136/bmjgh-2020-003377 on 17 D
ecember 2020. D
ownloaded from
10 Di Giorgio L, et al. BMJ Global Health 2020;5:e003377. doi:10.1136/bmjgh-2020-003377
BMJ Global Health
reports the share of providers accurately diagnosing and treating the two main child killer conditions (diarrhoea and pneumonia) by different cadres in all 10 countries. While doctors are more knowledgeable than nurses, a high share of doctors do not possess sufficient knowledge to diagnose and treat the main child killer condition. On average, 36% (95% CI 26% to 46%) of doctors and 15% (95% CI 11% to 20%) of nurses can accurately diagnose and treat both conditions, while 22% (95% CI 12% to
31%) of the doctors and 34% (95% CI 27% to 41%) of the nurses fail to accurately diagnose and treat any of the conditions.
Online supplemental figure S17 illustrates how providers’ ability to diagnose and treat the two main child killer conditions relates to inputs (medical equipment (online supplemental figure S17A) and drugs (online supplemental figure S17 B,C)). Thirty- four per cent (95% CI 32% to 37%) of the facilities with functioning equipment and 29% (95% CI 24% to 35%) of the facili-ties without such equipment, have at least one provider employed which has the knowledge to diagnose and treat both conditions. Thus, in the majority of facilities, inde-pendent of access to functioning equipment, there is no provider who can diagnose and treat both conditions.
Fifty per cent (95% CI 44% to 57%) of the facilities with antibiotics in stock have at least one provider employed who has the knowledge to diagnose and treat pneumonia, while in 51% (95% CI 44% to 58%) of the facilities with ORS in stock, there is at least one provider that has the knowledge to diagnose and treat diarrhoea. About half of the facilities have at least one provider employed which has the knowledge to diagnose and treat pneumonia, and about one in four of the facilities have at least one provider employed which has the knowledge to diagnose and treat diarrhoea, but they do not have the drugs in stock to treat them (antibiotics and ORS, respectively).
DISCUSSIONThis analysis demonstrates the value of measuring clin-ical knowledge, provider availability and other structural dimensions of quality in order to provide a diagnostic measure of key challenges, most clearly (and perhaps most damagingly) manifested at the facility level, in a health system. The evidence, and more generally the SDI instrument, provides a useful way for governments to benchmark health systems performance on such measures. The SDI is complementary to other survey instruments, such as the Service Availability and Readi-ness Assessment and the Service Provision Assessment. The distinguishing characteristics of SDI are the clinical vignettes to assess providers’ clinical knowledge and the use of unannounced visits to quantify absenteeism.
This study uses the lowest common denominator across the country- specific protocols to define compa-rable care readiness criteria across countries. Moreover, there is the well- known gap between what health workers can do and what they actually do (the ‘can- do’ gap).26 For these reasons, we expect that in most surveyed coun-tries the probability of providing minimum quality care according to country- specific guidelines is even lower than that reported in this study. Other studies in the region suggest that the same low performance we observe in vignettes also appear—often to a greater extent—in tests of what providers actually do, with anonymous stan-dardised patients. In Kenya and South Africa, anony-mous standardised patients presented with symptoms
Table 4 Absence rate by country
(1) (2) (3)
Absence rate (all)
Absence rate (doctors)
Absence rate (nurses)
Kenya 0.46 0.41 0.47
(0.45 to 0.46) (0.40 to 0.43) (0.46 to 0.48)
(7838) (2139) (5699)
Madagascar 0.24 0.28 0.22
(0.20 to 0.28) (0.21 to 0.35) (0.18 to 0.26)
(1340) (574) (739)
Mozambique 0.22 0.22 0.22
(0.20 to 0.25) (0.18 to 0.27) (0.19 to 0.25)
(800) (262) (410)
Niger 0.27 0.38 0.30
(0.22 to 0.32) (0.20 to 0.55) (0.25 to 0.36)
(547) (62) (354)
Nigeria 0.28 0.24 0.29
(0.27 to 0.29) (0.17 to 0.30) (0.27 to 0.31)
(6724) (426) (1788)
Sierra Leone 0.27 0.28 0.30
(0.25 to 0.28) (0.22 to 0.35) (0.27 to 0.33)
(1663) (204) (554)
Tanzania 0.14 0.16 0.15
(0.12 to 0.16) (0.12 to 0.21) (0.12 to 0.19)
(1883) (513) (776)
Togo 0.40 0.50 0.36
(0.31 to 0.48) (0.26 to 0.74) (0.26 to 0.46)
(487) (82) (257)
Uganda 0.45 0.47 0.47
(0.42 to 0.48) (0.40 to 0.55) (0.43 to 0.50)
(1218) (257) (667)
All 0.30 0.33 0.31
(0.29 to 0.32) (0.29 to 0.37) (0.29 to 0.32)
(22 341) (4481) (11 163)
The table reports the mean absence rate for all staff with some medical training by country. Column 1: All staff with medical training (doctors, clinical officers, nurses and community health workers); column 2: doctors and clinical officers; column 3: nurses. All individual country statistics are calculated using country- specific sampling weights. 95% CIs in parentheses and number of observations in parentheses below that. A provider is marked as absent from a facility if, during the second unannounced visit, the provider is not found anywhere on the facility premises. Otherwise, the provider is marked as present.
on February 6, 2022 by guest. P
rotected by copyright.http://gh.bm
j.com/
BM
J Glob H
ealth: first published as 10.1136/bmjgh-2020-003377 on 17 D
ecember 2020. D
ownloaded from
Di Giorgio L, et al. BMJ Global Health 2020;5:e003377. doi:10.1136/bmjgh-2020-003377 11
BMJ Global Health
of tuberculosis: few received an appropriate diagnostic test and most received medication that was either unnecessary or inappropriate.27 In India, 21% of health workers offered potentially harmful diarrhoea treat-ments in vignettes and 72% offered them to standardised patients.28 Thus, even when diagnostic accuracy is high (as for malaria and tuberculosis in our study), treatment may be inaccurate.27
While we focus on country averages in this study, care readiness may vary dramatically both across regions and within countries. For example, other research on quality of care shows that health workers in South Africa were much less likely to prescribe unnecessary medications for tuberculosis than in India, and in India, correct diag-nosis and treatment rates were higher in urban than in rural areas.27 29 Ultimately, policy action by governments should hinge on appropriate national and subnational analysis.
Not all misdiagnoses and mistreatments impose equal costs on patients and on healthcare systems. Some mistreatments—for example, prescription of antibiotics for viral diarrhoea—impose longer- term costs on the
patient population with greater resistance to antibiotics but limited short- term adverse impacts to the patient. In this analysis, we focus on the country- specific protocols, but one could imagine an analysis that weighs the direct and indirect cost to patients of different errors in diag-nosis and treatment.
Furthermore, there are times that deviations from diag-nostic and treatment protocols may be guided by infor-mation rather than ignorance. In the case of prescribing antibiotics for diarrhoea, recent evidence suggests that antibiotics promote growth among young children, so medical providers could be incorporating that informa-tion into their treatment.30 That said, while a medical provider may overprescribe antibiotics for that reason in practice, there is less reason to expect that she would do so in a vignette as a response to a specific diarrhoeal condition. In contexts where providers seem to have limited skills, ensuring that guidelines adhere to the best and latest knowledge and practice, and encouraging providers to follow those guidelines, are likely to enhance the quality of care.
Table 5 Probability of care that meets minimum quality standards (%)
Condition
(1) (2) (3) (4)
Probability of care readiness
As observed Assume available drugs Assume provider presence No of facilities
Diarrhoea 51.9 57.7 61.7 7856
(49.2 to 54.5) (54.9 to 60.4) (58.9 to 64.5)
Pneumonia 39.3 50.9 46.7 7854
(36.9 to 41.7) (48.4 to 53.5) (44.1 to 49.3)
Malaria 62.5 77.9 71.6 4790
(59.6 to 65.4) (75.3 to 80.6) (68.7 to 74.5)
Neonatal asphyxia 58.8 – 70.5 7863
(56.2 to 61.5) (67.6 to 73.4)
Postpartum haemorrhage 33.7 43.2 39.5 6438
(31.5 to 35.8) (40.8 to 45.7) (37.1 to 41.8)
Child care 27.9 36.4 33.1 7854
(25.9 to 29.9) (34.1 to 38.6) (30.9 to 35.4)
Neonatal and maternal care 29.0 37.1 34.2 6438
(27.0 to 30.9) (34.9 to 39.4) (32.0 to 36.4)
Child, neonatal and maternal care
13.7 19.1 16.6 6436
(12.5 to 14.9) (17.6 to 20.6) (15.2 to 17.9)
Column 1 reports the estimated probability of care readiness that meets minimum quality standards for different conditions (or set of conditions). Column 2 reports the estimated probability of care readiness that meets minimum quality standards, assuming essential drug(s) (oral rehydration salts or rehydration therapy for diarrhoea; antibiotics for pneumonia; artemisinin- based combination therapy for malaria; and oxytocin for postpartum haemorrhage) for treating the condition(s) are available. No essential drugs data were collected for neonatal asphyxia. Column 3 reports the estimated probability of care readiness that meets minimum quality standards, assuming no absenteeism. Child care includes two conditions (diarrhoea and pneumonia). Neonatal and maternity care includes two conditions (postpartum haemorrhage and neonatal asphyxia). Child, neonatal and maternity care includes four conditions (diarrhoea, pneumonia, postpartum haemorrhage and neonatal asphyxia). The estimates in the tables are (unweighted) mean outcomes across countries, with the country means calculated using country- specific sampling weights, with the 95% CI in parentheses (see text for details). Data are from clinical vignettes, unannounced visits, and visual inspections from Kenya (2018), Madagascar (2016), Mozambique (2014), Nigeria (2013), Niger (2017), Sierra Leone (2018), Tanzania (2016), Togo (2014), and Uganda (2013), with number of facilities reported in column 4. The malaria vignette was not used in the Kenya (2018) survey.
on February 6, 2022 by guest. P
rotected by copyright.http://gh.bm
j.com/
BM
J Glob H
ealth: first published as 10.1136/bmjgh-2020-003377 on 17 D
ecember 2020. D
ownloaded from
12 Di Giorgio L, et al. BMJ Global Health 2020;5:e003377. doi:10.1136/bmjgh-2020-003377
BMJ Global Health
The complementarity between different aspects of care is an important dimension to consider when improving the quality of care. For example, despite the fact that the study finds significant levels of provider absenteeism and gaps in medications and equipment, this study suggests that not all of these dimensions merit the same priority. Without provider knowledge of symptoms and treatments, no amount of effort or medication will save a patient’s life. Once health providers have sufficient knowledge and norms or incentives are in place for them to be present in the facility, equipment and medicines become more essential. Ultimately, a healthcare system
that provides quality care will have to meet all of these needs—knowledge, effort, equipment and essential medicines.
A critical question arising from this work is what actions a health system can take to improve on the effectiveness of its workforce. This research demonstrates that health worker knowledge is a major constraint. Health systems must upgrade the skills of their current and future workers, from doctors to community health workers. The Lancet Commission recommended adopting a competency- based clinical education based on ‘active learning, early clinical exposure and problem- solving learning.’ The
Figure 3 Comparing estimates of minimum quality care (A) Plots the relationship between the estimated probability of care readiness that meets minimum quality standards for child, neonatal, and maternity care, verus the estimated probability of care readiness that meets minimum quality standards for child, neonatal, and maternity care assuming essential drugs treating the conditions are available. (B) Plots the relationship between the estimated probability of care readiness that meets minimum quality standards for child, neonatal, and maternity care, versus the estimated probability of care readiness that meets minimum quality standards for child, neonatal, and maternity care assuming no absenteeism. Child, neonatal and maternity care includes diarrhoea, pneumonia, postpartum haemorrhage and neonatal asphyxia. Essential drugs are oral rehydration salts for diarrhoea, antibiotics for pneumonia and oxytocin for postpartum haemorrhage. Data are from clinical vignettes, unannounced visits and visual inspections from Kenya (2018), Madagascar (2016), Mozambique (2014), Nigeria (2013), Niger (2017), Sierra Leone (2018), Tanzania (2016), Togo (2014) and Uganda (2013). ISO 3- digit alphabetic codes are: KEN (Kenya), MDG (Madagascar), MOZ (Mozambique), NER (Niger), NGA (Nigeria), SLE (Sierra Leone), TZA (Tanzania), TGO (Togo), UGA (Uganda).
on February 6, 2022 by guest. P
rotected by copyright.http://gh.bm
j.com/
BM
J Glob H
ealth: first published as 10.1136/bmjgh-2020-003377 on 17 D
ecember 2020. D
ownloaded from
Di Giorgio L, et al. BMJ Global Health 2020;5:e003377. doi:10.1136/bmjgh-2020-003377 13
BMJ Global Health
evidence on the cost- effectiveness of different modali-ties through which this can be done remains weak. For example, a major training programme—implemented in 76 LMICs—had limited impact on appropriate treatment for basic child conditions.31 The combination of training with supervision or training with group problem solving delivered more promising results.32 With the increasing penetration of digital technologies, more systems are experimenting with innovations such as mobile devices for training, supervision and mentoring, easy access to decision tools to improve diagnosis and treatment, and the collection of more timely and relevant data. But the use of these technologies in LMICs is still in its infancy and evidence on its effectiveness and costs remains limited.33 Additional interventions to improve quality of care are more of regulatory and policy nature, such as licensing of providers, accreditation of facilities and over-sight of training institutions.
After a decade of evidence from SDI surveys, we iden-tify a set of potential developments that could further strengthen its use and impact in improving quality of care, such as faster and cheaper ways to collect data, attention to a broader set of medical conditions and increased effort to understand drivers of performance differences. As countries increasingly track availability of inputs through health management information systems, SDI could progressively focus more on process indicators of quality. This is in line with the recommendations by the recently published findings from the Lancet Global Health Commission on High Quality Health Systems which identified competent care as one of the key dimen-sions to measure to advance the quality agenda.
Author affiliations1World Bank, Washington, DC, USA2Center for Global Development, Washington, DC, USA3Institute for International Economic Studies, Stockholm University, Stockholm, Sweden4World Bank Côte d'Ivoire Office, Abidjan, Côte d'Ivoire5Centre for Economic Demography and Department of Economic History, Lund University School of Economics and Management, Lund, Sweden
Twitter David K Evans @DaveEvansPhD
Acknowledgements We are grateful to the many researchers, survey experts and enumerators who have workedon the country surveys that made this cross- country paper possible and are especially grateful for the contributions the African Economic Research Consortium. We are grateful to the World Bank, and in particular the Service Delivery Indicators Trust Fund (funded in large part by the Hewlett Foundation) for supporting the research. JS also thanks Handelsbankens forskningsstiftelse for financial support. The authors would like to thank Amina Mendez Acosta and Evelina Linnros for assistance in this analysis and are grateful for helpful comments from Tessa Bold, Ruben Conner, and Amanda Glassman.
Contributors JS and WW led the team developing the design of the Service Delivery Indicators instrument. WW supervised data collection in the 10 countries. All authors contributed in drafting and revising the manuscript and approved the final version for submission.
Funding The World Bank, Service Delivery Indicators Trust Fund (funded in large part by the Hewlett Foundation).
Disclaimer The findings, interpretations, and conclusions expressed in this paper are entirely those of the authors. They do not necessarily represent the views of the International Bank for Reconstruction and Development/World Bank and its affiliated organisations, or those of the Executive Directors of the World Bank or the governments they represent.
Competing interests None declared.
Patient consent for publication Not required.
Provenance and peer review Not commissioned; externally peer reviewed.
Data availability statement The Service Delivery Indicators data used in this paper are available at https:// worldbank. github. io/ SDI- Health or upon request from the Service Delivery Indicators team at sdi@ worldbank. org.
Supplemental material This content has been supplied by the author(s). It has not been vetted by BMJ Publishing Group Limited (BMJ) and may not have been peer- reviewed. Any opinions or recommendations discussed are solely those of the author(s) and are not endorsed by BMJ. BMJ disclaims all liability and responsibility arising from any reliance placed on the content. Where the content includes any translated material, BMJ does not warrant the accuracy and reliability of the translations (including but not limited to local regulations, clinical guidelines, terminology, drug names and drug dosages), and is not responsible for any error and/or omissions arising from translation and adaptation or otherwise.
Open access This is an open access article distributed in accordance with the Creative Commons Attribution Non Commercial (CC BY- NC 4.0) license, which permits others to distribute, remix, adapt, build upon this work non- commercially, and license their derivative works on different terms, provided the original work is properly cited, appropriate credit is given, any changes made indicated, and the use is non- commercial. See: http:// creativecommons. org/ licenses/ by- nc/ 4. 0/.
ORCID iDDavid K Evans http:// orcid. org/ 0000- 0001- 5413- 9284
REFERENCES 1 Kruk ME, Gage AD, Arsenault C, et al. High- Quality health systems
in the sustainable development goals era: time for a revolution. Lancet Glob Health 2018;6:e1196–252.
2 The National Academies of Sciences, Engineering and Medicine. Crossing the global quality chasm: improving health care worldwide: health and medicine division. Washington, DC: The National Academies Press, 2018.
3 Kieny M- P, Evans TG, Scarpetta S, et al. Delivering quality health services: a global imperative for universal health coverage (English) | the world bank. Washington, DC: World Bank Group, 2018.
Figure 4 Diagnostic and treatment accuracy across cadres. Share of providers among doctors, nurses, and community health workers correctly diagnosing the two main killer diseases for children (diarrhoea, pneumonia). The estimates are (unweighted) mean outcomes across countries, with the country means calculated using country- specific sampling weights. The error bars represent the 95% CI. Data are from clinical vignettes from Kenya (2018), Madagascar (2016), Mozambique (2014), Nigeria (2013), Niger (2017), Sierra Leone (2018) Tanzania (2016), Togo (2014) and Uganda (2013).
on February 6, 2022 by guest. P
rotected by copyright.http://gh.bm
j.com/
BM
J Glob H
ealth: first published as 10.1136/bmjgh-2020-003377 on 17 D
ecember 2020. D
ownloaded from
14 Di Giorgio L, et al. BMJ Global Health 2020;5:e003377. doi:10.1136/bmjgh-2020-003377
BMJ Global Health
4 Kruk ME, Gage AD, Joseph NT, et al. Mortality due to low- quality health systems in the universal health coverage era: a systematic analysis of amenable deaths in 137 countries. Lancet 2018;392:2203–12.
5 Björkman M, Svensson J. Power to the People: Evidence from a Randomized Field Experiment on Community- Based Monitoring in Uganda *. Q J Econ 2009;124:735–69.
6 STROBE statement: available checklists. Available: https://www. strobe- statement. org/ index. php? id= available- checklists [Accessed 3 Sep 2020].
7 Miller GE. The assessment of clinical skills/competence/performance. Acad Med 1990;65:S63–7.
8 Kwan A, Daniels B, Saria V, et al. Variations in the quality of tuberculosis care in urban India: a cross- sectional, standardized patient study in two cities. PLoS Med 2018;15:e1002653.
9 King JJC, Das J, Kwan A, et al. How to do (or not to do) … using the standardized patient method to measure clinical quality of care in LMIC health facilities. Health Policy Plan 2019;34:625–34.
10 Kwan A, Daniels B, Bergkvist S, et al. Use of standardised patients for healthcare quality research in low- and middle- income countries. BMJ Glob Health 2019;4:e001669.
11 Bold T, Gauthier B, Svensson J, et al. Delivering service indicators in education and health in Africa: a proposal. World Bank, 2010.
12 Bold T, Svensson J, Gauthier B, et al. Service delivery indicators: pilot in education and health care in Africa. Bergen, Norway: Chr. Michelsen Institute, 2011.
13 Atakhodjaeva R, Rockmore C. Service Delivery Indicators Report - Niger, 2017. Available: http:// documents. worldbank. org/ curated/ en/ 833401504769240083/ Niger- Service- delivery- indicators- health [Accessed 2 Mar 2020].
14 Martin GH, Pimhidzai O. Service Delivery Indicators Report - Kenya, 2013. Available: https://www. sdindicators. org/ countries/ kenya [Accessed 2 Mar 2020].
15 Wane W, Martin GH. Service Delivery Indicators Report - Uganda, 2013. Available: https://www. sdindicators. org/ countries/ uganda [Accessed 2 Mar 2020].
16 World Bank. Service Delivery Indicators Report - Senegal, 2012. Available: https://www. sdindicators. org/ countries/ senegal [Accessed 2 Mar 2020].
17 World Bank. Service Delivery Indicators Report - Tanzania, 2016. Available: http:// documents. worldbank. org/ curated/ en/ 162561467996712439/ Tanzania- Health [Accessed 2 Mar 2020].
18 Martin G, Shireen M. Kenya public expenditure tracking and service delivery indicator survey (PETS- plus), health questionnaire 2012, 2017. Available: https:// microdata. worldbank. org/ index. php/ catalog/ 2751/ related- materials
19 Pimhidzai O. Nigeria service delivery indicator health 2013, 2017. Available: https:// microdata. worldbank. org/ index. php/ catalog/ 2559/ related- materials
20 Wane W. Tanzania service delivery indicators (SDI) survey health questionnaires 2014, 2017. Available: https:// microdata. worldbank. org/ index. php/ catalog/ 2582/ related- materials
21 Rockmore C. Togo Enquete sur les Indicateurs de Prestations de services (SDI), Santé 2013, 2017. Available: https:// microdata. worldbank. org/ index. php/ catalog/ 2560/ related- materials
22 Wane W. Uganda Service Delivery Indicator Health Questionnaire, Module H1 - Service Delivery 2013, 2017. Available: https:// microdata. worldbank. org/ index. php/ catalog/ 2750/ related- materials
23 Peabody JW, Luck J, Glassman P, et al. Comparison of vignettes, standardized patients, and chart abstraction: a prospective validation study of 3 methods for measuring quality. JAMA 2000;283:1715–22.
24 Peabody JW, Luck J, Glassman P, et al. Measuring the quality of physician practice by using clinical vignettes: a prospective validation study. Ann Intern Med 2004;141:771.
25 Chaudhury N, Hammer J, Kremer M, et al. Missing in action: teacher and health worker absence in developing countries. J Econ Perspect 2006;20:91–116.
26 Ibnat F, Leonard KL, Bawo L, et al. The Three- Gap model of health worker performance. The World Bank, 2019.
27 Daniels B, Kwan A, Pai M, et al. Lessons on the quality of tuberculosis diagnosis from standardized patients in China, India, Kenya, and South Africa. J Clin Tuberc Other Mycobact Dis 2019;16:100109.
28 Mohanan M, Vera- Hernández M, Das V, et al. The know- do gap in quality of health care for childhood diarrhea and pneumonia in rural India. JAMA Pediatr 2015;169:349.
29 Das J, Holla A, Das V, et al. In urban and rural India, a standardized patient study showed low levels of provider training and huge quality gaps. Health Aff 2012;31:2774–84.
30 Gough EK, Moodie EEM, Prendergast AJ, et al. The impact of antibiotics on growth in children in low and middle income countries: systematic review and meta- analysis of randomised controlled trials. BMJ 2014;348:g2267.
31 Rowe AK, Rowe SY, Holloway KA, et al. Does shortening the training on integrated management of childhood illness guidelines reduce its effectiveness? A systematic review. Health Policy Plan 2012;27:179–93.
32 Rowe AK, Labadie G, Jackson D, et al. Improving health worker performance: an ongoing challenge for meeting the sustainable development goals. BMJ 2018;362:k2813.
33 Free C, Phillips G, Galli L, et al. The effectiveness of mobile- health technology- based health behaviour change or disease management interventions for health care consumers: a systematic review. PLoS Med 2013;10:e1001362.
on February 6, 2022 by guest. P
rotected by copyright.http://gh.bm
j.com/
BM
J Glob H
ealth: first published as 10.1136/bmjgh-2020-003377 on 17 D
ecember 2020. D
ownloaded from