analysis of contaminants in food - fsai
TRANSCRIPT

Seminar on Contaminants in Food FSAI
17th
November 2009
Analysis of Contaminants in Food
Michael O’Keeffe
Scientific Committee FSAI

Analysis of Contaminants in Food
• Residue analysis – what is involved?
• Methods used
• Research advances
• New approaches
• Contaminants – what are found?
• Closing comments

Aims of Residue Analysis in Food•
to identify the residue status of food
using the least number of samples/tests1.
least interference with business (production, sale, shipment, etc.)
2.
lowest cost of testing
3.
highest assurance of food safety and/or compliance

Characteristics of Residue Analysis
Target Sample Result
Specific food item(carcase; milk tanker)
Part of the food item(tissue sample; milk sample)
Applicable only to the
specific food item(sample/test method)
Specific batch of food(herd; milk silo)
Sample(s) from the batch(tissue sample(s); milk sample(s))
Applicable to the batch(sampling/sample/test method)
Survey of food(retail products)
Samples from multiple
sources(multiple samples)
Reflecting status of food
covered by survey(design/sampling/sample/test method)
Monitoring programme(national herd; milk production)
Samples covering the
national production(range of samples)
Reflecting status of food in
national production(scope/design/sampling/sample/test method)
HIGH
s u
rety
LOW

What Do Results Tell Us?Expected Occurrence in the Population based on Test Results (95%
confidence)
Number of
Positive
Results
Number of Samples
10 20 100 250 1000
0 0‐27 % 0‐20 % 0‐4 % 0‐1 % 0 %
1 0‐40 % 0‐23 % 0‐5 % 0‐4 % 0‐2 %
5 22‐78 % 10‐47 % 2‐11 % 3‐9 % 4‐7 %
•
If no positive in 297 random samples, occurrence in population is ≤
1% (with 95% confidence)
• “No residue detected in sample”
–
means just that!

How are Results Interpreted?
• Maximum Residue Limit (MRL)‐
level of permitted drug allowed in a food
• Maximum Level (ML)‐
up to level of a contaminant allowed in a food
• Minimum Required Performance Limit (MRPL)‐
minimum content that must be detected
• Decision Limit (CCα)/Detection Capability (CCβ)-
method capability to identify and measure
• Limit of Quantification/Detection (LOQ, LOD)‐
measures of method sensitivity
F
O
O
D
M
E
T
H
O
D

Central Meat Control Laboratory
State LaboratoryIrish Equine CentreAshtown Food Research Centre
Pesticide Control Service, DAFF
State Laboratory Pesticide Control Service
Marine Institute
Radiological Protection Institute
Public Analyst Laboratories

Approaches to Residue Testing
1.
Large numbers of samples for testing:‐
SCREENING tests for similar
contaminants
(aflatoxins; antimicrobials; steroids)
‐
CONFIRMATORY tests
2.
Samples for testing for large numbers of contaminants:
‐
multi‐residue CONFIRMATORY tests(antiparasitics; pesticides; dioxins)

Screening TestsAim:
rapid, inexpensive clearance of large numbers of samples as “negative”
• Immunoassays
-
Mycotoxins
(ELISA)
Veterinary Drugs
• Automated IAs
-
Veterinary Drugs
(Biosensor)
• Cell Receptor Assay
-
Dioxins
(e.g. CALUX)
• Inhibition Assays
-
Antimicrobials
(Six-plate; DELVO)
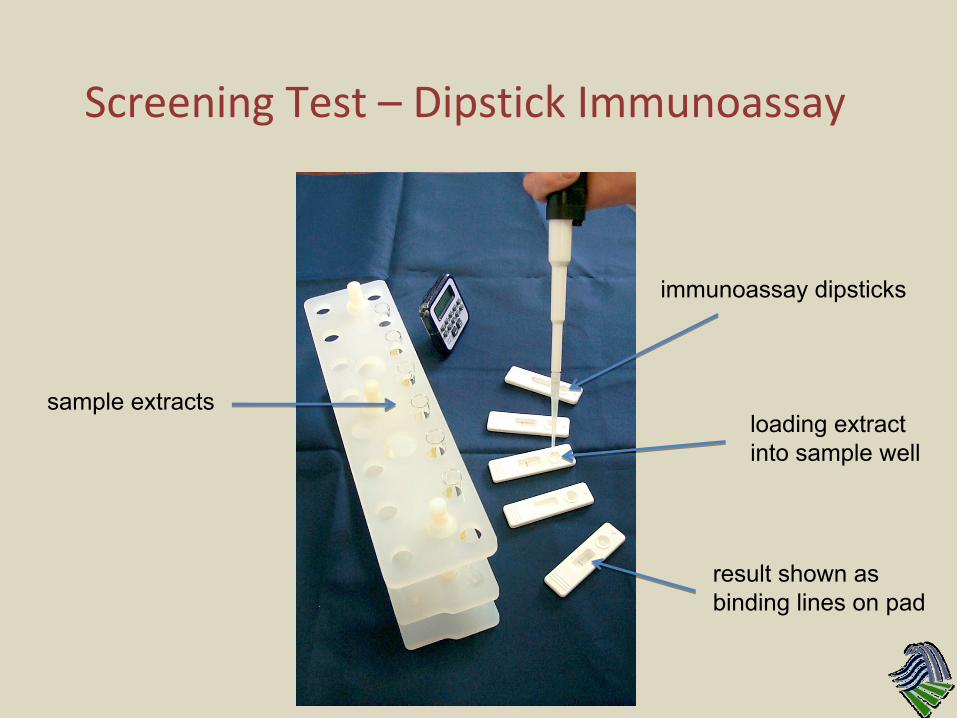
Screening Test –
Dipstick Immunoassay
sample extractsloading extract into sample well
immunoassay dipsticks
result shown as binding lines on pad

Screening Test – Biacore Biosensor

Biacore Biosensor ‐
operation
Reflected intensity
Incident light
Gold film
Resonance angle:
prism

Biacore Biosensor ‐
operation
Reflected intensityIncident
light
’
Change of resonance angle by altered surface
flow
Binding of analyte

Biacore Biosensor – measurement
stable complex
regeneration
bind
ing
TIME (s)
RES
PO
NSE
(R
U)
concentration

Confirmatory TestsAim:
accurate, specific, quantitative results for samples screened as “query positive”
• LC (or GC) –
mass spectrometry
for Organic residues (Banned substances, Veterinary Drugs, Mycotoxins,
Dioxins, Pesticides, etc.)•
LC (or GC) –
other detectors
for Organic residues(permitted
Veterinary Drugs, Mycotoxins, Pesticides)
• Atomic absorption/emission spectrometry
for Heavy Metals

HPLC‐MS/MS
LC-MS/MS
CHROMATOGRAM OF MULTIPLE
RESIDUES

Residue Analysis supported by Research

Components of a Residue MethodMethod: Nitroimidazoles in Liver (2007)
Liver sample
LC-MS/MS
Repeat (x2)

Residue Extraction using “QuEChERS”
Dispersive SPE -
QuEChERS-
mixing of a sorbent with sample extract in a mini-centrifuge tube to retain matrix interferents, but not the analytes
•
No need for: SPE cartridges, apparatus, elution, evaporation
•
Less sorbent, less time, less cost
•
Better interaction of sorbent with sample extract for cleanup
• Fast, easy procedure
MixedExtract
Dispersive-SPE clean-up

Residue Extraction using “QuEChERS”
Developed for use in Pesticide analysis by USDA
More than 250 Pesticides extracted with 70-110% (mainly 90-100%) recovery
At AFRC Teagasc developed for anthelmintic drug residue analysis, combined with UPLC-MS/MS
• 38 drug residues included
• Good sensitivity achieved
• Replacing 3 methods
• Reducing analysis time (×
5)
• Reducing solvent waste (×
10)

Improvements in Chromatography
HPLC‐MS/MS Feature UPLC‐MS/MS
5 µm
0.3 ml/min
30°C
32 min
242
particle size
flow‐rate
temperature
run time
measurements
1.7 µm
0.45 ml/min
65°C
16 min
344
Example:Pesticides in Fruit
and Vegetables
decreased
run time
expanded
scope
improved
efficiency
increased
sensitivity
more samples
tested

Research guiding Testing
SARAF/v
1
Protein-bound Nitrofuran Residues
Liver
released, derivatised nitrofuran
metabolites
LC-MS/MS
ethyl acetate extraction (3 x 6 ml)
• Occur as bound residues in edible tissues, for long time after treatment
• Released by acid conditions of stomach as toxic metabolites (banned)
solvent washes acid incubation derivatisation
Test method targets bound residues:

New Approaches to Testing
Challenge – how to detect hormone abuse in animals?
‐ conventional testing of only 0.05% of animals
‐
use of low level hormone “cocktails”
and “designer”
drugs
Solution –
blood screening for indicator metabolites
‐ proteins, creatinine, enzymes, electrolytes, urea, glucose
Confirmation by LC‐MS/MS analysis
‐ testing of hair samples where hormones accumulate

“Indirect”
Testing
0 7 14 21 28 35 4225
50
75
100
125
150ControlTreated
**
Day
Cre
atin
ine
(m
ol/l)
0 7 14 21 28 35 4225
50
75
100
125
150ControlTreated** ** * *
Day
Cre
atin
ine
(m
ol/l)
Heifers treated with nortestosterone
Steers treated with oestradiol

“Indirect”
Testing
Heifers treated with nortestosterone
prediction success rate =
91.4%
Steers treated with oestradiol
prediction success rate =
95.7%
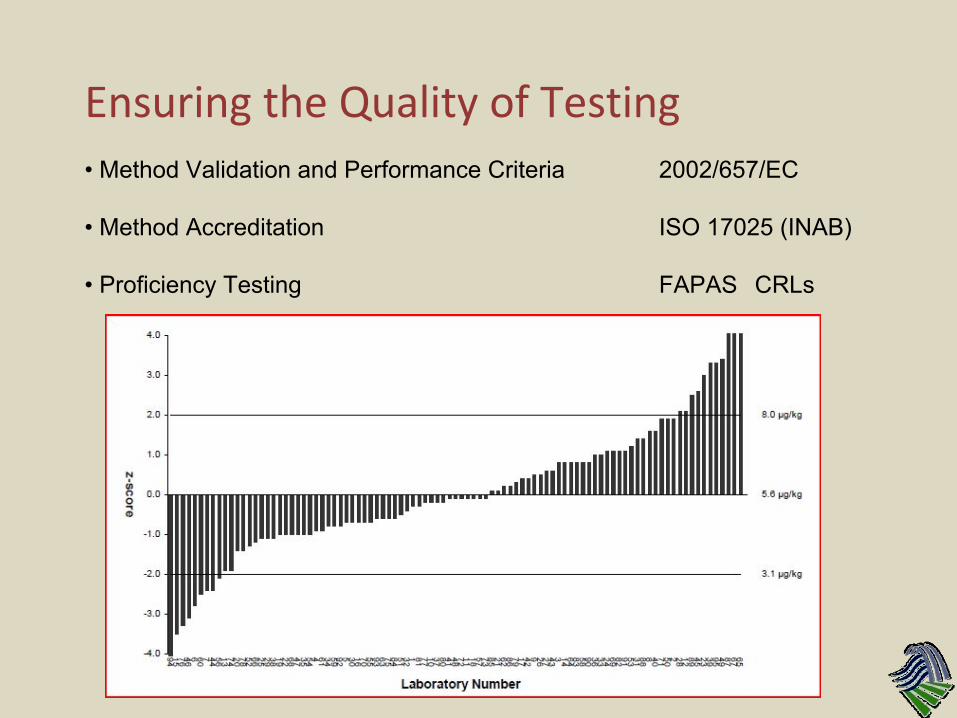
Ensuring the Quality of Testing• Method Validation and Performance Criteria 2002/657/EC
• Method Accreditation
ISO 17025 (INAB)
• Proficiency Testing
FAPAS
CRLs

What do the Results show?
http://nfrd.teagasc.ie

Dioxins + PCBs
“Background Samples (n = 24) “Potential impact”
Samples (n = 13)
2000 2004 2006 2007 2000 2004 2006 2007
Mean 0.49 0.37 0.45 0.39 Mean 0.48 0.41 0.51 0.50
Max 0.95 0.66 1.06 0.52 Max 0.83 1.06 1.83 1.51
EU Regulation (1881/2006): 6 pg WHO‐TEQ/g fat
Dioxins + Dioxin-like PCBs in Milk (pg WHO-TEQ/g fat) –
EPA Surveys
BUT! –
see Rhod Evans story on Dioxins

RadioactivityDoses to Heavy Seafood Consumers (*) due to Radiocaesium
(*200 g fish plus 20 g shellfish per day)
Conclusion: “it is safe to eat seafood landed at Irish fishing ports”
Dose of radiation from naturally-occurring polonium-210 in seafood = 148 µSievert

Marine Biotoxins
Shellfish
Amnesic Shellfish
Poisoning (ASP) toxins
Azaspiracid (AZP) toxins Diarrhetic Shellfish
Poisoning (DSP) toxins
Samples < ML > ML*(%)
Samples < ML > ML#
(%)Samples < ML > ML$
(%)
Mussels 112 111 1(0.9%)
1621 1402 219(13.5%)
1612 1604 8(0.5%)
Scallops 541 505 36(6.7%)
(*20 µg/g domoic acid) (#0.16 µg/g AZP equivalents) ($0.16 µg/g okadaic acid)

Pesticides
Monitoring Programme for Fruit and Vegetables 2003‐2007
Profile: some 900 samples of ≈
75 commodities tested each
year(approximately 25% domestic and 75% imported)
Year: 2003 2004 2005 2006 2007
Pesticides tested 89 118 148 153 292
Pesticides found 45 53 75 72 103
Testing:
Results: 44% (2003) – 59% (2007) samples contain pesticides
3% to 5% of these pesticides are at levels >MRLs

Are Pesticides a Food Safety Issue?
Pesticide intake per kg body weight
PesticideADI
(mg/kg
bw/d)
Mean 97.5 percentile
of intake
99.9 percentile
of intake
mg % of
ADI
mg % of
ADI
mg % of
ADI
Iprodione 0.06 0.00015 0.25 0.00075 1.24 0.00665 11.1
Thiabendazole 0.1 0.00070 0.70 0.00458 4.58 0.02577 25.8
Cyprodinil 0.03 0.00007 0.24 0.00016 0.53 0.00029 0.96
Chlorpyriphos 0.01 0.00013 1.26 0.00075 7.5 0.00181 18.1
Estimated Exposure of Children to 4 Pesticides, based on Food Consumption
Conclusion: intake of pesticides by children are below ADI values

Veterinary Drugs ‐
Antimicrobials

Veterinary Drugs ‐
Antiparasitics
Increased incidence of anthelmintics found with improved testing:
Incidence of Non‐compliant Samples
2005 2006 2007 2008
none 1 ×
ovine 2 ×
milk 1 ×
bovine5 ×
milk1 ×
ovine1 ×
poultry
Application of new method QuEChERS extraction coupled with UPLC-MS/MS

Veterinary Drugs ‐
Anticoccidialss
Coccidiosis serious in poultry
Nicarbazin –
a very effective drug
Maximum limit: 200 µg/kg in liver
Research leading to Improved Practices
BUT! –
very difficult to eliminate

Veterinary Drugs –
Industry Self‐monitoring
Directive 96/23/EC (S.I. 143/2007) applies for Foods of Animal Origin
Bovine Ovine Porcine Poultry Milk
Antimicrobials
2329/0
Β‐Agonists
4121/0
Trenbolone
4183/0
Antimicrobials
3147/0
Anticoccidials
379/0
Antimicrobials
29025/0
Chloramphenicol
501/0
Sedatives
161/0
Antimicrobials
2840/1
Anticoccidials
1160/30
Antimicrobials
524569/2108
Pesticides
383/0
2008 Self-monitoring