analysis of coyote mitochondrial dna genotype frequencies ... · analysis of coyote mitochondrial...
TRANSCRIPT

Copyright Q 1991 by the Genetics Society of America
Analysis of Coyote Mitochondrial DNA Genotype Frequencies: Estimation of the Effective Number of Alleles
Niles Lehman’ and Robert K. Wayne Department of Biology, University of Calijornia, Los Angeles, Calfornia 90024-1606
Manuscript received September 4, 1990 Accepted for publication February 4, 1991
ABSTRACT A restriction-site survey of 327 coyotes (Canis latrans) from most parts of their North American
range reveals 32 mitochondrial DNA (mtDNA) genotypes. The genotypes are not strongly partitioned in space, suggesting that there is high gene flow among coyote subpopulations. Consequently, each new geographic location added to the study has a decreasing probability of containing a mtDNA genotype that had not been previously discovered. This being the case, by using Monte Carlo sampling experiments, we can estimate the total number of genotypes that would be found if all possible localities were surveyed. This estimate of total genotypic variability agrees qualitatively with estimates based on theoretical considerations of the expected number of alleles in a stable population. We also predict effective population sizes from genotype data. The accuracy of these estimates is thought to be dependent on the fact that coyotes are not highly genetically structured, a situation which may apply to highly mobile species.
T HE analysis of mitochondrial DNA (mtDNA) sequence variation has become an established
technique for making evolutionary comparisons both within and between species. The use of restriction- fragment length polymorphisms (RFLPs) in particular has been adopted as an efficient way of assaying a well-dispersed fraction of the mtDNA genome for nucleotide sequence heterogeneity. Until DNA se- quencing technologies advance to the point where surveys of large sample sizes can be performed and analyzed quickly on multiple mtDNA genes, RFLP studies will continue to possess broad appeal.
An intrinsic problem associated with RFLP analyses is that because only a fraction of the total genome is assayed (typically 1-5% using a manageable battery of restriction endonucleases), inevitably some varia- tion that actually exists within or between populations will not be detected. Consequently, the assignment of composite fragment patterns into distinct genotypes will depend on which enzymes are used, and it would be unwise to make direct interspecific comparisons if the same battery of enzymes is not used on each species. Moreover differences in sample sizes between studies further confound such comparisons.
It is of interest then to develop a measure of mtDNA RFLP variability which takes into account the sample size and number of restriction sites which are assayed. This problem is equivalent to an estimation of the nucleotide diversity, ?r (NEI and LI 1979), or the effective number of alleles, nb, with the constraint that
’ Current address: Department of Molecular Biology MB8, Research lnstitute of Scripps Clinic, 10666 North Torrey Pines Road, La Jolla, Cali- fornia 92037.
Genetics 148: 405-4 16 (June, 199 1)
the allelic states are detected and defined by a pre- specified number and kind of restriction enzymes. For the nonrecombining mtDNA genome, we consider each RFLP genotype as a separate allele. Estimation of total allelic variation can be made either from projections of empirical genotype frequency data or from theoretical considerations which make use of simple demographic parameters. In this paper we compare the results from these two methods.
Estimation from empirical data requires knowledge of two characteristics of the species. First, a detailed description of the genotypic variability within the species must be available. We assume that most studies of natural populations will actually sample only a small proportion of the total census number. Surveying every individual within a species is clearly not a com- mon option, but it may be possible to estimate the total number of genotypes from a well-designed sam- pling program. Second, in order to project to a “par- ametric” value of populational diversity, one should know the extent to which genotypes are partitioned in space, using a statistic such as FsT. For example, if a species is essentially panmictic throughout its range (FST near zero), then sampling a large number of individuals, regardless of location, may be sufficient to estimate total variability. Yet if a species is strongly partitioned into local demes (FsT near one), then each deme should be represented in the survey as well. For this reason the use of less structured species with high gene flow among populations (termed category IV species by AVISE et al. 1987) may be preferable when testing population-genetic hypotheses with empirical data (AVISE, BALL and ARNOLD 1988).

406 N. Lehman and R. K. Wayne
Estimation from theory requires a model which incorporates mutation, drift, and sampling theory to calculate the expected number of alleles in a popula- tion. Again, it is necessary to know the extent to which the species is genetically subdivided in space as well as the number of alleles observed in a particular sample, but it is not necessary to know the frequency distri- bution of these alleles if the shape of the distribution has reached a stable configuration over time (KARLIN and MCGREGOR 1972).
Our previous study of mitochondrial DNA variation in coyotes (Canis Zatrans) (LEHMAN et al. 1991) has been expanded so that we may compare our results with theoretical expectations. Using 21 distinct re- striction endonucleases, we have surveyed 327 coyotes from many parts of their current geographic range. The coyote appears to be a good choice for estimation of total genotypic variation for the following reasons. First, it possesses great dispersal capabilities, as evi- denced by rapid range expansions. The historical range of the coyote was confined to the southern and western portions of North America, extending east to southern Wisconsin, northwestern Indiana, western Arkansas, and central Texas (NOWAK 1979). How- ever, since 1900 it has spread into Alaska, southern Canada, and the coastal states without human trans- portation. As a large, mobile carnivore, the coyote is capable of dispersing over hundreds of kilometers and has proven to be successful in most terrestrial habitats ( c j BEKOFF and WELLS 1986; VOIGT and BERG 1987). Thus one can expect, a priori, coyotes to have exten- sive gene flow between localities and a series of closely related mtDNA genotypes, and thus be a category IV species. Second, relative to many small terrestrial ver- tebrates, coyotes have a continuous North American distribution. This is true not only in space but in time, as they are abundantly represented in the fossil record extending back into the late Pliocene, at least 2 million years before present (NOWAK 1979). Thus, at least over its historical geographic range, the coyote may be described as having a large, stable population in which equilibrium gene frequencies can be studied. Finally, from a practical standpoint, large numbers of coyote tissue samples are easy to obtain from which high molecular weight DNA can be extracted. This is a result of the high quantity of individuals which are trapped continent-wide in predator control programs.
The sample size and design of the current study allow equilibrium models of genotype turnover to be tested with empirical data. An estimate of total geno- typic variation can then be made and compared to that from other species.
MATERIALS AND METHODS
Samples of organs or whole blood were collected and analyzed for mitochondrial DNA restriction-fragment
length polymorphisms as described by LEHMAN et al. (1 99 1) with the addition of 87 new individuals (Table 1, Figure 1). Notably, these newer samples include individuals from LOU- isiana, Mississippi and Connecticut, as well as additional individuals from Alaska and California. In total, we have defined 25 localities, each of which usually represents an area covered by one or two counties spanning a circle with radius of 50 km or less. An exception to this generalization is locality %xn which includes all 9 individuals we have sampled from the southeastern United States. However, the Southeast has been populated by coyotes only in the last half century (NOWAK 1979) and may be justifiably consid- ered a single population. This is also true of the New England coyotes, locality “w” (NOWAK 1979).
Mitochondrial DNA genotypes were constructed from composite restriction-fragment patterns of all 2 1 enzymes (4 LANSMAN et al. 1983). The presence and absence of restriction sites was deduced from these fragment patterns and used to construct a phylogenetic tree of all genotypes by maximum parsimony (version 2.4 of PAUP; SWOFFORD 1985). The tree was rooted with an outgroup, the gray wolf genotype W1 (LEHMAN et al. 1991). Genetic distances in terms of percent nucleotide sequence divergence between genotypes were calculated by the restriction-site method of NEI and LI (1979), corrected for the use of enzymes which recognize different numbers of nucleotides.
To describe gene flow and genetic partitioning at differ- ent hierarchical levels, three sets of geographic groupings were made (Table 1). Set I arranges the total sample into 7 subpopulations representing regions of the North American continent, set I1 into 12 intermediate-sized subpopulations, and set 111 into 17 smaller subpopulations, A measure of gene flow that corrects for the confounding effects of recent ancestry was determined by the method of SLATKIN and MADDISON (1989). Because this method requires that all subpopulations be reduced to the smallest sample size, we felt that too much data would be lost if it were applied to the data as arranged in sets I1 and 111. This method was applied to the data as arranged in set 1 by reducing the number of subpopulations from seven to six through the elimination of the smallest (subpopulation “x”) and equaliz- ing their sample sizes to 17 coyotes each. Then, an estimate of the minimum number of migration events among the subpopulations (s) was calculated by hand from the phylo- genetic tree of coyote genotypes and used to estimate a 95% confidence interval for the number of migrants per gener- ation among subpopulations (Nm) by interpolation from Table 1 of SLATKIN and MADDISON (1 989).
Genetic partitioning of populations was quantified using a variation on classical F statistics for mtDNA proposed by NEI and TAJIMA (1983) in which maximum-likelihood esti- mates of within- and among-population nucleotide diversity are generated by iteration. These calculations were per- formed on an IBM PC using the Quick-BASIC program “HAPLO” written by LYNCH and CREASE (1 990).
In order to estimate total genotypic diversity from the observed genotypes and their frequencies, we needed to assume that population-genetic structuring was weak (see below). If genetic differentiation is primarily among individ- uals within subpopulations as opposed to among subpopu- lations, and if sampling localities were of equal sample size, then we would expect a relationship between additional localities sampled and number of genotypes discovered which was curvilinear, approaching an asymptote with mon- otonically decreasing slope. With these assumptions, by sam- pling randomly without replacement from empirical locali- ties we could project the asymptote, which would represent the parametric number of genotypes existing in the species.

Coyote Mitochondrial DNA 407
TABLE 1
Sampling localities
Subpopulation affiliation #
Location in Figure 1
a b
C
d
e
f g h
Locality description
Kenai Peninsula, Alaska King, Snohomish, and Thurston
Counties, Washington Swan Hills, Alberta Sierra and Plumas Counties,
Madera and Mariposa Counties,
Mendocino County, California Sonoma County, California Napa and Solano Counties, Cali-
California
California
Sample size Set I Set I1 Set 111
14 25
2 9
10
10 10 10
fornia 1 Alameda County, California 10 2 4 5 j San Louis Obispo County, Cali- 10 2 5 6
k Santa Barbara County, Califor- 10 2 5 6 fornia
nia 1 Kern County, California 20 2 5 7 m Ventura and Western Los An- 21 2 6 8
n Eastern Los Angeles County, 32 2 6 9 geles Counties, California
California 0 San Bernardino County, Cali- 10 2 6 10
P 9 r
S t
U
V
W X
Y
fornia San Diego County, California Cache County, Utah Lubbock (N = 1 ) and Webb
Counties, Texas Lancaster County, Nebraska Ft. Frances, Ontario (N = 1)
and St. Louis Co., Minnesota Upper Peninsula, Michigan Ogemaw, Oscoda, and Kalkasa
Connecticut (N = 1 ) and Maine Florida (N = l), Louisiana ( N =
6), and Mississippi (N = 2) Riding Mountain National Park,
Manitoba
Counties, Michigan
10 4
10
10 22
5 17
17 9
20
2 3 3
3 4
4 4
5 6
7
6 7 7
8 9
9 9
10 1 1
12
10 1 1 1 1
12 13
14 14
15 16
17
Total 327
Therefore, a Monte Carlo simulation computer program was written which added each of the 25 localities to an expanding list in random order, tabulating after each new locality the total number of genotypes discovered as a func- tion of the total number of localities sampled. This proce- dure was repeated an arbitrarily large number of times ( N = 10,000) so that coordinates for each point converged to average values with high precision. These average values were then plotted and fitted to a curve of general form
y = ax/(x + 6) where y represents the total number of genotypes found, x represents the total number of localities sampled, a describes the asymptote and 6 describes the rate of decline in the value of the slope. Curve fitting was performed by the NONLIN module of the SYSTAT statistical package for the Apple Macintosh PC to estimate the parameters a and 6 (WILKINSON 1986).
This equation was chosen because it is a simple expression
which has the desired properties of a finite asymptote and convex shape. Its general form is based on the expression for the probability that the ( r + 1)-th gene drawn from a population will be of a new allelic type not represented in the first r genes drawn, which is O / ( O + r ) , where 0 is an estimable characteristic of the locus to be described below (EWENS 1972). We tested its appropriateness by running a separate simulation in which each individual was treated as a locality. In this case, within-subpopulation diversity does not exist and the shape of the resulting curve should be determined by the statistical properties of sampling from a single panmictic population.
To compare the results obtained in coyotes to those from other species, the above technique was applied to published data from the deer mouse, Peromyscus maniculatus (LANS- MAN et al. 1983) and the black-backedjackal, Canis mesomelas (WAYNE et al. 1990). P. maniculatus was chosen for compar- ison because it is a widespread North American mammal
408 N. Lehman and R. K. Wayne
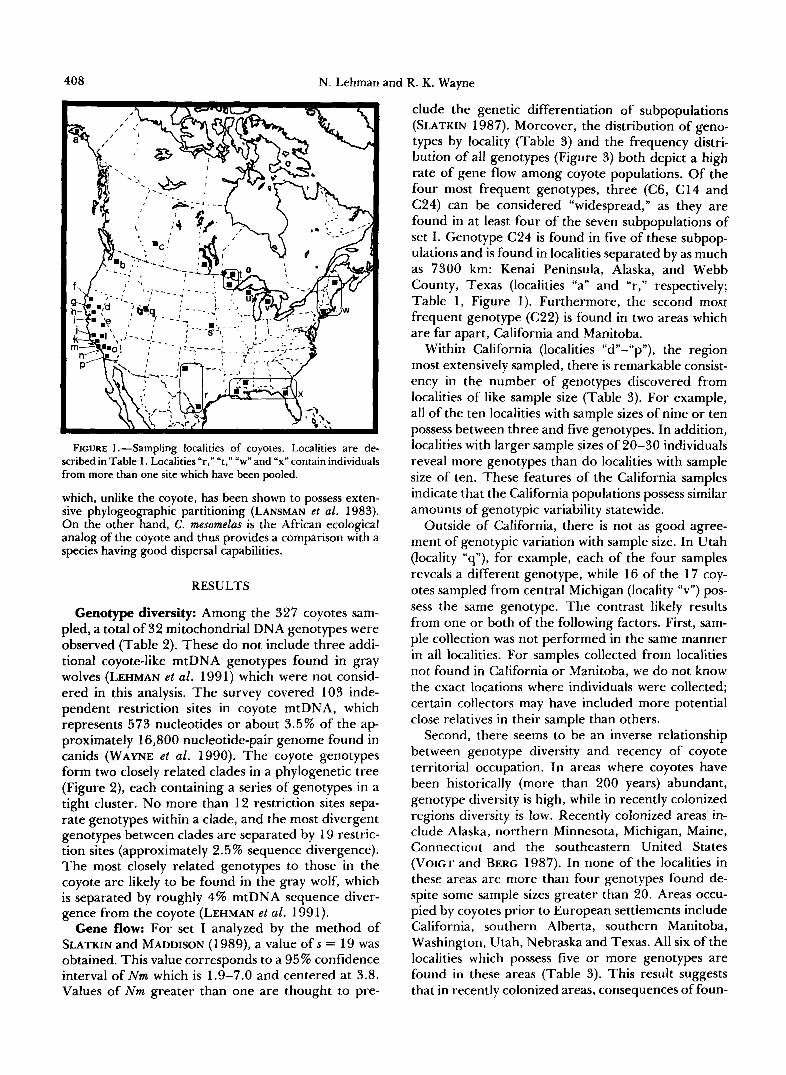
FIGURE 1.-Sampling localities of coyotes. Localities are de- scribed in Table l . Localities “r,” “t,” ”w” and “x” contain individuals from more than one site which have been pooled.
which, unlike the coyote, has been shown to possess exten- sive phylogeographic partitioning (LANSMAN et al. 1983). On the other hand, C. mesomelas is the African ecological analog of the coyote and thus provides a comparison with a species having good dispersal capabilities.
RESULTS
Genotype diversity: Among the 327 coyotes sam- pled, a total of 32 mitochondrial DNA genotypes were observed (Table 2). These do not include three addi- tional coyote-like mtDNA genotypes found in gray wolves (LEHMAN et al. 199 1) which were not consid- ered in this analysis. The survey covered 103 inde- pendent restriction sites in coyote mtDNA, which represents 573 nucleotides or about 3.5% of the ap- proximately 16,800 nucleotide-pair genome found in canids (WAYNE et al. 1990). The coyote genotypes form two closely related clades in a phylogenetic tree (Figure 2), each containing a series of genotypes in a tight cluster. No more than 12 restriction sites sepa- rate genotypes within a clade, and the most divergent genotypes between clades are separated by 19 restric- tion sites (approximately 2.5% sequence divergence). The most closely related genotypes to those in the coyote are likely to be found in the gray wolf, which is separated by roughly 4% mtDNA sequence diver- gence from the coyote (LEHMAN et al. 1991).
Gene flow: For set I analyzed by the method of SLATKIN and MADDISON (1 989), a value of s = 19 was obtained. This value corresponds to a 95% confidence interval of N m which is 1.9-7.0 and centered at 3.8. Values of N m greater than one are thought to pre-
clude the genetic differentiation of subpopulations (SLATKIN 1987). Moreover, the distribution of geno- types by locality (Table 3) and the frequency distri- bution of all genotypes (Figure 3) both depict a high rate of gene flow among coyote populations. Of the four most frequent genotypes, three (C6, C14 and C24) can be considered “widespread,” as they are found in at least four of the seven subpopulations of set I . Genotype C24 is found in five of these subpop- ulations and is found in localities separated by as much as 7300 km: Kenai Peninsula, Alaska, and Webb County, Texas (localities “a” and “r,” respectively; Table 1, Figure 1). Furthermore, the second most frequent genotype (C22) is found in two areas which are far apart, California and Manitoba.
Within California (localities “d”-“p”), the region most extensively sampled, there is remarkable consist- ency in the number of genotypes discovered from localities of like sample size (Table 3). For example, all of the ten localities with sample sizes of nine or ten possess between three and five genotypes. In addition, localities with larger sample sizes of 20-30 individuals reveal more genotypes than do localities with sample size of ten. These features of the California samples indicate that the California populations possess similar amounts of genotypic variability statewide.
Outside of California, there is not as good agree- ment of genotypic variation with sample size. In Utah (locality “q”), for example, each of the four samples reveals a different genotype, while 16 of the 17 coy- otes sampled from central Michigan (locality “v”) pos- sess the same genotype. The contrast likely results from one or both of the following factors. First, sam- ple collection was not performed in the same manner in all localities. For samples collected from localities not found in California or Manitoba, we do not know the exact locations where individuals were collected; certain collectors may have included more potential close relatives in their sample than others.
Second, there seems to be an inverse relationship between genotype diversity and recency of coyote territorial occupation. In areas where coyotes have been historically (more than 200 years) abundant, genotype diversity is high, while in recently colonized regions diversity is low. Recently colonized areas in- clude Alaska, northern Minnesota, Michigan, Maine, Connecticut and the southeastern United States (VOIGT and BERG 1987). In none of the localities in these areas are more than four genotypes found de- spite some sample sizes greater than 20. Areas occu- pied by coyotes prior to European settlements include California, southern Alberta, southern Manitoba, Washington, Utah, Nebraska and Texas. All six of the localities which possess five or more genotypes are found in these areas (Table 3). This result suggests that in recently colonized areas, consequences of foun-

Coyote Mitochondrial DNA
TABLE 2
A description of restriction-enzyme fragment patterns in coyotes
409
~ ~~
Enzymes
G e n o t y p e a b c d e f g h i j k l m n o p q r s t U
c 1 c c c c c c c c c c c c c c c c c c c c c
c 3 C C A C C C A C C C B C C A A C C A C C C c 4 C C C C C B C C C C A C B C C C C C C C C c 5 C C C C C C C C C A A B C C C C C C C C C
c 7 C C A C C C B C C C B A C C B C A A C C C C8 C C B C A A C C C C I C A C C C C C A C C c 9 C C A C A C C C C C I C C C C C C C C C C
C2 C C C C C C C C C C A C B C C C C C C C C
C6 C C C C C C C C C C A C C C C A C C C C C
C l O C C B C A C C C C C I C C C C C C C C C C C11 C C C C C A C C C A A C A C C C C C C C C C 1 2 C C D C C C A C C C B C C C A C C A C C C C 1 3 C C C C C C C C C A H C C C C C C C C C C C 1 4 C C C C C C C C C C D C C C C C C C C C C C 1 5 C C C C C C C C C C A C C C C C C B C C C C 1 6 C C C C C C C C C C F C B C C C C C C C A C 1 7 C C B C A C C C C C E C C C C C C E C C C C 1 8 C C C C C C C C C C G C C C C C C C A C C C 1 9 C C B C C C C C C C A C C C C C C C C C C C 2 0 C C A C C C A C C C B C E C D C C A C C B C21 C C E B C C C C C A A C C C C C C C C C C C 2 2 C C A C C C A C C C B C C C A C C A C C C C 2 3 C C C C C C C C C C A C D C C C C C A C C C 2 4 C C C C C C C C C C A C C C C C C C C C A C 2 5 C C C C C C C C C E D C C B C C D C C C C C 2 6 C C C C C C A C C C M C C C A C E G B C C C 2 7 C C E C C F C C C A A C A C C C C C C C C C 2 8 C C C C C C C C C C H C C C C C C C C C C C 2 9 C C C C C A C C C C A C D C C C C C C C C C 3 0 C C C C C C C C C C A C C C C C C C A C C C 3 1 C C A C C C A C C C B C B C A C C A C C C C 3 2 C C C C C C C C C E N C C B C C C C C C C
Distinct patterns are given different letters. The most common pattern in coyotes is given the designation C and the others are designated A, B, D, etc. The enzymes used are the following: a) BglII; b) BamHI; c) BclI; d) BglI; e) EstEII; r) BstUI; g) StuI; h) ClaI; i) DraI; j) EcoRV; k) HincII; 1) ScaI; m) HhaI; n) NcoI; 0) EcoRI; p) HindIII; q) XbaI; r) AccI; s) ApaI; t) SstI; u) XmnI.
der effects are exhibited in the lower variability of mtDNA genotypes.
Population subdivision: In none of the three sets of subpopulation grouping is geographic partitioning significant (Table 4). At the lowest hierarchical level, set 111, the proportion of total genetic variability due to among-population differentiation (NsT) is 0.29 and not statistically significant using a D-test (LYNCH and CREASE 1990). Population subdivision should be most apparent at this level, because even in species with high gene flow there is likely to be a lag time between the advent of new mtDNA mutations and the spread of the mutations throughout the species. Accordingly, as subpopulation sizes decrease, the D statistic, which reflects the probability that the null hypothesis of no subdivision can be rejected, increases.
Phylogeographic partitioning (AVISE et al. 1987) in the coyote appears to be weak as well. The phyloge- netic tree of all the genotypes (Figure 2) contains two distinct clades: a larger group with 25 of the genotypes
and a smaller one with the remaining seven. The large clade includes a tight group with genotypes which are specific to areas as distant as southern California (e.g. C1 and C4), Nebraska (C13) and the northern states (C18). At the same time, the small clade includes California-specific genotypes (C3, C7 and C31), a Nebraska-specific genotype (C 12), and a Manitoba- specific genotype (C22). Both clades contain wide- spread genotypes, C14 in the large clade and C22 in the small clade. Furthermore, a UPGMA clustering analysis based on nucleotide similarity values among the 17 subpopulations (set 111), shows that, although the California populations seem to cluster together as do the central and eastern states, there are some noticeable inconsistencies (Figure 4). The southern California subpopulation (#lo) groups with those from northern states of Alaska and Minnesota, while the Manitoba subpopulation (#17) groups with the other Californian subpopulations. In addition, closely situated California localities can be clustered at very

410 N. Lehman and R. K. Wayne
I w 1 L c1
I k- C27
C15
I k2;l3
- c 9 c 1 0 - c 3
c 7 ” c 1 2
c 2 2 - C31
c 2 0
C26
FIGURE 2.-Phylogenetic tree of all mtDNA genotypes discov- ered in coyotes. The tree was constructed from a parsimony analysis of restriction-site data using the branch-and-bound option of PAUP and was rooted using a genotype found in the gray wolf (W 1) as an outgroup. Phylogeny shown is a consensus tree of many equiparsi- monious trees and has a length of 91. The most distantly related coyote mtDNA genotypes, C7 and C27, possess sequences which are approximately 2.5% different based on the estimation technique of NEI and LI (1979).
low levels of similarity (e.g. subpopulations #4 and #5 are both from northern California but are very distant by the clustering analysis).
The phylogeographic analysis, combined with the low NST values, verify our expectation that gene flow among coyote populations would be high enough to treat the species as one which is not highly structured. Our results are similar to those of MACKENZIE (1 988) who used allozyme electrophoresis of nuclear genes, and many of the same individuals included in this study, to measure phylogeographic patterns. Allo- zyme data showed that widely separated localities are genetically similar and that gene flow was high enough to preclude support of the geographic delineations of the 20 morphologically defined coyote subspecies.
Estimation of the total number of genotypes: The results of 10,000 replicate runs of the Monte Carlo simulation of coyote locality sampling demonstrate that as more localities are added, the less likely it is that new genotypes are to be found (Figure 5). Ideally, all localities would have identical sample sizes. This is clearly impractical for most studies, although an effort was made here during sample collection for most localities to include 10-20 individuals. The localities have an average of 13.1 individuals, with a standard deviation of 7.0.
The curve fitted to the points has the general equa-
tion Y = ax/@ + b) , which was chosen to give a constantly decreasing slope (consistent with the de- crease in likelihood of discovering new genotypes at new localities) and a finite asymptote (consistent with the existence of a finite number of genotypes). Non- linear curve fitting provided an estimate of a to be 49.0 and b to be 13.8. This curve fit the Monte Carlo data points extremely well (R = 0.999). Thus, given the assumptions of complete panmixia and unbiased sampling, we woulci estimate there to be approxi- mately 45-50 mtDNA genotypes, as defined by our panel of 21 restriction enzymes, represented in coy- otes within our sampling area.
The extreme case of no geographic partitioning can be modeled by disregarding geography and treating individuals as localities in a single population. In this artificial situation, one would expect that the asymp- tote projected from an appropriate curve-fitting equa- tion would equal the observed number of genotypes. When this is done with our data, curve fitting gives a high value of R = 0.992 and an asymptote a of 37.3, which is not much higher than the observed number of 32, indicating that the formula y = ax/(% + 6 ) may be adequate at approximating the asymptote.
The Peromyscus maniculatus survey originally de- scribed by LANSMAN et al. (1983) now includes 192 individuals from 39 localities spanning a similar North American range as the current coyote study (J. NEI- GEL, unpublished data). Each locality contains 1-1 0 individuals, with an average of 4.9. The mtDNA in the P. maniculatus study was digested with eight re- striction enzymes to reveal a total of 80 enzyme rec- ognition sites and 61 composite genotypes. Of the 61 genotypes, 52 are found only at a single locality and no genotype was found at more than seven of the 39 localities. The Monte Carlo simulation run on these data suggests a linear relationship between localities surveyed and genotypes found (Figure 6), indicating that the probability of encountering a new P. mani- culatus genotype at each sampled locality is very high. Nonlinear curve fitting to the equation described above gives an asymptote a of 365.4 ( R = 0.999).
The Canis mesomelas survey by WAYNE et al. (1 990) included 64 individuals from six localities within a 100,000 km2 area in eastern Africa. This area is considerably smaller than the areas encompassed by the coyote and deer mice surveys, but the average number of individuals in each locality (10.7) and the distances between localities were similar to the Cali- fornia localities in the coyote survey. With 17 restric- tion enzymes, a total of 78 restriction sites are revealed but only four composite black-backed jackal geno- types. The genotypes are well dispersed tliroughout the localities, such that the Monte Carlo simulation describes a nonlinear curve with asymptote a of 4.6,

Coyote Mitochondrial DNA 41 1
TABLE 3
Coyote mtDNA genotype frequencies
Locality 1 2 3 4 5 6 7 8 9 10 1 1 12 13 14 15 16 17 18 19 20 21 22 23 24 25 26 27 28 29 30 31 32 Total ~~
a 0 0 0 0 2 0 0 0 0 0 0 0 0 0 0 0 0 0 0 0 0 0 0 1 2 0 0 0 0 0 0 0 0 14 b 0 0 0 0 0 1 6 0 0 0 0 0 0 0 0 0 0 0 0 0 9 0 0 0 0 0 0 0 0 0 0 0 0 25 C 0 0 0 0 0 2 0 0 0 0 0 0 0 0 0 0 0 0 0 0 0 0 0 0 0 0 0 0 0 0 0 0 2 d 0 0 0 0 0 3 1 0 0 0 0 0 0 0 0 0 0 0 0 0 0 1 0 2 0 0 0 0 0 0 2 0 9 e 0 0 0 0 0 0 3 0 0 0 0 0 0 0 0 0 0 0 0 0 0 4 2 1 0 0 0 0 0 0 0 0 10 f 0 0 4 0 0 0 0 0 0 0 0 0 0 0 0 0 0 0 0 0 0 3 0 0 0 0 0 0 0 0 3 0 10
g 0 0 2 0 0 1 0 0 0 0 0 0 0 0 0 0 0 0 0 0 0 3 0 0 0 0 0 0 0 0 4 0 10 h 0 0 0 0 0 4 1 0 0 0 0 0 0 0 0 0 0 0 0 0 0 3 0 1 0 0 0 0 0 0 1 0 10 i 0 0 0 0 0 2 0 3 0 2 0 0 0 0 0 0 0 0 0 0 0 3 0 0 0 0 0 0 0 0 0 0 10
.i 0 2 0 0 0 0 0 1 1 0 0 0 0 0 0 0 0 0 0 0 0 6 0 0 0 0 0 0 0 0 0 0 10 k 0 0 0 0 0 0 0 0 0 1 0 0 0 0 0 2 0 0 0 0 0 4 0 3 0 0 0 0 0 0 0 0 10 I 0 0 0 0 2 3 2 3 1 0 0 0 0 0 0 0 0 0 0 0 0 8 0 1 0 0 0 0 0 0 0 0 20 m 1 2 1 7 0 0 0 0 0 0 0 0 0 0 0 0 1 0 0 0 0 0 0 0 0 0 0 0 0 0 0 0 0 21 n 1 6 0 8 4 0 1 0 0 0 0 0 0 0 0 0 0 0 0 0 0 0 0 0 3 0 0 0 0 0 0 0 0 32 0 0 0 0 0 1 5 0 0 0 0 0 0 0 0 0 0 0 0 0 0 0 2 0 1 0 0 0 0 1 0 0 0 10
P 0 3 0 3 0 0 0 0 0 0 0 0 0 0 0 0 0 0 2 0 0 0 0 2 0 0 0 0 0 0 0 0 10 9 0 0 0 0 0 1 0 0 0 0 0 0 0 1 0 0 0 0 0 0 0 0 0 1 1 0 0 0 0 0 0 0 4 r 0 0 0 0 0 0 0 0 0 0 0 0 0 5 1 0 0 0 0 0 0 0 0 1 0 1 0 1 0 1 0 0 10 S 0 0 0 0 0 0 0 0 0 0 1 2 3 2 1 0 0 0 0 0 0 0 0 1 0 0 0 0 0 0 0 0 10 t 0 0 0 0 0 4 0 0 0 0 0 0 0 4 0 0 0 4 0 0 0 0 0 1 0 0 0 0 0 0 0 0 0 22 U 0 0 0 0 0 0 0 0 0 0 0 0 0 3 0 1 0 0 0 0 1 0 0 0 0 0 0 0 0 0 0 0 5 V 0 0 0 0 0 0 0 0 0 0 0 0 0 1 6 0 0 0 1 0 0 0 0 0 0 0 0 0 0 0 0 0 0 17 W 0 0 0 0 0 0 0 0 0 0 0 0 0 1 4 0 0 2 1 0 0 0 0 0 0 0 0 0 0 0 0 0 0 17 X 0 0 0 0 0 0 0 0 0 0 0 0 0 2 0 0 0 0 0 0 0 0 2 0 0 0 3 0 0 0 0 2 9 Y 0 0 0 0 0 0 0 0 0 0 0 0 0 0 3 0 0 0 0 0 1 9 6 1 0 0 0 0 0 0 0 0 20 Total 2 8 6 2 1 7 5 4 2 7 7 2 3 1 2 3 4 7 5 4 2 6 2 9 2 4 6 1 0 4 0 1 1 3 1 1 1 1 0 2 327
only slightly more than the observed number of gen- otypes (Figure 7).
DISCUSSION
Estimation of allelic diversity from theory: The concept of the “effective number of alleles” at a par- ticular locus has been analyzed extensively from a theoretical standpoint. FISHER (1 930) and HALDANE (1939) addressed the problem of determining the equilibrium distribution of the allelic states in a pop- ulation using a model of hereditary sampling. Later, when the nature of the genetic material was better understood, KIMURA and CROW (1964) deduced an expectation of allelic diversity with a more complete model of mutation, selection, and drift. The consensus from these analyses, and from KIMURA’S (1968a,b) neutral theory is that, if an infinite number of selec- tively neutral alleles are possible at a locus, then one can characterize the allelic diversity in a diploid, sex- ual species by the effective number of alleles:
n8 = 4Nep + 1 (1)
where Ne is the effective population size and p is the mutation rate at the locus under consideration. This number is equivalent to the number of different alleles of equal frequency at equilibrium. BIRKY, MARUYAMA
and FUERST (1983) and BIRKY, FUERST and MARUY- AMA (1 989) have treated the same problem for cyto- plasmic loci which are inherited asexually and in hap- loid genomes. In this case the effective number of alleles, applicable to mtDNA, would be
ne = 2N* + 1 (2)
where Nf is the number of breeding females in a species. This would be true only in a panmictic species with no heteroplasmy; for subdivided or hetero- plasmic populations the allelic diversity would be higher (BIRKY, FUERST and MARUYAMA 1989).
Another approach to computing expected allelic diversity is to consider the sampling of individuals from a population possessing a steady-state allele fre- quency distribution of any shape, again under an infinite allele model of mutation and drift. Working from EWENS (1972) sampling formula of neutral al- leles, KARLIN and MCGREGOR (1 972) determined the probabilities of various allele frequency configura- tions. From the probability density expression, they derived the following formula for the expected num- ber of alleles observed, E(R), in a random sample from a population:
~ ( k ) = 1 + e/(e + 1) + O / ( O + 2) + . . . + O / ( d + n - 1) (3)

412 N. Lehrnan and R. K. Wayne
45,
40
35
30,
Q 3 g 25 L
20.
15.
I O
5
OJ 0 5 IO 15 20 25 30
Genotype Rank
FIGURE 3.-Frequency distributions of coyote mtDNA geno- types. The genotypes are ordered in decreasing abundances. The most common types continent-wide are labeled; these are all found in localities separated by at least 1000 km, demonstrating the high level of gene flow in the coyote.
TABLE 4
Population subdivision in coyotes
D hypothesis of no geo- Locality assemblage NsT statistic graphic partitioning
Significance under null
Set I (7 large geographic re- 0.209 1.028 Not significant gions) (P > 0.2)
Set I1 (12 intermediate-sized 0.258 1.405 Not significant geographic regions) (P > 0.1)
Set 111 (17 small geographic 0.291 1.747 Not significant reeions) P> 0.1)
Calculations performed by the method of LYNCH and CREASE (1 990) for nucleotide diversity in mitochondrial DNA.
where 0 is the product 4N,p and n is the size of the sample (KARLIN and MCCREGOR 1972). For mtDNA, 2Nf would replace 4N, in the equation (BIRKY, MA- RUYAMA and FUERST 1983); 0 would then be 2 N p .
Though these treatments appear theoretically sound, little effort has been put into comparing the results of their estimations with empirical data. This is true in part because direct measurements of the complete genetic diversity within a species are usually impossible, and also because it is not clear how well the assumptions of neutrality and panmixia are met
4 a
FIGURE 4.-UPGMA clustering analysis of the nucleotide simi- larity values of the 17 coyote subpopulations listed in Table I under set 111. Calculations performed using the method of LYNCH and CREASE (1 990). Lack of strong phylogeographic partitioning in the coyote is evidenced by the polyphyly of the California subpopula- tions (indicated by pointers) and by the grouping of the Manitoba subpopulation (#17) within California subpopulations.
O d I I 1 I I I I
Localities added 0 10 2 0 3 0 4 0 5 0 6 0 7 0
FIGURE 5.-Results of Monte Carlo simulation of drawing coyote localities at random without replacement and summing the number of different genotypes found. Circles represent averages of 10,000 replicate runs of the simulation, and the line fitted through the points is a curve with equation y = ax/(. + b). Dotted line is value of the asymptote, a. Simulation was performed using 327 coyotes from 25 localities; a = 49.
for many loci. The coyote mtDNA data presented here may be sufficiently detailed to allow such a comparison to be made. Coyotes appear to have high rates of mtDNA gene flow continent-wide, and our sample size is large and dispersed enough to be a reasonably random sample. Furthermore, restriction sites in mtDNA probably evolve in a manner close to absolute neutrality because, at least in the time scale of 2 million years or less, changes involve primarily transitions at synonymous positions in codons or within the noncoding D-loop region of the genome (CANN, BROWN and WILSON 1984). As a consequence of the "simplified" vertebrate mitochondrial genetic code, transitions at the third position within mtDNA

Coyote Mitochondrial DNA 413
'O r ". . __ , -. . .. . . . . . . . .. , __ . .. . .. .. __ . . .. . .. .. . . . . .. 5 t
Localities added FIGURE B.-Results of Monte Carlo genotype sampling simula-
tion using 192 deer mice from 39 localities; a = 365 (not shown).
codons will not result in an amino acid substitution and rarely in even the use of an alternate tRNA for the same amino acid.
Application of Equations 2 and 3 requires estima- tion only of the effective female population size of coyotes and the mutation rate per generation of the coyote mtDNA genome, assuming heteroplasmy is negligible. Our surveys of 327 coyotes, 240 gray wolves (LEHMAN et al. 1991), and 64 black-backed jackals (WAYNE et al. 1990) revealed no heteroplasmic individuals, although we probably could not detect heteroplasmy at levels of 5% or lower. The number of breeding female coyotes in Canada and the United States can be roughly estimated from the reports of animals harvested by government predator control efforts and by private fur trappers. In the 1983- 1984 trapping season, VOIGT and BERG (1 987) estimate the total harvest in Canada and the United States to be between 240,000 and 1 million; the average is 620,000, although only about 40% of these are likely to be adults (L. D. MECH, personal communication). Using extensive data from coyote harvests in Mendo- cino County, California, during the 1970s, CONNOLLY and LONGHURST (1975) predicted that all forms of harvesting (predator control, fur trapping, and sport hunting) annually kill approximately 5% of the exist- ing coyotes. In addition, CONNOLLY and LONGHURST (1975) estimated that 70% of adult females produce litters. Because the sex ratio of coyotes is close to 1 : 1, we estimate about (620,000 X 0.40 X 0.70)/(2 X 0.05) = 1.75 X 1 O6 breeding female coyotes exist within the study area.
The magnitude of mammalian mtDNA mutation rate is still under debate and probably depends on the species (WU and LI 1985), but averages 3 x synonymous substitutions per site per year (LI, Wu and LUO 1985), which would translate to 6 x per generation for coyotes, which typically begin
- ,o"O -
Black-backed Jackals
O d I I I I I
Localities added 0 2 4 6 8 10
FIGURE 7.-Results of Monte Carlo genotype sampling simula- tion using 64 black-backed jackals from 6 localities; a = 4.6.
breeding in their second adult year (BXOFF and WELLS 1986). Nonsynonymous rates are roughlv 6 times lower in mtDNA for very closely related mam- malian species (BROWN et al. 1982). To adjust these rate estimates so they are comparable to our restric- tion-site data, it must be realized that a substitution site is not the same as a restriction site. Synonymous substitution sites are those nucleotide positions which have been inferred to have undergone a base substi- tution which did not result in an amino acid change in a protein. Nonsynonymous sites are those at which amino acid substitutions have taken place. Such infer- ences are made by comparing the nucleotide and amino acid sequences of orthologous genes in closely related organisms. Restriction enzyme sites, in this study, are sequences of 4 to 6 contiguous nucleotides, one or more of which has undergone a mutation resulting in the loss or gain of a sequence recognizable by a restriction endonuclease. They may or may not fall within protein-coding regions.
In mammalian mtDNA roughly 70% of the genome is occupied by protein-coding genes (BROWN 1985). The remainder of the genome is divided between rRNA genes, tRNA genes, and control regions. CANN, BROWN and WILSON (1984) have shown restriction- site variations within humans to fall uniformly throughout the mtDNA genome; 68% fell within protein coding genes. Our survey encompassed 572.6 nucleotides: 65 sites from restriction enzymes with 6- nucleotide-recognition sequences + 23 sites from en- zymes with 5'/s-nucleotide-recognition sequences (AccI and HincII) + 15 sites from enzymes with 4-nucleo- tide-recognition sequences. If most nucleotide substi- tutions are transitions falling within protein-coding regions, then two-thirds of these nucleotides would be expected to occupy first or second positions within codons and thus accumulate substitutions at near the nonsynonymous rate, while the remaining one-t hird

414 N. Lehman and R. K. Wayne
would be expected to occupy third positions within codons and accumulate mutations at near the synon- ymous rate. For the approximately 30% of nucleotides in our survey which fall within stable RNA genes or control regions, this 2:l partitioning should still be reasonable because the majority of such positions would be coding for stable RNA evolving at close to the nonsynonymous rate (BROWN 1985). It is unlikely that two substitutions will fall within the same restric- tion site during the differentiation of coyote mtDNA lineages. Therefore, a weighted average of the restric- tion-site evolutionary rate within our study can be estimated from nucleotide evolutionary rates as 572.6(%)(1 X loM8) + 572.6(’/9)(6 X = 1.53 X 1 0-5 restriction-site substitutions per restriction-site genome per generation.
This estimation, like that for the effective female population size, involves several assumptions and un- known error. Yet we can now estimate 0 for our coyote data as follows: p = 1.5 X restriction-site substi- tutions per genome per generation and thus I9 = 2Np = 2(1.75 X 10⁶)(1.53 X = 53.
Thus, the effective number of restriction-site gen- otypes using 21 endonucleases which survey 103 sites would, in theory, be ne = 2Np + 1 = 54. Though based on many assumptions, this value is close to our predicted value of n, = 49 from the empirical data. However, the assumption n, = ne is only valid if the distribution of allele frequencies is uniform, such that each allele has the same “effect” on the genetic com- position of the population; this situation would result in the lower limit of allelic diversity. Figure 3 shows that the observed configuration of coyote genotypes is far from uniform. Using Equation 3, which does not assume a uniform distribution, with 0 = 49 we would estimate the expected number of alleles, E(k) , to be approximately 100. Therefore, the diversity we found in our sample, 32 alleles, is roughly one-third of that expected from sampling theory.
Figure 8 demonstrates the behavior of E ( k ) over various values of q with our sample size set at 327; a value of I9 = 9, or one-sixth of the estimated value, would result in an E(k) of approximately 32. The difference between the two values of 0 may be attrib- uted to a number of factors including: 1) restriction- site variation present below the level of resolution of our technique: Southern blotting can fail to detect fragments which are less than 500 nucleotides long; 2) overestimation of the mutation rate per generation; 3) overestimation of the current female population size; and/or 4) the presence of population subdivision unrevealed by our sample. In addition, by including several localities in our sample which were not part of the coyote’s historical range but instead reflect recent range expansions, we may have generated an inflated population size, with respect to genetic variability.
-204 . ! c - 1 0 0 I O 2 0 30 4 0 50 6 0 7 0
theta FIGURE 8.-Dependence of the expected number of alleles, E@),
on 0 (= 2 N p ) for the coyote sample size set at 327. The arrow indicates our estimate of 0 for coyotes within the United States and Canada of approximately 50, which gives an E(k) of 100, or roughly three times the number of genotypes observed in our sample.
However, the genotypes discovered in these localities are likely to be identical or very similar to those which existed in the fringe areas of the historical range 200 or more years before present. If this is the case, then we would conservatively estimate that 45-50 geno- types, as we have defined them, could be found among the coyotes of the western and midwestern United States. A closer agreement between theoretical and empirical estimations throughout North America would not be expected until 4Ne generations have passed since the expanded geographic range of the coyote was established (AVISE, BALL and ARNOLD
Estimation of effective population size: It is pos- sible that, given the nature of standard mtDNA RFLP analyses, the amount of variation that goes undetected in a survey may result in estimations of allelic diversity which are closer to the expected effective number of alleles, ne, than to the expected actual number of alleles, E(k) . This is certainly true for the coyote survey described here. Thus, an alternative application of the Monte Carlo extrapolation procedure is to estimate the effective female population size from the observed mtDNA genotype diversity in a well-designed sam- pling program. To do so, the following steps must be taken. First, the number of mtDNA genotypes in a population must be determined with as many enzymes as possible. Second, an extrapolation to the total num- ber of genotypes (a) must be done, by, for example, using the Monte Carlo and asymptote approach. Third, the parameter q is calculated as a - 1. Fourth, the mtDNA genome mutation rate per generation (P) must be generated from estimations of nucleotide substitution rates and number of restriction sites sur- veyed in the study. Finally, the effective number of females can be evaluated as Nf = 8/2p.
With the value of a = 49 demonstrated here for coyotes, the effective female population size would
1988).

Coyote Mitochondrial DNA 415
necessarily approximate the estimated value of 1.75 X lo6 in the United States and Canada. Using a = 4.6 for black-backed jackals, which have about the same generation time as coyotes, Nf would be calculated as (4.6 - 1)/(2)[468(2/3)(1 X lo-*)+ 468(1/3)(6 X 10-t3)] = 1.5 X 1 O5 breeding females. The figure 468 is the number of restriction sites surveyed (78) multiplied by 6, because in the study of WAYNE et al. (1990) all enzymes recognized 6-base sequences.
It should be realized that these values represent the effective number of females in an area which can genetically influence the localities surveyed. With the long-range dispersal capabilities of large canids such as coyotes and jackals, perhaps individuals from the majority of the North American range of coyotes and from the entire eastern African range of black-backed jackals (an area of approximately 1.2 X 1 O6 km2) could contribute mtDNA genotypes to any given locality within a few generations. In this case, using SCHALL- ER’S (1 972) figure of one jackal per square kilometer, a census estimate of female black-backed jackal pop- ulation size, 6 X lo5, would be higher than, but of the same magnitude as, the mtDNA-based estimate de- rived from the study of WAYNE et al. (1990), which surveyed only parts of Kenya and Tanzania. In addi- tion, the census estimate includes all females, not only adult breeding females, and thus should be greater than NF
AVISE, BALL and ARNOLD (1 988) also reported com- parisons of mtDNA-based and census estimates of Nf for three nonterrestrial species with high gene flow. The estimates of AVISE, BALL and ARNOLD (1 988) were based on the observed levels of mtDNA sequence differentiation and not on the total number of geno- types as detailed here, and discrepancies were ex- plained by dramatic historical fluctuations in popula- tion size. The difference in the estimates for jackals is probably not severe enough to invoke this explana- tion. On the other hand, the observed contrast in coyote mtDNA variability between historically and recently occupied territories, reinforces the need for a species to be in mutation-drift equilibrium for the above equations to be accurate.
Estimation of Nf for P. maniculatus by this method would probably be unwise given the extent of geo- graphic subdivision that exists within this species. From Figure 6 it can be seen that the number of genotypes encountered depends strongly on the num- ber of localities surveyed, and moreover many geno- types have likely gone undetected even at the localities surveyed.
Nevertheless, for mammals this technique may be preferable to others which rely on the estimation of a battery of demographic parameters (for a review, see HARRIS and ALLENDORF 1989). Use of the mtDNA diversity technique requires only a knowledge of the
generation time and a population which is not strongly subdivided. Though it may be applicable solely to species which are at or near a steady state of mtDNA allele turnover, many large mammalian, avian and marine species could possess this characteristic.
Conclusions: Our survey of coyote mtDNA geno- types and their frequencies by locality indicates that it may indeed be possible to predict the total genetic variability that will exist in a species. Such a prediction may either come from an extrapolation of empirical data or from simple population-genetic models. The concordance between data and theory is very good for coyotes, within at least a factor of three. However, the match may be dependent on the fact that popu- lation structuring is weak in the coyote; for less panm- ictic species it may only be feasible to make estimations like those in this study for subpopulations small enough to be interbreeding.
We would like to thank many collaborators who provided coyote tissue specimens, including M. ALLARD, P. BUTCHKO, H. D. CLUFF, M. CRONIN, J. COCHRAN, A. EISENHAWER, T. FULLER, S. MAC- KENZIE, L. D. MECH, T. MEIER, R. 0. PETERSON, T. QUINN, M. ROELKE, R. PLANTRICH, C. P. RYAN, and R. THOMPSON. We also appreciate the support of C. W. BIRKY, J. NEIGEL, N. STURM, C. E. TAYLOR, and B. VAN VALKENBURGH for helpful advice and com- ments on the manuscript. This work was supported in part by a U.S. Public Health Service National Service Award GM-07104 to N.L. and a U S . National Park Service agreement with R.K.W.
LITERATURE CITED
AVISE, J. C., J. ARNOLD, R. M. BALL, E. BERMINGHAM, T. LAMB, J. NEIGEL, C. A. REEB and N. C. SAUNDERS, 1987 Intraspecific phylogeography: The mitochondrial DNA bridge etween pop- ulation genetics and systematics. Annu. Rev. Ecol. Syst. 18:
AVISE, J. C., M. BALL and J. ARNOLD, 1988 Current versus histor- ical population sizes in vertebrate species with high gene flow: A comparison based on mitochondrial DNA lineages and in- breeding theory for neutral mutations. Mol. Bioi. Evol. 5: 33 1- 344.
BEKOFF, M., and M. C. WELLS, 1986 Social ecology and behavior of coyotes. Adv. Study Behav. 16: 251-338.
BIRKY, C. W., JR., P. FUERST and T. MARUYAMA, 1989 Organelle gene diversity under migration, mutation, and drift: Equilib- rium expectations, approach to equilibrium, effects of hetero- plasmic cells, and comparison to nuclear genes. Genetics 121:
BIRKY, C. W., JR., T . MARUYAMA and P. FUERST, 1983 An ap- proach to population and evolutionary genetic theory for genes in mitochondria and chloroplasts, and some results. Genetics
BROWN, W. M., 1985 The mitochondrial genome of animals, pp. 95- 130 in Molecular Evolutionary Genetics, edited byR. J. MA-
BROWN, W. M., E. M. PRAGER, A. WANG and A. C. WILSON, 1982 Mitochondrial DNA sequences of primates: tempo and mode of evolution. J. Mol. Evol. 1 8 225-239.
CANN, R. L., W. M. BROWN and A. C. WILSON, 1984 Polymorphic sites and the mechanism of evolution in human mitochondrial DNA. Genetics 106: 479-499.
CONNOLLY, G. E., and W. M. LONGHURST, 1975 The effects of control on coyote populations. Bull. Univ. Calif. Div. Agric. Sci. 1872: 1-37.
489-522.
613-627.
103: 513-527.
CINTYRE. Plenum, New York.

416 N. Lehman and R. K. Wayne
EWENS, W. J., 1972 A note on the sampling theory for infinite alleles and infinite sites model. Theor. Popul. Biol. 6: 143- 148.
FISHER, R. A., 1930 Thc Genetical Theory of Natural Selection. Oxford University Press, Oxford.
HALDANE, J. B. S., 1939 The equilibrium between mutation and random extinction. Ann. Eugenics 9: 400-405.
HARRIS, R. B., and F. W. ALLENDORF, 1989 Genetically effective population size of large mammals: an assessment of estimators. Conserv. Biol. 3: 18 1 - 191.
KARLIN, S. , and J. MCGRFXOR, 1972 Addendum to a paper of W. Ewens. Theor. Popul. Biol. 3 113-1 16.
KIMIJRA, M., 1968a Evolutionary rate at the molecular level. Nature 217: 624-626.
KIMURA, M., 1968b Genetic variability maintained in a finite population due to mutational production of neutral and nearly neutral isoalleles. Genet. Res. 11: 247-296.
KIMURA, M., and J. F. CROW, 1964 The number of alleles that can be maintained in an infinite population. Genetics 4 9 725- 738.
LANSMAN, R. A,, J. C. AVISE, C. F. AQUADRO, J. F. SHIPIRA and S. W. DANIEL, 1983 Extensive genetic variation in mitochon- drial DNA's among geographic populations of the deer mouse, Peromyscus maniculatus. Evolution 37: 1-16.
LEHMAN, N., A. EISENHAWER, K. HANSEN, L. D. MECH, R. 0. PETERSON, P. J. P. COGAN and R. K. WAYNE, 1991 Introgression of coyote mitochondrial DNA into sym- patric North American gray wolf populations. Evolution 4 5
LI, W.-H., C.-I. Wu and C.-C. LUO, 1985 A new method for estimating synonymous and nonsynonymous rates of nucleotide substitution considering the relative likelihood of nucleotide and codon changes. Mol. Biol. Evol. 2 150-174.
LYNCH, M., and T. J. CREASE, 1990 The analysis of population survey data on DNA sequence variation. Mol. Biol. Evoi. 7: 377-394.
104-1 19.
MACKENZIE, S., 1988 Genetic variation in nine northern subspe- cies of the coyote, Canis latrans. Masters thesis, University of Tennessee,
NEI, M., and W.-H. LI, 1979 Mathematical model for studying genetic variation in terms of restriction endonucleases. Proc. Natl. Acad. Sci. USA 76: 5269-5273.
NEI, M., and F. TAJIMA, 1983 Maximum likelihood estimation of the number of nucleotide substitutions from restriction sites data. Genetics 105: 207-2 17.
NOWAK, R. M., 1979 North American Qwternary Canis. Museum of Natural History, University of Kansas.
SCHALLER, G. B., I972 The Serengeti Lwn. University of Chicago Press, Chicago.
SLATKIN, M., 1987 Gene flow and the geographic structure of natural populations. Science 436 787-792.
SLATKIN, M., and W. P. MADDISON, 1989 A cladistic measure of gene flow inferred from the phylogenies of alleles. Genetics
SWOFFORD, D. L., 1985 PAUP: Phylogenetic Analysis Using Par- simony (version 2.4). Illinois Natural History Society, Cham- paign, 111.
VOIGT, D. R., and W. E. BERG, 1987 Coyote, pp. 345-356 in Wild Furbearer Management and Consemation in North America, edited by M. NOVAK, J. A. BAKER, M. E. OBBARD and B. MALL-. Ministry of Natural Resources, Ontario.
WAYNE, R. K., A. MEYER, N. LEHMAN, B. VAN VALKENBURGH, P. W. KAT, T. K. FULLER, D. GIRMAN and S. J. O'BRIEN, 1990 Large sequence divergence among mitochondrial DNA genotypes within populations of eastern African black-backed jackals. Proc. Natl. Acad. Sci . USA 87: 1772-1776.
WILKINSON, L., 1986 SYSTAT: The System for Statistics. SYS- TAT, Inc., Evanston, Ill.
Wu, C.-I., and W.-H. LI, 1985 Evidence for higher rates of nucleotide substitution in rodents than in man. Proc. Natl. Acad. Sci. USA 82: 1741-1745.
143: 603-61 3.
Communicating editor: J. R. POWELL