analysis of crystallization kinetics - nasa · pdf fileanalysis of crystallization kinetics...
TRANSCRIPT
Reprinted from
Materials Science and Engineering A226-228 (I 997) 142-150
Analysis of crystallization kinetics
Kenneth F. Kelton
Department of Physics, Washington University, St. Louis, MO 63130, USA
ELSEVIER
https://ntrs.nasa.gov/search.jsp?R=19980020898 2018-05-25T02:33:21+00:00Z
MATERIALS SCIENCE AND ENGINEERING A
The journal provides an international medium for the publication of theoretical and experimental studies and
reviews of the properties and behavior of a wide range of materials, related both to their structure and to their
engineering application. The varied topics comprising materials science and engineering are viewed as appro-
priate for publication: these include, but are not limited to, the properties and structure of crystalline and
non-crystalline metals and ceramics, polymers and composite materials.
Editor-in-Chief
Professor H. Herman
Associate Editors
M. Koiwa (Japan)G. Kostorz (Switzerland)
Editorial Board (MSE A)
J. _gren (Sweden)G. Ananthakrishna (India)R. J, Arsenault (USA)
D. Brandon (Israel)H. K, D. H, Bhadeshia (UK)
J. Cadek [Czech Republic)J. B. Cohen (USA)J. Driver (France)
J. D. Embury (Canada)Y. Estrin (Australia)
H, Fischmeister (Germany)C. Garcia de Andres (Spain)H. Gleiter (Germany)M. W. Grabski (Poland)
M. Kato (Japan)Y. G. Kim (Korea)C. Laird (USA)
J. Lendvai IHungary)W. Mader (Germany)M McLean (UK)
L. Priester (France)
S. Sampath (USA)V. K. Sarin (USA)P. Shen (Taiwan)
M. Suery (France)S. Suresh (USA)N. S. Stoloff (USA)
M. Taya (USA)A. K. Vasud_van (USA)A. Vevecka (Albania)
B. Wilshire (UK)
M. Yamaguchi (Japan)T. S. Yen (China)
Print and Electronic Media Review Editor
A. H. King (USA)
Administrative EditorBarbara Herman
Advisory Board (MSE A and B)H Herman, Chairman (USA)H. Curien (France)M. E. Fine (USA)
A. Kelly, FRS (UK)R Lang (Japan)H. Mughrabi (Germany)P. Rama Rao (India)
Types of contributions
Original research work not already published; plenary lectures
andor individual papers given at conferences; reviews of
specialized topics within the scope of the journal; engineering
studies; letters to the editor.
Subscription Information 1997
Volumes 222-238, each volume containing 2 issues, are
scheduled for publication. Prices are available from the
publishers upon request. Subscriptions are accepted on a pre-
paid basis only. Issues are sent by SAL (Surface Air Lifted) mail
wherever this service is available. Airmail rates are available
upon request.
Orders, claims, and product enquiries: please contact the
Customer Support Department at the Regional Sales Office
nearest you:
New York
Elsevier Science
P O Box 945
New York, NY 10159-0945, USA
Tel.: (+ 11 212-633-3730
IToll free number for North American
customers: t-888-4ES-INFO
_437 4636)]
Fax: (4 1) 212-633-3680
E mail usmfo-l@elsevier corn
Amsterdam
E_sevier Science
PO Box 211
1000 AE Amsterdam
The Netherlands
Tel: (+31) 20-4853757
Fax: { + 31) 20-4853432
E-mail: nlinfo-f@elsevier nl
TokyoElsevier Science
9-15 Higashi-Azabu 1-chome
Minato-ku, Tokyo 106
Japan
Tel.: (+81) 3-5561-5033
Fax: (+81) 3-5561-5047
E-mail: [email protected] ii
SingaporeElsevier Science
No 1 Temasek Avenue
# 17-01 MJllenJa Tower
Singapore 039192
Tel.: (65) 434-3727
Fax: (+65) 337-2230
E-mail: asiainfo@elsevier corn sg
Abstracting and/or Indexing Services
American Ceramic Society; Cambridge Scientific Abstracts;
Chemical Abstracts; Current Contents; Engineering Index; FIZ
Karlsruhe; Fluid Abstracts; Fluidex; Glass Technology Abstracts;
Inspec/Physics Abstracts; Metals Abstracts; Pascal (Centre
National de la Recherche Scientifique); Physikalische Berichte;
Research AlertTM; Science Citation Index.
Advertising information: Advertising orders and enquiries maybe sent to: International: Elsevier Science, Advertising Depart-ment, The Boulevard, Langford Lane, Kidlington, Oxford OX51GB, UK. Tel.: f+44110_865 843565 Fax: f+44/,_011865 843976.USA and Canada: Weston Media Associates, Daniel Lipner,P.O. Box 1110, Greens Farms, CT 06436-1110, USA. Tel.:(+ 1)(203)261-2500. Fax: (+ 1)(203)261-0101. Japan: ElsevierScience Japan, Marketing Services, 1-9-15 Higashi-AzabuMinato-ku, Tokyo 106, Tel: (+81)3-5561-5033; Fax:(+ 81)3-5561-5047.
ELSEVIER Materials Science and Engineering A226 228 (1997) 142 150
MATERIALSSCIENCE &
ENGINEERING
A
Analysis of crystallization kinetics
Kenneth F. Kelton
Department of Physics, l_lshington University, St. Louis, MO 63130, USA
Abstract
A realistic computer model for polymorphic crystallization (i.e., initial and final phases with identical compositions), whichincludes time-dependent nucleation and cluster-size-dependent growth rates, is developed and tested by fits to experimental data.Model calculations are used to assess the validity of two of the more common approaches for the analysis of crystallization data.The effects of particle size on transformation kinetics, important for the crystallization of many systems of limited dimension
including thin films, fine powders, and nanoparticles, are examined. © 1997 Elsevier Science S.A.
Keywords: Computer modeling; Crystallization kinetics; Microstructure
1. Introduction
An ability to predict and to control the crystalliza-tion of metallic and silicate glasses is often critical for
the preparation and maintenance of desirable mi-
crostructures. Further, the quantitative analysis of ki-
netic crystaIlization data can provide information about
the magnitude and temperature dependence of nucle-
ation and growth rates, essential parameters for materi-als design. Kinetic data are generally obtained by
monitoring some physical parameter that changes dur-
ing crystallization, such as the electrical conductivity.
The interpretation of such data, however, is often un-clear; the electrical resistivity, for example, can be ex-
tremely sensitive to the transformation microstructure
[l]. The latent heat evolved during crystallization scales
linearly with the rate of transformation, making calori-
metric measurements such as differential scanning
calorimetry (DSC) and differential thermal analysis(DTA) attractive. These techniques are sensitive, rela-
tively easy to make and require small sample quantities.
In many cases, however, experimental studies of crystal-
lization suffer from a lack of methods for quantitative
analysis. This is particularly true for nonisothermaldata, where most methods are based on erroneous
assumptions. Even for isothermal studies, however,
proper account is frequently not taken of the transfor-
mation microstructure, making many conclusions sus-
pect.
Analytical methods for the analysis of isothermal and
nonisothermal studies of glass crystallization have been
criticized on theoretical and experimental grounds [2-
4]. Experimental [5,6] and theoretical [7] studies of the
Kissinger method [8], the most commonly used tech-nique for the analysis of nonisothermal data, havedemonstrated that it can be used with some confidence
for transformations involving growth only. Within this
short space it is not possible to review and critique the
many analysis schemes that exist; a partial review ofthese can be found in [2]. Here, a brief review is
provided of our studies of polymorphic crystallization
of silicate glasses, where the initial and final phases
have the same composition. The most common analyti-
cal methods of analysis, the Kissinger and Ozawa [9]methods, are examined using this model. It should be
emphasized that a silicate glass is chosen only because
nucleation and growth rates and required thermody-
namic parameters are known; the conclusions drawn
also apply to crystallization of metallic glasses.Accurate data for the time-dependent volume frac-
tion crystallinity are assumed. Experimental details
such as proper baseline corrections for calorimetric
data are not discussed. Since time-dependent nucleation
behavior is central to the model development, this is
first reviewed briefly in Section 2.
2. Non-steady-state nucleation rates
Generally, the nucleation rate of crystals in a glass is
taken to be constant at the steady-state value, 1_. If
true, the number of nuclei produced in a unit volume,
0921-5093/97/$17.00 {_, 1997 Elsevier Science S.A. All rights reserved.
Pll S0921-5093(96) 10607-9

K.F. I_,lton ,'Alateria[s Science attd Engineer#tg .4226-228 (I997) 142 150 143
2.0E8
_voE 1.5E8
.mq_
1.0E8o
ID,,o
E
Z 5.0E7
0.0E0
(a)Slope = Steady State Nucleation Rate
\
Induction Time
0 1000 2000 3000 4000 5000
(b)
[ I
Jl9 tO 11 12 13 14 15 16 17 18 19 20
Time (s) Cluster Size, n
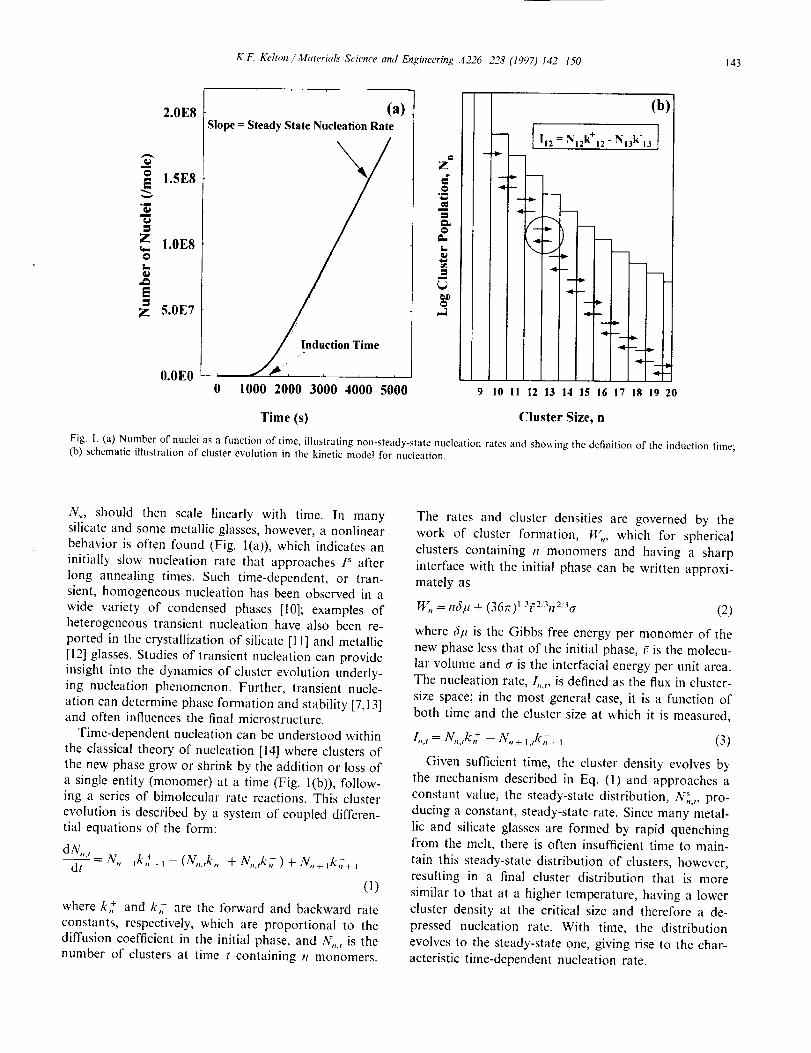
Fig. I. (a) Number of nuclei as a function of time, illustrating non-steady-state nucleation rates and showing the definition of the induction time;
(b) schematic illustration of cluster evolution in the kinetic model for nucleation.
N_, should then scale linearly with time. In manysilicate and some metallic glasses, however, a nonlinear
behavior is often found (Fig. l(a)), which indicates an
initially slow nucleation rate that approaches P after
long annealing times. Such time-dependent, or tran-sient, homogeneous nucleation has been observed in a
wide variety of condensed phases [10]; examples ofheterogeneous transient nucleation have also been re-
ported in the crystallization of silicate [11] and metallic
[12] glasses. Studies of transient nucleation can provide
insight into the dynamics of cluster evolution underly-
ing nucleation phenomenon. Further, transient nucle-
ation can determine phase formation and stability [7.13]and often influences the final microstructure.
Time-dependent nucleation can be understood within
the classical theory of nucleation [14] where clusters of
the new phase grow or shrink by the addition or loss of
a single entity (monomer) at a time (Fig. l(b)), follow-ing a series of bimolecular rate reactions. This cluster
evolution is described by a system of coupled differen-
tial equations of the form:
dN,,,__= _ r .+ N,,.,k,;+lI n |dt N,, k + (N,, ,k, + A,,,,k,, ) +
(1)
where k, + and k,7 are the forward and backward rate
constants, respectively, which are proportional to the
difl'usion coefficient in the initial phase, and N,,., is thenumber of clusters at time t containing n monomers.
The rates and cluster densities are governed by the
work of cluster formation, g,,, which for spherical
clusters containing n monomers and having a sharp
interface with the initial phase can be written approxi-
mately as
W, = ncJ/L + (36_z)1 3/":_3n2"3o" (2)
where c_/_ is the Gibbs free energy per monomer of the
new phase less that of the initial phase, /_ is the molecu-
lar volume and a is the interracial energy per unit area.
The nucleation rate,/, .... is defined as the flux in cluster-
size space; in the most general case, it is a function of
both time and the cluster size at which it is measured,
Z,,., = _,,,,k,, + - X,, +,.,k,, +, (3)
Given sufficient time, the cluster density evolves by
the mechanism described in Eq. (1) and approaches a
constant value, the steady-state distribution, N_,,,, pro-
ducing a constant, steady-state rate. Since many metal-
lic and silicate glasses are formed by rapid quenching
from the melt, there is often insufficient time to main-
tain this steady-state distribution of clusters, however,
resulting in a final cluster distribution that is more
similar to that at a higher temperature, having a lower
cluster density at the critical size and therefore a de-
pressed nucleation rate. With time, the distribution
evolves to the steady-state one, giving rise to the char-
acteristic time-dependent nucleation rate.
144 t_:F. Kelton '3htter&A" Science and Engineerhtg A226 228 (1997) 142 ISO
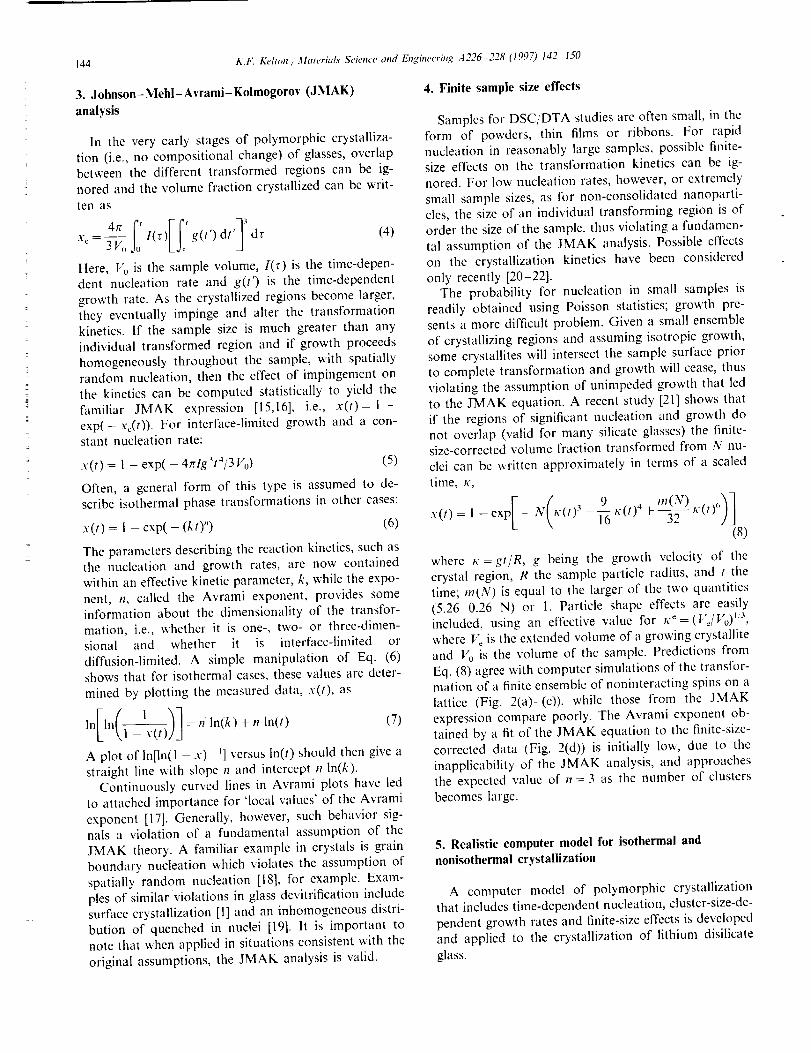
3. Johnson-Mehl-Avrami-Kolmogorov (JMAK)
analysis
In the very early stages of polymorphic crystalliza-
tion (i.e., no compositional change) of glasses, overlap
between the different transformed regions can be ig-
nored and the volume fraction crystallized can be writ-ten as
x¢ = T-_o [(r) g(t')dt' dr (4)
Here, Vo is the sample volume, l(r) is the time-depen-
dent nucleation rate and g(t') is the time-dependent
growth rate. As the crystallized regions become larger,they eventually impinge and alter the transformation
kinetics. If the sample size is much greater than any
individual transformed region and if growth proceeds
homogeneously throughout the sample, with spatially
random nucleation, then the effect of impingement on
the kinetics can be computed statistically to yicld thefamiliar JMAK expression [15,16], i.e., x(t)= l-
exp(-x,(t)). For interface-limited growth and a con-stant nucleation rate:
x(t) = I - exp( - 4rclg3t4/3 V0) (5)
Often, a general form of this type is assumed to de-
scribe isothermal phase transformations in other eases:
x(t) = I - exp( - (kt)") (6)
The parameters describing the reaction kinetics, such as
the nucleation and growth rates, are now contained
within an effective kinetic parameter, k, while the expo-nent, n, called the Avrami exponent, provides some
information about the dimensionality of the transfor-mation, i.e., whether it is one-, two- or three-dimen-sional and whether it is interface-limited or
diffusion-limited. A simple manipulation of Eq. (6)shows that for isothermal cases, these values are deter-
mined by plotting the measured data, x(t), as
I ( lx_)l=nln(k)+nln(t) (7)In In 1-
A plot of ln[ln(l - x) - _] versus In(t) should then give astraight line with slope n and intercept n In(k).
Continuously curved lines in Avrami plots have led
to attached importance for 'local values' of the Avrami
exponent [17]. Generally, however, such behavior sig-
nals a violation of a fundamental assumption of the
JMAK theory. A familiar example in crystals is grain
boundary nucleation which violates the assumption ofspatially random nucleation [18], for example. Exam-
ples of similar violations in glass devitrification includesurface crystallization [1] and an inhomogeneous distri-
bution of quenched in nuclei [19]. It is important to
note that when applied in situations consistent with the
original assumptions, the JMAK analysis is valid.
4. Finite sample size effects
Samples for DSC/DTA studies are often small, in the
form of powders, thin films or ribbons. For rapidnucleation in reasonably large samples, possible finite-
size effects on the transformation kinetics can be ig-
nored. For low nucleation rates, however, or extremely
small sample sizes, as for non-consolidated nanoparti-
cles, the size of an individual transforming region is oforder the size of the sample, thus violating a fundamen-
tal assumption of the JMAK analysis. Possible effects
on the crystallization kinetics have been considered
only recently [20-22].
The probability for nucleation in small samples is
readily obtained using Poisson statistics; growth pre-
sents a more difficult problem. Given a small ensembleof crystallizing regions and assuming isotropic growth,
some crystallites will intersect the sample surface prior
to complete transformation and growth will cease, thus
violating the assumption of unimpeded growth that led
to the JMAK equation. A recent study [21] shows that
if the regions of significant nucleation and growth donot overlap (valid for many silicate glasses) the finite-size-corrected volume fraction transformed fi'om N nu-
clei can be written approximately in terms of a scaledtime, h-,
./(,) : ]- exp[-?((h (/) 3- 9_ I¢(t)"4 ._1__/H (_)/.(1 ),,)]
(8)
where h=gt/R, g being the growth velocity of the
crystal region, R the sample particle radius, and t the
time; re(N) is equal to the larger of the two quantities
(5.26 0.26 N) or 1. Particle shape effects arc easilyincluded, using an effective value for lc_=([_/Vo) _s,
where l_ is the extended volume of a growing crystallite
and Vo is the volume of the sample. Predictions fi'om
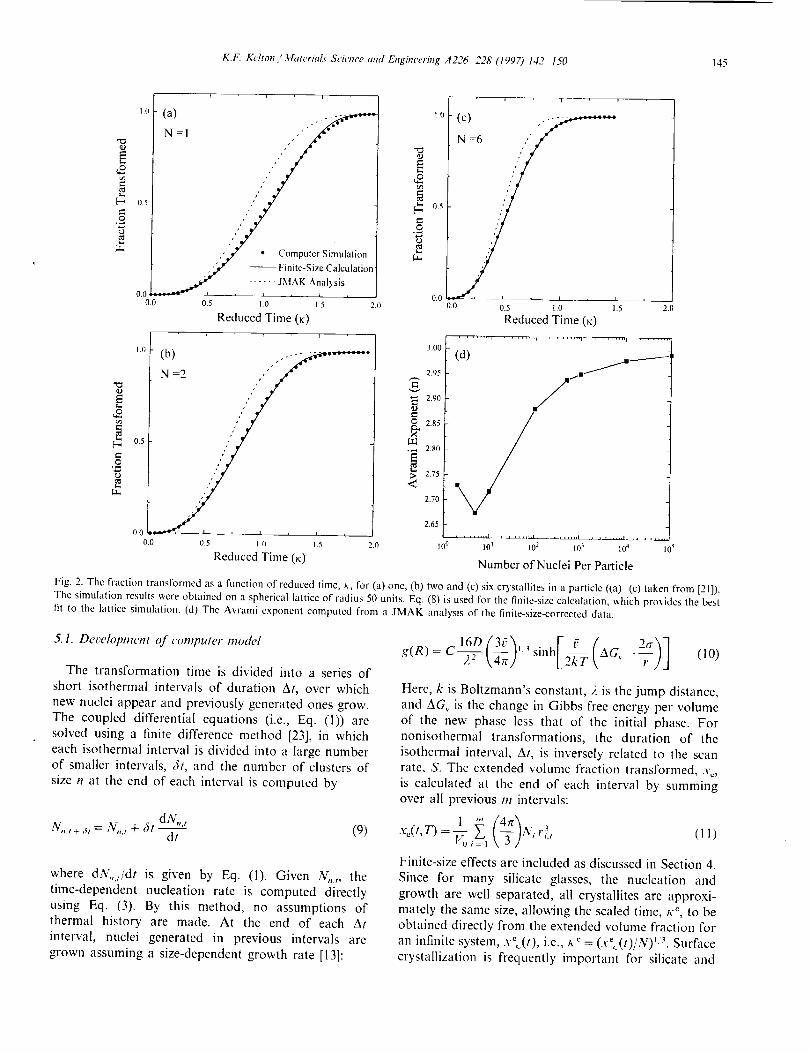
Eq. (8) agree with computer simulations of the transfor-
mation of a finite ensemble of noninteracting spins on a
lattice (Fig. 2(a)-(c)), while those from the JMAK
expression compare poorly. The Avrami exponent ob-tained by a fit of the JMAK equation to the finite-size-
corrected data (Fig. 2(d)) is initially low, due to thc
inapplicability of the JMAK analysis, and approaches
the expected value of n = 3 as the number of clusters
becomes large.
5. Realistic computer model for isothermal and
nonisothermal crystallization
A computer model of polymorphic crystallization
that includes time-dependent nucleation, cluster-size-de-pendent growth rates and finite-size effects is developed
and applied to the crystallization of lithium disilicate
glass.
K.F. Kelton / 3,hm'rials Science and Engineering A226 228 (1997) 142 I50 I45
0
[...
0
+d
_D
io
_J
la.
1 0
0.5
0.00.0
, p o
(a) . ---
N= ] ""
_-Size Ca!culation
-- JM)K Analysis,
0.5 1.0 15 2.0
Reduced Time (_:)
1.0
0.5
1.0
i r i
(b) .-_"-N=2 //
o.5 i., 1.5 2.0
Reduced Time (K)
¢I:I
[._ 0.5
O
O
0.(
3.00 1
2"5i
2.90 I
g2 5i2.80
2.75<
2,70
(c)
N=6
0.0 0.5 1.0 1.5 2.0
Reduced Time (l_)
(d) /._-'
2.65
0,0
0.0 10 ° 101 102 103 104 10 _
Number of Nuclei Per Particle
Fig. 2. The fraction transformed as a function of reduced time, t,-, for (a) one, (b) two and (c) six crystaniles in a particle ((a) (c) taken from [21]).
The simulation results were obtained on a spherical Iattice of radius 50 units. Eq. (8) is used for the finite-size calculation, which pro,,ides the best
fit to the hlnice simulation. (d) The Avrami exponent computed from a JMAK ;malysis of the finite-size-corrected data.
5.1. Deveh_pment of compttter model
The transformation time is divided into a series of
short isothermal intervals of duration At, over which
new nuclei appear and previously generated ones grow.The coupled differential equations (i.e., Eq. (I)) are
solved using a finite difference method [23], in which
each isothermal interval is divided into a large numberof smaller intervals, 6t, and the number of clusters of
size n at the end of each interval is computed by
d _t/##, t
N,,.,+,_,= N,,,, + 6t dt (9)
where dN,,.,/dt is given by Eq. (I). Given N,,,,, the
time-dependent nucleation rate is computed directly
using Eq. (3). By this method, no assumptions ofthermal history are made. At the end of each At
interval, nuclei generated in previous intervals are
grown assuming a size-dependent growth rate [13]:
g(R)=C 16O (3g_l'sinh[_('_G"-_" )]z"\4-£,,# - (I0)
Here, k is Boltzmann's constant, 2 is the jump distance,
and AG_ is the change in Gibbs free energy per volume
of the new phase less that of the initial phase. Fornonisothermal transformations, the duration of the
isothermal interval, At, is inversely related to the scanrate, S. The extended volume fraction transformed, x_,
is calculated at the end of each interval by summing
over all previous m intervals:
-x'_(t,T)=]L _ /4zr'k 7 _
Finite-size effects are included as discussed in Section 4.
Since for many silicate glasses, the nucleation and
growth are well separated, all cr3,stallites are approxi-mately the same size, allowing the scaled time, h% to be
obtained directly from the extended volume fraction for
an infinite system, .v_(t), i.e., x _ = (.v__(t)/N)t'_. Surface
crystallization is frequently important for silicate and
146 K.F, Kelton i Material.s Science and Eitgineer#tg A226 228 (1997) 142 150
9oi a' T t675I .......+.......+...............' .....................+1
I (b) I t - . _ •
12"_
8,,-#
t _) _ _- i .__ ._O 4s , L 1
_:" 3ot_................. r=.-i i
0 ' 4 " 8 1'2 6 4 8 12 16
q_n (C/rain)
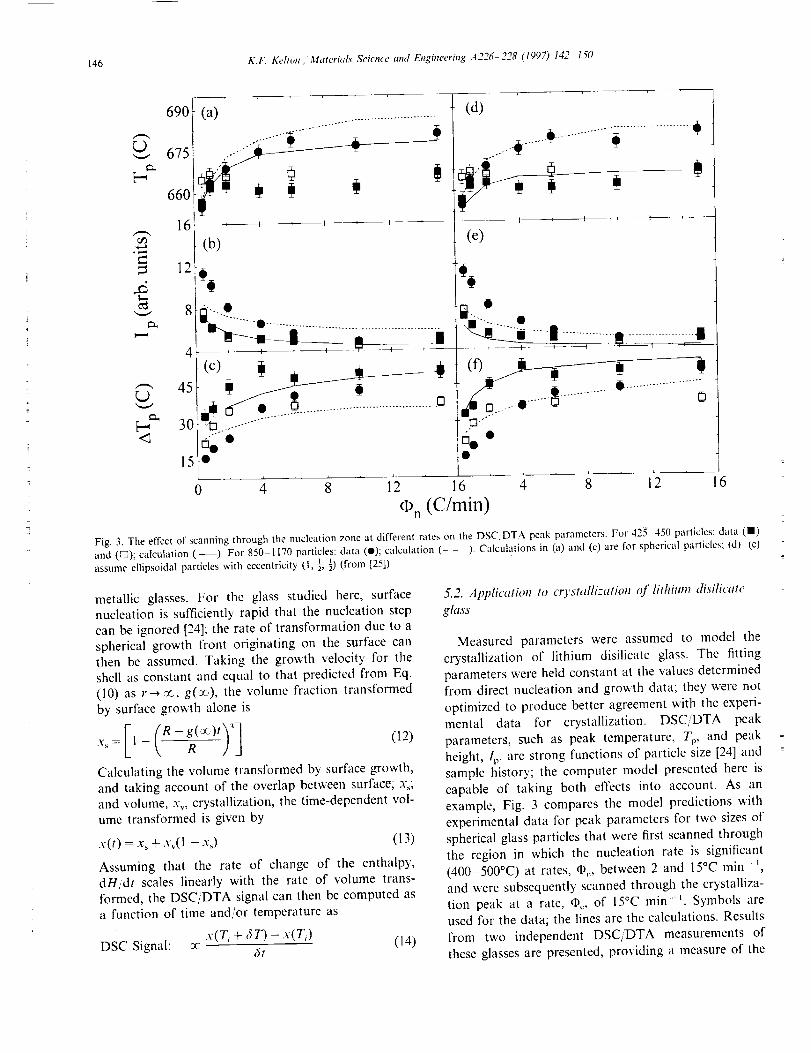
Fig. 3. The effect of scanning through the nucleation zone at different rates on the DSC/DTA peak parameters. For 425 450 particles: data (11)and (_); calculation (--). For 850 1170 particles: data (i); calculation (- - ). Calculations in (a) and (c) are for spherical parlicles; I'd) (e)assume ellipsoidal particles with eccentricity (I, ½,½)(from [25]).
metallic glasses. For the glass studied here, surface
nucleation is sufficiently rapid that the nucleation stepcan be ignored [24]; the rate of transformation due to a
spherical growth front originating on the surface canthen be assumed. Taking the growth velocity for the
shell as constant and equal to that predicted from Eq.
(10) as 1"--+oc, g(_), the volume fraction transformed
by surface growth alone is
Calculating the volume transformed by surface growth,
and taking account of the overlap between surface; x_;
and volume, x,., crystallization, the time-dependent vol-
ume transformed is given by
.v(t) = x_ + x_(l - x_) (13)
Assuming that the rate of change of the enthalpy,dHidt scales linearly with the rate of volume trans-
formed, the DSC!DTA signal can then be computed as
a function of time and/or temperature as
x(T, + aT) - x(T,)DSC Signal: oc Jt (14)
5.2. Application to crystallization of lithium disilicale
glass
Measured parameters were assumed to model the
crystallization of lithium disilicate glass. The fitting
parameters were held constant at the values determined
from direct nucleation and growth data; they were not
optimized to produce better agreement with the experi-
mental data for crystallization. DSC/DTA peak
parameters, such as peak temperature, T_,, and peak
height, Ip, are strong functions of particle size [24] and
sample history; the computer model presented here is
capable of taking both effects into account. As an
example, Fig. 3 compares the model predictions with
experimental data for peak parameters for two sizes of
spherical glass particles that were first scanned through
the region in which the nucleation rate is significant
(400-500°C) at rates, @,, between 2 and 15°C rain- _,
and were subsequently scanned through the crystalliza-
tion peak at a rate, _, of 15°C min-L Symbols are
used for the data; the lines are the calculations. Results
from two independent DSC/DTA measurements of
these glasses are presented, providing a measure of the
K.F. Kehon Materials Science and Engineering A226-228 (1997) 142 I50 147
_D>
(D
1.2
0.6
1.2
1.0
09>
°_
0.8
0.6
i
(a)
' _---+- ' ' ' '(b).
, I I , ? ,040 4 8 1
q_n (C/rain)
lOs
10 7
10 6©
10 5
10 4
103
10z
_ 10I
o 10o
Z 10-1
10 -2
!
O
E
Z
lOs
10 7
106
4OO
Slead5 "", (slat9 " ,
?',
zone zone, I - , 1 _ --I- --
Nucleation . ('D'stallizalion-
zone / zonei
f
i ...............iiiJ---_-- , I k
450 500 550
Temperature (°C)
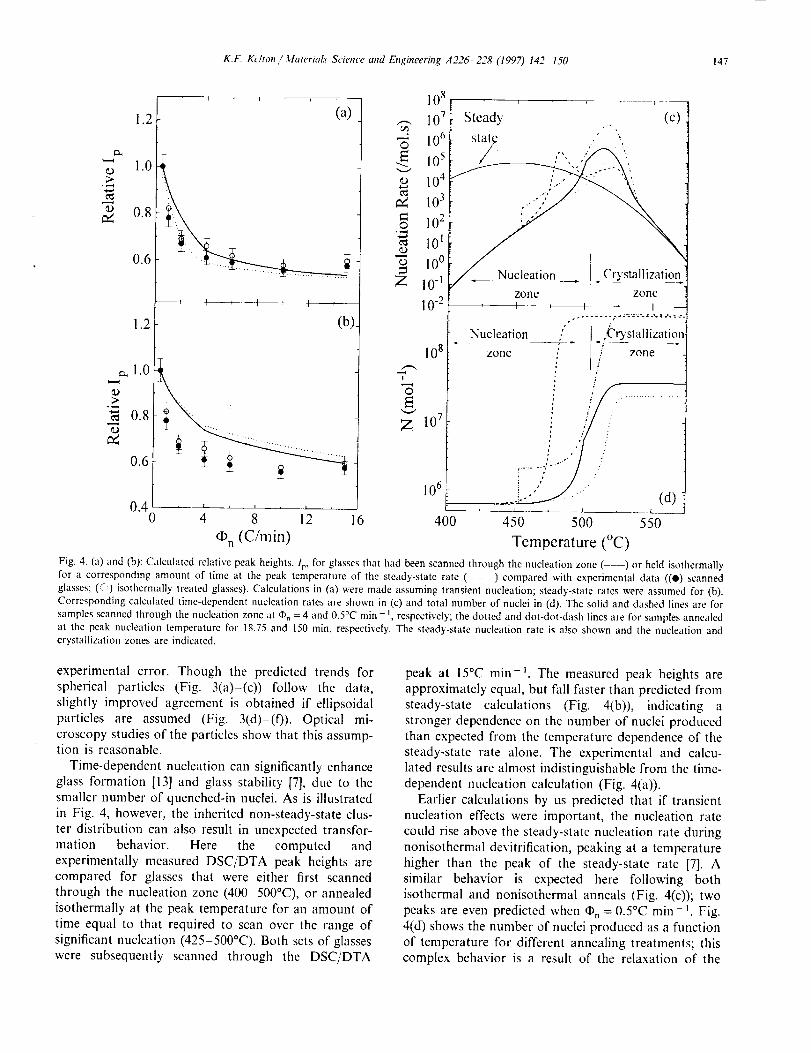
Fig. 4. (a) and (b): Calculated relative peak heights, Iv, for glasses that had been scanned through the nucleation zone ( --) or held isothermally
for a corresponding amount of time at the peak temperature of the steady-slate rate (- - - ) compared with experimental data ((O) scanned
glasses; (5-') isothermally treated glasses). Calculations in (a) were made assuming transient nucleation; steady-state rates were assumed for (b).
Corresponding calculated time-dependent nucleation rates are shown in (c) and total number of nuclei in (d). The solid and dashed lines are for
samples scanned through the nucleation zone at q), = 4 and 0.5°C rain - t, respectively; the dotted and dot-dot-dash lines are for samples annealed
at the peak nucleation temperature for 18.75 and 150 min, respectively. The steady-state nucleation rate is also shown and the nucleation andcrystallization zones are indicated.
experimental error. Though the predicted trends for
spherical particles (Fig. 3(a)-(c)) follow the data,
slightly improved agreement is obtained if ellipsoidal
particles are assumed (Fig. 3(d)(f)). Optical mi-
croscopy studies of the particles show that this assump-tion is reasonable.
Time-dependent nucleation can significantly enhance
glass formation [13] and glass stability [7], due to thesmaller number of quenched-in nuclei. As is illustrated
in Fig. 4, however, the inherited non-steady-state clus-
ter distribution can also result in unexpected transfor-
mation behavior. Here the computed and
experimentally measured DSC/DTA peak heights arecompared for glasses that were either first scanned
through the nucleation zone (400 500°C), or annealed
isothermally at the peak temperature for an amount of
time equal to that required to scan over the range of
significant nucleation (425 500°C). Both sets of glasses
were subsequently scanned through the DSC/DTA
peak at 15°C min-_. The measured peak heights are
approximately equal, but fall faster than predicted from
steady-state calculations (Fig. 4(b)), indicating a
stronger dependence on the number of nuclei produced
than expected from the temperature dependence of the
steady-state rate alone. The experimental and calcu-lated results are almost indistinguishable from the time-
dependent nucleation calculation (Fig. 4(a)).
Earlier calculations by us predicted that if transient
nucleation effects were important, the nucleation rate
could rise above the steady-state nucleation rate duringnonisothermal devitrification, peaking at a temperature
higher than the peak of the steady-state rate [7]. A
similar behavior is expected here following both
isothermal and nonisothermal anneals (Fig. 4(c)); two
peaks are even predicted when q_ = 0.5°C min _. Fig.
4(d) shows the number of nuclei produced as a function
of temperature for different annealing treatments; thiscomplex behavior is a result of the relaxation of the
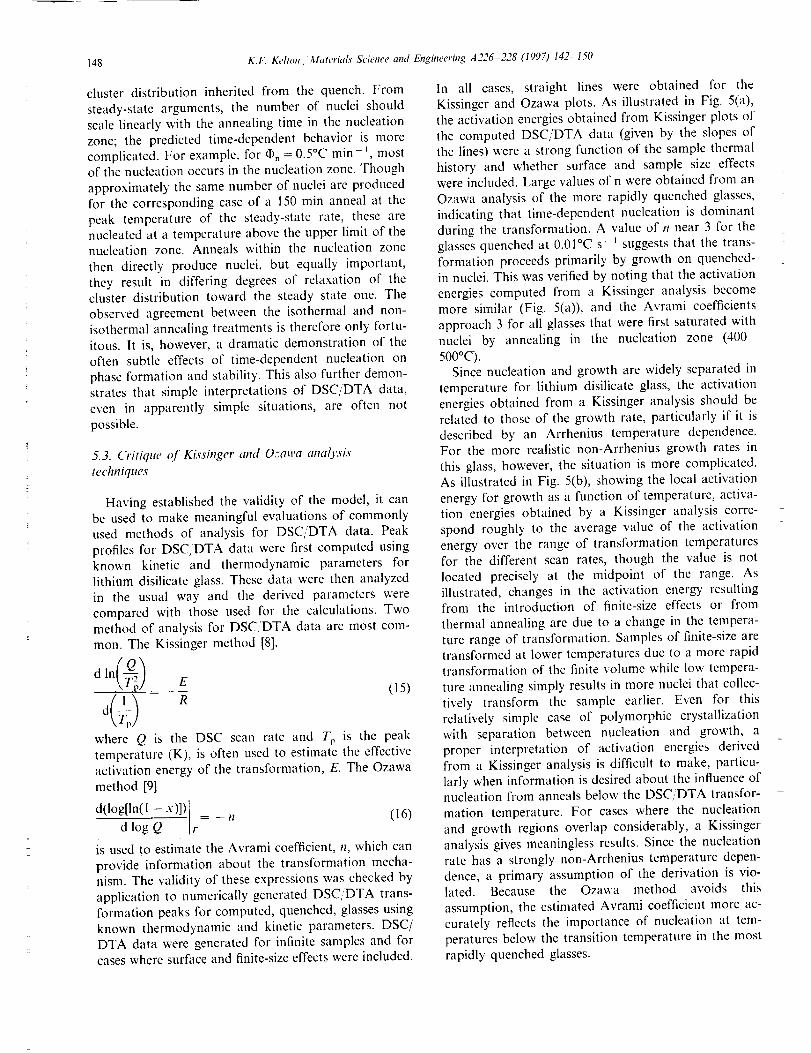
148 K.F. Kelton,'Materht& Science aml Engineer#zg A226 228 (1997) 142 150
cluster distribution inherited from the quench. From
steady-state arguments, the number of nuclei should
scale linearly with the annealing time in the nucleation
zone; the predicted time-dependent behavior is more
complicated. For example, for _., = 0.5°C min t, most
of the nucleation occurs in the nucleation zone. Thoughapproximately the same number of nuclei are produced
for the corresponding case of a 150 rain anneal at the
peak temperature of the steady-state rate, these are
nucleated at a temperature above the upper limit of thenucleation zone. Anneals within the nucleation zone
then directly produce nuclei, but equally important,they resuh in differing degrees of relaxation of the
cluster distribution toward the steady state one. The
observed agreement between the isothermal and non-
isothermal annealing treatments is therefore only fortu-itous. It is, however, a dramatic demonstration of the
often subtle effects of time-dependent nucleation onphase formation and stability. This also further demon-
strates that simple interpretations of DSC/DTA data,
even in apparently simple situations, are often not
possible.
5.3. Critique of Kissinger and O:awa anal.rsLrtechniques
Having established the validity of the model, it can
be used to make meaningful evaluations of commonly
used methods of analysis for DSC/DTA data. Peak
profiles for DSC/DTA data were first computed using
known kinetic and thermodynamic parameters for
lithium disilicate glass. These data were then analyzedin the usual way and the derived parameters were
compared with those used for the calculations. Two
method of analysis for DSC/DTA data are most com-
mon. The Kissinger method [8],
where Q is the DSC scan rate and Tp is the peaktemperature (K), is often used to estimate the effectiveactivation energy of the transformation, E. The Ozawa
method [9]
d(log[ln([ --x)])
0- ,-= -,, (16)
is used to estimate the Avrami coefficient, n, which can
provide information about the transformation mecha-
nism. The validity of these expressions was checked by
application to numerically generated DSC/DTA trans-
formation peaks for computed, quenched, glasses usingknown thermodynamic and kinetic parameters. DSC/
DTA data were generated for infinite samples and forcases where surface and finite-size effects were included.
In all cases, straight lines were obtained for the
Kissinger and Ozawa plots. As illustrated in Fig. 5(a),
the activation energies obtained from Kissinger plots of
the computed DSC/DTA data (given by the slopes ofthe lines) were a strong function of the sample thermal
history and whether surface and sample size effects
were included. Large values of n were obtained from an
Ozawa analysis of the more rapidly quenched glasses,
indicating that time-dependent nucleation is dominant
during the transformation. A value of n near 3 for theglasses quenched at 0.01°C s- _ suggests that the trans-
formation proceeds primarily by growth on quenched-
in nuclei. This was verified by noting that the activation
energies computed from a Kissinger analysis become
more similar (Fig. 5(a)), and the Avrami coefficients
approach 3 for all glasses that were first saturated with
nuclei by annealing in the nucleation zone (400500°C).
Since nucleation and growth are widely separated in
temperature for lithium disilicate glass, the activation
energies obtained from a Kissinger analysis should be
related to those of the growth rate, particularly if it is
described by an Arrhenius temperature dependence.For the more realistic non-Arrhenius growth rates in
this glass, however, the situation is more complicated.
As illustrated in Fig. 5(b), showing the local activation
energy for growth as a function of temperature, activa-
tion energies obtained by a Kissinger analysis corre-
spond roughly to the average value of the activation
energy over the range of transformation temperaturesfor the different scan rates, though the value is not
located precisely at the midpoint of the range. As
illustrated, changes in the activation energy resultingfrom the introduction of finite-size effects or from
thermal annealing are due to a change in the tempera-
ture range of transformation. Samples of finite-size aretransformed at lower temperatures due to a more rapid
transformation of the finite volume while low tempera-
ture annealing simply results in more nuclei that collec-
tively transform the sample earlier. Even for this
relatively simple case of polymorphic crystallization
with separation between nucleation and growth, a
proper interpretation of activation energies derivedfrom a Kissinger analysis is difficult to make, particu-
larly when information is desired about the influence of
nucleation from anneals below the DSC/DTA transfor-
mation temperature. For cases where the nucleation
and growth regions overlap considerably, a Kissinger
analysis gives meaningless results. Since the nucleation
rate has a strongly non-Arrhenius temperature depen-dence, a primary assumption of the derivation is vio-lated. Because the Ozawa method avoids this
assumption, the estimated Avrami coefficient more ac-
curately reflects the importance of nucleation at tem-
peratures below the transition temperature in the mostrapidly quenched glasses.
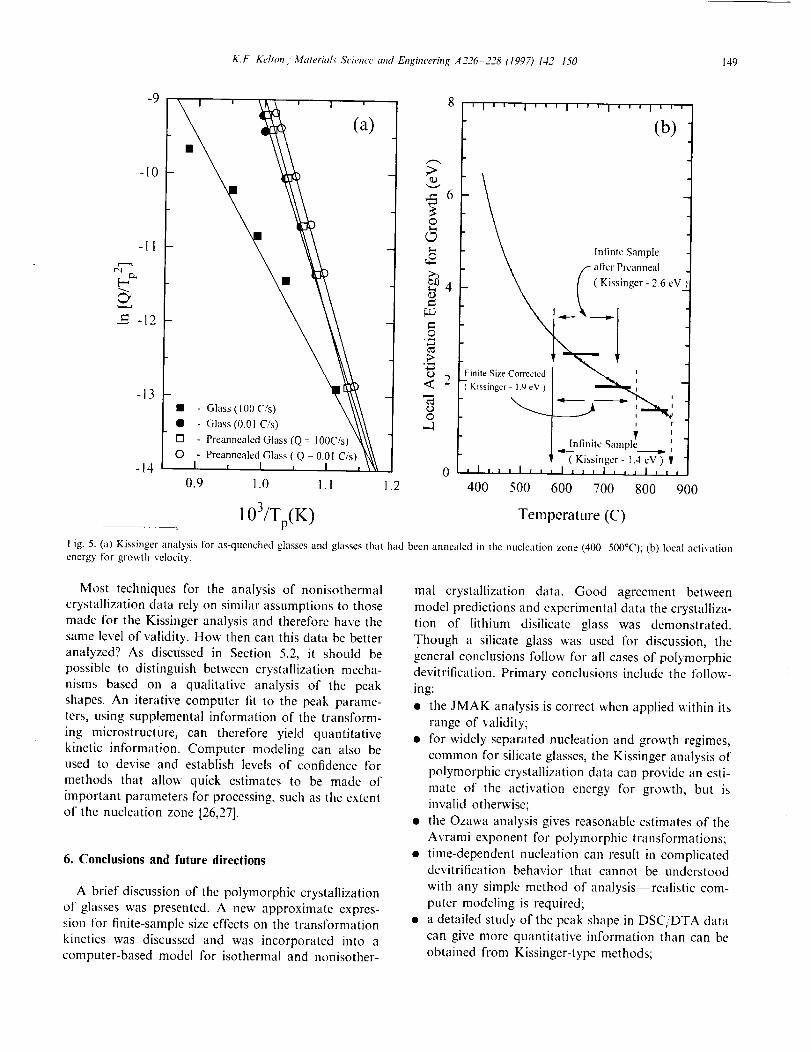
K.F. A2"lton _ Materia£_" Science and Engineering A226 228 (1997) I42 150 149
(a)
• - Glass (100 C/s)
• - Glass (0.01 C/s)
[] - PreannealedGlass (Q 100C/s)
O - Preannealed Glass ( Q - 0_01 C/s)
o
8 ' I ' ' ' I ' ' ' I ' ' ' I ' ' ' I ' ' '
(b)
>
,__ 6
.lnfinte Sample -
\ if- after Prcanneal
4 - X_X_ ..9__Q ----'_l(Kissinger - 2.6 eVi)
2 Finile Size Corrected _,'_ 1 ,
Kissinger - 1.9 eV ) """",,_,_
oy '
[nfinile Sample__.__.,. i
( Kissinger - 1.4 eV ) ¥0 , I , , i I , , , I , , , I , , , I , , ,
0.9 1.0 I. l 1.2 400 500 600 700 800 900
......... 103/Tp(K) Temperature (C)
Fig. 5. (a) Kissinger analysis for as-quenched glasses and glasses that had been annealed in lhe nucleation zone (400 500°C); (b) local activationenergy for grosvth velocity.
Most techniques for the analysis of nonisothermal
crystallization data rely on similar assumptions to those
made for the Kissinger analysis and therefore have thesame level of validity. How then can this data be better
analyzed? As discussed in Section 5.2, it should be
possible to distinguish between crystallization mecha-
nisms based on a qualitative analysis of the peak
shapes. An iterative computer fit to the peak parame-ters, using supplemental information of the transform-
ing microstructure, can therefore yield quantitative
kinetic information. Computer modeling can also beused to devise and establish levels of confidence for
methods that allow quick estimates to be made of
important parameters for processing, such as the extent
of the nucleation zone [26,27].
6. Conclusions and future directions
A brief discussion of the polymorphic crystallization
of glasses was presented. A new approximate expres-sion for finite-sample size effects on the transformation
kinetics was discussed and was incorporated into acomputer-based model for isothermal and nonisother-
mal crystallization data. Good agreement between
model predictions and experimental data the crystalliza-
tion of lithium disilicate glass was demonstrated.
Though a silicate glass was used for discussion, the
general conclusions follow for all cases of polymorphic
devitrification. Primary conclusions include the follow-
ing:
• the JMAK analysis is correct when applied within its
range of validity;
• for widely separated nucleation and growth regimes,
common for silicate glasses, the Kissinger analysis of
polymorphic crystallization data can provide an esti-
mate of the activation energy for growth, but isinvalid otherwise;
the Ozawa analysis gives reasonable estimates of the
Avrami exponent for polymorphic transformations;
time-dependent nucleation can result in complicateddevitrification behavior that cannot be understood
with any simple method of analysis realistic com-
puter modeling is required;
a detailed study of the peak shape in DSC/DTA data
can give more quantitative information than can be
obtained from Kissinger-type methods;
150 K.F. Ke[ton / Materhds Science and Engineer#Tg A226 228 ('I997) 142 I50
• supplementary information of the transformation
microstructure must be incorporated into any analy-sis of calorimetric data.
The results presented here were for polymorphicdevitrification by homogeneous nucleation. Clearly,
they should be extended to the more common case of
primary crystallization. Though diffusion-limited
growth has been well studied and can be incorporated
into the computer model in a rather straightforward
manner, the correct treatment for the time-dependent
nucleation of a cluster with a composition differentfrom that of the parent phase is unclear. Here the
embryo composition can change with cluster size and
the chemical make-up of the regions surrounding the
embryos will likely vary in a complicated manner, givcnthe stochastic nature of cluster evolution. Often the
classical theory can still be applied, changing only theGibbs free energy [28,29] or the interfacial energy [30]
with composition. When competition between diffusion
in the parent phase and interracial attachment arises,
however, the classical theory is inadequate because the
diffusive fluxes in the parent phase are coupled into the
stochastic fluxes from the parent phase to clusters ofthe new phase. We have recently extendcd our model of
time-dependent nucleation to treat this latter case. In-
terestingly, the scaling of the nucleation rate and the
transient time with the mobility as obtained from the
classical theory changes. A more complex dependence
on thermal history is therefore predicted, likely makingthe use of simple analytical expressions, such as the
Kissinger analysis, even more invalid.
Crystallization studies are rich, particularly when
coupled with multi-step annealing treatments. Morerealistic models, such as the computer model described
here, however, are required for the proper analysis of
these data. The ready availability of the necessary
computer processing power now makes this feasible.
Acknowledgemenls
This work was partially supported by NASA under
contracts NAG 8-898 and NCC-849.
References
[1] K.F. Kelton and F. Spaepen, Acta Metall., 3 (1985) 455.
[2] H. Yinnon and D.R. Uhlmann, J. Non-Cryst. So/i&, 54 (/983)
253.
[3] L. Granasy and T. Kemeny, Thermochimica Acta, 42 (1980) 289;
T. Kemeny and L. Granasy, J. ,'vkm-Crj'sl. Soli&, 68(1984) 193.
[4] M.C. Weinberg, J. Non-Ct3"st. Solids, 82 (1987) 779.
[5] C.S. Ray and D.E. Day, J. Am. Ceram. Sot., 73 (1990) 430.
[6] XJ. Xu, C.S. Ray and D.E. Day, J. Am. Ceram. Sot., 74 (1991)
909.
[7] K.F. Kelton, J. Nan-Crvst. Soli&, I63 (1993) 283.
[8] H.E. Kis._inger, Anal. Chem., 29 (1957) 1702, D.W. Henderson,
J. Non-Cryst. Solidv, 30 (1979) 301.
[9] T. Ozawa, Polymer, 12 (1971) 150.
[10] K.F. Kelton, Mater. Sci. Eng., B32 (1995) 145.
[l 1] K. Lakshmi Narayan, K.F. Kelton and C.S. Ray, J. Non-Crvst.
Solid_, 195(1996) 148.
[12] U. Koster and M. Blank-Bewersdorff, MRS Syrup. Proc., 57
(1987) 115.
[13] K.F. Kellon and A.L. Greer, J. A)_n-Crj'st. Soil&, 180(1986) 17.
[14] K.F. Kelton, in Solid State Physics, Academic Press, New York,
1991, pp. 75 177.
[15] A.N. Kolmogorov, ls=. Akad. Nauk SSR, Set. Fi=, 3 (1937) 355.
[16] W.A. Johnson and R. Mehl, Trans. AIME, 135 (1939) 416; M.
Avrami, ,Jr. Chem. Phys., 7 (1939) 1103.
[17] A. Calka and A.P. Radlinski, Mater. Set, Eng., 97 (1988) 241.
[18] J.W. Cahn, Acta Metall., 4 (1956) 449.
[[9] J.C. Holzer and K.F. Kelton, Acta Metall., 39 ([991) 1833.
[20] M,C. Weinberg, J. Non-Cr)'st. Solids, 142 (1992) 126.
[21] L.E. Levine, K. Lakshmi Narayan and K.F. Kelton, J. Mater.
Res., 12 (1997) 124.
[22] J.W. Cahn, in J.S. Ira, B. Park, A.L. Greer and G.B. Stephenson
(Eds.), MRS Syrup. Proe., Vol. 38, 1996, pp. 425 438.
[23] K.F. Kehon, A.L. Greer and C.V. Thompson, J. Cluv_z. Phys.,
79 (1983) 6261.
[24] W.S. ttuang, C.S. Ray, D.E. Day, K.L. Narayan, T.C. Cull and
K.F. Kelton, J. Non-C_Tst. Solids, 204 (1996) 1.
[25] K.F. Kelton, K.L. Narayan, L.E. Levine, T.C. Cull and C.S.
Ray, J. Non-Cryst. So6d_, 204 (1996) 13.
[26] C.S. Ray and D.E. Day, J. Am. Ceram. Sot., 73 (1990) 439.
[27] K.F. Kehon, J. Am. Ceram. Sot., 75 (1992) 2449.
[28] J.H. Pcrepezko and J.S. Smith, J. Non-Cryst. Solid% 44 (1981)
65.
[29] C.V. Thompson and F. Spaepen, Aeta Metall., 31 (1983) 2021.
[30] K.F. Kelton and K. Lakshmi Narayan, J. Nott-Crj'._'t. Soil&',
submitted.
Instructions for Authors
SUBMISSION OF PAPERS
Manuscripts for the main part of the journal and for the LettersSection should be submitted as follows:
For authors in Europe
Editor-in-Chief
Professor Herbert Herman
Department of Materials Science and Engineering
State University of New York at Stony Brook
Long Island, NY 11794-2275USA
Fax: +1 (516) 632 8052
or
Professor Gernot Kostorz
ETH Zurich
tnstitut for Angewandte PhysikCH-8093 Zurich
Switzerland
Fax: +41 (1633) 1105
For authors in Japan
Professor Masahiro Koiwa
Department of Materials Science and Engineering
Faculty of Engineering
Kyoto University
Yoshida-Honmachi, Sakyo-ku
Kyoto 606-01
Japan
Fax: +81 (75)751 7844
For authors in North and South America and the rest of the
world
Professor Herbert Herman
USA
or
Professor Carl C. Koch
North Carolina State University
Department of Materials Science and Engineering
233 Riddick Building
Yarbrough Drive
Raleigh, NC 27695-7907
USA
Fax: +1 (919) 515 7724
ManuscriptsThree copies should be submitted to the Editor, in double-spaced
typing on pages of A4 size and with wide margins (Letters
should not exceed 2000 words and a maximum of 5 figures). All
tables and illustrations should bear a title or legend.
An abstract should accompany reviews, original papers and Let-
ters. It should present (preferably in 100-150 words; 50 words
or less for Letters) a brief and factual account of the contents
and conclusions of the paper, and an indication of the relevance
of new material.
References should be indicated by numerals in square brackets,
introduced consecutively and appropriately in the text.
References must be listed on separate sheet(s} at the end of the
paper. Even/ reference appearing in the text should be quoted in
the reference list, and vice versa. When reference is made to a
publication written by more than two authors it is preferable to
give only the first author's name in the text followed by "et aL"
However, in the list of references the names and initials of all
authors must be given.
Three sets of figures should be submitted. One set of line draw-
ings should be in a form suitable for reproduction, drawn in
Indian ink on drawing or tracing paper (letter height, 3-5 ram).
Alternatively, such illustrations may be supplied as high contrast,
black-and-white glossy prints. Duplicate original micrographs
should be provided wherever possible to facilitate the refereeing
process. Magnifications should be indicated by a ruled scale bar
on the micrograph. Captions to illustrations should be typed in
sequence on a separate page.
All abbreviated terms must be defined when first used (both in
the abstract and in the text) and authors must express all quanti-
ties in SI units, with other units in parentheses if desired.
Authors in Japan please note that information about how to have
the English of your paper checked, corrected and improved
(before submission) is available from:
Elsevier Science Japan
Higashi-Azabu l-chome Building 4F
1-9-15 Higashi-AzabuMinato-ku
Tokyo 106
Japan
Tel: + 81-3-5561-5032; Fax: + 81-3-5561-5045.
Further information
All questions arising after the acceptance of manuscripts, espe-
cially those relating to proofs, should be directed to:
Elsevier Editorial Services
Mayfield House
256 Banbury RoadOxford OX2 7DH
UK
Tel. +44(0) 1865 314900; Fax. +44(0) 1865 314990.
Submission of electronic text
The final text may be submitted on a 3.5 in or 5.25 in diskette
(in addition to a hard copy with original figures). Double density
(DD) or high density (HD) diskettes are acceptable, but must be
formatted to their capacity before the files are copied on to
them. The main text, list of references, tables and figure legends
should be stored in separate text files with clearly identifiable file
names. The format of these files depends on the word proces-
sor used. WordPerfect 5.1 is the most preferable but for other
formats please refer to the Instructions to Authors booklet. It is
essential that the name and version of the wordprocessing pro-
gram, type of computer on which the text was prepared, and
format of the text files are clearly indicated.
The final manuscript may contain last minute corrections which
are not included in the electronic text but such corrections must
be clearly marked on the hard copy.