analysis of demographic trends and housing demand … · analysis of demographic trends and housing...
TRANSCRIPT
Report to:
Upper Hutt City Council
ANALYSIS OF DEMOGRAPHIC TRENDS AND HOUSING
DEMAND IN UPPER HUTT CITY
Prepared by
Dr Adrian Slack
January 2012
Copyright© BERL
BERL ref #5191
ii Report to Upper Hutt City Council Upper Hutt City Demographics and Housing Demand
January 2012
Analysis of Demographic Trends and Housing Demand in
Upper Hutt City
1 Summary .......................................................................................... 1
2 Analysis of housing demand .......................................................... 3
2.1 Key economic performance indicators for Upper Hutt City ..................... 3
2.2 Recent trends in population growth and location in Upper Hutt City ....... 4
2.3 Projected population growth in Upper Hutt City, 2006-2031 ................... 5
2.4 Average household size .......................................................................... 7
2.5 Dwelling and residential land projections, 2006-2031 ............................. 9
2.6 Dwelling supply in Upper Hutt City ........................................................ 10
2.7 Assessment of housing supply and demand ......................................... 11
3 Appendices .................................................................................... 12
3.1 Sensitivity Analysis ................................................................................ 12
3.2 The Riverstone Terraces property development ................................... 14
3.3 Implications of an aging population for the projections ......................... 15
3.4 Implications of Rimutaka Prison for the projections .............................. 16
Tables
Table 1 Upper Hutt City 2010 Economic KPIs .................................................................. 3
Table 2 Upper Hutt City Economic KPI Trends ................................................................. 4
Table 3 Projected population growth, 2006 to 2031 (years ending 30 June) .................... 7
Table 4 Projected household type and household size (base: 30 June 2006 estimate) ... 7
Table 5 Projected demand for additional dwellings and residential land .......................... 9
Table 6 Projected population growth, 2006 to 2031 (medium growth series) ................. 12
Table 7 Projected demand for dwellings and residential land (medium growth series) .. 12
Table 8 Projected population growth, 2006 to 2031 (March 2006 base) ........................ 13
Table 9 Projected household type and household size .................................................. 13
Table 10 Projected demand for dwellings and residential land (March base) ................. 13
Figures
Figure 1 Upper Hutt City Resident Population Growth Trend (index base in 2000 = 100) 4
Figure 2 Upper Hutt City Resident Population Location (Census 2006) ........................... 5
Figure 3 Upper Hutt City Resident Population Projections (StatsNZ) ............................... 6
Figure 4 Upper Hutt City Population Projections by age group (StatsNZ) ........................ 8
Figure 5 Number of new dwellings consented in Upper Hutt City, 2002-2011 ................ 10
Figure 6 Riverstone Terraces property value by use (Quotable Value New Zealand) .... 14
1 Report to Upper Hutt City Council Upper Hutt City Demographics and Housing Demand
January 2012
1 Summary
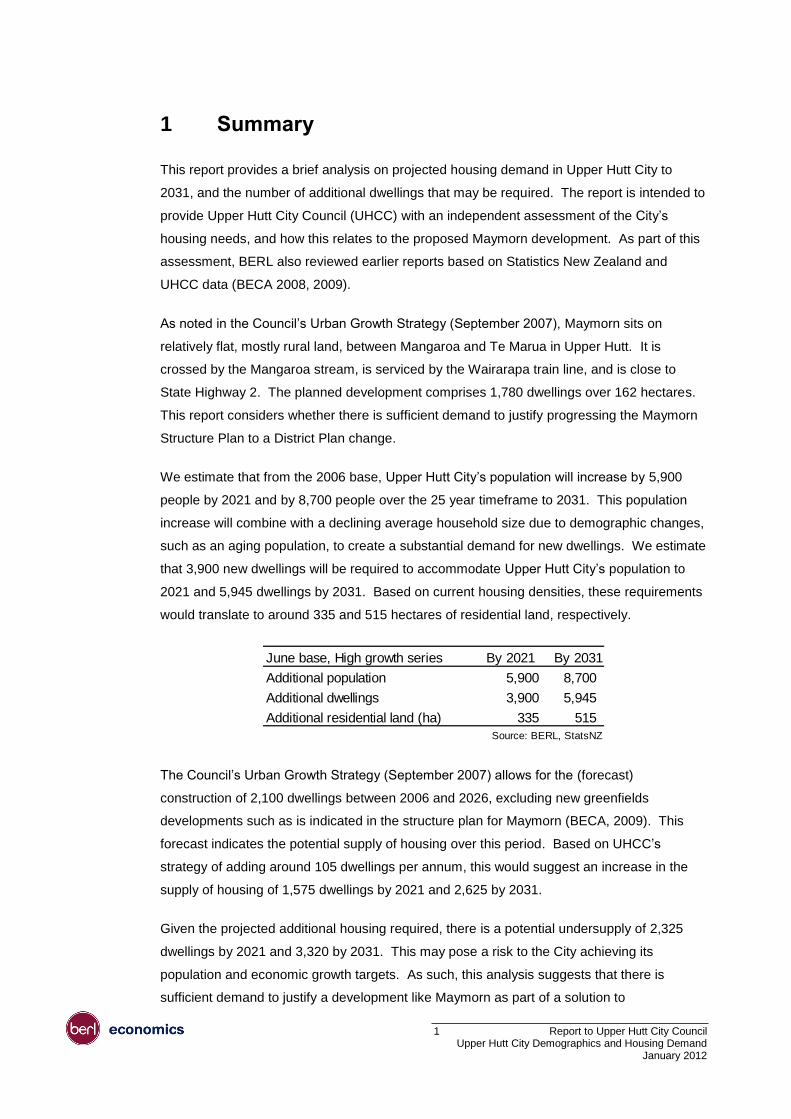
This report provides a brief analysis on projected housing demand in Upper Hutt City to
2031, and the number of additional dwellings that may be required. The report is intended to
provide Upper Hutt City Council (UHCC) with an independent assessment of the City’s
housing needs, and how this relates to the proposed Maymorn development. As part of this
assessment, BERL also reviewed earlier reports based on Statistics New Zealand and
UHCC data (BECA 2008, 2009).
As noted in the Council’s Urban Growth Strategy (September 2007), Maymorn sits on
relatively flat, mostly rural land, between Mangaroa and Te Marua in Upper Hutt. It is
crossed by the Mangaroa stream, is serviced by the Wairarapa train line, and is close to
State Highway 2. The planned development comprises 1,780 dwellings over 162 hectares.
This report considers whether there is sufficient demand to justify progressing the Maymorn
Structure Plan to a District Plan change.
We estimate that from the 2006 base, Upper Hutt City’s population will increase by 5,900
people by 2021 and by 8,700 people over the 25 year timeframe to 2031. This population
increase will combine with a declining average household size due to demographic changes,
such as an aging population, to create a substantial demand for new dwellings. We estimate
that 3,900 new dwellings will be required to accommodate Upper Hutt City’s population to
2021 and 5,945 dwellings by 2031. Based on current housing densities, these requirements
would translate to around 335 and 515 hectares of residential land, respectively.
The Council’s Urban Growth Strategy (September 2007) allows for the (forecast)
construction of 2,100 dwellings between 2006 and 2026, excluding new greenfields
developments such as is indicated in the structure plan for Maymorn (BECA, 2009). This
forecast indicates the potential supply of housing over this period. Based on UHCC’s
strategy of adding around 105 dwellings per annum, this would suggest an increase in the
supply of housing of 1,575 dwellings by 2021 and 2,625 by 2031.
Given the projected additional housing required, there is a potential undersupply of 2,325
dwellings by 2021 and 3,320 by 2031. This may pose a risk to the City achieving its
population and economic growth targets. As such, this analysis suggests that there is
sufficient demand to justify a development like Maymorn as part of a solution to
June base, High growth series By 2021 By 2031
Additional population 5,900 8,700
Additional dwellings 3,900 5,945
Additional residential land (ha) 335 515
Source: BERL, StatsNZ
2 Report to Upper Hutt City Council Upper Hutt City Demographics and Housing Demand
January 2012
accommodating the increased housing needs of Upper Hutt City. BERL does not, however,
make any strategic or planning related judgments as to whether Maymorn is the optimal
location or specification. These judgments are ultimately for the Council to make.
We consider that the estimates contained in this report are realistic: while they are based on
Statistics New Zealand’s “high” growth scenario, they are not inconsistent with the City’s
growth patterns over the past decade. Looking forward, the economy of the City and country
as a whole are likely to grow, and as such the demand for housing is likely to rise.
We note that in addition to Upper Hutt City’s own growth, it is well located to be a high
functioning satellite settlement to Wellington. 1 As a “satellite city”, Upper Hutt City has an
important role in contributing to the Region’s growth and to benefit from this in terms of
growing its own population. Upper Hutt City’s character and lower land values (than
Wellington City), combined with increased amenity from new housing developments and
employment growth consistent with the Council’s strategy will increase demand within Upper
Hutt for new housing.
Taking this wider view, the core population projections for Upper Hutt City may
underestimate the positive impact of economic growth in Wellington City and the region. In
particular, with its increasingly constrained supply of land, this is likely to spread population
(and economic) growth to the surrounding areas. Thus, the rate of growth will be influenced
by a range of factors both within and outside of UHCC’s boundaries. This, along with a
review of data specific to UHCC, leads us to the view that high growth scenario is
appropriate. UHCC therefore needs to plan now for growth in future housing demand.
1 The NSW’s metropolitan transport strategy “City of Cities” emphasises the crucial role of an integrated city system
to permit optimal growth. A core part of this strategy is that wider Sydney acts as a networked entity, with strong satellite cities supporting the core. In this view, the cities are not competitors but critical components in a wider system that act to relax the growth constraint at the centre.
3 Report to Upper Hutt City Council Upper Hutt City Demographics and Housing Demand
January 2012
2 Analysis of housing demand
We begin this analysis with a brief overview of the context for economic growth and
development in Upper Hutt City (UHC). While there will be fluctuations in economic and
population growth from year to year, it is important for long term planning and development
to focus on longer term trends. We therefore consider both recent population growth and
trends, which provide context to the projected population growth for UHC.
2.1 Key economic performance indicators for Upper Hutt City
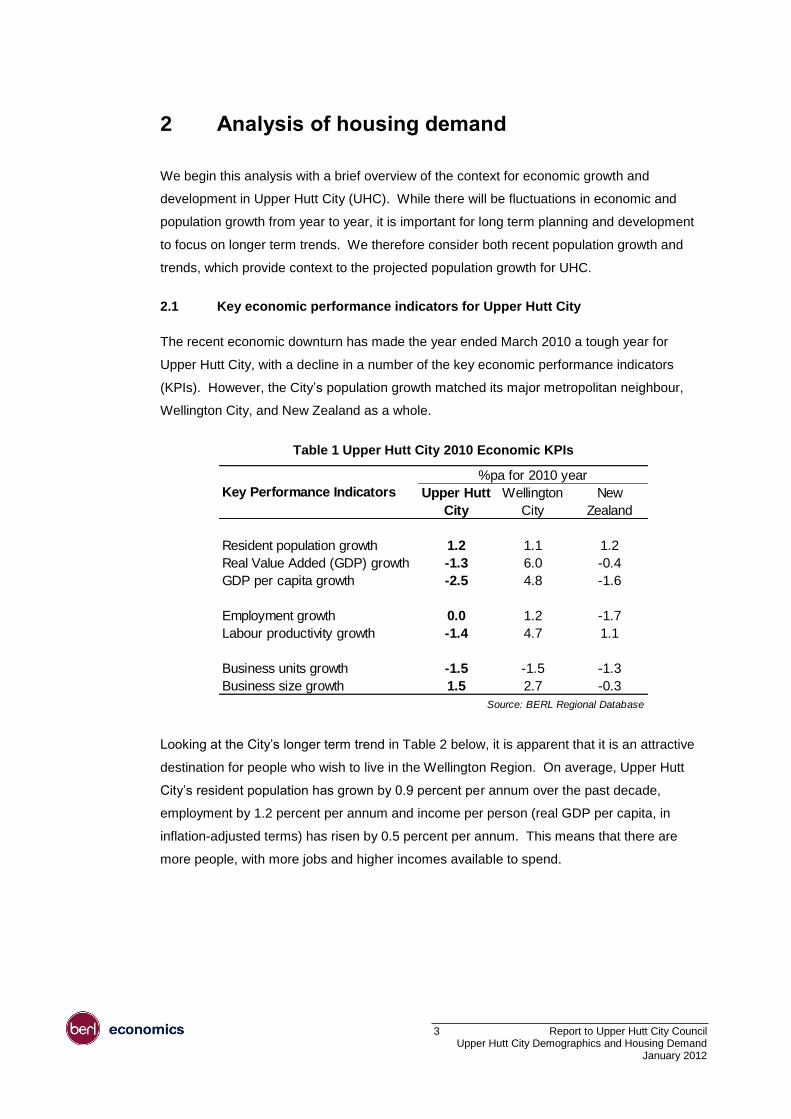
The recent economic downturn has made the year ended March 2010 a tough year for
Upper Hutt City, with a decline in a number of the key economic performance indicators
(KPIs). However, the City’s population growth matched its major metropolitan neighbour,
Wellington City, and New Zealand as a whole.
Table 1 Upper Hutt City 2010 Economic KPIs
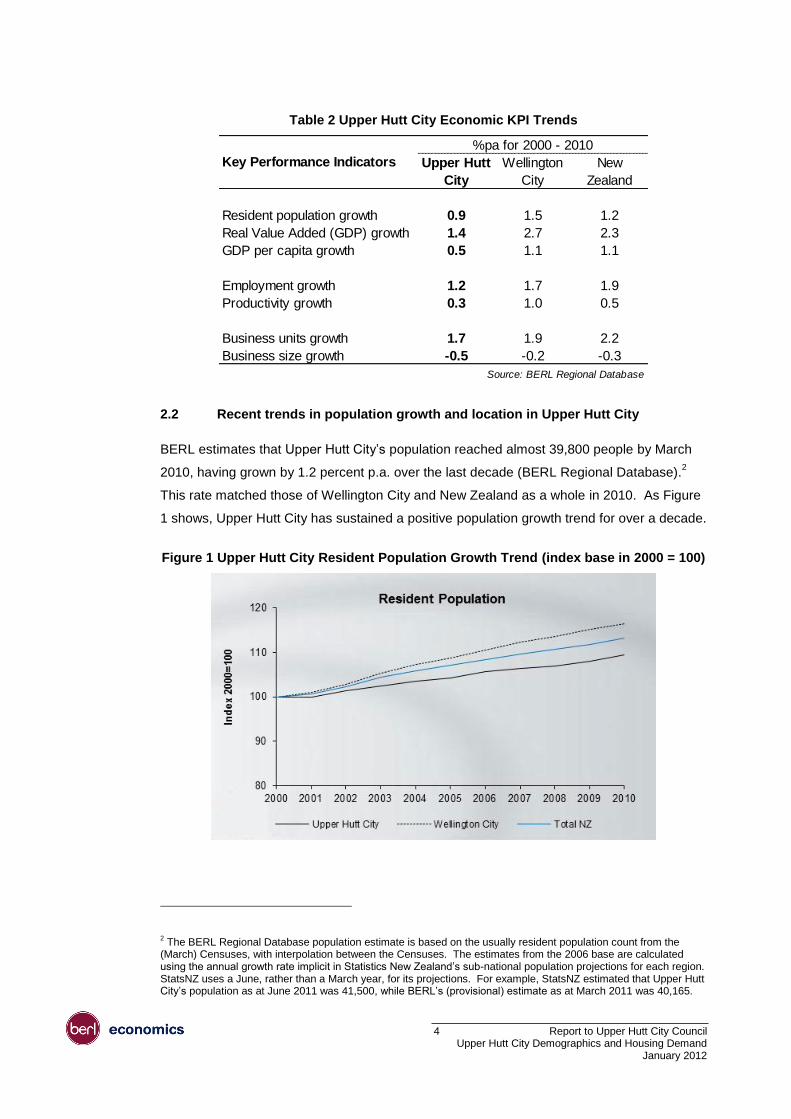
Looking at the City’s longer term trend in Table 2 below, it is apparent that it is an attractive
destination for people who wish to live in the Wellington Region. On average, Upper Hutt
City’s resident population has grown by 0.9 percent per annum over the past decade,
employment by 1.2 percent per annum and income per person (real GDP per capita, in
inflation-adjusted terms) has risen by 0.5 percent per annum. This means that there are
more people, with more jobs and higher incomes available to spend.
Upper Hutt
City
Wellington
City
New
Zealand
Resident population growth 1.2 1.1 1.2
Real Value Added (GDP) growth -1.3 6.0 -0.4
GDP per capita growth -2.5 4.8 -1.6
Employment growth 0.0 1.2 -1.7
Labour productivity growth -1.4 4.7 1.1
Business units growth -1.5 -1.5 -1.3
Business size growth 1.5 2.7 -0.3
Source: BERL Regional Database
Key Performance Indicators
%pa for 2010 year
4 Report to Upper Hutt City Council Upper Hutt City Demographics and Housing Demand
January 2012
Table 2 Upper Hutt City Economic KPI Trends
2.2 Recent trends in population growth and location in Upper Hutt City
BERL estimates that Upper Hutt City’s population reached almost 39,800 people by March
2010, having grown by 1.2 percent p.a. over the last decade (BERL Regional Database).2
This rate matched those of Wellington City and New Zealand as a whole in 2010. As Figure
1 shows, Upper Hutt City has sustained a positive population growth trend for over a decade.
Figure 1 Upper Hutt City Resident Population Growth Trend (index base in 2000 = 100)
2 The BERL Regional Database population estimate is based on the usually resident population count from the
(March) Censuses, with interpolation between the Censuses. The estimates from the 2006 base are calculated using the annual growth rate implicit in Statistics New Zealand’s sub-national population projections for each region. StatsNZ uses a June, rather than a March year, for its projections. For example, StatsNZ estimated that Upper Hutt City’s population as at June 2011 was 41,500, while BERL’s (provisional) estimate as at March 2011 was 40,165.
Upper Hutt
City
Wellington
City
New
Zealand
Resident population growth 0.9 1.5 1.2
Real Value Added (GDP) growth 1.4 2.7 2.3
GDP per capita growth 0.5 1.1 1.1
Employment growth 1.2 1.7 1.9
Productivity growth 0.3 1.0 0.5
Business units growth 1.7 1.9 2.2
Business size growth -0.5 -0.2 -0.3
Source: BERL Regional Database
Key Performance Indicators
%pa for 2000 - 2010
5 Report to Upper Hutt City Council Upper Hutt City Demographics and Housing Demand
January 2012
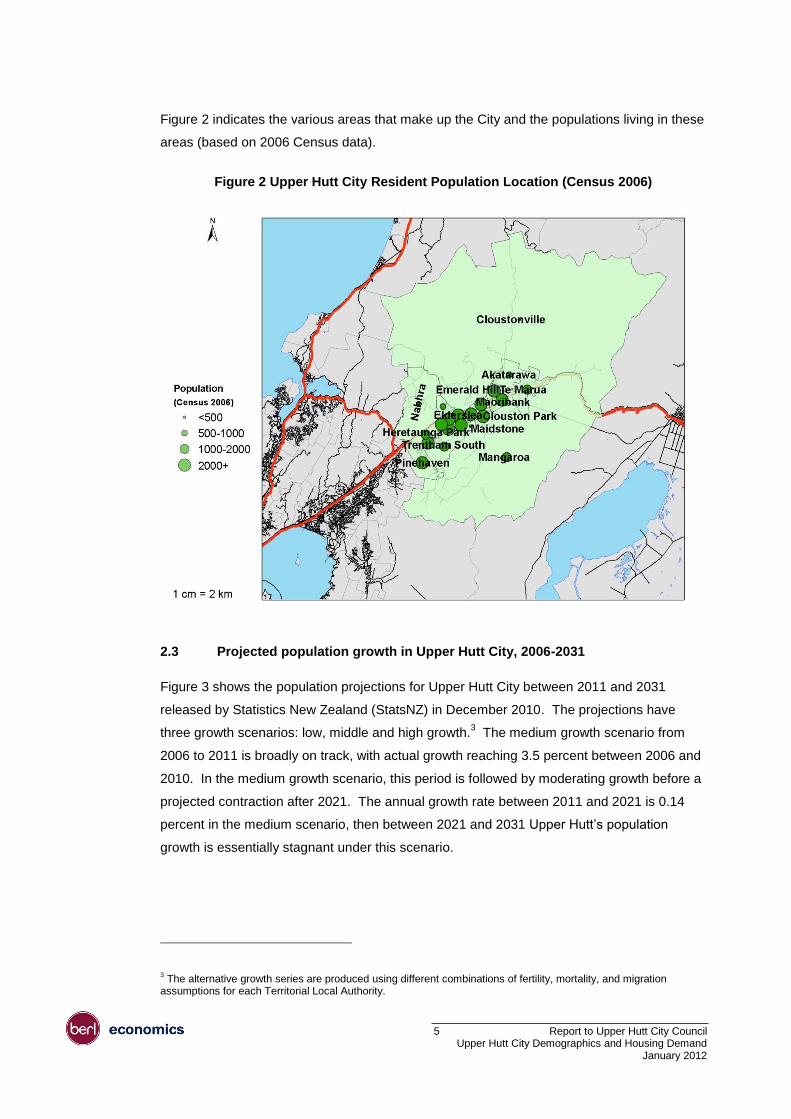
Figure 2 indicates the various areas that make up the City and the populations living in these
areas (based on 2006 Census data).
Figure 2 Upper Hutt City Resident Population Location (Census 2006)
2.3 Projected population growth in Upper Hutt City, 2006-2031
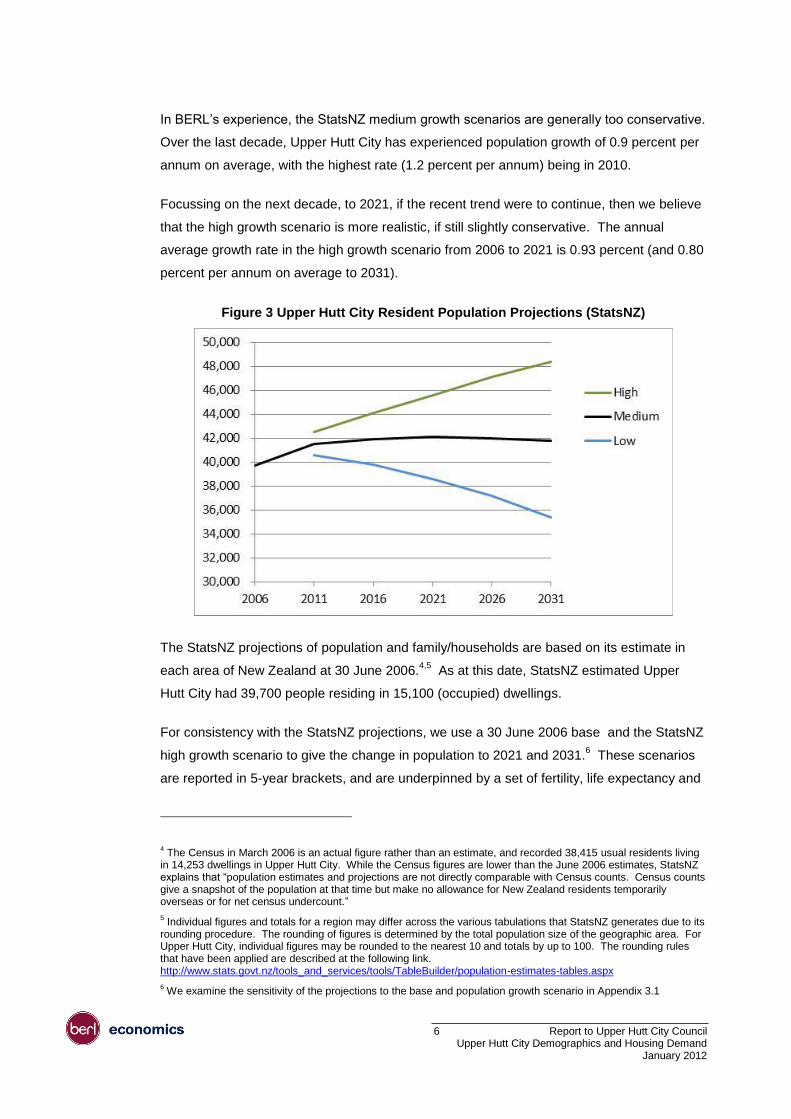
Figure 3 shows the population projections for Upper Hutt City between 2011 and 2031
released by Statistics New Zealand (StatsNZ) in December 2010. The projections have
three growth scenarios: low, middle and high growth.3 The medium growth scenario from
2006 to 2011 is broadly on track, with actual growth reaching 3.5 percent between 2006 and
2010. In the medium growth scenario, this period is followed by moderating growth before a
projected contraction after 2021. The annual growth rate between 2011 and 2021 is 0.14
percent in the medium scenario, then between 2021 and 2031 Upper Hutt’s population
growth is essentially stagnant under this scenario.
3 The alternative growth series are produced using different combinations of fertility, mortality, and migration
assumptions for each Territorial Local Authority.
6 Report to Upper Hutt City Council Upper Hutt City Demographics and Housing Demand
January 2012
In BERL’s experience, the StatsNZ medium growth scenarios are generally too conservative.
Over the last decade, Upper Hutt City has experienced population growth of 0.9 percent per
annum on average, with the highest rate (1.2 percent per annum) being in 2010.
Focussing on the next decade, to 2021, if the recent trend were to continue, then we believe
that the high growth scenario is more realistic, if still slightly conservative. The annual
average growth rate in the high growth scenario from 2006 to 2021 is 0.93 percent (and 0.80
percent per annum on average to 2031).
Figure 3 Upper Hutt City Resident Population Projections (StatsNZ)
The StatsNZ projections of population and family/households are based on its estimate in
each area of New Zealand at 30 June 2006.4,5
As at this date, StatsNZ estimated Upper
Hutt City had 39,700 people residing in 15,100 (occupied) dwellings.
For consistency with the StatsNZ projections, we use a 30 June 2006 base and the StatsNZ
high growth scenario to give the change in population to 2021 and 2031.6 These scenarios
are reported in 5-year brackets, and are underpinned by a set of fertility, life expectancy and
4 The Census in March 2006 is an actual figure rather than an estimate, and recorded 38,415 usual residents living
in 14,253 dwellings in Upper Hutt City. While the Census figures are lower than the June 2006 estimates, StatsNZ explains that “population estimates and projections are not directly comparable with Census counts. Census counts give a snapshot of the population at that time but make no allowance for New Zealand residents temporarily overseas or for net census undercount.”
5 Individual figures and totals for a region may differ across the various tabulations that StatsNZ generates due to its
rounding procedure. The rounding of figures is determined by the total population size of the geographic area. For Upper Hutt City, individual figures may be rounded to the nearest 10 and totals by up to 100. The rounding rules that have been applied are described at the following link. http://www.stats.govt.nz/tools_and_services/tools/TableBuilder/population-estimates-tables.aspx
6 We examine the sensitivity of the projections to the base and population growth scenario in Appendix 3.1

7 Report to Upper Hutt City Council Upper Hutt City Demographics and Housing Demand
January 2012
migration assumptions.7 The projected population figures are converted to an estimate of
required (occupied) dwellings using the projected number of residents per household.8
Based on the high growth scenario from 30 June 2006, Table 3 shows that Upper Hutt City
will need to accommodate an additional 5,900 people by 2021 and a total of 8,700 by 2031.
Table 3 Projected population growth, 2006 to 2031 (years ending 30 June)
Our projections of dwellings focus on occupied dwellings, and do not include additional
dwellings that may form part of the overall required stock of housing. That is, the projections
do not allow for the increase in the total stock of dwellings, which also includes dwellings that
are under construction or unoccupied at any particular point of time. As such, the projections
are a conservative estimate of the increase in the total housing stock required. 9
2.4 Average household size
The StatsNZ sub-national household projections show a decline in average household size
for Upper Hutt City between 2006 and 2031.
Table 4 Projected household type and household size (base: 30 June 2006 estimate)
7 The assumptions are specific to particular territorial authorities and are publically available from StatsNZ.
8 StatsNZ defines a dwelling as “any building or structure, or part thereof, that is used (or intended to be used) for
the purpose of human habitation. It can be of a permanent or temporary nature and includes structures such as houses, motels, hotels, prisons, motor homes, huts and tents. There can be more than one dwelling within a building, for example an apartment building where each separate apartment or unit is considered a dwelling.”
9 For example, the March 2006 Census recorded that Upper Hutt City had a total housing stock of 15,102 dwellings,
of which just under 95% were occupied. That is, the total stock was comprised of 14,211 occupied private and 42 non-private dwellings (94.4%), 705 unoccupied dwelling (4.7%) and 144 dwellings under construction (1.0%).
2006 2011 2016 2021 2026 2031 2021 2031
Population 39,700 42,500 44,100 45,600 47,100 48,400 5,900 8,700
Avg % p.a. 1.37% 0.74% 0.67% 0.65% 0.55% 0.93% 0.80%
Source: StatsNZ
Upper
Hutt City
Change 2006 to
Family
Other
multi-
person
One-
person
2006 72% 2% 25% 2.6
2011 70% 2% 27% 2.5
2016 69% 2% 29% 2.4
2021 67% 2% 31% 2.4
2026 65% 2% 32% 2.3
2031 63% 2% 34% 2.3Source: Statistics New Zealand
Household typeAverage
household
size
Upper
Hutt City
8 Report to Upper Hutt City Council Upper Hutt City Demographics and Housing Demand
January 2012
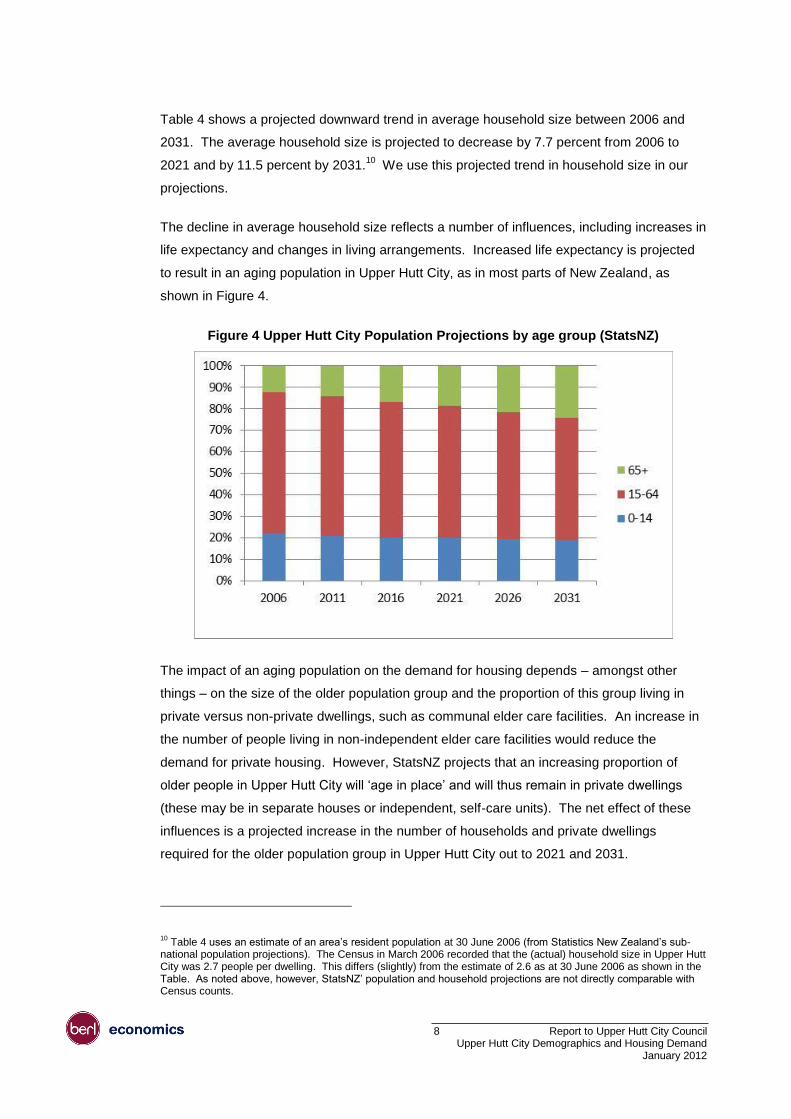
Table 4 shows a projected downward trend in average household size between 2006 and
2031. The average household size is projected to decrease by 7.7 percent from 2006 to
2021 and by 11.5 percent by 2031.10
We use this projected trend in household size in our
projections.
The decline in average household size reflects a number of influences, including increases in
life expectancy and changes in living arrangements. Increased life expectancy is projected
to result in an aging population in Upper Hutt City, as in most parts of New Zealand, as
shown in Figure 4.
Figure 4 Upper Hutt City Population Projections by age group (StatsNZ)
The impact of an aging population on the demand for housing depends – amongst other
things – on the size of the older population group and the proportion of this group living in
private versus non-private dwellings, such as communal elder care facilities. An increase in
the number of people living in non-independent elder care facilities would reduce the
demand for private housing. However, StatsNZ projects that an increasing proportion of
older people in Upper Hutt City will ‘age in place’ and will thus remain in private dwellings
(these may be in separate houses or independent, self-care units). The net effect of these
influences is a projected increase in the number of households and private dwellings
required for the older population group in Upper Hutt City out to 2021 and 2031.
10 Table 4 uses an estimate of an area’s resident population at 30 June 2006 (from Statistics New Zealand’s sub-
national population projections). The Census in March 2006 recorded that the (actual) household size in Upper Hutt City was 2.7 people per dwelling. This differs (slightly) from the estimate of 2.6 as at 30 June 2006 as shown in the Table. As noted above, however, StatsNZ’ population and household projections are not directly comparable with Census counts.
9 Report to Upper Hutt City Council Upper Hutt City Demographics and Housing Demand
January 2012
2.5 Dwelling and residential land projections, 2006-2031
We project the demand for dwellings based on the population projections and household
formation trends outlined above. To provide an indication of the potential land area required
for the additional dwellings required, we use QV data on the amount of residential land in
Upper Hutt city in 2006 to estimate the number of dwellings per hectare.11
We estimate that
there were 11.6 dwellings per hectare (ha) of residential land on average in 2006.
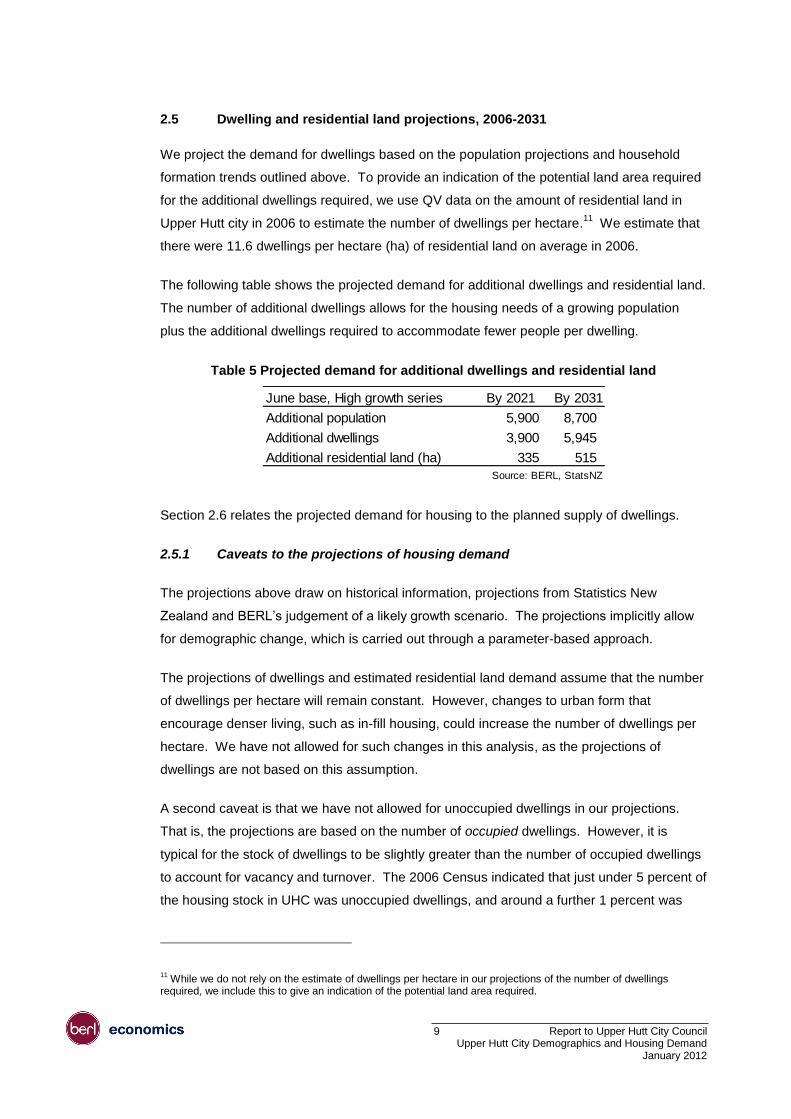
The following table shows the projected demand for additional dwellings and residential land.
The number of additional dwellings allows for the housing needs of a growing population
plus the additional dwellings required to accommodate fewer people per dwelling.
Table 5 Projected demand for additional dwellings and residential land
Section 2.6 relates the projected demand for housing to the planned supply of dwellings.
2.5.1 Caveats to the projections of housing demand
The projections above draw on historical information, projections from Statistics New
Zealand and BERL’s judgement of a likely growth scenario. The projections implicitly allow
for demographic change, which is carried out through a parameter-based approach.
The projections of dwellings and estimated residential land demand assume that the number
of dwellings per hectare will remain constant. However, changes to urban form that
encourage denser living, such as in-fill housing, could increase the number of dwellings per
hectare. We have not allowed for such changes in this analysis, as the projections of
dwellings are not based on this assumption.
A second caveat is that we have not allowed for unoccupied dwellings in our projections.
That is, the projections are based on the number of occupied dwellings. However, it is
typical for the stock of dwellings to be slightly greater than the number of occupied dwellings
to account for vacancy and turnover. The 2006 Census indicated that just under 5 percent of
the housing stock in UHC was unoccupied dwellings, and around a further 1 percent was
11 While we do not rely on the estimate of dwellings per hectare in our projections of the number of dwellings
required, we include this to give an indication of the potential land area required.
June base, High growth series By 2021 By 2031
Additional population 5,900 8,700
Additional dwellings 3,900 5,945
Additional residential land (ha) 335 515
Source: BERL, StatsNZ
10 Report to Upper Hutt City Council Upper Hutt City Demographics and Housing Demand
January 2012
under construction. The impact of allowing for dwellings that are unoccupied and under
construction is examined in a sensitivity analysis reported in appendix 3.1
2.6 Dwelling supply in Upper Hutt City
The sections above provide an indication of the demand for dwellings in Upper Hutt City to
2021 and 2031. Below we consider the potential supply of dwellings as per the Council’s
plans and consented work to date.
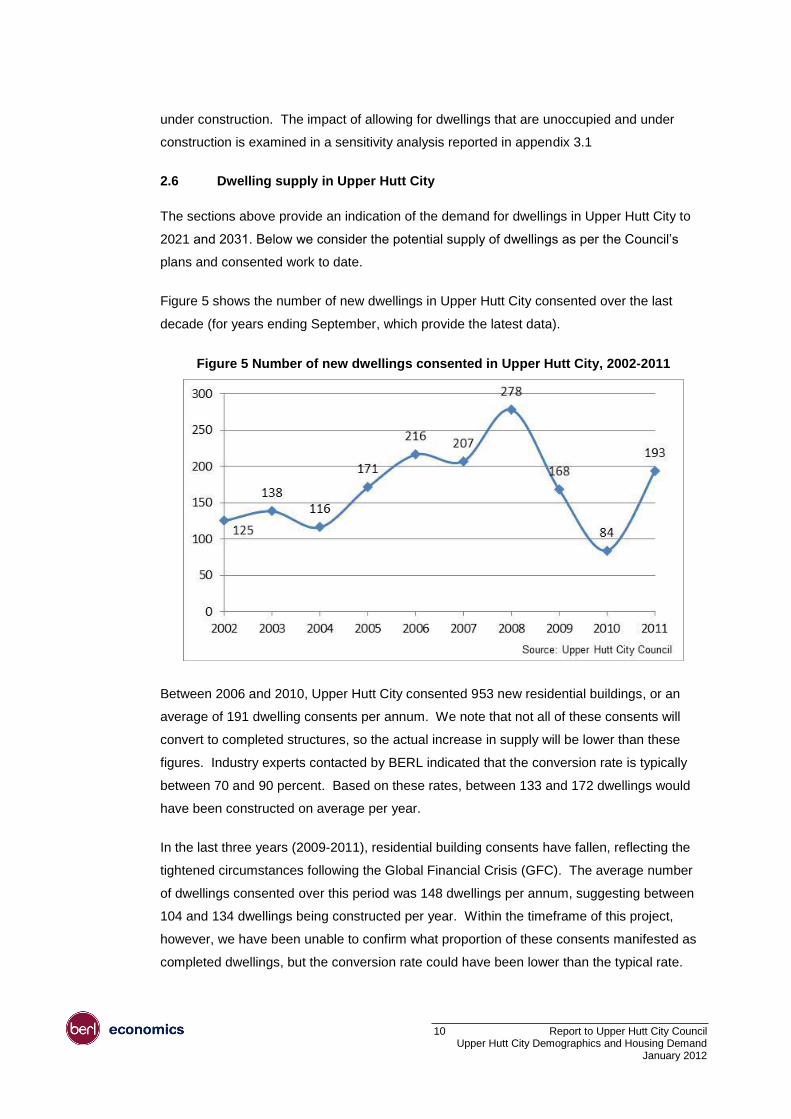
Figure 5 shows the number of new dwellings in Upper Hutt City consented over the last
decade (for years ending September, which provide the latest data).
Figure 5 Number of new dwellings consented in Upper Hutt City, 2002-2011
Between 2006 and 2010, Upper Hutt City consented 953 new residential buildings, or an
average of 191 dwelling consents per annum. We note that not all of these consents will
convert to completed structures, so the actual increase in supply will be lower than these
figures. Industry experts contacted by BERL indicated that the conversion rate is typically
between 70 and 90 percent. Based on these rates, between 133 and 172 dwellings would
have been constructed on average per year.
In the last three years (2009-2011), residential building consents have fallen, reflecting the
tightened circumstances following the Global Financial Crisis (GFC). The average number
of dwellings consented over this period was 148 dwellings per annum, suggesting between
104 and 134 dwellings being constructed per year. Within the timeframe of this project,
however, we have been unable to confirm what proportion of these consents manifested as
completed dwellings, but the conversion rate could have been lower than the typical rate.
11 Report to Upper Hutt City Council Upper Hutt City Demographics and Housing Demand
January 2012
The Council’s 2007 Urban Growth Strategy (UGS) indicates that supply, allowing for
changes in urban form, would be in the range of 2,100 dwellings between 2006 and 2026.
This excludes new greenfields developments such as Maymorn.12
The UGS indicates the
potential trend in the supply of housing in the future, with the addition of about 105 dwellings
per annum. This level is at the lower end of the range of consented dwellings that are likely
to have been converted to actual dwellings, noted above.
The trend indicated in the UGS is broadly in line with the recent trend in the number of
consents and likely completions of new dwellings. Based on the forecast trend, this would
suggest an increase in the supply of housing of 1,575 dwellings by 2021 and 2,625 by 2031.
2.7 Assessment of housing supply and demand
We estimate Upper Hutt City will require 3,900 additional dwellings by 2021 and 5,945 by
2031. Given the potential supply of 1,575 dwellings by 2021 and 2,625 by 2031 this
indicates that there will be an undersupply of housing (under the “high” growth scenario).
We calculate that this gap will be around 2,325 dwellings by 2021 and 3,320 by 2031.
Under the “medium” growth scenario, we estimate Upper Hutt City will require 2,440
additional dwellings by 2021 and 3,045 by 2031. Given the potential supply of dwellings,
noted above, this indicates a housing supply gap of 865 dwellings by 2021 and 450 by 2031.
BERL does not recommend the Council should plan based on the medium scenario.
The projected housing supply gap, based on the projections and assumptions outlined
above, suggests that there is sufficient demand to justify the development of Maymorn as
part of the solution to accommodating the increased housing needs of Upper Hutt City. In
the event this project does not proceed as planned, development may relocate elsewhere in
the region, or UHCC may be able to identify other locations for this growth. BERL has not
evaluated or taken a position of the strategic merit of this.
The estimates of housing demand are based on Statistics New Zealand’s “high” growth
scenario. However, they are not inconsistent with the City’s growth patterns over the past
decade. Looking forward, the economy of the City and country as a whole are projected to
continue to grow over the next 20 years, despite the recent downturn due to the GFC. As
such, there will be a rising demand for labour, and therefore population growth will likely
continue, and over the long term that supports the use of the “high” growth scenario rather
than the “medium” growth scenario where the City’s population growth is stagnant.
12 We understand that the Council may have recently reduced this figure following a reassessment of capacity in the
Riverstone Terraces development. We have not quantified or incorporated this adjustment in this report.
12 Report to Upper Hutt City Council Upper Hutt City Demographics and Housing Demand
January 2012
3 Appendices
3.1 Sensitivity Analysis
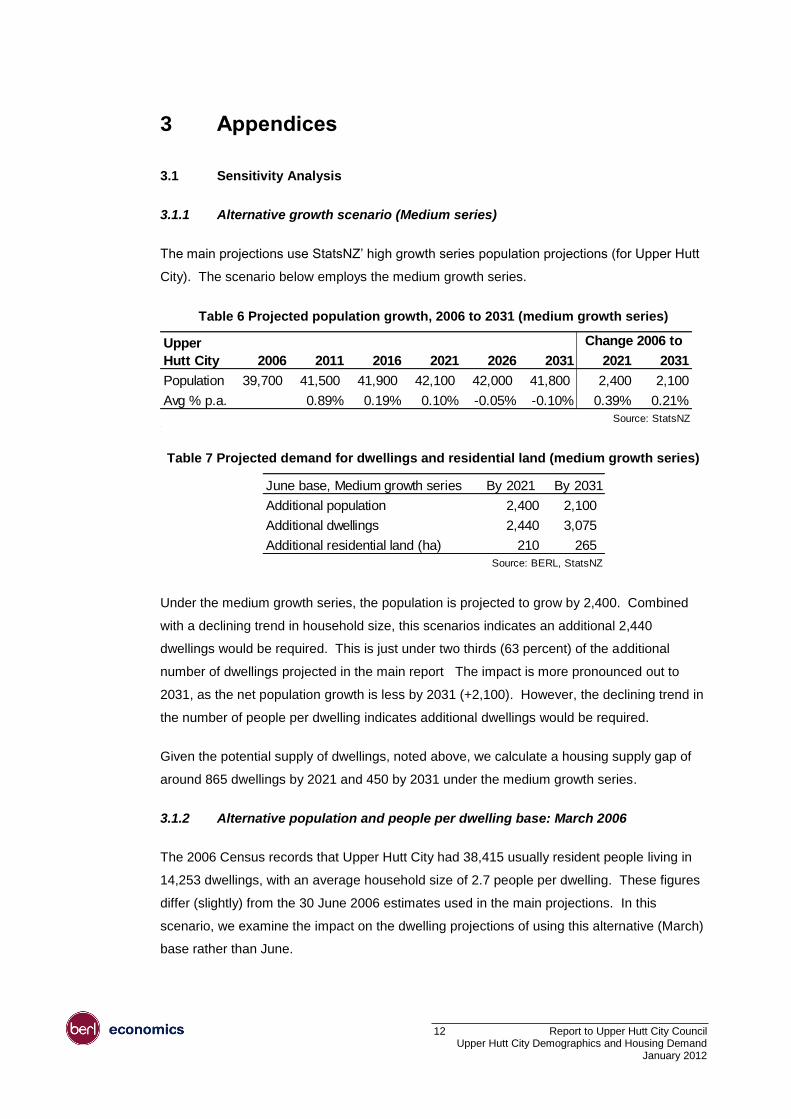
3.1.1 Alternative growth scenario (Medium series)
The main projections use StatsNZ’ high growth series population projections (for Upper Hutt
City). The scenario below employs the medium growth series.
Table 6 Projected population growth, 2006 to 2031 (medium growth series)
Table 7 Projected demand for dwellings and residential land (medium growth series)
Under the medium growth series, the population is projected to grow by 2,400. Combined
with a declining trend in household size, this scenarios indicates an additional 2,440
dwellings would be required. This is just under two thirds (63 percent) of the additional
number of dwellings projected in the main report The impact is more pronounced out to
2031, as the net population growth is less by 2031 (+2,100). However, the declining trend in
the number of people per dwelling indicates additional dwellings would be required.
Given the potential supply of dwellings, noted above, we calculate a housing supply gap of
around 865 dwellings by 2021 and 450 by 2031 under the medium growth series.
3.1.2 Alternative population and people per dwelling base: March 2006
The 2006 Census records that Upper Hutt City had 38,415 usually resident people living in
14,253 dwellings, with an average household size of 2.7 people per dwelling. These figures
differ (slightly) from the 30 June 2006 estimates used in the main projections. In this
scenario, we examine the impact on the dwelling projections of using this alternative (March)
base rather than June.
2006 2011 2016 2021 2026 2031 2021 2031
Population 39,700 41,500 41,900 42,100 42,000 41,800 2,400 2,100
Avg % p.a. 0.89% 0.19% 0.10% -0.05% -0.10% 0.39% 0.21%
Source: StatsNZ
Upper
Hutt City
Change 2006 to
June base, Medium growth series By 2021 By 2031
Additional population 2,400 2,100
Additional dwellings 2,440 3,075
Additional residential land (ha) 210 265
Source: BERL, StatsNZ
13 Report to Upper Hutt City Council Upper Hutt City Demographics and Housing Demand
January 2012
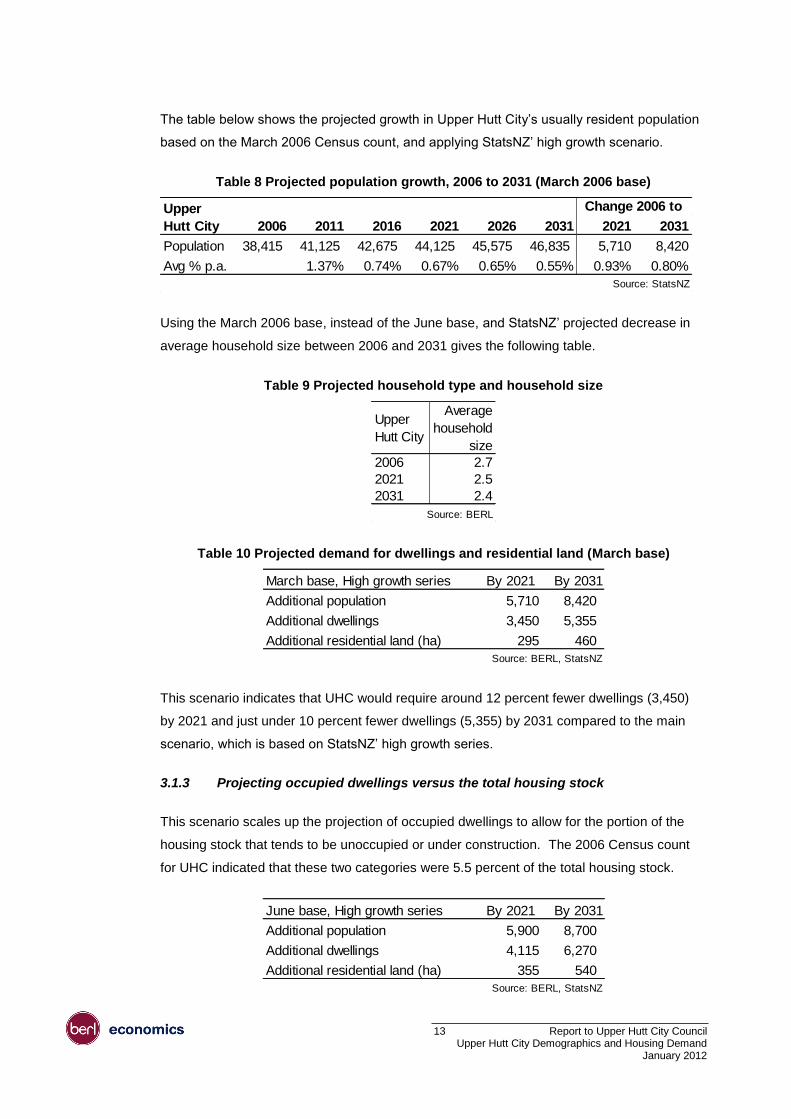
The table below shows the projected growth in Upper Hutt City’s usually resident population
based on the March 2006 Census count, and applying StatsNZ’ high growth scenario.
Table 8 Projected population growth, 2006 to 2031 (March 2006 base)
Using the March 2006 base, instead of the June base, and StatsNZ’ projected decrease in
average household size between 2006 and 2031 gives the following table.
Table 9 Projected household type and household size
Table 10 Projected demand for dwellings and residential land (March base)
This scenario indicates that UHC would require around 12 percent fewer dwellings (3,450)
by 2021 and just under 10 percent fewer dwellings (5,355) by 2031 compared to the main
scenario, which is based on StatsNZ’ high growth series.
3.1.3 Projecting occupied dwellings versus the total housing stock
This scenario scales up the projection of occupied dwellings to allow for the portion of the
housing stock that tends to be unoccupied or under construction. The 2006 Census count
for UHC indicated that these two categories were 5.5 percent of the total housing stock.
2006 2011 2016 2021 2026 2031 2021 2031
Population 38,415 41,125 42,675 44,125 45,575 46,835 5,710 8,420
Avg % p.a. 1.37% 0.74% 0.67% 0.65% 0.55% 0.93% 0.80%
Source: StatsNZ
Upper
Hutt City
Change 2006 to
Upper
Hutt City
Average
household
size
2006 2.7
2021 2.5
2031 2.4
Source: BERL
March base, High growth series By 2021 By 2031
Additional population 5,710 8,420
Additional dwellings 3,450 5,355
Additional residential land (ha) 295 460
Source: BERL, StatsNZ
June base, High growth series By 2021 By 2031
Additional population 5,900 8,700
Additional dwellings 4,115 6,270
Additional residential land (ha) 355 540
Source: BERL, StatsNZ

14 Report to Upper Hutt City Council Upper Hutt City Demographics and Housing Demand
January 2012
This scenario requires 4,115 dwellings (i.e. 5.5 percent more) by 2021 and 6,270 by 2031
compared to the main scenario. This would indicate a housing supply gap, under the “high”
growth scenario and per the UGS trend in housing supply, of around 2,540 dwellings by
2021 and 3,645 by 2031.
3.2 The Riverstone Terraces property development
To illustrate housing demand in relation to new developments in Upper Hutt City, we
consider a recent major property development in Upper Hutt: Riverstone Terraces.
The figure below charts the rise in capital values in this suburb by land use. The figure
indicates that there has been high demand for this new development.
Figure 6 Riverstone Terraces property value by use (Quotable Value New Zealand)
The 2007 to 2008 spike will - to some degree - reflect the general property boom prior to the
global financial crisis. But it is worth noting that these properties were in demand, and that
residential property values in that area continued to rise in 2009 while the more general trend
was flat or falling. For example, in Urban Upper Hutt City property values rose by an
average of 1.2 percent in 2009, while in Riverstone Terraces the increase was 4.8 percent.
15 Report to Upper Hutt City Council Upper Hutt City Demographics and Housing Demand
January 2012
3.3 Implications of an aging population for the projections
StatsNZ’s sub-national population projections for Upper Hutt City show a decline in average
household size between 2006 and 2031 (from 2.6 to 2.3 people per household). This
decline reflects a number of influences, including increases in life expectancy and changes
in living arrangements. As such, our assessment of housing demand implicitly allows for an
aging population and consequent changes in living arrangements.
The projection methodology and assumptions for StatsNZ’s national and subnational family
and household projections can be found in the technical notes.13
Below, we summarise
aspects of the methodology relevant to the implications of an aging population. This is
based on the projection technical notes and information provided by the Population Statistics
Unit of Statistics New Zealand.
The impact of an aging population on the demand for housing depends – amongst other
things – on the size of this population group and the proportion of this group living in private
versus non-private dwellings. Elder care facilities are non-private dwellings, and residents of
such dwellings are not counted as households.14
The household projections are derived by applying living arrangement type rates (LATRs) to
the population by age and sex. As such, an increase in the number of people living in elder
care facilities would be a suppressing influence on the projected number of households (and
thus the demand for private housing).
However, the national projections assume:
increases in life expectancy
declines in morbidity rates
increasing rates of the 'Partner in couple-without-children family' LATRs for the older
ages, that is, more couples surviving to older ages
increasing rates of the 'Person in one-person household' LATRs for older males, due to
life expectancy improvements.
These influences result in decreasing non-private dwelling LATRs at older ages. That is,
although an aging population would increase the number of people in elder care facilities, a
smaller proportion of older age people are projected to live in such facilities. Thus, the
projections incorporate a rising proportion of older age people remaining in private dwellings.
13 Links to: National Family and Household Projections - Technical Notes and Subnational Family and Household
Projections - Technical Notes.
14 A household consists of either one person usually living alone, or two or more people usually living together and
sharing facilities (for example, eating facilities, cooking facilities, bathroom and toilet facilities, a living area), in a private dwelling.
16 Report to Upper Hutt City Council Upper Hutt City Demographics and Housing Demand
January 2012
3.4 Implications of Rimutaka Prison for the projections
Rimutaka Prison is located south of Trentham Racecourse. The population of this institution
is potentially counted as part of Upper Hutt City’s population. Below we briefly assess the
implications of this measurement issue for the projections.
Statistics New Zealand records a prison's population within the area unit it is located in, and
in the Census if an inmate writes this in as their usual residence. This raises two questions
for the projections that we consider below.
Does including prisoners in the base and projected population affect the additional
number of private dwellings required?
Does the prison population affect the average household size in Upper Hutt City?
We begin by noting that neither of these issues is likely to significantly impact on the
projected additional demand for dwellings.
First, residents of Rimutaka Prison are not counted as households as they do not live in
private dwellings. As such they do not affect the base number of households, the number of
occupied private dwellings, or the average household size.
Second, Statistics New Zealand’s projections assume that a prison's population will remain
constant. Therefore, the projected growth in Upper Hutt City’s population would be for non-
institutionalised people who require dwellings. In practical terms, the prison population is
also constrained by the facility’s capacity. As at 13 December 2011, Rimutaka Prison had
748 prisoners, with an operating capacity of 932; the maximum operating capacity (permitted
upper limit) is 1,002. The Department of Corrections advises that it has no plans to add
capacity at this stage.
Therefore, the projections of additional dwellings are unlikely to be significantly influenced by
the appearance of the prison population in the base population count.

17 Report to Upper Hutt City Council Upper Hutt City Demographics and Housing Demand
January 2012
All work is done, and services rendered at the request of, and for the purposes of the client only. Neither BERL nor
any of its employees accepts any responsibility on any grounds whatsoever, including negligence, to any other
person.
While every effort is made by BERL to ensure that the information, opinions and forecasts provided to the client are
accurate and reliable, BERL shall not be liable for any adverse consequences of the client’s decisions made in
reliance of any report provided by BERL, nor shall BERL be held to have given or implied any warranty as to
whether any report provided by BERL will assist in the performance of the client’s functions.