analysis of different gridding methods using “surfer7” · introduction • surfer 7; feb. 2000...
TRANSCRIPT
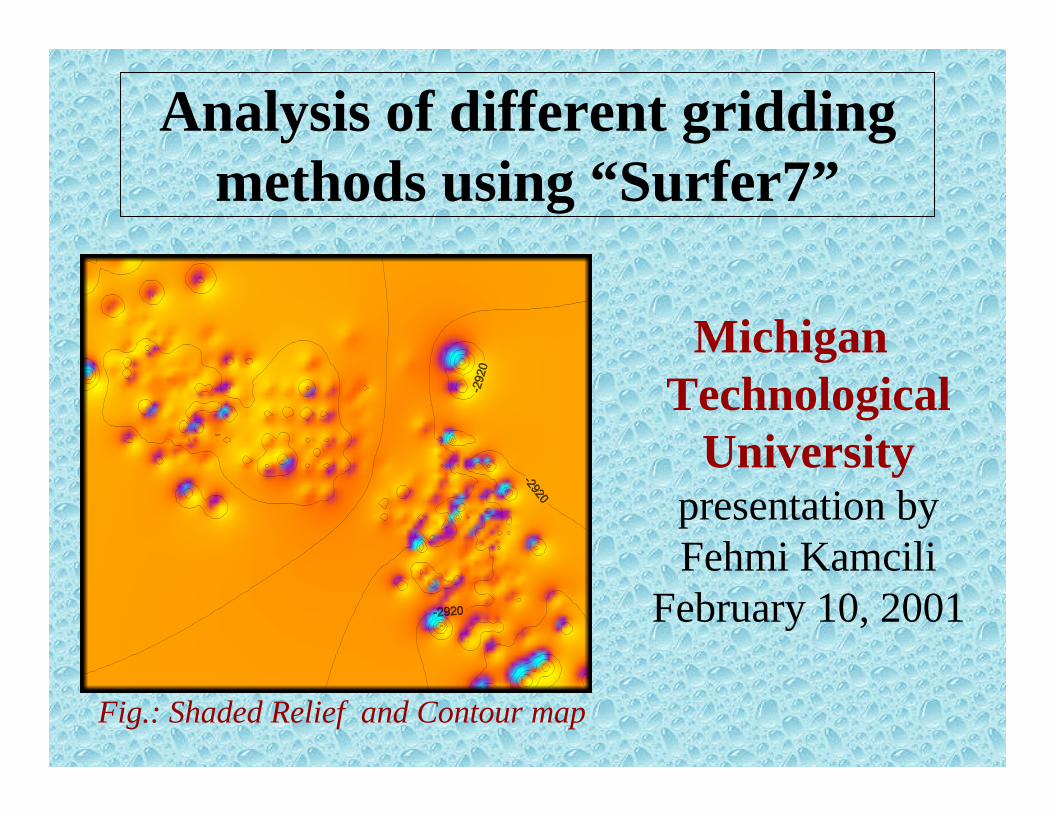
Analysis of different griddingmethods using “Surfer7”
MichiganTechnological
Universitypresentation byFehmi Kamcili
February 10, 2001
Fig.: Shaded Relief and Contour map
Analysis of different griddingmethods using “Surfer7”
Table of content
• Introduction• Grid Files• Grid Methods
1. Inverse Distance to a Power; 2. Kriging;3. Minimum Curvature; 4. Modified Shepard’s Method;5. Natural Neighbor; 6. Nearest Neighbor;7. Polynomial Regression; 8. Radial Basis Function;9. Triangulation w/ linear Interpolation
• Best Results• Conclusion

Introduction
• Surfer 7; Feb. 2000Surface mapping systemGolden Software, Inc.
• Differences in createdgrid-files visualized byoverlaying wireframeand contour mapsFig.: Wireframe and Contour Map
• Vernon/Rosebuch oilfields in Isabella county, Michiganwith 245 well Data-Points (Lat-Long of Top Dundee)
Analysis of different griddingmethods using “Surfer7”

Grid Files
• gridding by specifingsource file-Spreadsheets (Excel)-manually in Surfer (Worksheet)
• gridding method
• accuracy of grid
• faults and breaklines
• creates “file.grd”Fig.: Contour and Post Map
Analysis of different griddingmethods using “Surfer7”

Grid Methods
• Inv. Distance to power
• Kriging
• Minimum curvature
• Modified shepard’s
• Natural neighbor
• Nearest neighbor
• Polynomial regression
• Radial basis function
• Triangulation w/ linearinterpolation
Fig.: Wireframe Map
Analysis of different griddingmethods using “Surfer7”
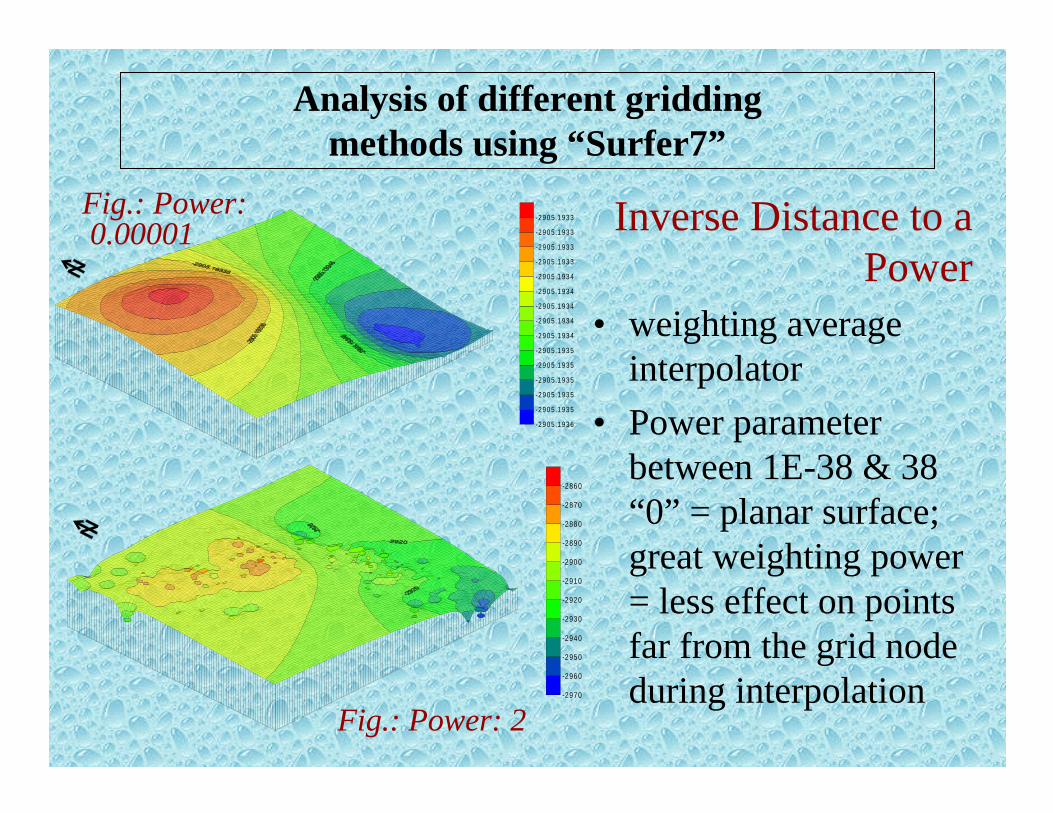
Inverse Distance to aPower
• weighting averageinterpolator
• Power parameterbetween 1E-38 & 38“0” = planar surface;great weighting power= less effect on pointsfar from the grid nodeduring interpolation
-2905.1936
-2905.1935
-2905.1935
-2905.1935
-2905.1935
-2905.1935
-2905.1934
-2905.1934
-2905.1934
-2905.1934
-2905.1934
-2905.1933
-2905.1933
-2905.1933
-2905.1933
-2970
-2960
-2950
-2940
-2930
-2920
-2910
-2900
-2890
-2880
-2870
-2860
Fig.: Power: 0.00001
Fig.: Power: 2
Analysis of different griddingmethods using “Surfer7”
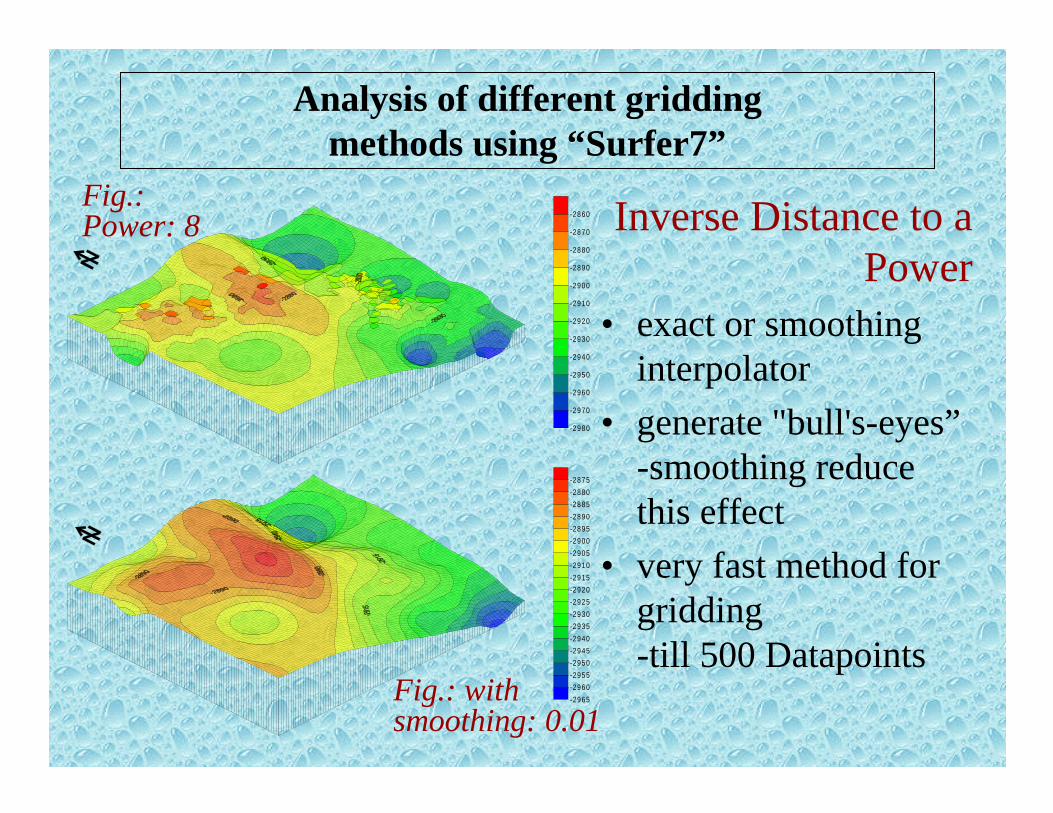
Inverse Distance to aPower
• exact or smoothinginterpolator
• generate "bull's-eyes”-smoothing reducethis effect
• very fast method forgridding-till 500 Datapoints
Fig.: withsmoothing: 0.01
-2980
-2970
-2960
-2950
-2940
-2930
-2920
-2910
-2900
-2890
-2880
-2870
-2860Fig.:Power: 8
-2965
-2960
-2955
-2950
-2945
-2940
-2935
-2930
-2925
-2920
-2915
-2910
-2905
-2900
-2895
-2890
-2885
-2880
-2875
Analysis of different griddingmethods using “Surfer7”

Kriging
• express trendssuggested in your data
• Point or Block-Block is usingaverage values-smoother; not perfect
• specify & add asmany variogram-components as wished
-298 0
-297 0
-296 0
-295 0
-294 0
-293 0
-292 0
-291 0
-290 0
-289 0
-288 0
-287 0
-286 0
Fig.: Point Kriging
• by entering path & filename production estimatedstandard deviation grid
Analysis of different griddingmethods using “Surfer7”

Minimum Curvature
• smooth but not exact
• recalculation of gridnode values untilreached less of max.Residual value, ormax. Iteration
• Set Internal andBoundary Tension
• Relaxiation Factor
-31 6 0
-31 4 0
-31 2 0
-31 0 0
-30 8 0
-30 6 0
-30 4 0
-30 2 0
-30 0 0
-29 8 0
-29 6 0
-29 4 0
-29 2 0
-29 0 0
-28 8 0
-28 6 0
Fig.: default
Analysis of different griddingmethods using “Surfer7”

Modified Shepard’sMethod
• Like IDP Method
• exact or smoothing
• Weighting andQuadratic Neighborsparameters specifiessize (number) of localneighborhood
• Fig.1: Q13/W19;Fig.2: Q40/W60
-3300
-3250
-3200
-3150
-3100
-3050
-3000
-2950
-2900
-2850
-2800
-34 00
-33 50
-33 00
-32 50
-32 00
-31 50
-31 00
-30 50
-30 00
-29 50
-29 00
Fig.: 1
Fig.: 2
Analysis of different griddingmethods using “Surfer7”
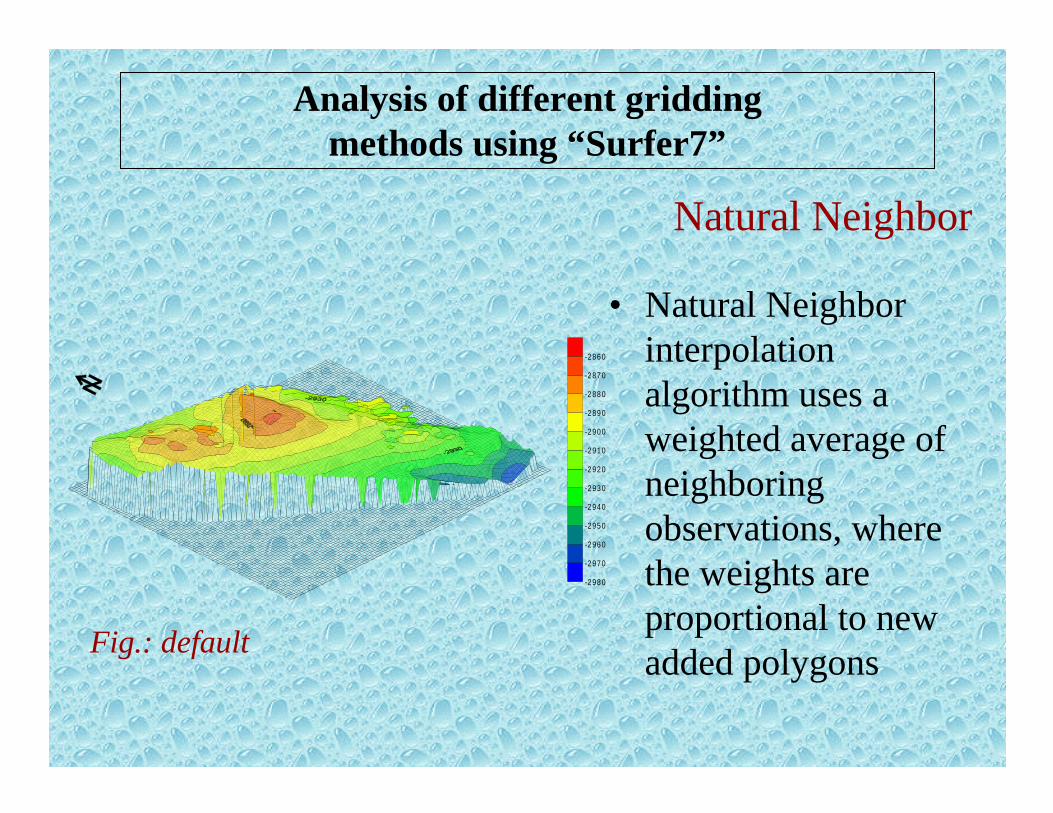
Natural Neighbor
• Natural Neighborinterpolationalgorithm uses aweighted average ofneighboringobservations, wherethe weights areproportional to newadded polygons
-2 98 0
-2 97 0
-2 96 0
-2 95 0
-2 94 0
-2 93 0
-2 92 0
-2 91 0
-2 90 0
-2 89 0
-2 88 0
-2 87 0
-2 86 0
Fig.: default
Analysis of different griddingmethods using “Surfer7”

Nearest Neighbor
• assigns value of thenearest point to eachgrid node
• useful when data arealready evenlyspaced
• this method iseffective for fillingmissing values
-2 98 0
-2 97 0
-2 96 0
-2 95 0
-2 94 0
-2 93 0
-2 92 0
-2 91 0
-2 90 0
-2 89 0
-2 88 0
-2 87 0
-2 86 0
Fig.: default
Analysis of different griddingmethods using “Surfer7”
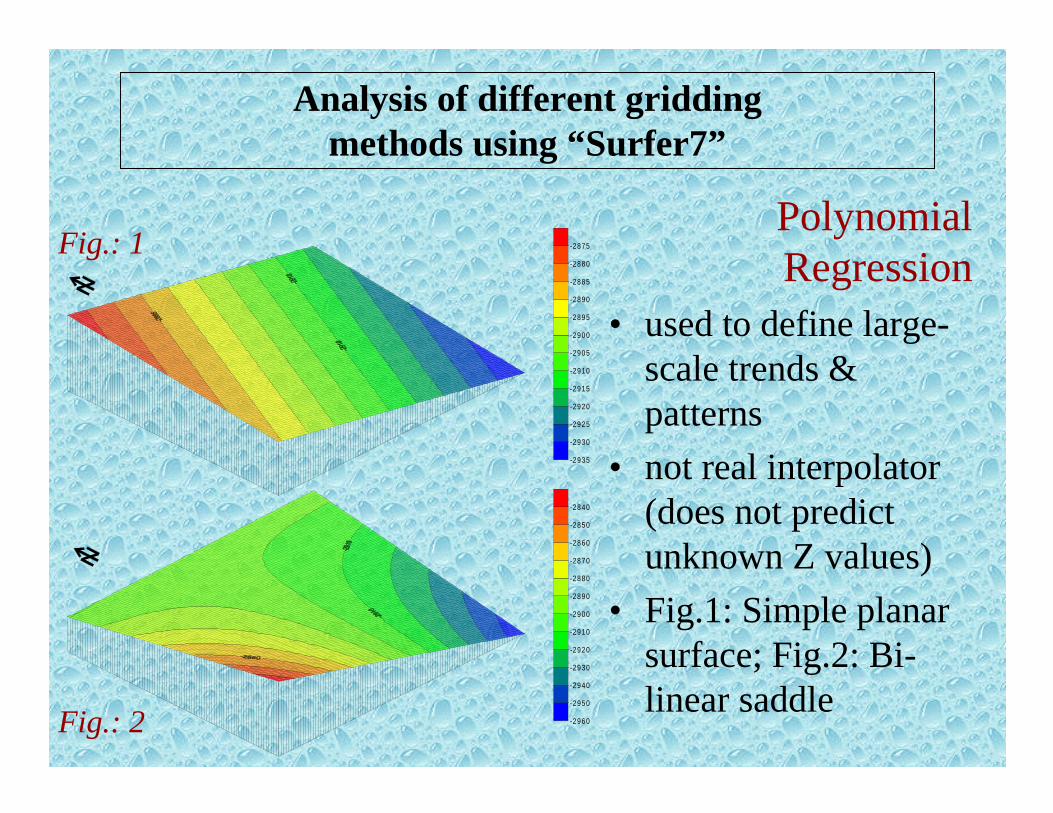
PolynomialRegression
• used to define large-scale trends &patterns
• not real interpolator(does not predictunknown Z values)
• Fig.1: Simple planarsurface; Fig.2: Bi-linear saddle
-2935
-2930
-2925
-2920
-2915
-2910
-2905
-2900
-2895
-2890
-2885
-2880
-2875
-2960
-2950
-2940
-2930
-2920
-2910
-2900
-2890
-2880
-2870
-2860
-2850
-2840
Fig.: 1
Fig.: 2
Analysis of different griddingmethods using “Surfer7”
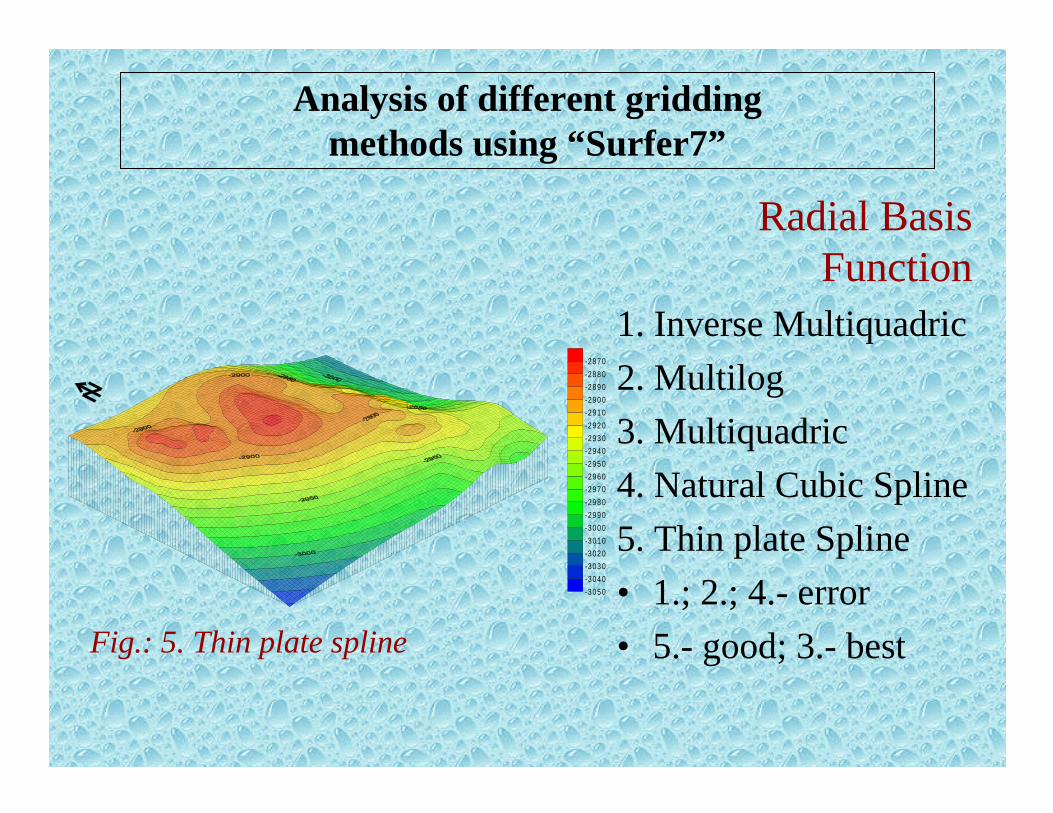
Radial BasisFunction
1. Inverse Multiquadric
2. Multilog
3. Multiquadric
4. Natural Cubic Spline
5. Thin plate Spline
• 1.; 2.; 4.- error
• 5.- good; 3.- best
-305 0
-304 0
-303 0
-302 0
-301 0
-300 0
-299 0
-298 0
-297 0
-296 0
-295 0
-294 0
-293 0
-292 0
-291 0
-290 0
-289 0
-288 0
-287 0
Fig.: 5. Thin plate spline
Analysis of different griddingmethods using “Surfer7”
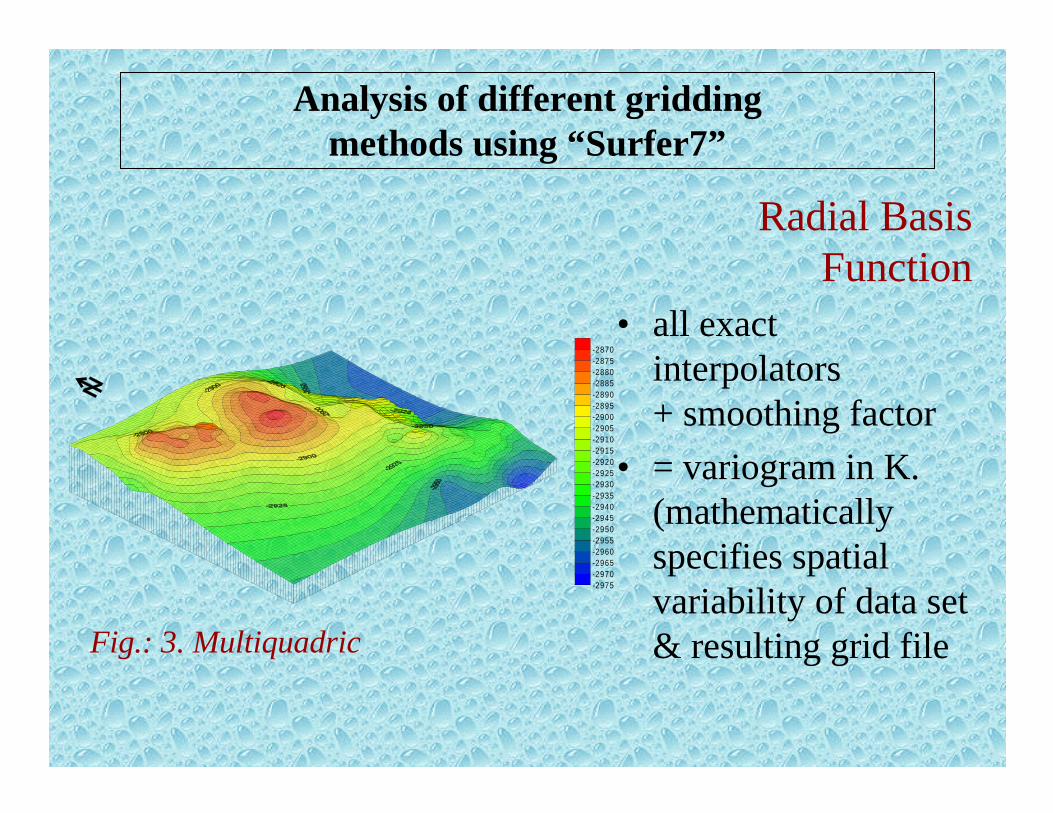
Radial BasisFunction
• all exactinterpolators+ smoothing factor
• = variogram in K.(mathematicallyspecifies spatialvariability of data set& resulting grid fileFig.: 3. Multiquadric
-2975-2970-2965-2960-2955-2950-2945-2940-2935-2930-2925-2920-2915-2910-2905-2900-2895-2890-2885-2880-2875-2870
Analysis of different griddingmethods using “Surfer7”

Triangulation w/linear Interpolation
• creates triangles bydrawing linesbetween data points
• exact interpolator
• for evenly distributeddata over grid area-sparse areas result indistinct triangularfacets on map
-29 80
-29 70
-29 60
-29 50
-29 40
-29 30
-29 20
-29 10
-29 00
-28 90
-28 80
-28 70
-28 60
Fig.: default
Analysis of different griddingmethods using “Surfer7”
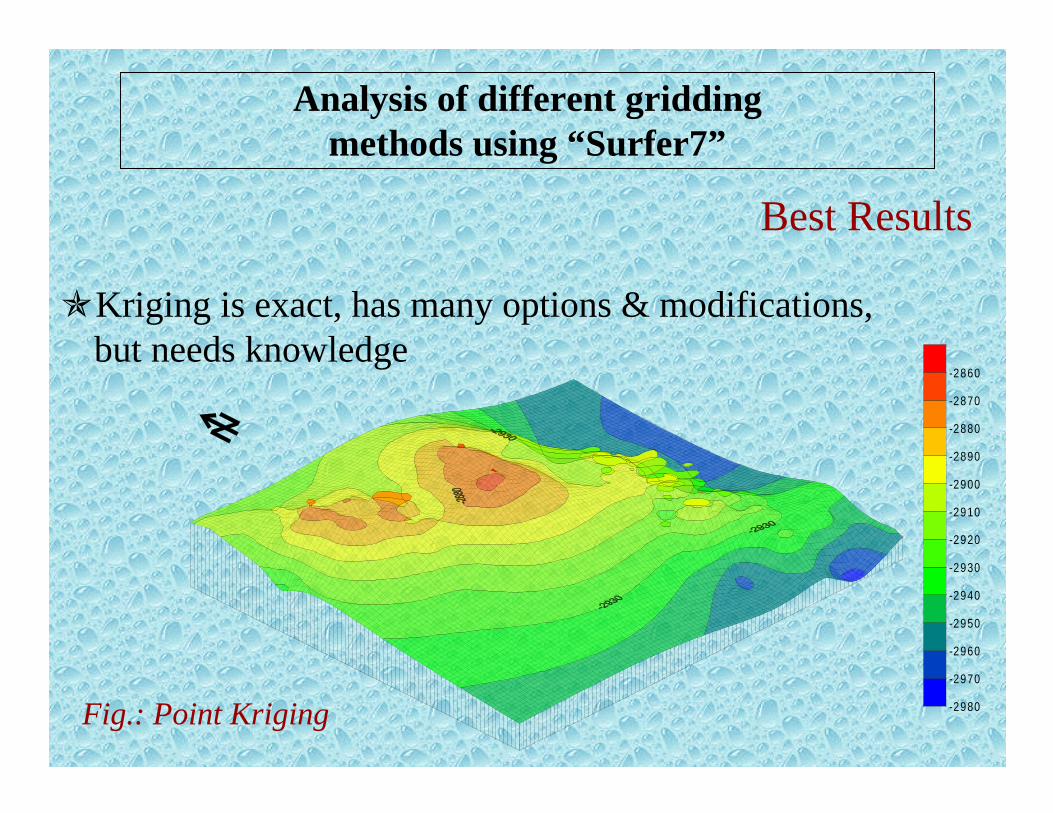
Best Results
zKriging is exact, has many options & modifications,but needs knowledge
-2980
-2970
-2960
-2950
-2940
-2930
-2920
-2910
-2900
-2890
-2880
-2870
-2860
Fig.: Point Kriging
Analysis of different griddingmethods using “Surfer7”

Best Results
zRadial Basis Function is exact, shows nice views& is uncomplicated
Fig.: Radial BasicFunction; Multiquadric -2975
-2970-2965-2960-2955-2950-2945-2940-2935-2930-2925-2920-2915-2910-2905-2900-2895-2890-2885-2880-2875-2870
Analysis of different griddingmethods using “Surfer7”
Conclusion
• I did not consider all aspects & details
• Surfer is very powerful for the 3D-Visualization
• Surfer 7 works:-fast & without consuming much disk space-uncomplicated with Object manager
• All processes (gridding, mapping) can be automatedwith writing programs in Visual Basic
• Help content is very useful & describes also backgroundinformation
Analysis of different griddingmethods using “Surfer7”