analysis of differentially expressed...
TRANSCRIPT

Proteomic analysis of differentially expressed proteins in the heart following desflurane
preconditioning
Inaugural‐Dissertation
zur Erlangung des Doktorgrades der Mathematisch‐Naturwissenschaftlichen Fakultät
der Heinrich‐Heine‐Universität Düsseldorf
vorgelegt von
Nadine Dyballa aus Würselen
Düsseldorf, Mai 2010

ii
Aus der Klinik für Anästhesiologie des Universitätsklinikum Düsseldorf und dem Biologisch‐Medizinischen Forschungszentrum der Heinrich‐Heine Universität Düsseldorf Gedruckt mit der Genehmigung der Mathematisch‐Naturwissenschaftlichen Fakultät der Heinrich‐Heine‐Universität Düsseldorf Referent: Prof. Dr. William Martin Koreferent: Prof. Dr. Wolfgang Schlack Tag der mündlichen Prüfung: 14. Juli 2010

iii
Die besondere Leistung einer Doktorarbeit ist es, sein Projekt über so viele Jahre pflichtbewusst und gewissenhaft zu erledigen –
Tag ein, Tag aus, und manches Mal auch des Nachts.
Die besondere Ehre die mir dabei zuteil wurde, ist die, als Wissenschaftlerin Kompetenz bewiesen zu haben.

iv

v
Danksagung Mit großem Stolz habe ich die Verleihung meines Doktorgrades erlebt. Eine Vielzahl von Menschen hat mich auf diesem Weg dorthin begleitet. Diese Seite ist nur euch gewidmet.
Nicht zuletzt sondern zuallererst möchte ich mich bei meinen Eltern bedanken, die in jeglicher Hinsicht die Grundsteine für den Weg bis hierhin gelegt haben. Ohne ihre grenzenlose und uneingeschränkte Unterstützung könnte ich nicht in der Position sein, in der ich jetzt glücklicherweise bin. Sie waren immer für mich da und haben meine innere Ausgeglichenheit und Stärke aufgebaut.
In besonderem Maße danke ich meinem Freund und Verlobten Christian. Ich habe vieles unbewusst von ihm vorausgesetzt, was nicht immer selbstverständlich war. Vor allem in der Endphase hat er mir den Rücken freigehalten, meine schlechte Laune und meine Zeiten der überstrapazierten Nerven geduldet und immer ein offenes Ohr für mich gehabt.
Ein großer Dank geht an meinen Doktorvater Professor Wolfgang Schlack, bei dem ich stets Zuspruch für dieses Projekt erfahren habe. Von weiter Ferne hat er mich begleitet und mit hilfreichen Tipps und Anregungen unterstützt.
Bedanken möchte ich mich natürlich bei Professor William Martin, der trotz seines straffen Zeitplans bereit war, meine Doktorarbeit vor der Mathematisch‐Naturwissenschaftlichen Fakultät zu vertreten.
Einen erheblichen Beitrag zum Gelingen meiner Doktorarbeit hat Nina Hauck‐Weber geleistet, die mir in der Anfangsphase viele wertvolle Hinweise gegeben hat. Danke dafür, dass du dich fortwährend nach mir und meiner Arbeit erkundigt hast, und selbst am Ende der Doktorarbeit von Amsterdam aus stets als Ansprechpartnerin zur Verfügung standest.
Sabine Metzger, wie soll ich dir danken? Du hast nie ein Blatt vor dem Mund genommen, Kritik geübt und Verbesserungsvorschläge vorgebracht. Du standest mir moralisch immer zur Seite, hast mich in meiner Arbeit bestärkt wie kein anderer und mir dadurch ermöglicht, mich selbst zu verwirklichen. Du standest aber nicht nur mit deinem Fachwissen zur Seite, sondern bist mir nicht zuletzt auch durch private Gespräche zu einem wertvollen und freundschaftlichen Wegbegleiter geworden.
Zu meiner Doktorandenzeit gehörte aber auch das (Über)Leben im sozialen Laborgefüge – ich habe Viele kommen und gehen sehen: die Hartgesottenen Lars A., Mark H. und Axel K., „meine“ Zöglinge Christian S., Hendrik V., Schirin K., Paul R. und auch Axel M., die Frischlinge Florian F. und Jana K., und natürlich die Chaoten Vicky G. und Werner B.! Danke euch allen für die unvergessene Zeit, ihr habt meinen Charakter sehr geformt.
Weiterhin danke ich meinen Freund(inn)en, dass sie für die erforderliche Abwechslung sorgten. Es war nicht selbstverständlich von euch, meine Zeit im Schneckenhaus zu tolerieren.
Mein Dank gilt der Jürgen Manchot Stiftung, die sie sich finanziell an meinem Projekt beteiligte; und Katrin Henze, die sich freundlicherweise bereit erklärt hatte meine Doktorarbeit gegenzulesen.
Ein besonderes Wort des Dankes richte ich an Angelika Simons, die bis zuletzt im Promotionsbüro alle Hebel für den erfolgreichen Abschluss dieser Arbeit bewegt hatte.
Abschließend bedanke ich mich bei Allen herzlich für die zahlreichen Glückwünsche und anerkennenden Worte, die ich am 14. Juli 2010 nach meiner Verteidigung entgegen nehmen durfte. Tut mir leid, dass ich nicht länger mit euch feiern konnte…
Eure Nadine

vi

vii
Table of content
I. List of figures ................................................................................................ ix
II. List of tables .................................................................................................. x
III. Abbreviations ............................................................................................... xi
IV. Abstract ..................................................................................................... xiii
V. Declaration of originality ............................................................................ xvi
1 Introduction .................................................................................................. 1 1.1 The phenomenon of anesthetic preconditioning ..................................................... 2 1.1.1 What does not kill you makes you stronger ................................................................................................ 2 1.1.2 Cardioprotection using volatile anesthetics ................................................................................................ 4 1.1.3 Desflurane‐induced cardiac preconditioning .............................................................................................. 7
1.2 Cardiovascular proteomics ...................................................................................... 8 1.2.1 Brief history of proteomics ......................................................................................................................... 8 1.2.2 Methodological aspects of comparative proteomics .................................................................................. 9 1.2.3 The heart proteome .................................................................................................................................. 14 1.2.4 Cardiac preconditioning enters proteomics .............................................................................................. 15
1.3 Aim of the study .................................................................................................... 16
2 Material and Methods ................................................................................ 17 2.1 Animals ................................................................................................................. 18 2.1.1 Surgical preparation .................................................................................................................................. 18 2.1.2 Preconditioning protocol .......................................................................................................................... 18
2.2 Chemicals and equipment ..................................................................................... 20
2.3 Tissue homogenization and protein extraction ...................................................... 20 2.3.1 One‐step protein extraction in IEF‐buffer ................................................................................................. 21 2.3.2 Two‐step protein extraction in TCA/acetone ............................................................................................ 21 2.3.3 Physiological protein extraction followed by TCA/acetone precipitation ................................................. 22 2.3.4 Prefractionation of proteins with subsequent TCA/acetone precipitation ............................................... 22
2.4 Protein quantification ........................................................................................... 23
2.5 Two‐dimensional gel electrophoresis .................................................................... 23 2.5.1 Protein solubilization prior to IEF .............................................................................................................. 23 2.5.2 First dimension separation ....................................................................................................................... 25 2.5.3 Second dimension separation ................................................................................................................... 26
2.6 Protein staining ..................................................................................................... 27 2.6.1 Silver staining ............................................................................................................................................ 28 2.6.2 Colloidal Coomassie staining ..................................................................................................................... 28
viii
2.6.3 Pro Q Diamond Phosphoprotein stain ...................................................................................................... 29 2.7 Comparative 2‐DE image analysis .......................................................................... 29 2.7.1 Gel image analysis ..................................................................................................................................... 30 2.7.2 Evaluation of variability in dynamic protein expression ........................................................................... 31 2.7.3 Determining differential protein expression ............................................................................................. 33
2.8 Electrospray mass spectrometry ........................................................................... 33 2.8.1 Fundamentals in instrumentation ............................................................................................................. 33 2.8.2 Proteolytic digestion ................................................................................................................................. 35 2.8.3 Sample desalting ....................................................................................................................................... 36 2.8.4 Determining protein identity by ESI mass spectrometry .......................................................................... 36 2.8.5 MS data acquisition ................................................................................................................................... 38
3 Results ........................................................................................................ 39 3.1 Strategies for improving 2‐DE separation of cardiac tissue proteins ...................... 40 3.1.1 Impact of protein extraction protocol on 2‐DE pattern ............................................................................ 40 3.1.2 Protein pre‐fractionation enhances proteome coverage .......................................................................... 42 3.1.3 Optimal IEF depends on protein solubility ................................................................................................ 44 3.1.4 De‐streaking the alkaline proteome .......................................................................................................... 46 3.1.5 Summary ................................................................................................................................................... 51
3.2 Proteomic profiles of DES‐PC treated rat hearts .................................................... 52 3.2.1 Differential protein expression in the time course of DES‐PC ................................................................... 55 3.2.2 Mass spectrometry identification of altered proteins during DES‐PC ....................................................... 61 3.2.3 Time‐course of differentially expressed proteins during DES‐PC .............................................................. 63 3.2.4 Post‐translational modifications of protein spots in multiple pI variants ................................................. 66 3.2.5 Modulation of proteins differentially expressed during DES‐PC ............................................................... 70 3.2.6 Classifications of proteins involved in DES‐PC ........................................................................................... 72
4 Discussion ................................................................................................... 74 4.1 Better proteome characterization using optimized 2‐DE....................................... 76 4.1.1 Establishment of a fundamental protein extraction procedure ................................................................ 76 4.1.2 Improving proteome coverage by the use of overlapping subproteomes ................................................ 78 4.1.3 De‐streak business of basic proteins ......................................................................................................... 78
4.2 In search of proteins that cause cardioprotection by anesthetic‐preconditioning .. 80 4.2.1 Evaluation of intrinsic variability of 2‐DE in in vivo experiments .............................................................. 80 4.2.2 Implication of differentially expressed proteins for DES‐PC ..................................................................... 81 4.2.3 Proteome profiles during DES‐PC reveal different expression trends ....................................................... 89
4.3 Challenges in interpreting data from proteomic studies ........................................ 90
4.4 Conclusion ............................................................................................................ 92
5 Literature .................................................................................................... 93
6 Appendix .................................................................................................. 105 A. Supplementary data ........................................................................................... 106
B. Publications ........................................................................................................ 113

ix
I. List of figures Figure 1.1: Schematic illustration of IEF and SDS‐PAGE as part of 2‐DE. ........................................... 10 Figure 1.2: Histograms of pI distributions for predicted proteomes. ................................................ 12 Figure 1.3: Functions, processes and components in the human heart proteome. .......................... 14 Figure 2.1: Experimental protocol of DES‐PC. .................................................................................... 19 Figure 2.2: Evaluation of technical variability of 2‐DE by regression analysis. ................................... 32 Figure 2.3: Nomenclature of peptide fragmentation according to Roepstorff and Fohlmann. ......... 37 Figure 3.1: Efficiency of different protein extraction methods. ......................................................... 41 Figure 3.2: Comparison of protein spot resolution between different staining methods. ................ 42 Figure 3.3: Improving resolution in 2‐DE separation by the use of a pre‐fractionation protocol. ..... 43 Figure 3.4: Optimized 2‐DE gels of pre‐fractionated cardiac tissue samples in IPG pH 4‐7 strips. .... 45 Figure 3.5: Improved solubilization of alkaline proteins by the additon of thiourea and ASB‐14. .... 46 Figure 3.6: Poor resolution of basic proteins (pI>8) in 2‐DE gels. ...................................................... 47 Figure 3.7: Effect of application point during cup‐loading on proteome representation. ................. 47 Figure 3.8: Overcoming restricted sample cup loading capacities by repetitive refilling. ................. 48 Figure 3.9: Comparison of cup‐loading experiments in IPG 3‐10 and 6‐11 strips. ............................. 48 Figure 3.10: Spot de‐streaking by the use of HED. ............................................................................. 50 Figure 3.11: Optimized 2‐DE separation of basic proteins. ................................................................ 51 Figure 3.12: Frequency distribution of coefficient of variation in 2‐DE experiments. ....................... 55 Figure 3.13: Proteomic alterations in the rat heart evoked by DES‐PC in vivo. ................................. 56 Figure 3.14: Differentially expressed proteins in the detergent‐soluble fraction. ............................. 57 Figure 3.15: Differentially expressed proteins in the water‐soluble fraction. ................................... 58 Figure 3.16: Protein expression changes in the course of DES‐PC. .................................................... 65 Figure 3.17: Multiple pI spot variants of Aco‐2 and AST‐2 are not phosphorylated. ......................... 67 Figure 3.18: ESI‐MS spectrum of proteolytic peptides of Aco‐2. ....................................................... 68 Figure 3.19: De novo sequencing of the Aco‐2 peptide m/z 640.3434 [M+2H]2+. ............................. 70 Figure 3.20: Oxidized tryptophan‐containing peptides of Aco‐2 ....................................................... 70 Figure 3.21: Treatment‐dependent modulation of identified during DES‐PC. ................................... 71 Figure 3.22: Function and biological process of identified proteins. ................................................. 73 Figure 4.1: Preconditioning signaling in the early phase of cardioprotection. .................................. 82 Figure A.1: Optimal IEF separation by mix and matching buffer composition. ............................... 107 Figure A.2: MS/MS spectra of the doubly oxidized peptides of Aco‐2. ............................................ 112

x
II. List of tables Table 1.1: Proteomic studies investigating cardiac preconditioning. ................................................. 15 Table 2.1: IEF buffer compositions. .................................................................................................... 24 Table 2.2: Focusing conditions for running IPG strips. ....................................................................... 26 Table 3.1: Characteristics of spot sets calculated from replicate gels of control animals. ................. 53 Table 3.2: Gel‐to‐gel and sample‐to‐sample variations in 2‐DE gels. ................................................. 54 Table 3.3: Significant protein expression changes in the heart induced by DES‐PC. .......................... 59 Table 3.4: Identification of protein spots with abundance differences during DES‐PC. ..................... 61 Table A.1: Buffer combinations for improving protein solubility resolution during IEF. .................. 106 Table A.2: Amino acid sequences of differentially expressed proteins during DES‐PC. ................... 107 Table A.3: Amino acid sequence of succinyl CoA ligase. ................................................................... 109 Table A.4: Theoretical MS/MS fragmentation of doubly oxidized peptides of Aco‐2. ..................... 110

xi
III. Abbreviations
2‐DE two‐dimensional gel electrophoresis
aa amino acid
APC anesthetic preconditioning
ATP adenosine triphosphate
Ca2+ calcium
CABG coronary artery bypass graft
CHAPS 3‐[(3‐cholamidopropyl)dimethylammonio]‐1‐propanesulfonate
CPB cardiopulmonary bypass
DES‐PC desflurane‐induced preconditioning
dpi dots per inch
DTT dithiothreitol
ESI electrospray‐ionisation
g gravity
H+ proton
HED hydroxyethyldisulfide
IEF isoelectric focusing
IPC ischemic preconditioning
IR ischemia‐reperfusion
ISO‐PC isoflurane‐induced preconditioning
K+ Kalium
kDa kilodalton
MAC minimum alveolar concentration

xii
M+H protonated molecular ion
Mr relative molecular weight
MS mass spectrometry
m/z mass‐to‐charge ratio
Na2+ natrium
NAD nicotinamide adenine dinucleotide
NADH reduced nicotinamide adenine dinucleotide
PC preconditioning
RT room temperature
SDS‐PAGE sodium dodecyl sulfate polyacrylamide gel electrophoresis
SEVO‐PC sevoflurane‐induced preconditioning
OD optical density
TCA trichloroacetic acid
pI isoelectric point
V Volt
v/v volume per volume
w/v weight per volume
w/w weight per weight

xiii
IV. Abstract

xiv
Zusammenfassung (German version)
In den letzten 20 Jahren konnte gezeigt werden, dass eine Vielzahl pharmakologischer Substanzen die Fähigkeit besitzt das Herz gegen die Folgen eines Ischämie‐Reperfusionsschaden zu schützen. Interessanterweise können auch volatile Anästhetika, welche seit Jahrzehnten als Narkosemittel zum Einsatz kommen, eine solche pharmakologische Präkonditionierung hervorrufen. Während das Phänomen an sich gut beschrieben ist, sind die zugrunde liegenden Signalwege bislang noch nicht vollständig geklärt. Das Ziel der vorliegenden Arbeit war daher, die Kenntnisse auf proteinbiochemischer Ebene zu erweitern.
Mit Hilfe der zwei‐dimensionalen Gelelektrophorese und Massenspektrometrie wurde das kardiale Proteom Desfluran‐präkonditionierter und unbehandelter Ratten verglichen, wobei zunächst umfangreiche Optimierungsschritte zur Herstellung qualitativ hochwertige Trenngele durchgeführt wurden. Auf Grundlage dieser konnten letztlich 40 Proteinspots detektiert werden, welche im Verlauf der Desfluran‐Präkonditionierung (DES‐PC) auffällige Veränderungen aufwiesen (1.2‐fache Expressionsänderung; P<0.02 vs. Kontrolle).
Insgesamt wurden 12 Proteine massenspektrometrisch identifiziert, von denen elf in metabolischen Prozessen involviert sind. Die Liste der durch DES‐PC veränderten Proteine umfasst die Methylmalonat‐Semialdehyd Dehydrogenase, Aspartat‐Aminotransferase, die Ubiquinol‐Cytochrome c Reduktase, NADH‐Ubiquinon Oxidoreduktase und NADH Dehydrogenase Ubiquinon Flavoprotein, sowie die Carboanhydrase, Laktatdehydrogenase, Inorganische Pyrophosphatase und Aconitase. Das einzige nicht‐metabolische Protein war Serumalbumin. Auffällig war hierbei, dass alle Proteine außer der Aspartat‐Aminotransferase eine verringerte Expression aufwiesen. Dies lässt vermuten, dass DES‐PC eine repressive Wirkung auf metabolische Prozesse ausübt. In diesem Zusammenhang könnte ein reduzierter Energieverbrauch einen Adaptionsmechanismus an zukünftige Ischämie‐Reperfusionsschäden darstellen.
Während der vergleichenden Analyse fiel auf, dass post‐translationale Modifikationen eine entscheidende Rolle zu spielen scheinen. Einige der angesprochenen Proteine wiesen multiple pI Varianten auf, jedoch zeigten nicht alle Varianten eine Veränderung im Verlauf der DES‐PC. So scheint die Ubiquinol‐Cytochrome c Reduktase selektiv durch Proteinphosphorylierung beeinflusst zu werden, die Aconitase vor oxidativer Modifikation geschützt zu werden und die Aminotransferase‐2 verstärkt zu translozieren. Desweiteren wurden Albumin, NADH‐Ubiquinon Oxidoreduktase und Aminotransferase‐1 an veränderten Positionen im Gel nachgewiesen, möglicherweise aufgrund von Proteindegradation. Diese Hinweise deuten darauf hin dass DES‐PC bedingte Änderungen in der Proteinexpression zum Großteil durch post‐translationale Modifikationen vermittelt werden.

xv
Summary (English version) In the last 20 years it was shown that a group of structurally diverse pharmacological agents pre‐condition the heart toward ischemia‐reperfusion injury through a variety of biochemical mechanisms. Pharmacological preconditioning with volatile anesthetics emerged as effective cardioprotective intervention in a multitude of experimental settings, but the cellular and molecular mechanisms are still incompletely elucidated. The purpose of this study was to gain deeper insight into the underlying signaling pathways of anesthetic‐preconditioning on the protein level.
Using a proteomic approach, the combination of two‐dimensional gel electrophoresis (2‐DE) and mass spectrometry was applied to investigate differentially expressed proteins in the myocardial proteome of in vivo desflurane‐preconditioned rats. In an effort to overcome the limitations of 2‐DE separation and to substantially increase the overall proteome coverage, initial experiments were performed to refine protein extraction, solubility and resolution. Based on the comparative analysis of high‐resolution 2‐DE gels, 40 protein spots were found to be differentially expressed during desflurane preconditioning (DES‐PC) (1.2‐fold; P<0.02 vs. control).
Among the identified proteins, 11 out of 12 were involved in various metabolic processes. These include methylmalonate‐semialdehyde dehydrogenase and aspartate aminotransferase 1 and 2 (amino acid metabolism), NADH‐ubiquinone oxido‐reductase 75kDa subunit and ubiquinol‐cytochrome c reductase core protein 1 (electron transport chain), and carbonic anhydrase 1 and 2 (one‐carbon compound metabolism). Other metabolic proteins are associated with oxidative phosphorylation (NADH dehydrogenase ubiquinone flavoprotein 1), glycolysis (lactate‐dehydrogenase B), polyphosphate catabolism (inorganic pyrophosphatase 2) and the Krebs cycle (aconitase‐2). The only non‐metabolic active protein takes part in transport (albumin). Except for the aspartate aminotransferases, all proteins were down‐regulated indicating that the trigger phase of DES‐PC seems to be partially associated with a decrease in metabolic active enzymes. This in turn might evoke an adaptive mechanism of the heart to reduce energy dissipation under a subsequent condition of hypoxia like during ischemia.
A finding of note was that proteins represented in a spot chain (aminotransferase‐2 (AST‐2), aconitase‐2 (Aco‐2) and ubiquinol‐cytochrome c reductase core protein 1 (UQCRC1)) showed expression changes only for distinct pI variants, suggesting post‐translational modifications. AST‐2 seems to translocate during DES‐PC, Aco‐2 was demonstrated to circumvent oxidative modification, and UQCRC1 was found to be differentially phosphorylated. In addition, three proteins with altered molecular weight and pI significantly decreased in abundance (AST‐1, albumin and NADH‐ubiquinone oxido‐reductase 75 kDa subunit), possibly indicating reduced protein degradation in response to DES‐PC. These findings support the paradigm that protein modifications play a more important role in the triggering phase of preconditioning than cellular protein turnover.

xvi
V. Declaration of originality

xvii
Ich versichere an Eides statt, dass ich die hier vorgelegte Dissertation mit dem Titel
Proteomic analysis of differentially expressed proteins in the heart following
desflurane preconditioning
eigenständig und ohne unerlaubte Hilfe angefertigt habe. Es wurden keine
anderen als die angegebenen Hilfsmittel verwendet.
Die Dissertation wurde in vorgelegter oder in ähnlicher Form noch bei keiner
anderen Institution eingereicht. Ich habe bisher keine erfolglosen
Promotionsversuche unternommen.
Düsseldorf, Mai 2010
Nadine Dyballa


Proteomic analysis of differentially expressed
proteins in the heart following desflurane
preconditioning


Introduction 1
1 Introduction

2 Introduction
1.1 The phenomenon of anesthetic preconditioning
1.1.1 What does not kill you makes you stronger
The year 2009 was the bicentennial of Darwin's birthday, and the sesquicentennial
of publication of his book ‘The Origin of Species’. Darwin’s work, along with those
of many others both before and after him, laid the foundation for our increasingly
detailed understanding of the history and diversity of life. Although much has
changed in evolutionary biology over the past 150 years, Darwin’s insights
continue to play an important role. Survival of the fittest as a metaphor for "better
adapted for immediate, local environment" is strongly reflected in the
phenomenon of preconditioning. The term preconditioning describes the
remarkable ability of tissue with high energy consumption to adapt to stress by
changing its phenotype so that it becomes more resistant to a subsequent severe
insult. This means that as long as the damaging stimulus remains sublethal, the
tissue will emerge in a strengthened state to defend from further harm. According
to Darwin this process might have developed evolutionary to increase cell survival
within specialized tissues in response to temporal shortages of nutrient supply and
repetitive noxious stimuli.
The phenomenon of preconditioning was first described in a pioneering paper by
Murry and colleagues in 1986, discovering that brief episodes of coronary artery
occlusion (inducing sublethal ischemia) interspersed with 5‐minute periods of
reperfusion (restoration of blood flow) paradoxically resulted in 75% infarct size
reduction in dogs (101). The authors termed this myocardial adaptation ischemic
preconditioning (IPC), due to the fact that it is induced by repetitive periods of
subcritical ischemic events. Since then, IPC has been confirmed in almost all
species, including mouse, rat and rabbit (55, 89, 150), as well as domestic animals
like sheep and swine (14, 131), and indirectly in man (29, 33, 167). The
preconditioning phenomenon or reducing ischemic injury is established for the
heart as well as for a number of other organs including the brain, small intestine,
lung, liver and kidney (90, 109, 102, 79, 61). Besides direct preconditioning where
the target organ is exposed to brief ischemia prior to prolonged ischemia, remote
(inter organ) ischemic preconditioning was also shown to confer protection on
distant organs without direct stress to the organ (121).

Introduction 3
During the last two decades, extensive research has been conducted towards the
understanding of the mechanisms by which IPC possibly prevents myocardial
infarction in the experimental setting. A fundamental finding was that
preconditioning is associated with two forms of protection: a first window of
protection occurring immediately after the preconditioning stimulus accompanied
with a strong protection but just lasting approximately 2‐3 hours (73, 74), followed
12‐24 hours later by a second (delayed) window of protection that induces less
protection but lasts approximately 3 days (8, 80). Moreover, numerous
endogenous triggers, signaling pathways and mediators have been controversially
discussed, such as activation of adenosine, α‐adrenergic, opioid or bradykinin
receptors, signal transduction via protein kinase C, tyrosine kinases or mitogen‐
activated protein kinases, and induction of cardioprotection through opening of
ATP‐dependent potassium (KATP) channels or release of reactive oxygen species
(reviewed in (39)).
Besides gaining scientific knowledge, the ultimate goal of these investigations was
to mimic the preconditioned state and its benefits. A multitude of alternative
stressful stimuli, including oxidative (hypoxia), mechanical (stretch), electrical
(rapid pacing), chemical (ionic) and thermal (hypothermia) stressors can induce the
same early and late protective response in cardiac tissue (153, 139, 111, 95, 126).
But the probably best way to elicit protection will be the use of pharmacological
agents instead of stressors. Various therapeutic drugs have been identified to
evoke cardiac preconditioning, encompassing functions as G protein‐coupled
receptor agonists, KATP‐ channel openers, activators of PKC, and sodium/hydrogen
exchange inhibitors (reviewed in (31)). However, most of them are associated with
side‐effects such as occurrence of hypotension, arrhythmias or possible
carcinogenic effects. Besides these pharmacological treatments, volatile
anesthetics as another class of compounds have also been shown to reduce infarct
size to an extent similar to that observed following IPC. Their clinical use in
preconditioning therapies is particularly promising because of the long‐term
experience clinicians have in their administration as well as their favorable safety
profile.

4 Introduction
1.1.2 Cardioprotection using volatile anesthetics
1.1.2.1 Volatile anesthetics exhibit deeper properties
General anesthesia is administered each day to thousands of patients worldwide,
exhibiting the characteristic to induce unconsciousness, to relax the musculature
and to control pain. A large number of drugs are available to the modern
anesthetist to produce general anesthesia, from intravenously administered
hypnotics to halogenated vapors (volatile anesthetics) and gaseous agents such as
xenon. But the effect of anesthetics is not limited to the desired short‐term action
in the operating room to allow surgery on patients. Especially volatile anesthetics
have long been known to provide some protection against the effects of cardiac
ischemia and reperfusion. Already in 1969, infarct‐reducing properties were
reported for the volatile anesthetic halothane during myocardial ischemia in the
canine heart (142). Several other experimental studies further demonstrated that
pretreatment with volatile anesthetics improved left ventricular systolic function
(155), reduced dysrhythmias and improved contractile function (15), and
decreased myocardial oxygen utilization (16).
The cardioprotective mechanisms reported in these studies might result from the
cardiac depressant effect of volatile anesthetics which decreases myocardial
oxygen demand and thus may indirectly improve myocardial oxygen balance
during ischemia. But experimental research has clearly shown that volatile
anesthetics also directly protect from ischemic myocardial damage. In 1997, three
independent working groups provided first evidence that isoflurane directly
preconditions myocardium against infarction, and that cardioprotection was
conducted via activation of KATP channels (19, 71, 24). These findings suggest that
volatile anesthetics mimic the cardioprotective effect of IPC, and in turn led to the
adaption of the term anesthetic preconditioning (APC). Since then major interest
arose to study the preconditioning effect of anesthetics.
A large amount of data using in vitro studies and in vivo animal experiments has
been produced dealing with cardiac preconditioning by anesthetics. Today we
know that nearly all halogenated volatile anesthetics (halo‐, iso‐, sevo‐, des‐ and
enflurane) protect the ischemic myocardium by preconditioning. Our working
group actually could show that even the noble gas xenon induces cardioprotection
in a preconditioning manner (158). Multiple different intracellular signaling

Introduction 5
pathways have been investigated, encompassing triggers which initiate the
cardioprotective signal, mediators that forward the signal during ischemia and
end‐effectors that finally render the myocardium resistant to cell death. But in
contrast to the obvious cardioprotective effects reported from experimental
studies, the benefits of APC in clinical situations are still a matter of debate.
1.1.2.2 Anesthetic preconditioning versus myocardial infarction in man
Myocardial infarction is the clinical term for a heart attack and is caused by
occlusion of the coronary artery for example by a blood clot, resulting in the partial
or total blockage of one of the coronary arteries (myocardial ischemia). When this
occurs, the myocardium does not receive enough oxygen (ischemia‐injury). A mild
ischemia leads to first cellular dysfunction, but the heart muscle may recover its
original state. However, severe ischemia results in necrosis and finally causes
permanent damage as the heart muscle dies. When ischemia is stopped by the
restoration of blood flow, a second series of harmful events produce additional
reperfusion‐injury. Factors like older age, tobacco smoking, diabetes, high blood
pressure, obesity, chronic kidney disease, heart failure, excessive alcohol
consumption, the abuse of drugs, and chronic high stress levels additionally
enhance the risk for myocardial infarction (114). Ischemia‐reperfusion injuries are
thus a common complication in medicine even in non‐cardiac surgeries. It is
interesting to note that during non‐cardiac surgeries of patients with high risk of
myocardial infarction, the recent American College of Cardiology/American Heart
Association Guidelines recommend the use of volatile anesthetics for maintenance
of general anesthesia (44).
The most commonly used inhalational anesthetics are desflurane and sevoflurane,
which gradually replace isoflurane as the leading volatile for human use. Their
cardioprotective properties during coronary surgery were already revealed several
years ago (30). Recent data from a meta‐analysis of randomized clinical trials
indicated that the choice of the anesthetic regimen based on administration of
volatile anesthetics is associated with a better outcome after cardiac surgery (82).
But whereas the volatile anesthetics regimen continuously gains clinical evidence,
the phenomenon of APC remains controversial in cardiac surgery. Despite the fact
that the concept of APC offers the opportunity to improve the tolerance of the
myocardium to ischemia‐reperfusion events, like they are predictable in cardiac

6 Introduction
and vascular surgery, neurosurgery, and transplant surgery, its application remains
controversial.
The first study designed to assess the clinical relevance of APC investigated
isoflurane‐induced preconditioning in patients undergoing elective coronary artery
bypass graft (CABG) surgery. It was shown that administration of isoflurane (after
the onset of cardiopulmonary bypass (CPB) via a 5‐minute exposure to 2.5 MAC
isoflurane followed by a 10‐minute washout) before aortic cross‐clamping resulted
in less postoperative release of creatine kinase MB and troponin, both biomarkers
for acute myocardial infarction (11). So far, five clinical studies were designed to
verify the preconditioning properties of the new volatile anesthetics sevoflurane
and desflurane. In all cases, the cardioprotective effect was assessed by
biochemical markers in patients undergoing CABG. The first study demonstrated a
preconditioning effect for sevoflurane using 2 MAC administration during the first
10 minutes of CPB (63). Four years later, cardioprotective effects following
sevoflurane‐preconditioning were negated, using 1 MAC sevoflurane applied for
15 minutes followed by a 15 minutes washout before CPB (118). Sevoflurane‐
preconditioning in an interrupted manner (2x 1 MAC sevoflurane prebypass
interrupted by a 10‐minute washout phase) was then shown to be preferable
toward continuous administration (1 MAC sevoflurane until initiation of CPB) (10).
Recently, our working group underscores the important role of the cycles of the
preconditioning stimulus for the protective effect. Whereas a single sevoflurane
administration (5‐minute exposure of 1 MAC sevoflurane followed by 10 minutes
of washout) had no cardioprotective effect, two periods of sevoflurane
significantly reduced cellular damage (46). Concerning desflurane, only one study
exists that demonstrated evidence for preconditioning‐induced cardioprotection in
man (5 minute exposure of 2.5 MAC desflurane followed by 10 minute washout
during established CPB) (94).
The current results of clinical APC studies in cardiac surgery show highly variable
outcomes and fail to demonstrate a definite beneficial effect on post‐ischemic
myocardial performance (reviewed in (31)). This is mainly due to the fact that
there is still no consensus on the method of administration of volatile anesthetics
for myocardial preconditioning, including the time to begin administration, its
duration, the dosage, and selection of volatile anesthetics. This clearly

Introduction 7
demonstrates that much more (molecular) information is necessary to understand
the intracellular events responsible for APC.
1.1.3 Desflurane‐induced cardiac preconditioning
In the mid 90s the volatile anesthetics desflurane and sevoflurane were launched
onto the German market, featuring low blood‐gas partition coefficients which
allow a more rapid emergence from anesthesia than isoflurane does. Isoflurane is
still frequently used for veterinary anesthesia and is the best investigated
anesthetic in APC, accounting for nearly 50% of the articles published between
1997 and 2009. While sevoflurane‐induced preconditioning currently gains
popularity, less is known about cardiac protection by desflurane preconditioning.
Infarct‐limiting properties of desflurane were first described in 2000 (151). The
experimental design was rather a treatment study than a preconditioning study as
no memory phase before the index ischemia was embedded. Desflurane reduced
myocardial infarct size in dogs in vivo, and the results further suggested that both
sarcolemmal and mitochondrial KATP channels could be involved. This hypothesis
was confirmed to some extend in vitro (56). They further provided evidence that
stimulation of adenosine A1 receptor, α‐ and β‐adrenoreceptors are involved in
desflurane mediated cardioprotection. But again, myocardial tissue was only
exposed to desflurane and not in a classical preconditioning manner with memory
phase. The first desflurane‐preconditioning (DES‐PC) experiment was conducted in
2002, when comparing the potency of desflurane, sevoflurane, isoflurane and
halothane to induce preconditioning in the rabbit myocardium (117). In this study
(inhalation of the halogenated anesthetic for 30 minutes followed by a 15‐minute
washout phase), desflurane was the most effective agent at preconditioning the
myocardium against ischemia.
In the last six years, molecular pathways of DES‐PC were investigated by deducing
targets from already known signaling in IPC. In this context, our working group
showed in rodents that DES‐PC does not depend on tyrosine kinase activation (38),
but is mediated by protein kinase C (PKC) and extracellular‐regulated kinases (ERK)
through phosphorylation of PKC‐ɛ and ERK‐1/2 (152). Further in vivo studies
revealed that DES‐PC is mediated by nitric oxide and in parts by activation of
mitochondrial large‐conductance calcium‐activated K+‐channels via protein kinase
A (125, 141). Recently, DES‐PC induced cardioprotection was shown to be

8 Introduction
abolished by the specific β2‐adrenoreceptor blocker ICI 118,551 (84). In vitro
experiments provide evidence that DES‐PC protects isolated rat cardiomyocytes
from oxidative stress‐induced cell death via stimulation of reactive oxygen species
production (135). In summary, only fragments are known regarding the overall
alterations responsible for the progression of the preconditioning signal.
1.2 Cardiovascular proteomics
The social, economic and human costs of cardiovascular diseases continue to
escalate. Predicting cardiovascular risk on the one hand and designing new
prophylactic‐cardioprotective strategies on the other hand are therefore the main
challenges of modern cardiovascular medicine. Gene therapy has been
appreciated as the future of medicine but becomes subordinate as the Human
Genome Project has reinforced the importance of the study of proteins. Classical
approaches target candidate proteins as being potentially involved in the
pathology of cardiovascular disease and aim to test hypothesis‐based on
previously reported data. The application of proteomics to cardiovascular diseases
like ischemia‐reperfusion injury creates a renaissance that allows understanding
complex systems and pathologies at a global level.
1.2.1 Brief history of proteomics
Proteins are the final products manufactured in living cells according to the
blueprint contained in the genome, but were for a long time ignored to play a
major role in life due to the boom in genome research. However, soon after the
conclusion of the genome project most efforts in biochemical research were
focused on the study of “the protein complement of the genome”. But it was not
until 1994 that the former PhD student Marc Wilkins was looking for an alternative
to this phrase, and introduced the term proteomics at the first Siena 2‐D
Electrophoresis meeting.
In the beginning, proteomics implied the integrated study of the entire sum of all
proteins produced by an organism or cell or tissue, constricted to a defined time
point, particular condition and selected circumstance in order to set up a map of
the proteome. This concept of a global protein analysis to set up an inventory of

Introduction 9
proteins was already proposed 40 years ago (70). But progression in biochemical
technologies has created a renaissance toward understanding complex proteomes
at a global level, thus allowing an expanded experimental view. Most notably were
following three developments:
1. Improvements in protein separation techniques, especially regarding two‐
dimensional gel electrophoresis and high‐resolution liquid chromatography.
2. Refinements in mass spectrometry, in particular the implementation of the
soft ionization methods electrospray ionization and matrix‐assisted laser
desorption/ionization, which markedly enhanced the ability to analyze
biomolecules.
3. Development of bioinformatics tools such as databases that catalogue
sequences from large‐scale genome research, or search engines that query
these databases via the Internet.
Today the scope of proteomics encompasses the identification and quantification
of proteins, characterization of post‐translational modifications and protein‐
protein interaction, but is most commonly applied to comparative approaches.
1.2.2 Methodological aspects of comparative proteomics
In comparative proteomic approaches, the investigator does not preselect the
proteins to be examined, but makes use of high sensitive protein separation
technologies to search for changes in any proteins that occur in control‐case
studies. Two‐dimensional gel electrophoresis (2‐DE), mass spectrometry (MS) and
bioinformatics tools are still the key elements of comparative proteomics.
In the early 1970s, the pioneers of 2‐DE immediately recognized the potential use
of combining isoelectric focusing (IEF) with sodium dodecyl sulfate polyacrylamide
gel electrophoresis (SDS‐PAGE) to study multiple proteins at the same time (70).
Shortly after, O’Farrell and Klose independently adopted the 2‐DE technique for
the simultaneous analysis of cellular proteins (75, 106), and made the use of 2‐DE
gels an attractive method of protein separation. As the name implies, the system
separates proteins according to two distinct physicochemical properties, resulting
in high resolution power for sample separations.

10 Introduction
(A) First dimension separation
(B) Second dimension separation
Figure 1.1: Schematic illustration of IEF and SDS‐PAGE as part of 2‐DE. In a pH gradient and under the influence of an electric field, a protein will move to the position in the gradient where its net charge is zero. This is the focusing effect. (B) After IEF, SDS‐PAGE is used to separate the protein sample according to the molecular weight in the second dimension.
During the first dimension, IEF, proteins are separated on the basis of their ionic
character via an ampholyte pH gradient and are allowed to migrate to their
respective isoelectric points (pI) in the gel (Figure 1.1A). The pI is the specific pH at
which the net charge of the protein is zero. In the second dimension, the IEF gel is
subjected to a SDS‐PAGE gel, and proteins are separated on the basis of their
molecular weight (Figure 1.1B). This orthogonal separation results in a 2‐DE
pattern typically in form of protein spots where each spot potentially corresponds
to a single protein species in the sample. In the last 30 years, numerous
improvements finally led to its ability to display thousands of proteins
simultaneously and differentially, including refinements of ampholytic technology,
the introduction of a variety of staining methods, and the establishment of image
capture devices and image analysis software to finally represent the pattern of
2‐DE gels. Besides being currently the most powerful protein separation technique,
a comparative 2‐DE approach is only meaningful when the resolution and
reproducibility of the gels are high‐quality.

Introduction 11
1.2.2.1 The problem of proteomic coverage
The human catalog of protein‐coding genes was actually scaled down to only
20.500 rather than the 100.000–150.000 proteins we were once told to expect (3).
But the respective proteome is most complex due to alternative splicing and post‐
translational modifications. Subcellular localization and interaction partners
additionally influence protein abundances in the proteome so that the number of
proteins expressed at a given time under defined biological conditions is likely to
be in the range of 106 orders of magnitude for cells and tissues, ranging from
several million copies for high‐abundant proteins to a few copies for low‐abundant
proteins (27). Thus the principal goal for a global proteomic analysis of a complex
system like the heart is mandatory to elicit the maximum amount of information
on the investigated proteins.
In general, 10.000 proteins can be resolved on a large‐format (46 x 30 cm) 2‐DE gel
(76), but difficulties in handling such large gels plus the high consumption of
protein sample preclude their routine use for comparative analyses. In practice,
only a subset of the expressed proteins can be displayed by 2‐DE using standard
wide‐range gels (18 cm IPG strips pH 3‐10/ 20 x 20 cm SDS–PAGE gels). It is
therefore preferable to carry out pre‐fractionation steps to reduce sample
complexity to access all expressed proteins at once to the greatest possible extent.
In most instances it is even crucial to enrich and visualize low‐copy number
proteins. Depending on the chosen fractionation technique, utilizing properties of
protein classifications like subcellular localization, pI and/or Mr, solubility and
specific functional characteristics, additional information about the topology of the
proteins can be obtained.
A survey of the literature reveals that proteomic analyses are mostly performed
using pH 3‐10 and 4‐7 IPG gels for first dimension separation. On the contrary,
alkaline proteins (pI > 8) are infrequently analyzed even if they represent almost
50% of the total predicted proteome in organisms (Figure 1.2). This is due to the
fact that IEF of alkaline proteins still seems to be a challenging job because of
horizontal and vertical streaks, detergent smear and poor protein transfer from
the first to second dimension.

12 Introduction
(A) (B)
(C) (D)
Figure 1.2: Histograms of pI distributions for predicted proteomes. (A) Archaeoglobus fulgidus(Achaea, 2420 proteins); (B) Escherichia coli (bacteria, 4279 proteins); (C) Homo sapiens (animal, 27 941 proteins); (D) Oryza sativa (plant, 83 159 proteins). The multi‐modality character is demonstrated by pI values ranging from 3 to 13 with two main accumulations in the range from pI 4 to 7.8 and 7.9 to 10.5, and a third small peak around pI 11. [Figure modified from Wu et al., 2006 (164)].
The analysis of alkaline proteins is not a weakness of 2‐DE but rather implies a
“streak business” that can be overcome for the most part by different optimization
steps (49, 108, 50, 48, 59, 66). Strategies include:
• use of zoom‐range pH gradients
• anodic cup‐loading sample application
• shortening IEF duration
• addition of a DTT wick to replenish reducing agent at the cathode
• use of an alternative reducing agent such as organic disulfides.
All these improvements were mainly applied for setting up reference maps of
diverse organisms, carried out for S. melliferum (26), H. influenza (45), B. subtilis
(107), HeLa cells (54), human placental mitochondria (85), adipose tissue (28) and
colon crypt (87) as well as barley (5) and wheat seeds (21). The only comparative
proteome analyses that especially addressed basic proteins were conducted for
E.coli (154) and T.cruzi life forms of epimastigote and trypomastigote stages (92).
Reports on comparative 2‐DE analysis of cardiac proteomes have not focused on
basic proteins so far.

Introduction 13
1.2.2.2 Comparative quantification of protein species from gels
To analyze spot pattern the gels must be digitized, converting the raw pixel values
into optical density (OD). The algorithms of 2‐DE analysis software measure the
amount of protein present in each spot using the relative volume [%Vol.].
Measuring the protein quantification values this way has the advantage of being
more robust and reproducible when calculating protein expression variations.
Statistical analyses of the spot volumes between populations of gels allow
analyzing variations in protein expression among treatment groups. However,
when comparing five commercially available programs using 18 replicate gels of a
rat brain protein extract, the results demonstrated that an accurate, unbiased, and
rapid gel analysis is still a major bottleneck (22). For this reason, a careful
investigation of data reproducibility should be carried out to avoid
misinterpretation of protein expression changes.
1.2.2.3 Mass spectrometric protein identification
Although the technology to separate proteins by 2‐DE has existed since the 1970s,
the only methods available to identify the separated proteins at the time was N‐
terminal sequencing by Edman degradation or immunoblotting. Because the
Edman degradation proceeds from the N‐terminus of the protein it fails if the N‐
terminal amino acid has been modified due to post‐translational modifications.
Western blotting on the other hand is presumptive and requires the availability of
a suitable antibody, and the confidence of the identification can be limited by
problems with the specificity of the antibody. These limitations were overcome by
technical developments in mass spectrometry (MS) instrumentation in the 1990s.
With the introduction of ionization techniques suitable for biomolecules, the group
around Fenn (electrospray ionization, 1985), Tanaka and co‐workers (liquid matrix
method of laser desorption ionization, 1988) and Karas & Hillenkamp (crystalline
matrix‐assisted laser desorption/ionization, 1988) opened a new era in protein
analysis (68, 162, 147). In nowadays proteomics, the soft ionization techniques
electrospray ionization (ESI) and matrix‐assisted laser desorption/ionization
(MALDI) are the ionization techniques used for protein and peptide identification.

14 Introduction
1.2.3 The heart proteome
In the mid 90s, extensive research was conducted to generate 2‐DE databases for
heart proteins, with the aim to offer descriptive information accessible via the
World Wide Web. The databases “HP‐2DPAGE” (64), “HEART‐2DPAGE" (119) and
“HSC‐2DPAGE” (40) were established on the basis of human, rat, dog and mouse
ventricle proteins. New proteomics data have continuously been added to the
databases. At present, the proteome map of the human heart represents 2683
spots with about 400 identifications from 110 unique proteins (160). The identified
proteins were found to be associated with numerous types of processes, functions
and components. Interestingly, the vast majority of the proteins identified (from
the human heart left ventricle) are mitochondria‐associated and, surprisingly,
relatively few are associated with what would perhaps be expected for proteins
from the heart (such as muscle contraction, heart regulation, etc.). Figure 1.3
illustrates the “top ten” associations for the mentioned categories in the human
heart.
Function Process Components
Figure 1.3: Functions, processes and components in the human heart proteome. 110 left ventricle proteins were categorized into 97 types of process, 144 types of function and 54 types of component using Gene Ontologies (GO). Charts adapted from Westbrook et al. (2006).
The rodent 2‐DE proteome map currently consists of 1163 protein spots.
Depending on their intracellular localization these proteins were assigned to seven
different compartments: mitochondria, cytosol, nucleus, sacromere and
cytoskeleton, extracellular, multiple subcellular localizations, and other (including
Golgi, membrane, peroxisomal and endocytic vesicle). The majority of the
identified proteins was mitochondrial (34%), and predominantly identified as
metabolic enzymes. They represent multiple pathways with >90% coverage for
enzymes involved in glycolysis and the Krebs cycle, oxidative phosphorylation and
fatty acid metabolism (124).

Introduction 15
1.2.4 Cardiac preconditioning enters proteomics
Several years ago, proteomic studies started focusing on ischemia‐reperfusion
(134, 129, 130, 161, 166, 43). These approaches provided an overall assessment of
the cellular response to ischemia‐reperfusion (IR) injury and identified a
pronounced subset of enzymes and protein complex subunits. The majority of
changes were observed to proteins from four functional groups: (i) the sarcomere
and cytoskeleton; (ii) redox regulation; (iii) energy metabolism and (iv) stress
response. Recently, cardiac preconditioning entered the era of cardiovascular
proteomics. Ten studies were conducted to clarify the underlying mechanisms of
ischemic tolerance in the heart so far (Table 1.1) but concerning anesthetic‐
induced preconditioning, published data is still limited to one proteomic study
(41).
Table 1.1: Proteomic studies investigating cardiac preconditioning.
Species Experimental approach Major experimental findings Reference
rat
Mito‐Phosphoproteome analysis of ISO‐PC; Langendorff model
45 differentially phosphorylated proteins. Categorization: Oxidative Phosphorylation, Krebs cycle, fatty acid metabolism, transport and chaperones
(41)
PC with ethanol, PKC‐epsilon activator and inhibitor
ALDH‐2 activation correlates with reduced ischemic heart damage
(20)
IPC and PC with diazoxide and insulin; Langendorff model
No IPC‐mediated changes, but IPC inhibits MPTP opening in mitochondria
(23)
PC with PKC‐epsilon activating peptide in adult and aged hearts; Langendorff model
10 differentially expressed spots in aged but not adult hearts; 1 protein identification: F1‐ATPase β‐subunit
(78)
Pharmacological PC with resveratrol; Langendorff model
Identification of several PC‐associated proteins in context to IR
(12)
Biomarker discovery in blood samples; IPC and RIPC in vivo
2 differentially regulated proteins: albumin and LRRG03
(83)
Mouse
Phosphoproteome analysis; IPC and PC with GSK‐3 inhibitor; Langendorff model
Identification of 4 common protein levels/posttranslational modifications: increased cytochrome c oxidase subunits Va and VIb, ATP synthase‐coupling factor 6, and cytochrome b‐c1 complex subunit 6; decreased cytochrome c
(163)

16 Introduction
Table 1.1 continued: Proteomic studies investigating cardiac preconditioning.
Species Experimental approach Major experimental findings Reference
rabbit
Mitochondrial proteomics of IR and IPC hearts; Langendorff model
25 proteins differentially expressed in IR compared with control and IPC. Categorization: Krebs cycle; α‐keto acid dehydrogenase; respiratory chain; mitochondria membrane channels, β‐oxidation; proliferation and cytoskeleton
(72)
cell culture
Phosphoproteomic analysis of diazoxide‐induced PC; adult rat ventricular myocytes
Identification of 6 proteins with different abundance
(86)
PC with diazoxide and adenosine; isolated ventricular myocytes
19 protein identifications. Characterization: mitochondrial energetic including subunits of Krebs cycle enzymes and complexes of Oxidative Phosphorylation
(4)
1.3 Aim of the study
The cardioprotective benefits of anesthetic‐preconditioning are well described but
the phenomenon is still largely unexplained on the molecular level. Current
research on the molecular mechanisms of DES‐PC has been limited to the
examination of factors or pathways already believed to contribute to
cardioprotection. A proteomics approach would allow the evaluation of global
changes in protein expression by focusing on several biological parameters and
molecules at a time.
The classical combination of 2‐DE and MS was chosen to study the impact of
desflurane‐induced preconditioning on the heart proteome in a time‐course
analysis. The specific aims of the study were as follows:
• Establishing protein extraction protocols and 2‐DE the separation for the
comparative analysis of proteins from rat heart tissue samples.
• Optimizing 2‐DE analysis of alkaline proteins.
• Determining protein expression changes during the exposure to and
recovery from desflurane‐preconditioning in vivo.
• Mass spectrometric identification of protein spots with altered expression.

Material and Methods 17
2 Material and Methods

18 Material and Methods
2.1 Animals
The animal experiments were performed in accordance with the regulations of the
German Animal Protection Law (Tierschutzgesetz, Germany) and were approved
by the Bioethics Committee of the District of Duesseldorf, North Rhine‐Westphalia,
Germany. Male Wistar rats were obtained from the Animal Facility
(Tierversuchsanlage) of the University Hospital in Duesseldorf. They received
standard feed ad libitum, free access to water and human care. Animals had a
12:12 hour light‐dark cycle and were kept under temperature controlled
environmental conditions and constant humidity before entering the study.
2.1.1 Surgical preparation
Surgical preparation was performed like described in Toma et al. (152). Anesthesia
of male Wistar rats weighting 250‐300 g was induced by an intraperitoneal
injection of S (+) ‐ketamine (150 mg/kg) (Pfizer Pharma, Berlin, Germany). After
tracheal intubation, the lungs were ventilated with oxygen‐enriched air and a
positive end‐expiratory pressure of 2–3 cm H2O. Respiratory rate was adjusted to
maintain partial pressure of carbon dioxide within physiologic limits. Body
temperature was maintained at 38°C by the use of a heating pad. The right jugular
vein was cannulated for infusion, and the left carotid artery was cannulated for
measurement of aortic pressure. Anesthesia was maintained by a continuous
infusion of a saline solution containing α–chloralose (Sigma‐Aldrich, Taufkirchen,
Germany). A lateral left sided thoracotomy followed by pericardiotomy was
performed and a ligature using 5–0 prolene (Ethicon, Norderstedt, Germany) was
passed below the main branch of the left coronary artery. The ends of the suture
were threaded through a propylene tube to form a snare. After surgical
preparation rats were left untreated for 30 minutes to allow for recovery before
starting the preconditioning protocol.
2.1.2 Preconditioning protocol
The study protocol of desflurane‐induced preconditioning is shown in Figure 2.1.
Desflurane was purchased from Baxter Deutschland GmbH (Unterschleissheim,
Germany). 22 rats were randomly assigned to one of the six groups and either

Material and Methods 19
received 1 MAC (minimum alveolar concentration) desflurane (DES‐PC groups) or
did not undergo any further treatment (control groups). To investigate time‐
dependent protein changes, the hearts were excised at four different time points
during DES‐PC and at two different time points in baseline (Figure 2.1). A number
of 3‐5 animals per treatment is usually chosen for proteomic analyses due to
animal experiments constraints.
Figure 2.1: Experimental protocol of DES‐PC. After surgical preparation and recovery time, animals were aligned at baseline levels. Myocardial tissue samples were extracted at indicated points (↓) during DES‐PC. Control samples were taken at the beginning and the end of the scheduled DES‐PC protocol, respectively.
Ctrl 0’ group (n = 3): hearts were excised at the starting point (t = 0 min [0’]) of the
preconditioning protocol.
Ctrl 30’ group (n = 4): hearts were excised 30 min after the scheduled starting
point of DES‐PC (t = 30 min [30’]), corresponding to the end of the preconditioning
protocol.
Des 1 group (n = 4): rats received 1 MAC desflurane for one 5‐minute period
before excision of the hearts (total treatment phase: 1x5 minutes PC = 5 minutes).

20 Material and Methods
Wash 1 group (n = 4): rats received 1 MAC desflurane for one 5‐minute period with
one 10‐minute washout phase before excision of the hearts (total treatment
phase: 1x5 minutes PC + 10 minutes washout = 15 minutes).
Des 2 group (n = 4): rats received 1 MAC desflurane for two 5‐minute periods
interspersed with one 10‐minute washout phase before excision of the hearts
(total treatment phase: 2x5 minutes PC + 1x10 minutes washout = 20 minutes).
Wash 2 group (n = 4): rats received 1 MAC desflurane for two 5‐minute periods,
interspersed with one 10‐minute washout phase and one final 10‐minute washout
phase before excision of the hearts (total treatment phase: 2x5 minutes PC + 2x10
minutes washout = 30 min).
After heart excision, the tissue was shock‐frozen in liquid nitrogen and stored at
‐78°C.
2.2 Chemicals and equipment
For the preparation of buffers and solutions, chemicals with high quality such as
analytical grade (p.a.) and water of high purity from a Millipore system (Milli‐Q)
was used. Chemicals were purchased from Sigma‐Aldrich (Taufkirchen, Germany),
Carl Roth (Karlsruhe, Germany) or Merck (Darmstadt, Germany) if not otherwise
stated.
The equipment and consumables for isoelectric focusing (IPGphor 3, Manifold,
Multiphor, EPS 3501 XL power supply, Immobiline DryStrip Kit, Reswelling tray,
Immobiline DryStrips and IPG buffers) and quantitative gel analysis (ImageScanner,
LabScan and ImageMaster 2D Platinum) were purchased from GE Healthcare
(Freiburg, Germany).
2.3 Tissue homogenization and protein extraction
For tissue disruption, the method of mechanical homogenization was chosen as it
is well‐established in the laboratory of the Department of Anesthesiology. Briefly,
shock‐frozen tissue was pulverized between two nitrogen‐cooled metal blocks
(Dick, Deizisau, Germany), suspended in the respective lysis buffer and
homogenized using a motorized blender with different shear force adaptors (IKA,

Material and Methods 21
Staufen, Germany). In general, sample preparation should be kept as simple as
possible to avoid protein loss, but additional steps may improve the quality of the
final 2‐DE results. For this reason, different protocols from a literature search were
investigated to work out a suitable lysis buffer for proper protein extraction prior
to IEF. Ideally, the procedure will result in complete protein solubilization and
disaggregation. Subsequent protein determination was conducted either according
to Lowry or Bradford (chapter 2.4), depending on the compatibility of buffer
components used for solubilization. In the end, samples were either directly used
for first dimension gel electrophoresis separation or stored at ‐78°C.
2.3.1 One‐step protein extraction in IEF‐buffer
The tissue powder was directly dissolved in denaturing isoelectric focusing (IEF)
buffer [8 M urea; 4% CHAPS; 40 mM DTT]. Mechanical homogenization was
conducted at room temperature to avoid urea crystallization. The homogenate
was incubated for 1h at room temperature with occasional vortexes. After
centrifugation at 1000 g and 20°C for ten minutes the supernatant was twice
centrifuged at 16000 g, 20°C for 20 minutes. Protein determination of the
supernatant was performed by the Bradford method.
2.3.2 Two‐step protein extraction in TCA/acetone
This procedure allows a selective separation of proteins from contaminating
species such as salts, detergents, nucleic acids or lipids. The crushed heart tissue
was suspended in TCA‐buffer [10% (w/v) TCA with 0.3% (w/v) DTT in ice‐cold
acetone], homogenized keeping the sample on ice and further incubated at ‐20°C
for two hours. After centrifugation at 16000 g at 4°C for 20 minutes the resulting
pellet was washed twice with ice‐cold acetone (80%) and finally dried at room
temperature. At last proteins were resolved in IEF‐buffer and remained at room
temperature for at least one hour while shaking for full denaturation and
solubilization. Protein quantification was determined using the Bradford protein
assay.

22 Material and Methods
2.3.3 Physiological protein extraction followed by TCA/acetone
precipitation
Soluble proteins were extracted using a Tris‐based homogenization buffer with
increasing solubilization power, and subsequently precipitated with the aid of TCA
and acetone. Shock‐frozen tissue powder was dissolved in Tris‐lysis buffer
containing phosphatase and protease inhibitors [5 mM Tris base; 2 mM EGTA;
2 mM Na3VO4; 50 mM NaF; 0.2 µM okadaic acid; aprotinin, pepstatin A and
leupeptin each 0.01% (w/v) in 500 mM Tris‐HCl (pH 7.4)]. Sample homogenization
was performed on ice to reduce protein degradation. After adding 1% (v/v) Triton
X‐100 to the sample, the extract was kept on ice for one hour with occasional
vortexes and finally centrifuged at 16000 g, 4°C for 20 minutes. The resulting
supernatant contained all soluble proteins. Protein concentration analysis was
performed by the Lowry method. The subsequent precipitation step was also
employed to prepare protein samples of defined concentration. Samples were
incubated with 10% (w/v) TCA in 8 volumes (of sample volume) acetone (80%) for
a minimum of two hours at –20°C. The precipitate was collected by centrifugation
at 16000 g and 4°C for 45 minutes. The pellet was finally washed twice with ice‐
cold acetone (80%) and then air‐dried to remove residual acetone.
2.3.4 Prefractionation of proteins with subsequent TCA/acetone
precipitation
Prefractionation of cardiac proteins was conducted similar to the physiological
extraction procedure (chapter 2.3.3), but in this case protein fractions of different
solubilization degrees were kept separately. Briefly, tissue was resolved in Tris‐lysis
buffer as mentioned above and homogenate was centrifuged at 1000 g at 4°C for
ten minutes. The supernatant containing the crude water‐soluble fraction was
centrifuged again at 16000 g 4°C for 15 minutes to clean up cytosolic proteins. The
remaining pellet of the first centrifugation step was solubilized in Tris‐lysis buffer
that additionally contained 1% (v/v) Triton X‐100. The sample was incubated for
one hour on ice and afterwards centrifuged at 16000 g at 4°C for 15 minutes. The
resulting supernatant contained the detergent‐soluble fraction including
membrane‐associated proteins. The pellet was re‐suspended in Tris/Triton X‐100
lysis buffer to recover the particulate fraction. Protein concentrations were

Material and Methods 23
determined by the Lowry protein assay and TCA/acetone precipitation was
performed like described before.
2.4 Protein quantification
Protein quantification prior to 2‐DE is crucial for ensuring that equivalent amounts
of protein were compared between samples. Knowing the precise concentration of
the protein extract is important as small changes in the amount of protein loaded
onto the 2‐DE gels will influence the protein pattern between matched groups.
Thus, protein concentration in the extracts must be determined in a reliable
manner. Due to several buffer components in the sample solutions, not every
common protein assay could be applied. Therefore, protein samples resolved in
Tris‐lysis buffer were analyzed by the Lowry assay (91) whereas determination of
proteins solubilized in IEF‐buffer was performed by the Bradford method (13). In
both cases, diluted samples were calculated against a BSA standard curve of
known concentrations.
2.5 Two‐dimensional gel electrophoresis
Animal samples were randomized for 2‐DE to avoid systematic artifacts. To verify
the data with a small number of replicate experiments (n=3/4) we factor
experimental variations with a stringent threshold. Each organ was run in triplicate
but not in batch to factor differences due to technical variations (i.e. 2‐DE
processing). In general, isoelectric focusing was performed in parallel for six
samples, and two IPG Strips were run simultaneously during second dimension
SDS‐PAGE.
2.5.1 Protein solubilization prior to IEF
Besides proper protein extraction, optimal sample solubilization is absolutely
essential to achieve a well‐resolved 2‐DE separation. The key feature of this
preparation step is not only to solubilize proteins but also to keep them soluble
during all steps of 2‐DE. For this reason, several IEF‐buffer compositions with
different denaturants, detergents, reductants and solvents were tested.

24 Material and Methods
Urea is used as denaturant and unfolds most proteins to their fully random
conformation, with all ionizable groups exposed to solution. The use of thiorurea
in addition to urea has been found to further improve solubilization, particularly
for hydrophobic proteins (123, 97, 122). A nonionic or zwitterionic detergent is
always included in the sample solution to ensure complete sample solubilization
and to prevent aggregation through hydrophobic interactions. CHAPS is the most
commonly used detergent but in the last years new zwitterionic detergents like
ASB‐14, ASB‐16 and SB 3‐10 have been developed, providing an alternative
reagent for protein stability. DTT is frequently used to break disulfide bonds and to
maintain the proteins in their fully reduced state during IEF. For the reduction of
basic proteins, the use of hydroxyethyldisulfide (HED) is recommended (51).
Furthermore, the use of isopropanol and glycerol in the IEF buffer was reported to
improve resolution in the neutral and alkaline region of zoom‐gels (59).
Stock solutions (Table 2.1) were prepared with traces of bromphenol blue and
stored at ‐20°C. For isoelectric focusing, an appropriate volume of IEF‐buffer
(125 µl for 7 cm and 250 µl for 13 cm IPG strips) was applied to the sample. IPG
Buffer and DTT or HED were freshly added to the solution, and where indicated
supplementary isopropanol / glycerol. The protein sample was kept on a vortex
(Scientific Industries, New York, USA) for at least 1 hour to ensure complete
denaturation and solubilization before 2‐DE separation.
Table 2.1: IEF buffer compositions.
Stock solution
U
8 M Urea
4% CHAPS
TU
2 M Thiourea / 7M Urea
4% CHAPS
TUA
2 M Thiourea / 7 M Urea
2% CHAPS / 2% ASB‐14
Add‐ons
0.5% (v/v) IPG Buffer pH 3‐10, 4‐7
or
2% (v/v) IPG‐Buffer pH 6‐11
40 mM DTT
or
50 mM HED
10 % isopropanol /
5% glycerol

Material and Methods 25
2.5.2 First dimension separation
Isoelectric focusing (IEF) is an electrophoretic method that separates proteins
according to their isoelectric points (pI). IEF is performed with Immobiline DryStrip
gels using a flatbed electrophoresis system.
2.5.2.1 Sample application, IPG strip rehydration, and IEF
Two different sample application methods are commonly used for IEF: in‐gel
rehydration and sample cup‐loading. In‐gel rehydration loading offers advantages
like loading and separation of larger sample volumes as well as larger sample
amounts and is therefore the most commonly used application method in 2‐DE.
Cup loading is generally recommended for analytical loadings (up to 100 µg
protein) on alkaline or very acidic IPG strips. Furthermore, it is preferable for high
molecular mass as well as hydrophobic proteins.
In‐gel rehydration was chosen for isoelectric focusing of neutral‐acidic proteins in
pH range 4‐7 gels. The solubilized protein sample was directly pipetted into the
slots of the Reswelling tray. The IPG strips were inserted with gel side down into
the grooves without trapping air bubbles, and covered with mineral oil to minimize
evaporation and prevent urea crystallization. During overnight rehydration,
proteins enter the IPG strip by absorption and are distributed over the entire
length of the strip (passive rehydration). Prior to IEF, strips were briefly drained of
excess mineral oil and transferred with gel side facing upwards into the Manifold
tray (IPGphor) which was previously placed on the cooling unit of the
electrophoresis system. Electrode wicks were soaked with 500 µl distilled water
and blotted onto Whatman paper to ensure that they were damp but not
excessively wet. The damp wicks were placed on each end of the strip, and the
electrodes were fixed onto the paper wicks. IEF was started using the respective
running conditions listed in Table 2.2.
IEF of proteins in basic IPG strips (pH 6‐11) was performed using the cup‐loading
procedure which allows active sample application during IEF. The IPG strips were
rehydrated in pure IEF buffer overnight using the Reswelling tray. The rehydrated
strips were drained of excess mineral oil and transferred with gel side facing
upwards into the DryStrip Kit placed on the cooling unit of the Mulitphor. Damp
paper wicks and electrodes were adjusted before the sample cup bar was placed
at the desired point of application (either near to the anode or the cathode). The

26 Material and Methods
sample previously solubilized in 100 µl IEF buffer (maximum volume of cup) was
applied into the positioned sample cups being properly covered with mineral oil.
IEF runs were performed following the focusing conditions listed in Table 2.2.
Table 2.2: Focusing conditions for running IPG strips.
Strip length pH interval Voltage mode Voltage [V] Time [h] IEF system
13 cm 3‐10 / 4‐7 Step and Hold
Gradient
Gradient
Step and Hold
500
1000
8000
8000
1:00
1:00
2:30
3:00
IPGphor
13 cm 6‐11 Step
Gradient
Step and Hold
350
3500
3500
0:01
1:30
4:00
Multiphor
7 cm 3‐10 / 4‐7 Step
Gradient
Step and Hold
200
3500
3500
0:01
1:30
4:00
Multiphor
7 cm 4‐7$ Step and Hold
Gradient
Gradient
Step and Hold
300
1000
2400
2400
1:00
0:30
1:30
1:00
IPGphor
7 cm 6‐11§ Step
Step and Hold
Gradient
Step and Hold
500
500
3500
3500
0:01
2:00
1:30
1:00
Multiphor
IEF was performed at constant 20°C. The focusing conditions correspond to the
guidelines of the manufacturer’s protocol, except for IEF of cytosolic proteins in
7cm IPG strips pH 4‐7$ and 6‐11§. After termination of IEF, the IPG strips were
either stored at ‐78°C or directly equilibrated for second dimension separation.
2.5.3 Second dimension separation
The second‐dimension step, sodium‐dodecyl sulfate polyacrylamide gel
electrophoresis (SDS‐PAGE), separates proteins according to their molecular
weights (Mr).

Material and Methods 27
2.5.3.1 Equilibration
Prior to second dimension separation, the IPG strips were blotted onto filter paper
to remove excess oil. Equilibration to the SDS buffer system was performed in two
steps, reduction and alkylation, each for 15 minutes with gentle shaking. Each IPG
strip was incubated in 2.5 ml of an equilibration stock solution containing 50 mM
Tris‐HCl (pH 8.8), 6 M urea, 30% (v/v) glycerol, 2% (w/v) SDS and a trace of
bromphenol blue, whereas 1% (w/v) DTT was added to the first, and 2.5% (w/v)
iodoacetamide to the second equilibration step. The equilibrated IPG strips were
rinsed with Milli‐Q water, again blotted onto filter paper and finally dipped in
electrophoresis buffer [25 mM Tris base; 192 mM glycine; 0.1% (w/v) SDS in Milli‐
Q water].
2.5.3.2 SDS‐PAGE
Second dimension separation was performed by SDS‐PAGE in vertical
electrophoresis units (Bio‐Rad Laboratories, Munich, Germany; or PEQLAB
Biotechnologie, Erlangen, Germany) with a total acrylamide concentration of 10‐
12%, depending on the protein fraction investigated. The equilibrated IPG strips
were placed upright on the top of the acrylamide gel surface and covered with
heated (75°C) agarose‐sealing solution [0.5% (w/v) agarose, traces of bromphenol
blue in electrophoresis buffer], avoiding introduction of air bubbles. Prestained
protein molecular weight marker (Dual Color, Bio‐Rad Laboratories) dropped on a
piece of filter paper was placed onto the separating gel next to the end of the IPG
strip. The gel system was filled with electrophoresis buffer and proteins were
separated for 2.5 hours, starting at 80 V for 15 minutes followed by 120 V until the
dye front reached the bottom of the gel.
2.6 Protein staining
The final step in a gel electrophoresis experiment is the visualization of the
proteins to evaluate the results of their separation. There exists a great variety of
methods, each featuring pros and cons regarding their toxicity, sensitivity, linear
range for quantitation and compatibility with mass spectrometry. Because the
relative amount of a protein determined based on the intensity of the staining is
used to analyze differential protein expression, the choice of the staining method
has a great impact on the outcome of a differential analysis by 2‐DE.

28 Material and Methods
2.6.1 Silver staining
Silver staining is extremely sensitive with a detection limit as low as 0.1ng of
protein per spot, and is widely used in 2‐DE (36). However, due to its limited
dynamic range (10‐ to 40‐fold range), less repeatable procedure (subjective end‐
point of staining), and its partial compatibility with subsequent MS identification
(despite any improvements avoiding cross‐linkage), silver staining is rather
unfavorable for the quantitative analysis of protein expression changes on 2‐DE
gels.
Silver staining was performed on the basis of Shevchencko’s protocol published in
1996 (138). This protocol claims full compatibility with subsequent mass
spectrometric analysis by omitting glutardialdehyde from the sensitizer and
formaldehyde from the silver nitrate solution. All steps took place on a rocking
platform shaker (Duomax 1030, Heidolph, Schwabach, Germany). First, the gels
were fixed in 50% (v/v) methanol, 5% (v/v) acetic acid in Milli‐Q water for 20
minutes, followed by two fixation steps each in 50% (v/v) methanol for ten
minutes. After a washing step with Milli‐Q water for ten minutes, the gel was
sensitized by one‐minute incubation in 0.02% (w/v) sodium thiosulfate and rapidly
washed with three fast changes of Milli‐Q water for 20 seconds. The gel was then
submerged in 0.2% (w/v) silver nitrate solution and incubated for 20 minutes. The
silver nitrate solution was discarded and the gel was rinsed three times with Milli‐
Q water for 20 seconds. Development was started with a staining solution
containing 0.5% (w/v) sodium thiosulfate, 3% (w/v) sodium carbonate and 0.05%
formalin. After the desired intensity of staining was achieved, developing was
stopped by fast washing steps (3x20 seconds) with Milli‐Q water and terminated
with 5% (v/v) acetic acid. The gels were finally kept overnight in 1% (v/v) acetic
acid.
2.6.2 Colloidal Coomassie staining
Coomassie Brilliant Blue (CBB) is a dye commonly used for the visualization of
proteins in gels but is said to be 50‐100‐fold less sensitive than silver or fluorescent
staining and therefore rarely used for the detection of proteins in analytical gel‐
based proteomic approaches (113). Several improvements of the well‐known
Coomassie protocol by Neuhoff and collegues (104) have been made to increase

Material and Methods 29
the sensitivity of the CBB stain. In comparison to the others, the aluminum‐based
formula shows superior sensitivity that detects as low as 1 ng protein/band (37,
67).
Coomassie G‐250 staining was performed on a rocking platform shaker. After
second dimension separation, the gels were carefully washed three times with
Milli‐Q water each for ten minutes and afterwards incubated with Coomassie G‐
250 solution [0.02% (w/v) CBB G‐250, 5% (w/v) aluminium sulfate‐18‐hydrate, 10%
(v/v) ethanol, 2% (v/v) orthophosphoric acid] overnight. When staining procedure
was completed, Coomassie G‐250 solution was removed and the gels were briefly
washed with Milli‐Q water twice. Proteins were destained with destaining solution
[10% (v/v) ethanol, 2% (v/v) orthophosphoric acid] for 60 minutes and finally
rinsed with Milli‐Q water to improve the color to background ratio.
2.6.3 Pro Q Diamond Phosphoprotein stain
The fluorescent stain ProQ was used to detect phosphorylated proteins at
tyrosine, serine or threonine residues. The staining was performed according to
the manufacturer’s standard protocol (Molecular Probes, Eugene, USA). The gel
was immersed in fixing solution [50% methanol, 10% acetic acid] and incubated
with gentle agitation for 30 minutes. The fixation step was repeated overnight to
ensure washout of residual SDS. Following three washing steps a 10 minutes, gels
were stained with ProQ for 1.5 hours in the dark and destained by 3x30‐minute
washes using a solution containing 20% acetonitrile, 50 mM sodium acetate (pH
4.0). ProQ gels were scanned on a Typhoon 9400 variable mode imager (GE
Healthcare, Freiburg, Germany) at 480V / 200 microns (excitation source 532 nm
laser; emission filter 560 nm longpass).
2.7 Comparative 2‐DE image analysis
For comparative proteome analyses, the Coomassie stained gels were digitalized
using the flatbed ImageScanner and LabScan software (GE Healthcare, Freiburg,
Germany). Converting gray density values into OD values was performed using the
Kodak step tablet. Gels were scanned with blank filter type in transparent mode
and a scanning resolution of 300 dpi. Spot identification, normalization and

30 Material and Methods
matching were performed with ImageMaster (IM) 2D Platinum (GE Healthcare).
Variations in protein expression among the treatment groups were calculated
using descriptive statistics by means of overlapping measures as obtained by the
software’s integrated data analysis tools.
2.7.1 Gel image analysis
Spot registration was started with automatic detection, but manual intervention
was conducted in cases where residual artifacts had to be deleted and wrongly
registered spots to be edited. Normalization of the image was performed including
background subtraction and noise filtering. Spot quantification was determined on
the basis of the relative volume [%Vol.], representing the spot volume (integrated
intensity above 75% of the spot height) divided by the total volume of all spots in
the gel.
Matching was performed using 3‐5 landmarks to achieve proper spot sets between
gels. For the analysis of pH 4‐7 gels, IM software version 6 was used to create a
composite gel image that contains only representative spots of a population. The
composite gel is a statistically derived, synthetic gel of a batch of matched gels and
comprises only spots that appeared on at least two out of the three technical
replicate gels per organ. Final matching of all composite images against a unique
arbitrary reference image was carried out to link biological groups. Matching of pH
6‐11 gels was performed with IM software version 7 that provides an improved
matching algorithm. It combines the parameter‐free matching algorithm with
hierarchical population matching and allows more efficient comparisons without
the use of composite gels.
For comparisons of protein expression between treatment groups, spot sets were
analyzed using a special release of IM 2D Platinum 7.0 that allows the analysis of
synthetic gels. Changes in spot volume were determined using the statistical
descriptors central tendency and dispersion, which define the %Vol. interval for
each spot set. In order to avoid type I errors (false positives), spot sets with
overlapping differences between the treatment groups were ignored.

Material and Methods 31
2.7.2 Evaluation of variability in dynamic protein expression
Technical variability can generally be minimized by the setup of standardized
protocols but should, nevertheless, be taken into consideration in the
interpretation of the results. Within a given group of homogenous animals using
age, sex and genetic background matched rats, the major source of biological
variation is the variation resulting from different genotypes and environmental
factors. Determining the degree of both, technical and biological variability, allows
setting a threshold for the reproducibility of the present 2‐DE protocol. Differences
in protein expression above this threshold can then be considered as real
preconditioning‐induced changes.
Protein samples were separated by 2‐DE in triplicate and protein spots were
detected and quantified using the ImageMaster algorithm. Variation analyses were
performed with samples from the control 0’ group (n=3). Thus, a total of nine 2‐DE
gels were obtained for each investigated subproteome [water‐soluble/neutral‐
acidic (ws_4‐7), water‐soluble/alkaline (ws_6‐11) and detergent‐soluble/neutral‐
acidic (ds_4‐7)].
2.7.2.1 Technical variability
The technical error inherent to the 2‐DE procedure was investigated from pair‐
wise comparisons of one biological sample (organ #1n) using normalized volumes
[%Vol.] of matched spots (intra‐experiment analysis). The scatter plot function of
the ImageMaster software allows assessing the relationship (correlation) between
the spot values. On the basis of the best‐fit line through the data points and the
goodness‐of‐fit for this approximation gel similarities or experimental variations
can be analyzed. Representative digital gel images and scatter plots are shown in
Figure 2.2: Evaluation of technical variability of 2‐DE by regression analysis. Representative
2‐DE gels and scatter plots of the subproteome ws_6‐11. (Left) Digital images of
replicate gels from organ #1n of the control 0’ group. The spot outline corresponds
to the area from which the relative volume [%Vol] was quantified. (Right) Scatter
graphs on logarithmic scale for the specified replicate gel (x‐axis) and the reference
gel (y‐axis). Technical variations were compared between matched normalized
spot volumes. Regression analysis yielded the best fit line, the correlation
coefficient Corr and the number of matches (count). The pair‐wise comparisons
yield the following output values: (i) the number of matched spots corresponding

32 Material and Methods
in the two gels (counts), (ii) the correlation coefficient Corr among the matching
spot intensities and (iii) the regression equation of the best fit line. If matched
spots have the exact same quantity, the spots will be plotted on a line with slope
1.0. Further, matched spots whose quantities differ between a pair of gel will
result in correlation coefficients less than 1.0.
Digital 2‐DE image Scatter plot
Figure 2.2: Evaluation of technical variability of 2‐DE by regression analysis. Representative 2‐DE gels and scatter plots of the subproteome ws_6‐11. (Left) Digital images of replicate gels from organ #1n of the control 0’ group. The spot outline corresponds to the area from which the relative volume [%Vol] was quantified. (Right) Scatter graphs on logarithmic scale for the specified replicate gel (x‐axis) and the reference gel (y‐axis). Technical variations were compared between matched normalized spot volumes. Regression analysis yielded the best fit line, the correlation coefficient Corr and the number of matches (count).
2.7.2.2 Biological variability
To evaluate the extent of variation between individual animals of the control
group (inter‐experiment), composite (average) gels for each organ (#1n, #2n, #3n)
were created from representative spots of technical replicate gels. However, every
technical replicate gel contained several spots which were seen only on a few
other gels. These spots were mainly low abundant and close to the detection limit,
or appeared at the edge of the pH range and showed irregular shapes. Thus, only
spots that were on at least two out of three technical replicate gels were included
in the composite image.
Material and Methods 33
In analogy to the intra‐experiment comparisons, scatter plot analysis was
conducted for inter‐experiment gels to evaluate sample‐to‐sample variations
resulting from disparities in protein extraction / sample fractionation. The CV was
then determined for all spot volumes on the composite gels. Match sets that only
consist of one organ were not included in the present analysis.
2.7.3 Determining differential protein expression
Protein expression changes were calculated for each subproteome separately
using overlapping measures statistics. The overlapping measures quantify the
overlap between the intervals (defined by the ranges ‘mean ‐ dispersion, mean +
dispersion`) of the comparing groups (ctrl 0’ vs. DES‐PC groups). To get meaningful
data, the maximum difference (gap) between the range of the control group and
the range of one of the treatment groups was set to gap > 0, indicating non‐
overlapping ranges. Protein spots were further processed by determining the fold‐
rage between the treatment groups compared to the control group. As the ratio is
calculated between the extremes of the dispersion an absolute value higher than 1
represents an over‐ or under‐expression of the spot matches. In this study, the
threshold was set to ratio > 1.2. Because this is just a marginal threshold, one‐way
ANOVA values were used as qualitative indicators. Protein spots with P<0.05 were
considered as substantially regulated. The spot list was finally verified by
comparing the values of the control groups 0’ and 30’ against each other to
exclude alterations that are caused by the resting time.
2.8 Electrospray mass spectrometry
Mass spectrometric identification of differentially expressed proteins was
performed on an electrospray hybrid mass spectrometer (ESI Qq‐TOF) equipped
with a Nanospray source (Q‐STAR XL, Applied Biosystems, Darmstadt, Germany).
2.8.1 Fundamentals in instrumentation
Mass spectrometers consist of three major components: the ion source, the mass
analyzer and the detector. The ion source of a mass spectrometer converts the
analyte molecules into ions that can be transported to and analyzed by the mass

34 Material and Methods
analyzer. For electrospray (ESI)‐MS, the peptide mixture is transferred into a small‐
diameter capillary tube. A high electric field is applied between this capillary and
an electrode and induces a charge accumulation in the liquid at the end of the
capillary, whereby multiply charged droplets are formed and sprayed out from the
end of the capillary. These droplets are forced by the electric field to enter a region
of decreasing pressure, where evaporation of the solvent will cause explosion of
the droplets and produce singly or multiply charged ions (Charged Residue Model).
The mass analyzer/filter then separates the ions according to their mass‐to‐charge
ratio (m/z) – with the mass of the ion expressed in units and the charge expressed
as the number of charges that the ion possesses. Important parameters of mass
analyzers are resolution, sensitivity and mass accuracy. Nowadays, four types of
mass analyzers are used in protein analysis: time‐of‐flight (TOF), quadrupole (Q),
ion trap (IT) and Fourier transform ion cyclotron resonance (FT‐ICR). These
analyzers are sometimes combined in a single instrument, e.g. quadrupole ion trap
(QIT). In the present study protein identification was performed on a Q‐TOF
instrument.
The operating principles of the TOF mass spectrometer involve measuring the time
required for an ion to travel from an ion source to a detector usually located 1 or 2
meters from the source. Ions obtain their kinetic energy by acceleration in an
electric field. The ion velocities depend on m/z values and correspondingly ions of
different m/z will reach the detector at different times. The quadrupole analyzer
consists of four parallel rods where a superimposed radio‐ frequency potential is
applied. The field on the quadrupole then determines which ions are allowed to
reach the detector. As an electric field is imposed, ions moving into this field
region will oscillate depending on their m/z ratio and chosen radio frequency. Only
ions of a particular m/z are allowed to pass through.
For detection of the ions which are emerging from the mass analyzer, and
measurement of their m/z and abundances all mass spectrometers are supplied
with multi‐channel‐plates. These detectors most often used in modern mass
spectrometers involve secondary emission of electrons. Positive or negative ions
cause the emission of one or several secondary particles (usually electrons) while
colliding with the detector. These secondary particles pass into an electron
multiplier causing the emission of more and more electrons as they travel toward
the ground potential. Thus a cascade of electrons is created that finally results in a

Material and Methods 35
measurable current at the end of the electron multiplier. The detector signals are
transferred to a computer for recording of the signal, and the sum of all detected
signals represents the characteristic mass spectrum for the investigated peptide
ions.
2.8.2 Proteolytic digestion
The 2‐DE gels were placed on a clean glass plate positioned on a light table and
protein spots of interest were excised from gels using a disposable scalpel. The gel
slices were cut into 1 mm3 plugs and transferred into a Protein LoBind tube
(Eppendorf, Hamburg, Germany). The following washing steps were carried out
each for 10 minutes at RT on a continuously shaking vortex instrument unless
otherwise indicated. The solutions were removed after any incubation step using
GELoader tips (Eppendorf, Hamburg, Germany). At first residual Coomassie stain
was rinsed out by repetitive washing with 10% (v/v) ethanol / 2% (v/v) phosphoric
acid. The destained gel plugs were then washed twice with 50 mM NH4HCO3/50%
(v/v) acetonitrile, and once with 100% (v/v) acetonitrile. The gel plugs were finally
evaporated in a vacuum Concentrator (Eppendorf, Hamburg, Germany).
Proteomics grade trypsin (Sigma, Taufkirchen, Germany) resolved in digestion
buffer [25 mM NH4HCO3, pH 8.0] was added to the dried gel pieces until swelling.
Rehydration was allowed to proceed for 30 minutes whereby samples were kept
on ice to prevent auto‐digestion of trypsin. The chosen trypsin concentration
depended on the protein amount in the spot and varied between 0.1 – 0.01 µg/µl.
Following rehydration, excessive trypsin solution was discarded and samples were
amply covered with digestion buffer. Protein digestion was carried out for at least
12 hours at 37°C.
After digestion, sample was centrifuged at 8000 g for 60 seconds and peptide‐
containing supernatant was collected into a fresh LoBind tube. To gain peptides
from the gel plug, two volumes of Milli‐Q water were added to the sample and gel
plugs were shaken on a vortex and sonicated in a sonication bath (Sonorex,
Bandelin, Berlin, Germany) for 5 minutes. The washing out was transferred to the
peptide fraction, and extraction of peptides from the gel plugs was further
proceeded by adding two volumes of elution buffer [50% (v/v) acetonitrile / 5%
(v/v) formic acid]. The sample was placed on a vortex for 30 minutes, and after
centrifugation the elution fractions were also added to the peptide fraction. This

36 Material and Methods
extraction procedure was repeated three times. A final elution step with 100%
ACETONITRILE was performed to squeeze out last digestion products. United
peptide extracts were lyophilized in the vacuum concentrator and stored at ‐20°C
for future MS analysis.
2.8.3 Sample desalting
Protein digests were desalted by solid‐phase extraction to remove components of
the sample that might otherwise interfere with the direct analysis by electrospray
ionization mass spectrometry. At first, 7 µl of washing solution [4% (v/v)
methanol/1% (v/v) formic acid] was added to the dried peptides allowing to
resuspend for at least 5 minutes. In the meantime the small reversed‐phase
column, PerfectPure C‐18 Tip (Eppendorf, Hamburg, Germany) was prepared by
aspirating 7 µl of elution solution [60% (v/v) methanol / 1% (v/v) formic acid] into
the tip and expelling the solution into the waste. This process was repeated twice.
Afterwards, the C‐18 Tip was equilibrated using 7 µl of washing solution, once
again aspirating and expelling the solution. The equilibration step was repeated
another two times. The resolved peptides were then bound to the C‐18 Tip by
repeatedly aspirating the digested sample into the tip and expelling it back into the
microfuge tube, a total of ten cycles. The C‐18 Tip was washed three times using
wash solution, keeping all wash fractions in a separate microfuge tube for any
contingency. The peptides were subsequently eluted from the C‐18 Tip using 7 µl
of elution solution, aspirating and expelling the peptide‐containing solution into a
clean LoBind tube. Desalted protein samples were finally pipetted into NanoES
Capillaries (Proxeon Biosystems, Odense, Denmark) and transferred into the
electrospray source.
2.8.4 Determining protein identity by ESI mass spectrometry
Protein identification using mass spectrometry is based on the information in mass
spectra acquired from peptides of digested proteins. A measurement of the
masses of the peptides yields a peptide mass fingerprint (PMF) of the digested
protein. For PMF‐based protein identification, a sequence collection containing all
possible peptide sequences that can be present in an organism is needed. A
computer performs a virtual digestion of entire proteins in a sequence collection in
the same way as in a real experiment and creates a theoretical mass list of

Material and Methods 37
peptides. Mass values obtained from the acquired mass spectrum (the PMF) are
then compared to the theoretical masses from the mass list in order to find
matches.
A more specific method for identifying proteins and peptides is provided by
tandem mass spectrometry. The term “tandem mass spectrometry” reflects the
fact that two stages of mass analysis (MS/MS) are used in a single experiment. This
technique employs isolation of a product ion which then undergoes fragmentation.
A number of different fragmentation techniques are available that lead to the
detection of different types of fragment ions. The ESI Qq‐TOF used for this study
operates with collision‐induced dissociation: the ion of interest is fragmented as a
result of collision with inert molecules of nitrogen. The resulting set of proteolytic
peptide fragment mass values provide sequence information that can be utilized
for identifying the peptide that was fragmented (Figure 2.3). MS/MS‐ based
identification has several advantages since it provides detailed information about a
peptide sequence and its modifications. It allows working with complex peptide
mixtures and does not require all the peptides of a given protein to be confirmed
to achieve confident identification of a protein.
Figure 2.3: Nomenclature of peptide fragmentation according to Roepstorff and Fohlmann.Fragmentation following collision‐induced dissociation leads to peptide backbone cleavage resulting in fragments that either retain the positive charge on the C‐terminus component (represented by symbols x, y, z) or on the N‐terminus of the original peptide (indicated with the lettering a, b, c) (128).
The most frequently used computer‐based identification is library searching,
where peptides are identified by comparing the experimental MS/MS spectrum
with previously acquired spectra of identified peptides stored in a library. This

38 Material and Methods
approach can be very sensitive, since the comparison involves real already existing
spectra, but of course is useless for analysis of peptides not already detected. If a
peptide of interest features exceptional amino acid modifications or is not present
in any sequence collection, peptide identification has to be performed by de novo
sequencing using the MS/MS‐data. De novo sequencing means that the peptide
sequence tag is manually derived directly from the mass spectrum by systematical
identification of b‐ and y‐ion series.
2.8.5 MS data acquisition
One mass spectrum (scan type TOF‐MS) and up to five tandem mass spectra (scan
type Product Ion) were recorded for each sample spot. Mass spectra and collision
MS/MS data were analyzed with the Analyst QS software (Applied Biosystems). For
protein identification, tryptic monoisotopic peptide masses of collision‐induced ion
fragments were searched against the equivalent theoretical masses derived from
the NCBInr protein database. Using Mascot (http://www.matrixscience.com),
following search parameters were employed: taxonomy unspecified, one missed
cleavage site, peptide tolerance 1.2 Da and MS/MS tolerance ± 0.6 Da. Partial
chemical modification such as oxidation of methionine and carbamidomethylation
of cysteine were considered for the queries. In general, Mascot searches are
scored using the MOWSE algorithm. Here, the given probability value was used as
indicator for a proposed protein, but manual de novo sequencing was applied to
confirm the amino acid sequence suggested by Mascot. Peptide mapping was
considered positive when theoretical and experimental Mr and pI were expected
to be similar. The criteria used to accept protein identification included the extent
of sequence coverage (> 10%), the number of peptides matched (minimum of
three) and the mass accuracy.

Results 39
3 Results

40 Results
3.1 Strategies for improving 2‐DE separation of cardiac
tissue proteins
The prerequisite for gel‐based proteomics analysis of differential protein
expression is establishing optimal protocols for protein extraction and subsequent
2‐DE. To fully represent the proteome of interest, as many proteins as possible
have to be released and extracted from the respective tissue. The main elements
accounting for a satisfactory sample preparation are protein extraction, pre‐
fractionation and protein solubility. For optimal 2‐DE separations, different
established protocols were examined and optimized for the application in heart
tissue analyses.
3.1.1 Impact of protein extraction protocol on 2‐DE pattern
Three methods of protein extraction for 2‐DE were evaluated (chapter 2.3), all
generally recommended for gentle and/or more vigorous lysis of crude tissue
samples (52). In all cases, the frozen heart tissue was disrupted by mechanical
devices and further homogenized in different lysis buffers. Protein samples were
either (a) directly solubilized in IEF‐buffer containing urea and CHAPS (one‐step
extraction); (b) dissolved in TCA‐buffer and subsequently solubilized in IEF‐buffer
(two‐step extraction); or (c) homogenized in physiological Tris‐buffer containing
detergents followed by a subsequent precipitation step with TCA/acetone and a
final solubilization in IEF buffer (multi‐step extraction).
Following 2‐DE separation, the urea‐CHAPS homogenized tissue was found to be
successful for a handful of highly abundant proteins, but less effective for the
majority of proteins (Figure 3.1 left). The TCA‐acetone extraction method was even
worse to subject any cardiac proteins properly to 2‐DE (Figure 3.1 middle).
However, the physiological protein extraction strategy offered a well suited
protocol for soluble proteins from myocardial tissue. Figure 3.1 illustrates the
superiority of the multi‐step extraction protocol in terms of quantity and quality of
protein spots resolved on the 2‐DE gel.

Results 41
Direct protein extraction Two‐step sample preparation Physiological sampling
Figure 3.1: Efficiency of different protein extraction methods. 200 µg protein extracts were separated in 13 cm IPG strips pH 3‐10 and transferred to 12% SDS‐PAGE gels. (Left) Direct protein extraction in urea‐CHAPS containing sample buffer; (middle) Two‐step sample preparation by homogenization in TCA/acetone; (right) Physiological Tris‐based sampling followed by TCA/acetone precipitation.
To exclude the possibility that the Coomassie staining protocol is not sensitive
enough to visualize the bulk of proteins, silver and fluorescent staining as high
sensitivity detection methods were used for comparison. Preliminary experiments
with fluorescent Cy dyes were performed during a Difference Gel Electrophoresis
(DIGE) workshop by GE Healthcare. DIGE is very sensitive staining method with a
detection limit of around 500 pg of a single protein, but fails to uniformly stain gels
in cases of varying protein abundances (Figure 3.2). Proteins of low abundance
were shown to fall below the detection range and conversely, proteins of
extremely high abundance exceed the tolerance of the system, causing poor
resolution (trains, doubling of spots).
Compared to silver staining, Coomassie was able to visualize equal numbers of
protein spots, similar protein patterns and reached nearly the same detection limit
(Figure 3.2). Coomassie even performed better in staining high molecular weight
proteins, but silver showed superior detection of low molecular weight proteins.

42 Results
Silver staining Coomassie staining Cy dye staining
Figure 3.2: Comparison of protein spot resolution between different staining methods. Coomassie performed as strongly as silver staining, but did not reach detection limits of the fluorescent Cy dye staining. In return, the phenomenon of spot masking is quite prominent in the fluorescent staining but not apparent for Coomassie or silver staining.
3.1.2 Protein pre‐fractionation enhances proteome coverage
In order to display as many proteins as possible on the one hand and to overcome
the complexity of the sample on the other hand, a prefractionation strategy was
applied. In general, diversity in tissue organization and protein content affect
protein solubility, thus a sequential extraction procedure with increasing
solubilization power was tested. Proteins were first extracted with an aqueous
buffer, followed by a solubilization step using a detergent‐based extraction
solution by means of differential centrifugation. The resulting fractions were thus
enriched in water‐soluble (cytosolic), detergent‐soluble (mitochondria‐enriched)
and particulate (nuclear) proteins.
All three protein fractions were separated by 2‐DE without great restrictions
(Figure 3.3). Moreover, the prefractionation strategy allowed displaying sample‐
specific spot patterns in the respective protein fraction (proteins encircled in red).
Inspection of the particulate protein fraction versus the water‐soluble and
detergent‐solubilized proteins suggests that there is more protein resolved from
the cytosolic and membrane‐associated fraction. As a result of restricted tissue
quantities, a sufficient number of replicate gels cannot be run to finally reach
statistic significance. For this reason, further 2‐DE analyses were conducted
without the particulate fraction.

Results 43
Particulate protein fraction Detergent‐soluble proteins Water‐soluble proteins
Figure 3.3: Improving resolution in 2‐DE separation by the use of a pre‐fractionation protocol. Protein samples (400 µg) extracted using differential centrifugation and increasing buffer solubilization power were separated in 13 cm IPG strips pH 3‐10 and 12% SDS‐PAGE. Protein pattern which are predominantly visible in the respective protein fraction were encircled.
A wide‐range linear IPG 3‐10 pH gradient is often useful for the initial analysis of a
new type of sample. For ongoing analysis this can result in loss of resolution due to
compressed areas where high‐abundant proteins mask sparse protein spots. To
increase protein resolution without restricting the protein amount to be loaded on
a single 2‐DE gel, the use of partially overlapping pH gradients for first dimension
separation provides better proteome coverage.
In silico analyses of eukaryotic proteomes (Figure 1.2) showed a pI dependant
bimodal distributions of proteins with two main accumulations between pI 4‐7 and
9‐11 (164). For this reason, the application of partially overlapping IPG strips is
much more appropriate to enhance the resolution over shorter pH ranges. In this
study, IPG 4‐7 and 6‐11 strips were used to particularly improve 2‐DE pattern in
neutral‐acidic proteins and basic proteins.
To obtain maximum information from this subproteomic approach, optimization of
IEF in the investigated pH intervals is absolutely necessary. Whereas 2‐DE analysis
of acidic and neutral proteins is generally quite simple to carry out, isoelectric
focusing of basic proteins with pH’s > 8 prevalently results in severe horizontal
streaking (52). The streak‐business of basic proteins will be detailed in chapter
3.1.4.

44 Results
3.1.3 Optimal IEF depends on protein solubility
In order to improve the recovery of proteins prior to IEF (after the TCA/acetone
precipitation step), protein solubility was optimized using different IEF‐buffer
compositions. Several combinations of chaotropes, detergents, reductants and
solvents were tested for each protein fraction (Table A.1). Solubilization power of
the respective buffer was determined by two distinct parameters: the number of
visible protein isoforms, and the sharp of the protein stripes in the gel matrix.
The highest efficiency of protein solubilization in IPG 4‐7 strips was demonstrated
for the thiourea containing stock solution as it showed quantitatively and
qualitatively the best focusing results for both solubility fractions (Figure A.1). No
buffer including HED as reducing agent was short‐listed. The use of ASB‐14 as
zwitterionic detergent was appropriate only in few cases. And the mixture of
isopropanol and glycerol just improved marginally protein sharpness.
Subsequently, 2‐DE separations were performed with the three most successful
IEF conditions to figure out which buffer composition was the most suitable.
Evaluation was based on the number of protein spots that were detectable on the
2‐DE gel as well as on spot resolution within the protein pattern. In both cases, the
TU‐CHAPS‐DTT buffer gave the most satisfying results. Figure 3.4 shows the
representative 2‐DE gels of water‐ and detergent‐soluble proteins ran under
optimized IEF (pH 4‐7) and SDS‐PAGE conditions. The 2‐DE gels finally reveal highly
resolved protein spots across the entire pH range and therefore provide good
initial conditions for analyses of differential protein expression.
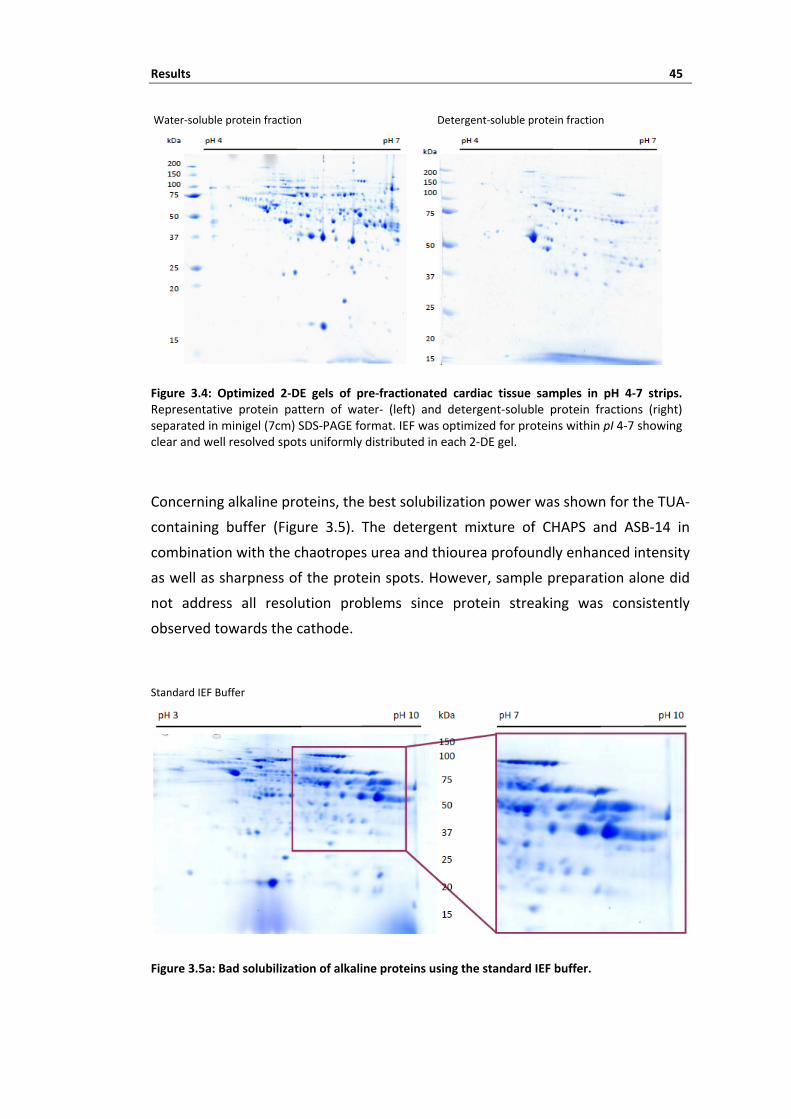
Results 45
Water‐soluble protein fraction Detergent‐soluble protein fraction
Figure 3.4: Optimized 2‐DE gels of pre‐fractionated cardiac tissue samples in pH 4‐7 strips. Representative protein pattern of water‐ (left) and detergent‐soluble protein fractions (right) separated in minigel (7cm) SDS‐PAGE format. IEF was optimized for proteins within pI 4‐7 showing clear and well resolved spots uniformly distributed in each 2‐DE gel.
Concerning alkaline proteins, the best solubilization power was shown for the TUA‐
containing buffer (Figure 3.5). The detergent mixture of CHAPS and ASB‐14 in
combination with the chaotropes urea and thiourea profoundly enhanced intensity
as well as sharpness of the protein spots. However, sample preparation alone did
not address all resolution problems since protein streaking was consistently
observed towards the cathode.
Standard IEF Buffer
Figure 3.5a: Bad solubilization of alkaline proteins using the standard IEF buffer.

46 Results
Thiourea‐ASB‐14 Buffer
Figure 3.5b: Improved solubilization of alkaline proteins by the additon of thiourea and ASB‐14. Enlarged areas of the basic regions in IPG pH 3‐10 demonstrate the superiority of the TUA‐buffer (lower panel) over the standard buffer (upper panel) to solubilize alkaline proteins.
3.1.4 De‐streaking the alkaline proteome
The use of IPGs covering the alkaline pH range 6‐11 did not facilitate IEF of alkaline
proteins to any considerable degree, as they still have a tendency to form
pronounced streaks rather than discrete spots in 2‐DE gels (Figure 3.6). When
using these basic pH gradients it is recommended to apply the sample by anodic
cup‐loading (51). Cup loading is generally used for analytical loadings as the
maximal sample load is limited to 100 µg in 100 µl. Sample application takes place
following overnight IPG strip rehydration, immediately prior to IEF. Thus depletion
of reducing agent in the sample is avoided and therefore should support “de‐
streaking”. Cup‐loading additionally facilitates the uptake of proteins that tend to
stick at the barrier of the IPG strip matrix, like high molecular mass or hydrophobic
proteins.

Results 47
Wide‐range IPG 3‐10 Zoom‐range IPG 6‐11
Figure 3.6: Poor resolution of basic proteins (pI>8) in 2‐DE gels. Proteins of the soluble extraction fraction were applied by in‐gel rehydration and separated in 13 cm wide‐range pH 3‐10 IPG strips (left) and zoom IPG strips pH 6‐11 (right). Both 2‐DE gels showed horizontal streaking along with numerous spot trains (encircled) at the cathodic end of the gels.
The optimal point of sample application needs to be determined empirically as it
may vary with the nature of the protein sample. Sample application near the
cathode is recommended for proteins with acidic pI’s or when SDS has been used
in sample preparation. But for the most IPG strip gradients anodic sample
application is suitable (51). Here both application points were tested for cup‐
loading, using the recommended sample load 100 µg/100 µl.
Anodic sample application Cathodic sample application
Figure 3.7: Effect of application point during cup‐loading on proteome representation. Proteins (100 µg / 100 µl) were applied via cup‐loading either at the anodic (left) or the cathodic edge (right) of the IPG strip pH 3‐10 / 7cm. The application point is indicated by an arrow and easy to identify by the precipitation stripe.

48 Results
Regarding proteins in the acidic‐neutral pH range, similar 2‐DE results were
obtained with both application methods (Figure 3.7). The protein patterns
displayed within pH 3‐7.5 were similar and spot boundaries were well‐defined in
both cases. Concerning proteins in pH 7‐9, sample application near the anodic end
was superior to cathodic loading. The superiority is characterized by improved
protein coverage and enhanced spot intensity. Furthermore, the precipitate at the
cathodic sample application point masked a couple of spots in the area of interest
whereas in anodic cup‐loading the precipitate was beyond the alkaline region.
Unfortunately, protein precipitation as a collapsed line of unresolved spots implies
that less protein was separated than originally loaded.
To remedy protein aggregation and to overcome limited loading capacities,
application of diluted samples in repetitive fillings was tested. The cup was refilled
with diluted sample when the rest has almost completely entered the IPG strip.
For the analysis of basic proteins, preparative loadings of 150‐250 µg sample are
recommended (51). “Refilling” was investigated for the double amount of protein
normally applied using sample cups (100 µg → 200 µg). One has to bear in mind
that insufficient focusing time during the refilling process will result in incomplete
protein migration and consequently poor IEF separation. To ensure constant
sample entry and proper focusing, the IEF protocol was therefore prolonged by a
low‐voltage step at 500 V for 2 hours whereby the final high‐voltage step was
reduced by the same Vhours.
Analytical loading Micropreparative loading by re‐filling
Figure 3.8: Overcoming restricted sample cup loading capacities by repetitive refilling. Sample application was performed by anodic cup‐loading, whereby the recommended maximum protein load of 100 µg protein per cup (left) was risen above by re‐filling of the sample cup during a low‐voltage step at 500 V (right). In both cases, protein concentration was kept at 100 µg/ 100 µl.
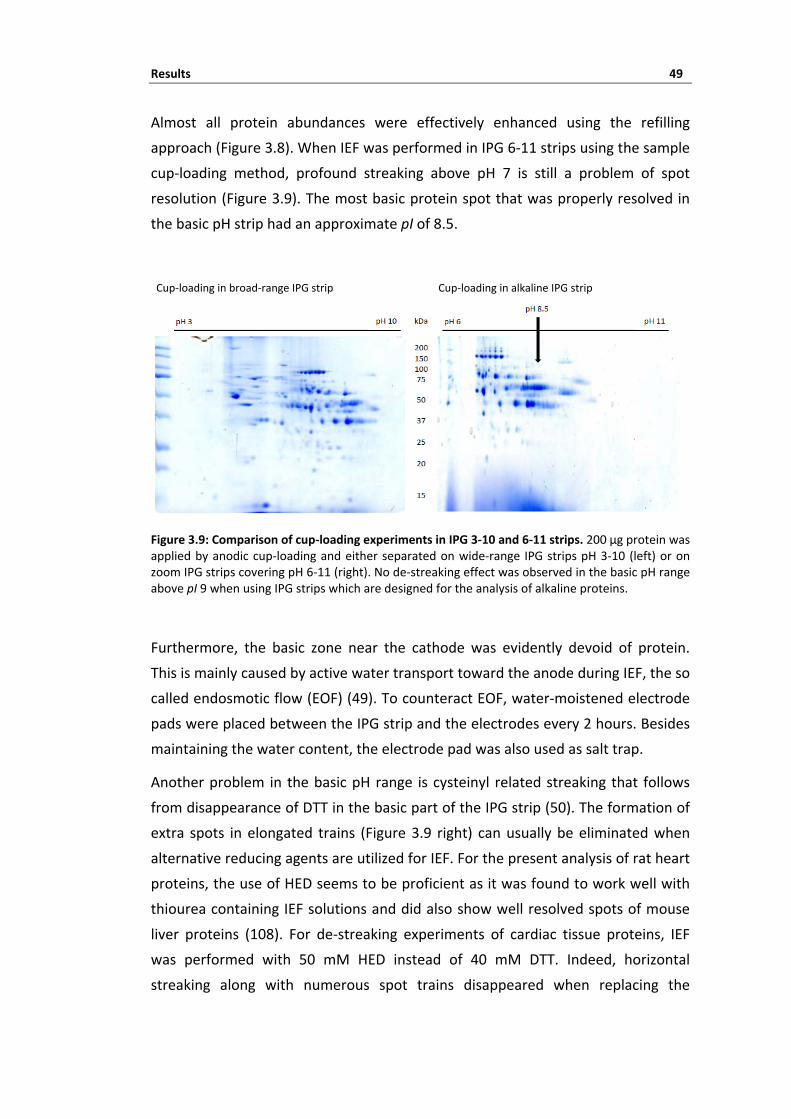
Results 49
Almost all protein abundances were effectively enhanced using the refilling
approach (Figure 3.8). When IEF was performed in IPG 6‐11 strips using the sample
cup‐loading method, profound streaking above pH 7 is still a problem of spot
resolution (Figure 3.9). The most basic protein spot that was properly resolved in
the basic pH strip had an approximate pI of 8.5.
Cup‐loading in broad‐range IPG strip Cup‐loading in alkaline IPG strip
Figure 3.9: Comparison of cup‐loading experiments in IPG 3‐10 and 6‐11 strips. 200 µg protein was applied by anodic cup‐loading and either separated on wide‐range IPG strips pH 3‐10 (left) or on zoom IPG strips covering pH 6‐11 (right). No de‐streaking effect was observed in the basic pH range above pI 9 when using IPG strips which are designed for the analysis of alkaline proteins.
Furthermore, the basic zone near the cathode was evidently devoid of protein.
This is mainly caused by active water transport toward the anode during IEF, the so
called endosmotic flow (EOF) (49). To counteract EOF, water‐moistened electrode
pads were placed between the IPG strip and the electrodes every 2 hours. Besides
maintaining the water content, the electrode pad was also used as salt trap.
Another problem in the basic pH range is cysteinyl related streaking that follows
from disappearance of DTT in the basic part of the IPG strip (50). The formation of
extra spots in elongated trains (Figure 3.9 right) can usually be eliminated when
alternative reducing agents are utilized for IEF. For the present analysis of rat heart
proteins, the use of HED seems to be proficient as it was found to work well with
thiourea containing IEF solutions and did also show well resolved spots of mouse
liver proteins (108). For de‐streaking experiments of cardiac tissue proteins, IEF
was performed with 50 mM HED instead of 40 mM DTT. Indeed, horizontal
streaking along with numerous spot trains disappeared when replacing the

50 Results
reducing agent (Figure 3.10). The greatest improvement was seen in the region
above pH 8 where intra‐ and inter‐disulfide exchange was expected to be most
prevalent. At the same time, an enhanced protein distribution over the given pH
range was achieved. The observed pI shifts towards the cathode are consistent
with the hypothesis that HED converts negatively charged thiol groups of proteins
into uncharged, mixed disulfides (108).
DTT for reduction HED for reduction
Figure 3.10: Spot de‐streaking by the use of HED. Replacing the reducing agent DTT (left) by HED (right) positively affects spot resolution in IPG 6‐11 gels. Protein pattern in the encircled areas show reduced artificial streaks.
Protein spots were well resolved in IPG 6‐11 strips although vertical trains persist
at the position of abundantly expressed proteins. In some cases, horizontal streaks
are still prominent when proteins are expressed in multiple isoforms. The most
basic protein spot present in the cardiac proteome of cytosolic proteins was
identified as succinyl‐CoA ligase, α unit with a theoretical pI ~ 9.9 and Mr ~ 37 kDa
(Figure 3.11; Table A.3). The remaining gap lacking protein spots around pH 10‐11
is probably caused by the hydrolysis of the amide groups present in the
polyacrylamide strip matrix. This problem generally occurs when using basic IPG
strips and becomes more serious with focusing time (personal communication
with R. Westermeier/ GE Healthcare).
In summary, the proposed protocol combining enhanced protein solubility,
micropreparative cup‐loading sample application by repetitive filling and de‐
streaking by the use of HED as reducing agent was found to efficiently resolve
alkaline proteins from myocardial tissue (Figure 3.15). The high‐quality spot

Results 51
pattern even reveals the occurrence of low‐abundant proteins (indicated by
arrows) which were previously masked by severe streaks.
Figure 3.11: Optimized 2‐DE separation of basic proteins. Optimization of sample preparation and focusing permits supreme proteome coverage in IPG 6‐11 strips. 200 µg protein of the water‐soluble fraction was solubilized in TUA buffer containing HED as reducing agent, and was applied via anodic cup‐loading in micropreparative sample loads by repetitive filling. (Right) Focus on gel region exceeding pH 9. Arrows indicate low‐abundant protein spots. The most basic spot was identified as succinyl CoA ligase, α subunit (pI 9.9).
3.1.5 Summary
The improvements provided in this chapter allow a higher coverage of the
myocardial proteome that consequently enhances the potential success rate in the
identification of novel targets for further differential analyses. Depending on the
subproteome of investigation, different protein extraction protocols, solubilization
procedures and isoelectric focusing conditions were necessary. In the current
study, protein extraction from myocardial tissue samples was only feasible using a
physiological Tris‐based buffer and subsequent TCA/acetone‐based protein
precipitation. For the visualization of proteins, the improved Coomassie protocol
according to Kang et al. (2002) was shown to provide detection limits similar to
silver staining (1‐10 ng) (67, 37). Pre‐fractionation in water‐ and detergent‐soluble
proteins considerably enhanced proteome coverage of myocardial tissue proteins.
2‐DE was performed in overlapping pH ranges for the analysis of neutral‐acidic
(IPGs 4‐7) and alkaline proteins (IPGs 6‐11). Mix and matching different IEF buffer
compositions further provided optimal protein solubilization of neutral‐acidic
(Urea‐Thioruea‐CHAPS buffer) and basic proteins (Urea‐Thiourea‐ASB‐CHAPS
buffer). For de‐streaking alkaline proteins in gel regions above pH 8, sample

52 Results
application by repetitive anodic cup‐loading and the use of HED instead of DTT as
reducing agent were shown to considerably improve 2‐DE pattern.
3.2 Proteomic profiles of DES‐PC treated rat hearts
The in vivo preconditioning of small animals is a well‐established model in the
working group of Prof. Wolfgang Schlack (Academic Medical Research Center,
Amsterdam, The Netherlands) and is used to study the cardioprotective effect of
different pharmacological agents. For desflurane preconditioning in male Wistar
rats it was shown that the administration of 2x5 minutes desflurane (1 MAC)
interspersed by ten minutes wash‐out phases significantly reduces experimental
infarct size from 57.2±4.7% in controls to 35.2±16.7% (measured as % of area at
risk) (152). The application of 1 MAC in rats corresponds to 5.7% of the inspired
gas. The use of this concentration is a common dose for clinical anesthesia.
To study the impact of desflurane preconditioning on the rat heart proteome, a
broad‐based proteomics approach in the classical combination of 2‐DE and MS was
chosen. For better proteome coverage, complementary subproteomes were
analyzed [water‐soluble/neutral‐acidic proteins (ws_4‐7), water‐soluble/alkaline
proteins (ws_6‐11) and detergent‐soluble/neutral‐acidic proteins (ds_4‐7)]. When
performing comparative proteomics it is important to determine the contribution
of inherent variability in measuring relative differences between data sets. Table
3.1 shows the raw data of the 2‐DE gels, encompassing the number of spots,
number of matches (corresponding spots between replicate gels) and the match
efficiency. The average number of protein spots detected in the gels of the
different subproteomes ranged from 135 for ds_4‐7, 289 spots for ws_4‐7 to 172
for ws_6‐11. Of these, 114, 265 and 163 spot sets were found to be in common
between all replicate gels of the respective subproteome, resulting in a match
efficiency of 90% on average. In summary, the comparability of spot pattern within
the subproteome was quite high for all protein populations, providing a good basis
for comparative analyses.

Results 53
Table 3.1: Characteristics of spot sets calculated from replicate gels of control animals. For each subproteome, the number of spots and matches (spot sets between comparing groups) were calculated and averaged [mean+SD] from the nine replicate gels. The match efficiency indicates the percentage of spots that were consistent within the control group of each subproteome.
Subproteome Number of spots Number of matches Match efficiency
Detergent‐soluble/ pH 4‐7
135 (± 16) 114 (± 13) 85 %
Water‐soluble/ pH 4‐7
289 (± 24) 265 (± 18) 92 %
Water‐soluble/ pH 6‐11
172 (± 14) 163 (± 10) 93 %
As can be seen from the gel‐to‐gel analyses (Table 3.2), Corr values were in the
range of 0.866 ‐ 0.996, and average coefficients were calculated to be 0.995
(±0.1%), 0.961 (±2.4%) and 0.898 (±4.7%) for samples from ds_4‐7, ws_4‐7 and
ws_6‐11, respectively. The data from the subproteomes in pH range 4‐7 (ds_4‐7
and ws_4‐7) were highly correlated (Corr close to 1), indicating good
reproducibility between replicate gels. This demonstrates less disparity in sample
loading, and high similarity among the sample preparation. On the other hand, the
alkaline subproteome (ws_6‐11) slightly differed from goodness‐of‐fit, but the
values of the subproteome ws_6‐11 were not systematically biased by the cup‐
loading sample application method. The linear dependences between the data
points of scatter plots from ws_4‐7 and ds_4‐7 were also not far away from
identity (1.0 * x + 0). Altogether, matching performance, regression line and
correlation coefficient give confidence to the consistency of the 2‐DE procedure.
Additionally, the average technical coefficient of variation (CV) was determined for
protein expression levels from the three replicate 2‐DE gels (Table 3.2, intra‐
experiment analyses). On average, samples applied by in‐gel rehydration showed
equal CVs (26.2% and 26.6% for the detergent‐ and water‐ soluble subproteomes
in pH range 4‐7, respectively). However, the cup‐loading strategy for alkaline
proteins introduces technical variances to a greater extent (CV of 39.6%).

54 Results
Table 3.2: Gel‐to‐gel and sample‐to‐sample variations in 2‐DE gels. Intra‐experiment compares repeat 2‐DE gels from an identical sample (organ #1n); inter‐experiment compares gels from different organ preparations (#1n, #2n, #3n).
Subproteome Type of
comparison Evaluation values
Data set
1 vs. 2
Data set
1 vs. 3
Data set
2 vs. 3 Average
CVe) (%)
SDf) (%)
Water‐soluble/ pH 4‐7a)
Intra‐experiment
Inter‐experimentc)
Corr Spot match
Corr Spot match
0.947271
0.924271
0.948274
0.831296
0.989261
0.846260
0.961 269
0.867 276
26.5
45.3
7.3
9.3
Detergent‐soluble/ pH 4‐7a)
Intra‐experiment
Inter‐experimentc)
Corr Spot match
Corr Spot match
0.995106
0.994110
0.996109
0.994101
0.994109
0.993100
0.995 108
0.994 104
26.2
31.1
14.7
15.6
Water‐soluble/ pH 6‐11b)
Intra‐experiment
Inter‐experimentd)
Corr Spot match
Corr Spot match
0.952124
0.822135
0.866121
0.916148
0.878124
0.841132
0.898 123
0.860 138
39.6
54.0
13.7
20.2
a) Sample was applied by in‐gel rehydration. b) Sample application via cup‐loading. c) Values were calculated from synthetic (composite) gels. d) Mean values determined from three experimental 2‐DE runs of the same dataset. e) Standard deviation divided by Mean for matched spots in an experimental series was averaged. f) Average SD of CVs for all matched spots in an experimental series. To evaluate the impact of biological variation, Corr and CV values were analyzed by
inter‐experiment comparisons. The Corr and match values of each subproteome
were quite similar between intra‐ and inter‐experiments (Table 3.2), indicating the
sample preparation procedure to be highly standardized. CV values for each
subproteome were distributed over a broad range, whereby the median CV was
0.22, 0.37 and 0.50 for ds_4‐7, ws_4‐7 and ws_6‐11 (Figure 3.12). Eight alkaline
and 15 acidic spots of the water‐soluble fractions even had a CV value above 1.
Inspection of spot sets exhibiting high CVs revealed that these were mainly those
ones that are part of crowded areas and partly masked by neighboring spots, or
represented spot sets containing obvious outliers. However, in both subproteomes
nearly three‐quarters of the spots had a CV value below 0.70. Thus one has to keep
in mind that there are notable differences in the CVs from one match set to the
next within the same experimental group. In contrast, the detergent‐soluble
subproteome seems to be consistent, due to the fact that 75% of the spots sets

Results 55
had a CV value below 0.35. The average CV and SD for each subproteome were
high (31.1±15.6%, 45.3±9.3% and 54.0±20.2%, respectively; Table 3.2) meaning
that variation on the scale of 46‐74% (sum of the average CV plus the average SD)
needs to be factored into the threshold for determining differential protein
expression later on.
ds_4‐7 ws_4‐7 ws_6‐11
Figure 3.12: Frequency distribution of coefficient of variation in 2‐DE experiments. Experimental frequency was determined by summing the number of occurrences corresponding for each nominal CV integer value.
3.2.1 Differential protein expression in the time course of DES‐PC
Using the optimized 2‐DE conditions described in chapter 3.1.5, differential protein
expression was investigated for the different protein fractions of the myocardial
tissue (water‐ and detergent‐ soluble proteins separated in pH 4‐7 and 6‐11 IPG
strips). To gain a comprehensive view of proteomic alterations effected by
desflurane preconditioning, proteins were considered as differentially regulated
between control and DES‐PC treated samples if they were up‐ or down‐regulated
by at least 1.2 fold and a P‐value < 0.05 (ANOVA for comparison of multiple gel
populations). Protein spots that are in accordance with these criteria are indicated
in Figure 3.13.
Interestingly, in contrast to the hemodynamic data which demonstrated little
difference in heart rate and aortic pressure between the experimental groups
(152), DES‐PC induces changes in the abundance of a number of proteins. In total,
70 protein spots were found to be affected in the water‐ and detergent‐soluble
protein fraction. The most spot alterations were detected in the detergent‐soluble
protein fraction pH 4‐7 (35 spots; Figure 3.13 left), followed by the water‐soluble
fraction with 22 and 12 spot alterations for pH 4‐7 and 6‐11 separations (Figures

56 Results
3.13 middle and right), respectively. At this point, no concrete information is given
about the time course of expression change. The idea was to quickly find matches
that distinguish the preconditioning groups from the control group to get an
impression of the cellular response. Strikingly, the multiplicity of differentially
expressed spots is represented in protein chains. Especially in the subproteome
ds_4‐7 nearly all influenced protein spots seem to belong to multiple protein
spots. This is not unexpectedly as mitochondrial proteins will be accumulated in
the detergent extraction fraction, and components of the mitochondrial proteome
like the respiratory chain are highly expressed in multiple isoforms (subunits).
ds_4‐7 ws_4‐7 ws_6‐11
Figure 3.13: Proteomic alterations in the rat heart evoked by DES‐PC in vivo. Representative 2‐DE gels of the control group from subproteomes ds_4‐7, ws_4‐7 and ws_6‐11. The boxes determine the area used for the software‐based image analysis. The digital images in the lower panel show the respective area of investigation. Protein spots that are affected during DES‐PC are outlined. Missing spots that are not present in the control group are indicated by x. Joined spots represent a merged spot set.

Results 57
Although this set of spots might represent interesting proteins it was decided to
narrow the hit list with respect to the varying CVs of the respective subproteomes.
Individual thresholds for meaningful and representative statistic analyses
regarding spot variation were set to P< 0.02, 0.01 and 0.005 for ds_4‐7, ws_4‐7
and ws_6‐11, respectively. To further avoid errors due to a lower technical
reproducibility close to the limit of detection, a minimal spot value [%Vol.] of 0.015
was imposed for further data analysis. In the end, 40 protein spots met the criteria
whereby each subproteomes contributes relative equally (17, 14 and 9 spots for
ds_4‐7, ws_4‐7 and ws_6‐11). 2‐DE gel images from the control group of each
subproteome and the representative proteins which had a significant altered
abundance between control and preconditioned animals are shown in Figures 3.14
and 3.15.
Figure 3.14: Differentially expressed proteins in the detergent‐soluble fraction. Control gels of protein fraction ds_4‐7. Protein spots that undergo significant expression alterations of > 1.2‐fold and P < 0.02 are shown in green boxes and indicated by their match ID. Missing spots that are not present in the control group are indicated by x.

58 Results
Figure 3.15: Differentially expressed proteins in the water‐soluble fraction. Control gels of the protein fractions ws_4‐7 (upper panel) and ws_6‐11 (lower panel). Protein spots that undergo significant expression alterations of > 1.2‐fold and P < 0.01 (ws_4‐7) and P < 0.005 (ws_6‐11) are shown in green boxes and indicated by their match ID.

Results 59
In general, the majority of spots (32/40) showed a decreased abundance in the
heart of preconditioned rats compared to the control (Table 3.3) indicated by
green). Only eight protein spots were increased in response to DES‐PC (indicated
by red). Regarding protein changes in the time‐course of DES‐PC, most proteins
seem to respond in particular to Des 2. The expression factors in all experimental
groups were moderate, ranging from 4.90‐fold down‐regulation to 1.46‐fold up‐
regulation.
Table 3.3: Significant protein expression changes in the heart induced by DES‐PC. Changes were highlighted if they were significantly decreased (green) or increased (red) (Anova P values are shown). 1,0E‐06 characterizes the case where the software cannot compute ranges because of missing values.
Match ID§
Average normalized intensityb) Relative change in spot intensity c)
Control DES‐PC Des 1 vs. Wash 1 vs. Des 2 vs. Wash 2 vs.
Ctrl 0’ Des 1 Wash 1 Des 2 Wash 2 Ctrl 0’ Ctrl 0’ Ctrl 0’ Ctrl 0’
(n= 3) (n= 4) (n= 4) (n= 4) (n= 3) Subproteome ds_4‐7 (threshold P<0.02)
498 0,346 0,179 0,029 0,069 0,086 ‐1,024 ‐3,847 ‐1,933 ‐1,486
(P=0,109) (P=0,001) (P=0,008) (P=0,044)
501 0,260 0,130 0,050‐0,842 1,0E‐06 ‐1,846 1,0E‐06
(P=0,208) (P=1,86E‐04) (P=0,010) (P=0,001)
503 0,388 0,229 0,890 0,066 0,490 ‐0,710 1,373 ‐2,069 0,606
(P=0,293) (P=0,027) (P=0,009) (P=0,547)
513 0,228 0,134 0,495 0,038 0,129 ‐1,052 1,610 ‐2,594 ‐1,013
(P=0,141) (P=0,023) (P=0,002) (P=0,202)
516 1,233 0,880 1,0E‐06 ‐0,554 1,0E‐06 1,0E‐06 (P=0,004) (P=0,494) (P=0,004) (P=0,013)
523 0,569 0,269 0,813 0,081 0,412 ‐0,976 0,733 ‐2,712 ‐1,003
(P=0,096) (P=0,318) (P=0,003) (P=0,164)
531 1,407 1,158 2,104 0,403 1,139 ‐0,701 1,217 ‐1,595 ‐0,815
(P=0,636) (P=0,017) (P=0,019) (P=0,478)
537 2,203 1,341 2,919 0,455 1,706 ‐0,883 1,059 ‐2,118 ‐0,864
(P=0,217) (P=0,042) (P=0,004) (P=0,310)
539 0,853 0,452 0,821 0,180 0,281 ‐1,092 ‐0,795 ‐2,033 ‐1,763
(P=0,085) (P=0,805) (P=0,006) (P=0,010)
540 1,135 0,868 1,558 0,308 0,762 ‐0,666 1,003 ‐1,444 ‐0,812
(P=0,517) (P=0,077) (P=0,024) (P=0,293)
542 0,867 0,741 1,488 0,293 0,868 ‐0,621 1,093 ‐1,195 0,520
(P=0,698) (P=0,075) (P=0,025) (P=0,995)
545 0,594 0,328 0,937 0,101 0,587 ‐0,901 0,773 ‐2,281 ‐0,586
(P=0,142) (P=0,264) (P=0,005) (P=0,970)
546 1,016 0,375 0,967 0,138 0,327 ‐1,368 ‐0,651 ‐3,006 ‐1,536
(P=0,022) (P=0,853) (P=0,002) (P=0,026)
548 0,587 0,434 0,754 0,153 0,299 ‐0,756 1,033 ‐1,557 ‐1,123
(P=0,431) (P=0,055) (P=0,021) (P=0,084)
557 0,260 0,109 0,159 0,041‐1,051 ‐0,724 ‐2,189 1,0E‐06
(P=0,067) (P=0,280) (P=0,008) (P=0,005)
563 0,740 0,067 0,422 0,050 0,202 ‐2,744 ‐0,753 ‐5,253 ‐1,037
(P=0,008) (P=0,207) (P=0,005) (P=0,108)
567 2,162 1,622 3,228 0,567 1,799 ‐0,666 0,980 ‐1,504 ‐0,598
(P=0,473) (P=0,099) (P=0,020) (P=0,677)

60 Results
Match IDa)
Average normalized intensityb) Relative change in spot intensity c) Control DES‐PC Des 1 vs. Wash 1 vs. Des 2 vs. Wash 2 vs. Ctrl 0’ Des 1 Wash 1 Des 2 Wash 2 Ctrl 0’ Ctrl 0’ Ctrl 0’ Ctrl 0’
(n= 3) (n= 4) (n= 4) (n= 4) (n= 3)
Subproteome ws_4‐7 (threshold P<0.01)
17 0,108 0,010 0,024 0,033 ‐3,261 ‐1,393 1,0E‐06 ‐0,960
(P=0,032) (P=0,057) (P=0,004) (P=0,149)
27 0,014 1,0E‐06 1,0E‐06 1,0E‐06 1,0E‐06
(P=2,94E‐04) (P=2,94E‐04) (P=2,94E‐04) (P=0,002)
34 0,054 0,004 0,026 ‐4,899 1,0E‐06 ‐1,481 1,0E‐06
(P=2,03E‐04) (P=8,17E‐06) (P=0,004) (P=9,86E‐05)
36 0,245 0,028 0,004 ‐1,909 1,0E‐06 ‐9,642 1,0E‐06
(P=0,042) (P=0,015) (P=0,026) (P=0,056)
71 0,104 0,024 0,065 0,027 0,032 ‐1,395 ‐0,919 ‐2,358 ‐1,255
(P=0,030) (P=0,121) (P=0,009) (P=0,066)
77 0,091 0,083 0,082 0,097 1,0E+06 1,0E+06 1,0E+06 1,0E+06
(P=9,94E‐05) (P=0,013) (P=0,004) (P=0,029)
90 0,039 0,009 0,002 0,012 ‐2,271 ‐5,523 1,0E‐06 ‐2,057
(P=0,002) (P=3,06E‐04) (P=6,74E‐05) (P=0,006)
100 0,009 0,045 0,037 1,0E+06 1,0E+06 1,0E+06 (P=0,437) (P=0,001) (P=0,118)
128 0,066 0,036 0,157 1,0E+06 1,0E+06 1,0E+06 (P=0,072) (P=0,064) (P=0,022)
134 0,008 0,025 0,042 0,031 0,295 1,0E+06 0,569 1,347 9,061 (P=0,490) (P=0,187) (P=0,028) (P=0,014)
158 0,497 0,122 0,429 0,568 0,328 ‐2,828 ‐0,764 0,871 ‐0,877
(P=0,001) (P=0,493) (P=0,325) (P=0,226)
201 8,378 7,075 8,944 8,506 4,744 ‐0,937 0,975 0,821 ‐1,490
(P=0,239) (P=0,171) (P=0,892) (P=0,002)
319 0,077 0,021 0,036 0,036 ‐2,299 1,0E‐06 ‐1,360 ‐1,211
(P=0,001) (P=5,09E‐05) (P=0,013) (P=0,056)
349 0,119 0,027 0,051 0,054 ‐1,534 1,0E‐06 ‐1,010 ‐0,997
(P=0,023) (P=0,003) (P=0,073) (P=0,119)
Subproteome ws_6‐11 (threshold P<0.005)
16 0,485 0,718 0,983 1,165 0,582 0,447 0,684 1,449 0,396
(P=0,154) (P=0,018) (P=2,91E‐07) (P=0,463)
49 3,311 2,544 2,060 1,236 2,638 ‐0,623 ‐0,758 ‐1,509 ‐0,659
(P=0,198) (P=0,022) (P=6,86E‐07) (P=0,199)
59 1,159 1,722 1,984 2,506 1,503 0,638 0,597 1,231 0,582
(P=0,064) (P=0,050) (P=3,61E‐05) (P=0,192)
94 0,434 0,273 0,263 0,162 0,351 ‐0,681 ‐0,665 ‐1,451 ‐0,534
(P=0,034) (P=0,036) (P=7,23E‐06) (P=0,353)
105 0,049 0,009 0,009 0,009 ‐1,534 ‐1,238 1,0E‐06 ‐1,052
(P=1,53E‐05) (P=6,75E‐05) (P=1,21E‐07) (P=0,001)
129 0,028 0,017 0,003 0,003 ‐0,139 ‐0,500 1,0E‐06 ‐0,500
(P=0,266) (P=0,003) (P=0,001) (P=0,009)
130 0,018 0,007 0,001 ‐0,130 1,0E‐06 1,0E‐06 ‐0,457
(P=0,087) (P=0,001) (P=0,001) (P=0,010)
131 0,029 0,014 0,006 0,007 0,002 ‐0,355 ‐0,578 ‐0,489 ‐1,449
(P=0,055) (P=0,004) (P=0,007) (P=0,002)
160 0,081 0,116 0,130 0,211 0,123 0,452 0,410 1,465 0,333
(P=0,185) (P=0,139) (P=3,01E‐05) (P=0,213)
a) Match IDs refer to numbers in Figure 3.14 and 3.15. b) Average intensities were determined based on spot volumes [%Vol.]; cells are blank when the
protein spot is completely absent from the group.

Results 61
3.2.2 Mass spectrometry identification of altered proteins during
DES‐PC
Among the altered protein spots, 14 out of 40 could be identified by mass
spectrometry (Table 3.4). These proteins were sequenced by excising the
respective spot from the 2‐DE gel, digestion with trypsin and ESI‐MS/MS analysis.
The respective protein sequences are listed in the appendix (Table A.2).
Table 3.4: Identification of protein spots with abundance differences during DES‐PC. Acc. No.: NCBI accession numbers; Mr: relative molecular mass; pI: protein isoelectric point; Calc: calculated values from GPMAW; Obs: observed value by manual inspection.
Spot IDa)
Sub‐proteome Acc. No. Protein Name
(short name)
No. of peptides
b)
Sequence coverage
Mr [kDa] pI
Calc Obs Calc Obs
16 ws_6‐11 NP_037309 Aspartate aminotransferase 2, mitochondrial precursor (AST‐2)
9 24,9% 47 45 9,3 9,4
17 ws_4‐7 NP_001005550 NADH‐ubiquinone oxido‐reductase 75 kDa subunit, mitochondrial precursor (NDUFS1)
1 3,9% 79 45 5,6 4,6
34 ws_4‐7 NP_001129343 pyrophosphatase (inorganic) 2 (PPA2)
2 / 4 25,5% 38 37 6,7 6,5
49 ws_6‐11 NP_077374 Aconitase 2, mitochondrial precursor (Aco‐2)
4 / 9 18,6% 85 83 7,6 7,8
59 ws_6‐11 NP_037309 Aspartate aminotransferase 2, mitochondrial precursor (AST‐2)
2 / 7 24,4% 47 45 9,3 9,5
71 ws_4‐7 NP_599153 Albumin precursor (ALB)
3 9,9% 69 75 6,0 6,4
94 ws_6‐11 NP_112319 Methylmalonate‐semialdehyde dehydrogenase, mitochondrial precursor (MMSDH)
11 24,7% 57 56 8,2 8,0
105 ws_6‐11 NP_001006973 NADH dehydrogenase ubiquinone flavoprotein 1 precursor (NDUFV1)
6 12,9% 50 47 7,9 8,0
129 ws_6‐11 NP_062164 Carbonic anhydrase II (CAII)
2 18,1% 29 28 7,1 6,6

62 Results
Spot IDa)
Sub‐proteome
c) Acc. No. Protein Name
(short name)
No. of peptides
b)
Sequence coverage
Mr [kDa] pI
Calc Obs Calc Obs
130 ws_6‐11 NP_062164 Carbonic anhydrase II (CAII)
3 16,2% 29 28 7,1 6,8
131 ws_6‐11 NP_001101130 Carbonic anhydrase I (CAI)
4 17,6% 28 27 7,0 6,8
160 ws_6‐11 NP_036703 Aspartate aminotransferase 1 (AST‐1)
8 22,5% 46 39 6,8 7,4
201 ws_4‐7 NP_036727 L‐lactate dehydrogenase B (LDH‐B)
6 24% 37 40 5,7 5,7
501 ds_4‐7 NP_001004250 Ubiquinol‐cytochrome c reductase core protein 1 precursor (UQCRC1)
4 15,4% 53 55 5,2 5,5
a) Match ID refers to numbers in Figure 3.14 and 3.15. b) Number of sequenced peptides by ESI MS/MS, where necessary number of peptides used for PMF. c) The protein spots of the neutral‐acidic subproteomes (ds_4‐7 and ws_4‐7) were analyzed by Ch. Schuh and H. Vogt. In general, the success rate of protein identifications by mass spectrometry was
considerably higher for spots with alkaline pIs although their protein content was
even smaller in certain cases. This might be due to the fact that the basic amino
acids lysine and arginine are more frequently distributed in alkaline proteins and
therefore (a) more peptides can be achieved following trypsin digestion and (b)
these peptides are easier to protonate and therefore simplify MS‐based
identification. Spot #17 revealed only one peptide for identification, but due to the
fact fact that the sequenced peptide was quite long (aa 646‐673) and no further
peptides were identified from the tryptic digest, protein identification was
accepted.
The estimated molecular weights (Mr) and pIs of the spot positions in the 2‐DE gels
were generally in agreement with the theoretical values calculated by GPMAW
(Table 3.4). Only spot #17, 71 and 160 showed divergent values for both, Mr and
pI. The possible reason for this divergent manner might be protein degradation.
Especially the reduced molecular weight supports this hypothesis. In the end, 12
non‐redundant proteins were identified. Of these, six can be allocated to the
mitochondrial compartment (spot #16/59, 17, 49, 94, 105 and 501). Interestingly,
the most putative mitochondrial proteins were found in the water‐soluble fraction,
however, these spots do actually represent precursor proteins. Nearly the same
set of protein spots was also collocated in spot chains (spot #16/59, 49, 94, 501).

Results 63
3.2.3 Time‐course of differentially expressed proteins during
DES‐PC
Various expression patterns were observed for the 14 identified protein spots
during the course of desflurane preconditioning (Figure 3.16). Proteins which had a
decreased abundance in the DES‐PC group relative to the control group were: L‐
lactate dehydrogenase B (LDH‐B), NADH‐ubiquinone oxidoreductase 75 kDa
subunit and NADH dehydrogenase ubiquinone flavoprotein 1, 51 kDa subunit
(NDUFS1 and NDUFV1), inorganic pyrophosphatase (PPA2), albumin (ALB),
ubiquinol‐cytochrome c reductase core protein 1 (UQCRC1), mitochondrial
aconitase (Aco‐2), methylmalonate‐semialdehyde dehydrogenase (MMSDH), and
carbonic anhydrase I and II (CAI and CAII). Conversely, proteins which showed
increased abundance during DES‐PC compared to controls were the cytosolic and
mitochondrial aspartate aminotransferases (AST‐1 and AST‐2, respectively).
Spot ID
Time course during DES‐PC
DES‐PC regimen
Ctrl 0’ Des 1 Wash 1 Des 2 Wash 2
# 17
NDUFS1
# 34
PPA2
# 49
Aco‐2
# 71
ALB

64 Results
Spot
ID Time course during DES‐PC
DES‐PC regimen
Ctrl 0’’ Des 1 Wash 1 Des 2 Wash 2
#94
MMSDH
# 105
NDUFV1
# 129
CAII
# 130
CAII
# 131
CAI
# 201
LDH‐B
# 501
UQCRC1

Results 65
Spot ID
Time course during DES‐PC
DES‐PC regimen
Ctrl 0’ Des 1 Wash 1 Des 2 Wash 2
# 16
AST‐2
# 59
AST‐2
# 160
AST‐1
Figure 3.16: Protein expression changes in the course of DES‐PC. Quantification of proteins was performed from DES‐PC groups relative to the control 0’ group. Data are presented as Mean (100%) and M.S.D. Statistically significant changes are indicated for the respective treatment group (*P<0.02, #P<0.01, and §P<0.005 for ds_4‐7, ws_4‐7 and ws_6‐11, respectively). In the enlarged regions of 2‐DE gels from control and preconditioned rats, those proteins which had abundance difference between groups were indicated with an arrow.
Most protein spots were altered just at one treatment condition during DES‐PC, in
7 of 9 cases after the second desflurane administration (Aco‐2, albumin, MMSDH,
AST‐1, two protein spots of AST‐2 and one protein spot of CAII). The other two
spots, representing CAI and LDH‐B, showed decreased abundance exclusively at
the end of the preconditioning protocol (Wash 2). Four proteins (NDUFS1,
NDUFV1, UQCRC1 and one protein spot of CAII) were significantly affected at
several conditions during DES‐PC, but all including treatment Des 2. Only one
protein spot was found to be differentially expressed consistently in all
experimental groups (PPA2).
Protein spots #16/59, 49 and 501 corresponding to AST‐2, Aco‐2 and UQCRC1 are
part of a spot chain (Figure 3.16). In 2‐DE separations, multiple pI variants of the
same protein can be attributed to several factors, such as protein synthesis,
protein degradation, or post‐translational modification (PTM). Protein synthesis
and degradation are not assumed to cause a pI shift resulting in spots located on a
string horizontally over the gel like it is observed for AST‐2, Aco‐2 and UQCRC1. As

66 Results
only distinct spots of these proteins exhibited abundance changes between
experimental groups, the observed differential expression within the spot chain
may be more likely due to PTMs such as phosphorylation, glycosylation or
oxidative modification.
3.2.4 Post‐translational modifications of protein spots in multiple pI
variants
Feng et al. investigated the cardiac phosphoproteome of isoflurane‐protected
heart mitochondria, and identified numerous phosphorylated protein spots
following anesthetic preconditioning (41). To determine whether DES‐PC induced
alterations in multiple spot isoforms result from phosphorylation changes we
mapped respective 2‐DE gels with ProQ Diamond Phosphoprotein stain. ProQ has
been shown to directly detect phosphate groups attached to tyrosing, serine, or
threonine residues and allowed selecting for proteins with high stable
phosphorylation levels (133, 144).
Protein expression of spot #16/59 (AST‐2) was significantly enhanced after the
second desflurane administration (Des 2) (Figure 3.16). Comparing spot intensities
at ctrl 0’ and Des 2 levels using ProQ, no increased phosphorylation was detected
(Figure 3.17). The protein increase of spots #16/59 might therefore be
independent of protein phosphorylation. Spot #49 of Aco‐2 was found to be
decreased 1.5‐fold at treatment point Des 2, suggesting dephosphorylation during
the DES‐PC protocol. But neither control levels nor Des 2‐treated hearts showed
any phosphorylated protein spot of Aco‐2 (Figure 3.17). Thus dephosphorylation
seems not to be the reason for the specific alteration in spot #49 of Aco‐2.

Results 67
Control group Des 2 group
Figure 3.17: Multiple pI spot variants of Aco‐2 and AST‐2 are not phosphorylated. Post‐translational phosphorylation of Aco‐2 and AST‐2 was investigated using ProQ Diamond stain. No differences in the phosphorylation pattern were observed during DES‐PC.
UQCRC1 was significantly altered only at the most acidic protein spot (spot #501)
which became completely absent after the first washout phase (Figure 3.16).
Christian Schuh demonstrated in his experiments that spot #501 of UQCRC1 was
phosphorylated in ctrl 0’ hearts (132). Thus the decrease in abundance of spot
#501 may reflect the result of dephosphorylation.
Resulting from these experiments, protein phosphorylation of Aco‐2 and AST‐2
during DES‐PC seems to be unlikely. Besides phosphorylation, heterogeneous
protein isoforms in a series of spots with the same molecular weight but different
pI values might be due to protein oxidation. Recently, mitochondrial proteins were
shown to be hot spots for oxidative modification (149). Especially Aco‐2 was
shown to be modified by oxidative modification at tryptophan residues (149, 60).
For this reason, MS/MS analysis of spot #49, #16/59 and #501 was performed to
identify peptides containing tryptophan residues and to determine possible
oxidized amino acid sites by +32 atomic mass unit increase. Unfortunately,
possible oxidative modifications to AST‐2 could not be determined due to
insufficient coverage of tryptophan native peptides. On the contrary, several
peptide ions with unmodified and doubly oxidized tryptophan residues were
retrieved for Aco‐2 in control level and DES‐PC treated hearts.
As indicated in the MS spectrum of spot #49 (Figure 3.18), the signals 493.27
[M+2H]2+, 624.33 [M+2H]2+ and 834.40 [M+2H]2+ were attributed to tryptophan
containing peptides of Aco‐2. In the enlarged areas corresponding to respective

68 Results
increments of 16 Da (atomic mass unit of two oxygen atoms in [M+2H]2+ ions),
appropriate signals at 509.30 [M+2H]2+, 640.34 [M+2H]2+ and 850.40 [M+2H]2+
were located (Figure 3.19).
Figure 3.18: ESI‐MS spectrum of proteolytic peptides of Aco‐2. ESI‐MS analysis revealed three tryptophan‐containing peptides (indicated by arrows, peptide masses and amino acid sequence) .
It is well known that sample handling can induce oxidative modifications to amino
acids, like for instance the oxidation of methionine. MS/MS analysis of protein spot
#49 revealed no mono‐oxidation of methionine‐ or tryptophan‐ containing
peptides, indicating that tryptophan dioxidation was specific to the selected
protein spot of Aco‐2.
To substantiate tryptophan dioxidation (W2ox), MS/MS fragmentation was used to
identify the modified amino acid site(s). Fragment ions resulting from collision‐
induced dissociation of the tryptophan containing peptides aa 234‐245, aa 371‐378
and aa 657‐671 revealed the respective mass shift due to dioxidation (W 186 Da →
W2ox 218 Da) at residue 241, 371 and 657 of Aco‐2. Figure 3.19 shows the de novo

Results 69
sequencing of the peptide at 640.34 [M+2H]2+ Da with the amino acid sequence 234LTGTLSGW2oxTSPK245. The theoretical fragmentations of unmodified and
oxidative modified peptides as well as the corresponding fragment spectra of the
doubly oxidized peptides 509.30 [M+2H]2+ and 850.40 [M+2H]2+ are listed in the
appendix (Figure A.2; Table A.4).
Figure 3.19: De novo sequencing of the Aco‐2 peptide m/z 640.3434 [M+2H]2+. Using collision induced fragmentation the complete y‐ion series including the doubly oxidized tryptophan (W2ox) of the Aco‐2 peptide aa 234‐245 was obtained from the MS/MS spectrum.
It is important to note that dioxidation of tryptophan residues was exclusively
found in the spot of the control group (Figure 3.20 blue spectrum) but not in the
Des 2 group (red spectrum). Oxidative modification thus seems to be abolished at
least after the second desflurane preconditioning stimulus, and may hereby
influence the expression ratio of Aco‐2 spot #49.

70 Results
aa 234‐245 aa 371‐378 aa 657‐671
Figure 3.20: Oxidized tryptophan‐containing peptides of Aco‐2. The indicated peptides 640.34 [M+2H]2+ (left), 509.30 [M+2H]2+ (middle) and 850.40 [M+2H]2+ (right) correspond to doubly oxidized peptides containing tryptophan. The overlay of MS spectra allow differentiating peptides from control spot (blue) and Des 2 spot (red).
The ratio between tryptophan native and oxidative modified peptides in the one
and same spot (#49 of control group) was always > 0 indicating that tryptophan is
predominantly non‐modified. It will therefore be of interest to examine in further
experiments the extent of oxidative modification in the other protein spots of
Aco‐2, both in control and preconditioned hearts.
3.2.5 Modulation of proteins differentially expressed during DES‐PC
Comparison of the 12 proteins in the four experimental DES‐PC groups revealed
several clusters of related expression pattern (Figure 3.21). The significant changes
in protein spot expression were not consistent for all spots at all four time points
during DES‐PC. Regarding the protein spots with increased abundances relative to
the control group (#16, 59 and 160), all three spots show a uniform modulation
over the course of DES‐PC (Figure 3.21 A): a substantial increase after the first
preconditioning stimulus (Des 1) with a maximum peak at condition Des 2, and a
rapid drop down in expression following the second wash‐out phase (Wash 2).
On the contrary, protein spots with decreased abundance during DES‐PC do not
have a characteristic phenotype (Figure3.21 B). The only thing in common is a
more or less dramatic decrease in response to the first desflurane application
(Des 1). Having a closer look at the modulation at certain treatment points, several
different behavior patterns could be observed.

Results 71
(A) (B)
(C) (D) (E)
Figure 3.21: Treatment‐dependent modulation of identified proteins during DES‐PC. For the analysis of protein expression changes with respect to increased and decreased levels during DES‐PC, individual %Vol. values of identified protein spots were normalized to the control level. (A) Protein spots that showed an increased abundance compared to control; (B) Protein spots with decreased abundance during DES‐PC. (C‐E) Graphs representing protein spots down‐regulated in response to the desflurane preconditioning protocol sorted by similar distribution pattern.
Spot #49 and 94 show the same modulation as the increased spots but mirror‐
inverted: a continuous decline until Des 2 followed by an immediate increase up to
expression level at condition Des 1 (Figure 3.21 C). It is noticeable that in both
pattern (Figure 3.21 A+C) nearly all proteins seem to return to baseline levels of
abundance.
Proteins identified from spot #105, 129 and 130 follow the same trend but totally
vanish at Des 2 and reappear at Wash 2 to the same extend like at Wash 1. Spot
#131 also matches to this set but its expression change at condition Des 2 is
unaltered with respect to Wash 1 and Wash 2. In the end, all four spots have in
common that their expression level remains significantly altered (Figure 3.21 D).
The third set of proteins consisting of spot #17, 34, 71, 201 and 501 looks quite
cluttered at first sight (Figure 3.21 E). In comparison to control, the expression
changes take a course up and down. However, spot 71 and 17 on the one hand
and spot 34 and 501 on the other hand show a similar developing. And comparison

72 Results
of these two groups reveals that spots 34 and 501 reflect the behavior of spots 17
and 71 but in a delayed manner.
All spots are present in moderate abundance except spot 201 which is highly
abundant (0.5 Vol.% vs. 8 Vol.% in control gels). This might be the reason why its
expression intensity does not considerably alter in comparison to the rest of the
protein spots. Nevertheless, the appearance of spot 201 significantly declines
about the half after the second washout phase (Wash 2).
3.2.6 Classifications of proteins involved in DES‐PC
Based on the annotations of the NCBInr database, the 12 identified proteins were
functionally classified into categories with regard to their molecular function and
biological processes. Classification of proteins was based on the PANTHER (Protein
ANalysis THrough Evolutionary Relationships) classification system
(http://www.pantherdb.org/). Categorization on the basis of molecular function
showed that 50% of identified myocardial proteins account for two classes:
reductase and dehydratase (each 25%), followed by transaminases and
dehydrogenases which make up each 17% (Figure 3.22 left). In turn, these proteins
are involved in fundamental processes of the cardiac metabolism including the
Krebs cycle, oxidative phosphorylation and electron transport (Figure 3.22 right).
The remaining two proteins exhibit pyrophosphatase activity and carrier function,
altogether 16%.
Among the distinct proteins, 11 out of 12 are metabolically active enzymes
involved in aerobic metabolism or enzyme subunits with a wide spectrum of
catalytic and regulatory activities. The majority of proteins is associated with the
amino acid metabolism (AST‐1 and AST‐2, MMSDH), followed by electron transport
proteins (NDUFS1 and UQCRC1) as well as the carboanhydrases (CAI and CAII)
which participate in the metabolism of hydrocarbons and phenolic compounds
that are not proteins or lipids. Other proteins belong in equal parts to the oxidative
phosphorylation (NDUFV1), glycolysis (LDH‐B), polyphosphate catabolism (PPA2)
and Krebs cycle (Aco‐2). The only non‐metabolic protein is associated with
transport (ALB).

Results 73
Molecular function Biological process
Figure 3.22: Function and biological process of identified proteins. The 12 distinct identified proteins were plotted in a pie chart relating to their function (left) and biological process (right). Categorizations were based on information provided by the online PANTHER classification system.

74 Discussion
4 Discussion

Discussion 75
The primary goal of this study was to identify alterations in the cardiac proteome
which possibly enlighten the phenomenon of anesthetic preconditioning, using an
experimental model of desflurane‐induced preconditioning (DES‐PC). In the field of
anesthetic preconditioning this is the first proteomics approach using an in vivo
model. Furthermore, this study is specifically focused on myocardial protein
alterations during the preconditioning regimen with the aim to identify trigger
molecules of the cardioprotective signaling pathway. In the context of anesthetic
preconditioning there is only one previous proteomics study of isoflurane‐induced
preconditioning, analyzing protein phosphorylation in the mitochondria of isolated
perfused hearts undergoing ischemia‐reperfusion (41).
To investigate differential protein expression in the time course of DES‐PC, heart
tissue from untreated and desflurane preconditioned rats were examined by 2‐DE,
total protein staining, and mass spectrometric analysis. The comparative analysis
of proteins with changed abundance revealed that:
• The cardiac proteomes of untreated and desflurane preconditioned rats
were strikingly different even though they had similar hemodynamics and
cardiac function
• DES‐PC rats had significantly altered abundances especially in proteins
involved in energy metabolism
• Differentially expressed protein spots showed various modulations in the
time course of DES‐PC
• Not all protein spot isoforms of the same protein show abundance changes
indicating specific regulations during DES‐PC
• Preliminary experiments investigating post‐translational modifications of
multiple spot isoforms reveal phosphorylation and oxidative modification
as possible regulator
In order to judge the contribution of this study to the understanding of DES‐PC it is
necessary to be aware of the advantages and limitation of proteomic approaches.
The greatest challenge in 2‐DE based analyses is the right sample preparation
strategy. Without reducing complex protein samples such as mammalian tissue the
resulting 2‐D gel is crowded with poorly resolved spots, making interpretation of

76 Discussion
proteome profiles difficult. Optimizing the 2‐DE procedure is therefore a
fundamental step before performing comparative analyses.
4.1 Better proteome characterization using optimized
2‐DE
In theory approximately 10.000 proteins are expressed in the human heart (93). In
practice only a subset of proteins can be displayed on a wide‐range (pH 3‐10) 2‐DE
gel. But how much proteome resolution is necessary for a practical and meaningful
2‐DE gel approach using comparative proteomics?
Li et al. tried to provide guidance for cardiac proteome analyses in terms of
selection of the pI separating window, accurate quantitation of protein abundance,
reduction of sample complexity and enrichment of low‐abundant proteins (88). In
their experiments they characterized the cardiac proteome in the pH range 3‐10 as
well as in narrow‐range IPG strips for a deeper view on neutral proteins (pH 5‐8
and 5.5‐6.7). Spot quantitative comparison was performed between silver‐ and
SYPRO Ruby‐ stained gels. To evaluate the separation power upon subcellular
fractionation, they analyzed the effectiveness of commercially available kits for
isolating protein fractions of cardiac tissue. Anyhow, the 2‐DE gels observed in this
study lack in well‐focused protein pattern. For this reason, numerous procedures
concerning sample preparation and isoelectric focusing were tested to provide
maximal spot separation and proteome coverage. Particular attention was turned
to the alkaline proteome to overcome spot streaking present by default 2‐DE
separations.
4.1.1 Establishment of a fundamental protein extraction procedure
Direct extraction of proteins in urea‐containing sample buffer offers the advantage
to perform only few interventions prior to IEF and concurrently introduce just little
modifications to the proteins. For the use of solid tissue like the heart, only
incomplete cell disruption and/or solubilization of proteins was achieved using this
conventional buffer (Figure 3.1). The bad extraction efficiency might be amplified
due to co‐extraction of non‐protein cellular components that interfere with
protein migration. The occurrence of an intense precipitation streak at the acidic

Discussion 77
end of the IPG strip supports this assumption. Several individual proteins actually
show intense spots and cannot be resolved equally well with any of the other
tested extraction methods.
TCA‐acetone preparation, which is specifically recommended for samples from
difficult protein sources with high levels of interfering substances like tissue,
showed the worst extraction efficiency (Figure 3.1). The method is known to
produce protein solutions substantially free of salts, nucleic acid and other
contaminating substances which therefore cannot be the reason for the low
amount of protein spots resolved on the 2‐D gel. But during the precipitation
procedure not only proteins of the ground tissue sediment but also particulate
material which concomitantly disturbs isoelectric focusing of proteins.
In comparison to these two protocols, the best 2‐DE result was obtained when
using the physiological protein extraction method (Figure 3.1). In fact, a multitude
of proteins was separated but due to compressed areas where high‐abundant
proteins mask spots of low‐abundant proteins a considerable loss of resolution
was the consequence. In order to reduce that complexity, sample prefractionation
was an important aspect in the experiments. Protein extraction using sequential
solubilization is reported to increase the overall number of proteins detected in a
sample (97). In this work, step‐wise increasing of the extraction power, using first
an aqueous buffer for the extraction of cytosolic proteins followed by a detergent‐
based solution to recover matrix and membrane‐associated proteins, provided a
complementary way to achieve better proteome coverage (Figure 3.1). This
observation is consistent with a study on the intracellular localization of murine
heart and skeletal muscle proteins (124). They found out that cardiac proteins
were largely derived from mitochondria, followed by multiple subcellular
localization and cytosol. And only 6% of heart proteins are allocated to the
nucleus. This implies that the same quantity of protein was distributed over a
fewer number of proteins and thus individual protein spots have increased
abundance whereas low‐abundant proteins disappear.

78 Discussion
4.1.2 Improving proteome coverage by the use of overlapping
subproteomes
The use of partially overlapping pH gradients (pH 4‐7 and pH 6‐11) enhanced the
number of proteins detectable in each 2‐DE gel and allowed a suitable increase in
resolution for acidic‐neutral and alkaline proteins (Figures 3.5 and 3.6). In
combination with sample prefractionation, proteome coverage was considerably
improved. However, the representation of proteomes by 2‐DE are restricted to
those proteins that are soluble at every stage of analysis including tissue
homogenization, isoelectric focusing and SDS‐PAGE. In order to maximize the
myocardial proteome observed by 2‐DE, Stanley and colleagues examined the
efficiency of different zwitterionic detergents in solubilizing proteins during tissue
extraction as well as IEF (143). The results of this study demonstrate that the
standard detergent CHAPS is a reasonable detergent for 2‐DE but possesses a
decreased ability to solubilize proteins compared to linear sulfobetaines like
ASB‐14 and SB 3‐10. Unfortunately, ASB‐14 in the focusing buffer seems to cause
pronounced horizontal streaking towards the basic end of the IPG strip.
Due to different protein compositions in the accordant subproteomes (water‐
soluble vs. detergent‐soluble, neutral‐acidic vs. basic pIs), the effectiveness of
different protein solubilization protocols for IEF were employed. Of particular
interest was the observation that the choice of detergent allowed for the selective
solubilization of proteins presumably based on their physiochemical properties.
Whereas CHAPS alone was most suitable for the resolution of acidic‐neutral
proteins in pH 4‐7 IPG strips, the combination of CHAPS and ASB‐14 (each 2%)
superiorly solubilized basic proteins (IPG 6‐11). The addition of ASB‐14 to CHAPS
containing IEF buffers has also been reported to be superior for the analysis of
ribosomal and nuclear proteins in very alkaline 2‐DE gels (49). This highlights that
buffers with individual detergent compositions are necessary for IEF of different
protein fractions.
4.1.3 De‐streak business of basic proteins
Whereas 2‐DE optimization of acidic and neutral proteins was a generally quite
uncomplicated procedure, the analysis of basic proteins in alkaline IPG strips is
more challenging. Sample application via cup‐loading is preferable to sample in‐gel

Discussion 79
rehydration when analyzing alkaline proteins (52). The choice of the sample
application point further has a great impact on the gel quality. In general, anodic
cup‐loading sample application is recommended for separation in alkaline regions
above pH 8 (28, 7, 81, 115). On the contrary, Corbett et al. showed that human
cardiac proteins were preferably applied at the cathode (25). For the analysis of
cardiac tissue proteins in alkaline pH regions, cup‐loading as alternative sample
application method was investigated. Comparison of cathodic and anodic sample
application revealed that the latter one performed better in terms of improved
protein coverage and enhanced spot intensity (Figure 3.8). Unfortunately, cup‐
loading is restricted to sample volumes of 100‐150 µl, and a maximum protein
concentration of 100 µg/ 100 µl (51). Larger sample loads can lead to protein
aggregation and precipitation in the sample cup or at the interface between
sample solution and the IPG strip gel. To overcome this restricted protein load a
repetitive refilling of the cup was established (Figure 3.9). This trivial idea actually
allows sample application of semi‐preparative protein loads (at least 2‐fold of the
recommended sample loads).
The problem of non‐specific oxidation, due to the fact that DTT migrates off the
basic part of the IPG strip, can be overcome by a continuous influx of DTT from a
paper wick reservoir at the cathode (59). A less pedestrian and more permanent
strategy is the use of hydroxyethyl disulfide (HED) as de‐streaking agent for first
dimension separation (108). In the present study, replacing DTT by HED
counteracts the phenomenon of pronounced streaking and the appearance of
artificial spots in the alkaline pH range of IPG 6‐11 strips (Figure 3.11). Thus, the
analysis of basic proteins of the cardiac proteome was considerably improved by
the use of IPG 6‐11 zoom gels in combination with repetitive anodic cup‐loading,
and HED as reducing agent to prevent EOF as well as to preserve the reduced state
of proteins during IEF.

80 Discussion
4.2 In search of proteins that cause cardioprotection by
anesthetic‐preconditioning
4.2.1 Evaluation of intrinsic variability of 2‐DE in in vivo
experiments
The natural consequence of separating hundreds of proteins in 2‐DE approaches is
high gel‐to‐gel variability which strongly influences a comparative analysis. To
judge the effect of sample preparation and system error across the different
subproteomes investigated, scatter plot analysis was performed. Despite higher
interventions due to cup‐loading application and repetitive sample load, it is
notable that the mean of the correlation coefficient (Corr) in the experiments for
the basic subproteome was quite similar to the data obtained from the
subproteomes investigated by in‐gel rehydration (Corr 0.898 versus 0.961 and
0.995) (Table 3.2). The respective coefficients of variation (CV) values (26% and
27% for the subproteomes in pH 4‐7, and 40% for pH 6‐11) were also very
favorable when compared to difference gel electrophoresis (DIGE) experiments.
DIGE was developed to overcome limitations in reproducibility as two protein
samples are separately labeled with different fluorescent dyes and then co‐
electrophoresed on the same 2‐DE gel. A multi‐laboratory assay using DIGE and
other single stain experiments reported spots variations of <15% for DIGE, and 20‐
40% for Sypro Ruby and silver respectively (9).
As expected, sample‐to‐sample variation was determined to be greater than the
experimental variance because it is the sum of experimental plus any animal‐to‐
animal protein expression variations. The Corr and CV values for cup‐loading
experiments may appear high (Table 3.2) but to my knowledge there are no other
studies which investigated the reproducibility of this sample application method.
Regarding the analysis of pH 4‐7 gels, the CV values were far better than reported
in other studies dealing with myocardial tissue (88, 53). And in comparison with
reports of cell culture experiments which show CV% values of 31.2% for bacterial
cells, 26% for mammalian tissue cultures, and 46.6% for mammalian primary cell
cultures (98), the in vivo experiments showed comparable reproducibility to in
vitro studies. This highlights that optimizing the 2‐DE procedure in comparative
analyses is crucial for the reliability of the results obtained.

Discussion 81
4.2.2 Implication of differentially expressed proteins for DES‐PC
The present study aimed at identifying protein alterations in the myocardium of
desflurane‐preconditioned rats to contribute to the understanding of
cardioprotection. Prior to introducing large‐scale technologies as powerful tools
for unraveling pathways of complex (patho‐) physiology, hypothesis‐driven
research on a limited number of proteins was conducted, and the results were
cumulated to answer the specific question. By contrast, the new ‐omics studies are
more discovery‐driven and generate a large amount of data that gives the
researcher the opportunity to select targets of interest to be analyzed afterwards.
Application of the microarray technology to an in vitro model of anesthetic
preconditioning (APC) has shown that isoflurane highly modulates gene expression
in the heart (137). Among a huge number of commonly regulated genes (e.g. cell
defense), a pool of protective and antiprotective genes was found to be
differentially regulated in APC. Conversely, the same working group recently
showed in a proteomics approach that isoflurane‐preconditioning (ISO‐PC) did not
induce any significant changes in the protein expression levels of mitochondria,
but instead evoked profound alterations in the phosphorylation pattern (41). This
clearly demonstrates that a study of gene expression can not accurately predict
the embodiment of the respective proteins (2).
Using an optimized gel‐based approach for the analysis of proteomic alterations
during DES‐PC (summarized in chapter 3.1.5), 70 protein spots were found to be
affected in the rat heart (Figure 3.15), indicating a highly general response to DES‐
PC. To ensure statistical significance analysis was restricted to those proteins
which hold a P<0.02 in the ANOVA statistics. In the end, 40 protein spots showed
significant expression changes during the DES‐PC protocol (Table 3.3). Among the
12 identified non‐redundant proteins, eleven were involved in various metabolic
processes (Table 3.4, Figure 3.23). The myocardium is known to tolerate brief
exposure to ischemia by preserving energy levels. The reversible inhibition of
mainly mitochondrial metabolism can serve to prevent the pathologic cascade of
events in ischemia‐reperfusion injury. The proteome alterations found in this study
may therefore account for the cardioprotective benefit of preconditioning.

82 Discussion
4.2.2.1 Cardioprotective mechanism of preconditioning
APC and ischemic preconditioning (IPC) share many fundamental steps (Figure
4.1). Both are thought to be initially induced by stimulation of G‐protein coupled
receptors and subsequent activation of various types of interacting protein
kinases, and by increased formation of nitric oxide and free oxygen radicals. Both
preconditioning stimuli finally prime the opening of sarcolemmal and
mitochondrial KATP channels, thereby constricting Ca2+ overload (for references see
(156, 58)). Ca2+ overload results in mitochondrial dysfunction with depolarization
of the mitochondrial membrane and uncoupling of respiration and oxidative
phosphorylation (1, 35, 42), and the magnitude of these changes correlates with
cell death (34). In this context, the identified proteins will be discussed in the
following.
Figure 4.1: Preconditioning signaling in the early phase of cardioprotection. Simplified scheme of mechanisms involved in ischemic‐ and anesthetic‐induced preconditioning. Ca, sarcolemmal L‐type Ca2+‐channel; KATP, sarco‐and mitochondrial KATP channels; PLC, phospholipase C; PIP2, phosphatidylinositol biphosphate; IP3, inositoltriphosphate; SR, sarcoplasmic reticulum; NO, nitric oxide; NOS, NO synthase; DAG, diacylglycerol; PKC, protein kinase C; ROS, reactive oxygen species. Figure was adapted from (168).

Discussion 83
4.2.2.2 Metabolic inhibition as mechanism of anesthetic preconditioning
Aconitase‐2
Aconitase‐2 (Aco‐2; EC 4.1.2.3) is an iron‐sulfur protein that catalyses the stereo‐
specific isomerization of citrate to isocitrate via cis‐aconitate in the Krebs cycle, a
reaction essential to normal metabolic function. Aco‐2 is particularly susceptible to
oxidation at the Fe‐S cluster in its active site. Oxidatively modified proteins are
generally dysfunctional, losing catalytical or structural integrity. Inactivation by
Fe‐S oxidation may block normal electron flow to oxygen, leading to an
accumulation of reduced metabolites such as NADH. Aco‐2 has been implicated in
oxidative stress regulation and cardiac ischemia‐reperfusion injury (17).
Aco‐2 is represented by multiple pI variants (Figure 3.18), whereby only one spot
variant was found to be differentially regulated during DES‐PC (Table 3.4). In an
effort to understand this specific regulation, the possibility of post‐translational
modification (PTM) was investigated. Interestingly, Aco‐2 did not show any
phosphorylation pattern (Figure 3.19) but was doubly oxidized at tryptophan in
control but not DES‐PC hearts (Figure 3.21). No relationship was observed
between the tryptophan modification and methionine oxidation, a known artifact
of sample handling (120). The specificity of this response indicates that these
changes are not random events that may arise from nonspecific oxidation, but
rather are targeted effects. In any case the ratio between unmodified and
tryptophan oxidized peptides was quite small, thus this oxidation may be not
regulatory per se. We only investigated the protein spot which was differentially
regulated during DES‐PC, thus it would be of general interest if the other isoforms
of Aco‐2 show tryptophan modification to a greater extend.
Aspartate aminotransferases
The only protein isoforms with increased abundance during DES‐PC were found to
be aspartate aminotransferases (AST; EC 2.6.1.1) (Table 3.4). AST is a pyridoxal
phosphate‐dependent enzyme which exists in cytoplasmic and inner‐membrane
mitochondrial forms, AST‐1 and AST‐2, respectively. AST plays a role in amino acid
metabolism and the urea and Krebs cycles where it catalyzes the conversion of
aspartate and alpha‐ketoglutarate to oxaloacetate and glutamate.
Cytosolic AST‐1 participates in the malate‐aspartate shuttle which exchanges
cytoplasmic malate for mitochondrial aspartate and allows the transport of

84 Discussion
reducing equivalents across the inner mitochondrial membrane. During ischemia
reduced equivalents become accumulated and lead to intracellular acidosis.
Enhanced AST‐1 level during DES‐PC may contribute to cardioprotection by
triggering post‐ischemic removal and oxidation of NADH. The increase of AST‐1
seems to be specific for anesthetic preconditioning as neither IPC, nor
pharmacological PC with resveratrol, adenosine or diazoxide reported changes in
its expression so far (163, 12, 4). Regulation due to desflurane itself can be
negated by the proteomic study of Kalenka et al. who did not document any
changes of AST‐1 expression after desflurane anesthesia (65).
During DES‐PC, multiple pI variants of mitochondrial AST (AST‐2) were detected in
the cytosolic fraction (Figure 3.18). From the current data one cannot exclude that
the high amount of AST‐2 in the cytosolic fraction results from an inappropriate
sample fractionation protocol as we did not finish the analysis of the alkaline pH
region for the detergent‐soluble fraction so far. However, in IR injury AST‐2 was
also found to be significantly increased in the cytosolic fraction, and dramatically
decreased in heart mitochondria, respectively (110, 41). The protein abundance
changes were only detected for the two spots at the acidic end of the chain. Both
isoforms were found to be maximal expressed after the second desflurane
administration, possibly indicating an increase in protein phosphorylation. But
using ProQ Diamond phosphoprotein stain, no phosphorylation was detectable in
protein spots of AST‐2 in the time course of DES‐PC (Figure 3.19). Due to the low
sequence coverage of tryptophan‐containing peptides we could not investigate
oxidative modifications like found for Aco‐2. At present it is therefore not possible
to state any contribution of phosphorylation or oxidation to the multiple protein
isoforms of AST‐2, nor can be concluded that specific protein spot isoforms
exclusively may affect the preconditioning effect.
Carbonic anhydrases
Carbonic anhydrases (CA; EC 4.2.1.1) are zinc‐containing enzymes that catalyze the
reversible reaction between carbon dioxide hydration and bicarbonate
dehydration to maintain acid‐base balance in blood and other tissues. They have
essential roles in facilitating the transport of carbon dioxide and protons in the
intracellular space, across biological membranes and in the layers of the
extracellular space. By increasing the movement of protons, CA can dissipate pH
gradients, thereby helping the cell to maintain a uniform intracellular pH. As a

Discussion 85
result, the inhibition of CA will lead to intracellular acidosis that could reduce
muscle contractility and calcium handling.
Two of the 15 mammalian CA isozymes (CAI and CAII) were found to be
significantly reduced in the time course of DES‐PC (Table 3.3), possibly provoking
mild intracellular acidosis. DES‐PC may thus induce an adaptive mechanism to
maintain proper calcium homeostasis during upcoming severe periods of
acidification, such as prolonged ischemia during myocardial infarction. In
accordance with this hypothesis, hypoxic preconditioning was found to improve
contractility, Ca2+ handling and cell recovery during subsequent hypoxic insult (77).
Intracellular acidosis was shown to activate p38 mitogen activated protein kinase
(MAPK) that constitutes a mediator to deliver hypoxia‐induced apoptotic signal in
cardiomyocytes (169). Our group recently studied the regulation of different
MAPKs during DES‐PC but did not detect any significant increase in p38 MAPK
phosphorylation in the course of the regimen (157). Da Silva and co‐workers also
could not demonstrate an involvement of p38 MAPK in isoflurane‐induced
preconditioning in the isolated rat heart (140). On the contrary, in hyperglycemia
hearts where DES‐PC is abolished, phosphorylation of p38 MAPK was significantly
increased (157). These studies suggest that p38 MAPK inactivation may play a role
in APC‐induced cardioprotection. The reduced CAI and CAII abundances during
DES‐PC may therefore represent a cardioprotective action by establishing a mild
acidosis that in turn renders the myocardium more resistant to ischemia‐
reperfusion injury.
Lactate dehydrogenase B
Lactate dehydrogenase B (LDH‐B; EC 1.1.1.27) is an enzyme that participates in the
final step of anaerobic glycolysis. During ischemia it converts pyruvate to lactate
with concomitant interconversion of NADH and NAD+ resulting in the production
and intracellular accumulation of lactate and H+. Lactate is exported with H+ via the
lactate/H+ co‐transporter. H+ efflux also occurs via the Na+/H+ exchanger, resulting
in high intracellular Na+ concentrations that have been related to Ca2+ influx and
ischemic damage. IPC was found to reduce post‐ischemic lactate levels of the heart
to ~70% of values in non‐preconditioned hearts (165). During DES‐PC we detected
decreased LDH‐B levels at the end of the preconditioning regimen (Table 3.3). As
LDH can be inactivated by ROS (103), and ROS mediates DES‐PC in the human
heart (57), DES‐PC might prepare for upcoming ischemic events by depressing

86 Discussion
lactate levels in the cytosol. This probably regulates the lactate/pyruvate ratio
which influences the NADH/NAD+ ratio in the cytosol. In accordance with this
hypothesis, metabolic modulation of the cytosolic NADH/NAD+ ratio by pyruvate
was shown to protect the heart from ischemia–reperfusion injury (112).
Methylmalonate‐semialdehyde dehydrogenase
Methylmalonate‐semialdehyde dehydrogenase (MMSDH; EC 1.2.1.27) belongs to
the aldehyde dehydrogenases family of proteins. It is located in the mitochondrial
matrix space and catalyzes the irreversible oxidative decarboxylation of malonate
semialdehyde and methylmalonate semialdehyde to acetyl‐CoA and propionyl‐
CoA, respectively (69). Acetyl‐CoA is a central metabolic intermediate in the Krebs
cycle and a substrate of fatty acyl‐CoA in fatty acid synthesis. Propionyl‐CoA is also
fed into the Krebs cycle after conversion to succinyl‐CoA. Suppressed MMSDH
expression was demonstrated to alter the concentration of Krebs cycle
metabolites in rice, suggesting that acetyl‐CoA was reduced by decreased amounts
of MMSDH (148).
During DES‐PC, MMSDH was found to be decreased in abundance (Table 3.3).
MMSDH was demonstrated to decrease dramatically under oxidative stress (145).
Furthermore, MMSDH was found to be oxidized following hepatic ischemia‐
reperfusion injury (99). Thus increased degradation of oxidatively modified
MMSDH may contribute to the reduced level of MMSDH during ischemia.
During ischemia, NADH increases because O2 shortage limits NADH oxidation at
the electron transport chain. MMSDH is quite sensitive to inhibition by NADH (47),
thus an increase in the mitochondrial NADH/NAD+ ratio may inhibit MMSDH.
Interestingly, both IPC and SEVO‐PC have been shown to reversibly increase NADH
(127). DES‐PC may mimic ischemic metabolic responses by enhancing NADH/NAD+
ratio and therefore inhibit MMSDH. But enzyme inhibition does not necessarily
correlate with decreased protein expression.
Inorganic pyrophosphatase
Inorganic pyrophosphatase (PPA2; EC 3.6.1.1) catalyzes the hydrolysis of inorganic
pyrophosphate (PPi) to two orthophosphates, and can be considered to be the
simplest possible model of biological utilization of high‐energy phosphates.
Compared to control levels, PPA2 was significantly decreased during the whole
preconditioning protocol (Table 3.3), possibly leading to accumulation of PPi in the

Discussion 87
cytosol. During ischemia, when cellular ATP pools become diminished and enhance
the open probability of the sarcolemmal KATP channel, the preferential utilization
of inorganic pyrophosphate (PPi) as an energy donor may then counteract Ca2+
overload. Thus accumulated PPi may be a metabolic adaptation of the
preconditioned myocardium to subsequent environmental extremes like ischemia
that cause depressed ATP pools.
Complex I and III subunits of the respiratory chain
Previous studies reported a profound attenuation of the mitochondrial electron
transport by volatile anesthetics. The inhibition of the electron transfer leads to an
increased generation of ROS. ROS participate in the process of APC, which in turn
trigger the opening of KATP channels and prevent Ca2+ overload in the mitochondria
(146, 100, 105, 136). In accordance with that, a down‐regulation of several
proteins involved in electron transport chain was found (Table 3.4), including
NADH‐ubiquinone oxidoreductase 75 kDa subunit (NDUFS1) and NADH‐
dehydrogenase ubiquinone flavoprotein 1 (NDUFV1) of complex I (EC 1.6.5.3), and
ubiquinol‐cytochrome c reductase core protein 1 (UQCRC1) of complex III (EC
1.10.2.2). All three enzymes showed the same modulation during DES‐PC, namely
a dramatic decrease directly after the onset of the preconditioning protocol.
Decrease in the level of NDUFS1 has been found to result in reduced electron
transport and ROS generation (62).
Reduction of complex I would be expected to decrease the rates of NADH
oxidation in the mitochondria. During DES‐PC, the soluble complex I subunits
NDUFS1 and NDUFV1 showed decrease levels, possibly contributing to
cardioprotection by regulating NADH/NAD+ redox balance. NDUFS1 showed
divergent values for both Mr and pI compared to the calculated values (Table 3.4),
suggesting a shift due to protein degradation or post‐translational modification.
Studying the impact of oxidative stress on mitochondria, NDUFS1 was found to be
decreased in cells exposed to H202 (145). Recently, NDUFS1 was demonstrated to
undergo dioxidation of tryptophan (96). The flavoprotein NDUFV1 was also found
to be oxidatively modified (159). Protein oxidation can lead to proteolytic
breakdown of the modified protein (32). Thus NDUFS1 and NDUFV1 possibly did
here undergo oxidative modification that in turn evoked their degradation during
DES‐PC. This observation supports the hypothesis that cardioprotection is
mediated by reversible metabolic shut‐down (18).

88 Discussion
Complex III of the respiratory chain represents the convergence point for electrons
entering the Q cycle. Its partial inhibition is discussed to account for the
cardioprotective properties of volatile anesthetics. In the present study we
identified differential expression of the subunit UQCRC1 which is represented by
multiple pI variants in the 2‐DE pattern (Figure 3.18). During DES‐PC, UQCRC1 was
only altered at the most acidic protein spot, showing a decreased abundance after
the onset of the preconditioning protocol. As an acidic shift in pI often is consistent
with protein phosphorylation we investigated the phosphorylation status of
UQCRC1 using a phosphospecific protein stain (ProQ Diamond). Preliminary results
indicated different phosphorylation pattern for its spot chain (132). Interestingly,
the changes in protein abundance of the most acidic pI variant of UQCRC1 (spot
#501) seem to occur with concomitant changes in phosphorylation. This selective
dephosphorylation may contribute to a mild reversible suppression of the
respiratory chain that possibly attenuates oxygen consumption. This mimicry of an
ischemic situation during the trigger phase of DES‐PC may account for the
cardioprotective benefit of desflurane during severe ischemia‐reperfusion (IR)
events.
Albumin
Albumin is a highly abundant protein and produces profound spots in 2‐DE gels but
was just identified as a faint spot at a position on the gel that does not fit to its
theoretical pI and Mr (Table 3.4). Like postulated for NDUFS1, this modification
might be the result of protein degradation. According to that, Albumin was found
to be decreased during DES‐PC. Interestingly, ischemia‐modified albumin (IMA) has
been shown to be a marker of myocardial ischemia (6). In the presence of
myocardial ischemia, structural changes take place in the N‐terminus of the
protein which reduces its binding capacity, possibly, in part, as a result of exposure
to ROS. As DES‐PC is mediated by ROS, this truncated isoform of albumin possibly
represents IMA. As no sequence data entry is available for IMA so far, no
alignment of peptide sequences can clarify this question.
Discussion 89
4.2.3 Proteome profiles during DES‐PC reveal different expression
trends
The experiments in this thesis were especially designed to analyze rapid proteomic
alterations at different time/treatment points during the preconditioning regimen
(Figure 2.1). Within 30 minutes of the preconditioning protocol, four different
treatment samples were taken to track possible cardioprotective protein isoforms.
In general most proteins seem to have a uniform response to the DES‐PC protocol,
being most distinctive after the second desflurane administration (Table 3.3). This
is in accordance with the observation that DES‐PC against ischemia‐reperfusion
injury in rabbits depends on timing and the threshold of repetitive application (84,
141). This evidence may explain why Feng et al. (2008) were not able to detect any
protein expression change after one‐time isoflurane exposure for preconditioning
(41).
Despite the fact that the second administration of desflurane evokes greater
effects on the cardiac proteome (Table 3.3), several different modulation patterns
were observed for the identified proteins (Figure 3.22). Like it is expected during
bioenergetics disturbances, metabolic enzymes were mainly decreased following
DES‐PC. It is possible that the down‐regulation of proteins related to energy‐
dependant cellular functions results in a favorable change in the myocardial
oxygen supply and demand relation. Of these, three replied directly after one‐time
desflurane exposure (NDUFV1, CAI and CAII) and two showed an exclusive
response to the repetitive administration of desflurane (Aco‐2 and MMSDH). The
remaining protein isoforms with decreased abundance (NDUFS1, PPA2, UQCRC1,
LDH‐B and ALB) show random alterations during the DES‐PC protocol. The increase
in protein isoforms of AST was nearly to the same extend (determined by their
expression ratios), possibly indicating a regulation by a shared signaling pathway.
Interestingly, protein differences appeared to be the result of isoelectric point
shifts most probably resulting from chemical modifications, and molecular mass
shifts resulting from proteolytic or physical fragmentation. This is consistent with
the hypothesis that the time course for the onset of preconditioning associated
with cardioprotection is too brief to be mediated by large changes to gene/protein
expression, but rather that more subtle, rapid and potentially transient changes
are occurring to the proteome

90 Discussion
It is not remarkable that early alterations in protein abundance (within 30 minutes
of preconditioning) were mainly observed for proteins associated with metabolic
mechanisms (11/12 identified proteins). Since the mammalian heart has high
energy requirements physiological disturbances evoked by preconditioning would
induce a fast series of alterations in metabolic active proteins which finally may
contribute to the ischemic tolerance during myocardial infarction. But the results
of the present study clearly demonstrate that DES‐PC associated proteins are not
exclusively altered in their expression level but also reflect changes in protein
isoforms due to post‐translational modifications and degradation. But not all
protein modifications will have detrimental or measurable effects on function. In
summary, DES‐PC seems to be a complex and dynamic process that exhibits
manifold proteomic changes.
4.3 Challenges in interpreting data from proteomic
studies
In recent years a large number of proteomics studies for various diseases were
conducted such as for cancer, neurodegenerative and cardiovascular disorders. A
typical 2‐DE based proteomics study investigating differential expression features
400‐1500 spots and reports between 10 and 40 identified up‐ and down‐regulated
proteins. The availability of these huge data sets with a large number of
differentially expressed proteins now reveals the existence of a hit parade of
repeatedly identified differentially expressed proteins (116). To explore this
phenomenon the occurrence of individual differentially expressed proteins in 2‐DE
experiment reports were quantified performing a meta‐analysis. Compiling
proteins identified from human, mouse and rat tissues published in the years
2004‐2006 in the journal Proteomics revealed a TOP 15 list that includes mostly
glycolytic enzymes, heat shock, and stress proteins as well as cytoskeletal
components. Studying the literature for cardiovascular proteomics, one also
stumbles over nearly the same protein expression changes. Thus when
interpreting the results of the current proteomics experiment in the context of the
literature, the question arose: “Are these the key protein changes in metabolic
enzymes responsible for cardioprotection, or are they compensatory changes
which help the mitochondrion to survive?” In context to Darwin’s theory, these

Discussion 91
protein changes are probably less specific but rather demonstrate a synergistic
effect of cellular and molecular targets to adapt to metabolic stress. As such,
understanding the protein (isoform) change of the different members of a given
pathway is of major importance.
In the present study, several proteins appeared as multiple pI isoforms (Aco‐2,
AST‐2, UQCRC1) likely due to PTMs, or were located at different positions in the
gel (NDUFS1, ALB) possibly induced by protein degradation. Although all spots are
isoforms of the same protein, PTMs or degradations can alter the function or
localization of the protein. The protein modifications found in this study may
contribute to the triggering phase of DES‐PC by altering the proteins function. Thus
protein modifications may play a more important role in the triggering phase than
cellular protein turnover. It can be expected that further studies of post‐
translational isoforms of certain proteins will provide important information to
expand the understanding of the mechanisms of cardiac preconditioning.
Some limitations of current proteomic methodology reflect on the ability of gel‐
based approaches to aid in understanding a complex physiological issue. First, to
detect proteins on gels and to identify them by mass spectrometry, a minimum
amount of protein is required. It has been estimated that abundant proteins,
including structural proteins and metabolic enzymes, are expressed in the range of
from 105 to 106 molecules per cell, while lower abundant proteins like protein
kinases and transcription factors may be expressed with less than 100 molecules
per cell. Thus we were not able to detect any targets known to contribute to the
cardioprotection by DES‐PC, like protein kinase C epsilon or extracellular signal‐
regulated kinase 1/2 (152). Secondly, there are also considerable difficulties in
separating and identifying membrane proteins by 2‐DE. Despite the efforts to
optimize sample preparation and IEF, we probably did not fully solubilize highly
hydrophobic membrane proteins. This may explain why the two prominent targets
of the current preconditioning model, the mitochondrial KATP channel and the
permeability transition pore, have not been identified in this approach. Third,
many of the proteins in this study that were not evaluated due to the strict
selection made for differential expression, are likely to play an unforeseen role in
the mechanisms of APC. Thus we cannot exclude that the search for proteins that
is based on all‐ or nonexpression differences yields an incomplete picture.

92 Discussion
4.4 Conclusion
Like other proteins, Aco‐2, complex I and III proteins and ASTs function in the
context of complex networks; therefore, the functional impact of metabolic active
enzymes stretches well beyond the scope of the current study. It should therefore
be reminded that extrapolation from alterations in protein concentration to
changes in enzyme activities have to be considered with great care. However, the
results of the current study emphasize the extent of what remains to be
discovered about the widespread effects of APC on the cardiac proteome. As such,
proteomic analyses have the potential to identify previously uncharacterized
effectors of such pathways and, as demonstrated in the current study, they can
lead to new information about how those effectors might contribute to
physiologically important phenotypes.
To be sure that the “sets of changes” provide a true description of the mechanism
taking place during DES‐PC, any candidate of this proteomics approach will need to
be confirmed by several independent experiments. Classical biochemical methods
like Western Blot or immunohistochemistry are the first choice to prove protein
expression changes. To further investigate differential protein abundance, other
PTMs like glycosylation, acetylation, deamidation and S‐nitrosylation have to be
considered. Experiments investigating protein‐protein interactions will bring the
identified proteins into relation, and possibly differentiate the candidates into
potential triggers or secondary effectors of anesthetic preconditioning. To turn
data into evidence functional verification will be necessary, i.e. by the use of
inhibitor studies or transgenic animals. Finally, in vivo experiments with animals of
cardiovascular disorders have to be carried out to address clinically relevant
situations.
In summary, initial data obtained by broad‐based proteomics are the framework
upon which downstream experimental decisions are based. The next level of
analysis already focuses on the apparent key role of the mitochondria in
preconditioning, and special emphasis is placed on the analysis of post‐
translational modifications of protein spot isoforms.

Literature 93
5 Literature

94 Literature
1. Altschuld R. A. 1996. Intracellular calcium regulatory systems during ischemia and reperfusion. EXS 76:87‐97.
2. Anderson L., and J. Seilhamer. 1997. A comparison of selected mRNA and protein abundances in human liver. Electrophoresis 18:533‐537.
3. Anderson N. G. 2010. Adventures in clinical chemistry and proteomics: a personal account. Clin. Chem 56:154‐160.
4. Arrell D. K., S. T. Elliott, L. A. Kane, Y. Guo, Y. H. Ko, P. L. Pedersen, J. Robinson, M. Murata, A. M. Murphy, E. Marbán, and J. E. Van Eyk. 2006. Proteomic analysis of pharmacological preconditioning: novel protein targets converge to mitochondrial metabolism pathways. Circ. Res 99:706‐714.
5. Bak‐Jensen K. S., S. Laugesen, P. Roepstorff, and B. Svensson. 2004. Two‐dimensional gel electrophoresis pattern (pH 6‐11) and identification of water‐soluble barley seed and malt proteins by mass spectrometry. Proteomics 4:728‐742.
6. Bar‐Or D., E. Lau, and J. V. Winkler. 2000. A novel assay for cobalt‐albumin binding and its potential as a marker for myocardial ischemia‐a preliminary report. J Emerg Med 19:311‐315.
7. Barry R. C., B. L. Alsaker, J. F. Robison‐Cox, and E. A. Dratz. 2003. Quantitative evaluation of sample application methods for semipreparative separations of basic proteins by two‐dimensional gel electrophoresis. Electrophoresis 24:3390‐3404.
8. Baxter G. F., M. S. Marber, V. C. Patel, and D. M. Yellon. 1994. Adenosine receptor involvement in a delayed phase of myocardial protection 24 hours after ischemic preconditioning. Circulation 90:2993‐3000.
9. Bech‐Serra J., A. Borthwick, N. Colomé, P. Consortium, J. Albar, M. Wells, M. Sánchez del Pino, and F. Canals. 2009. A Multi‐Laboratory Study Assessing Reproducibility of a 2D‐DIGE Differential Proteomic Experiment. J Biomol Tech 20:293‐296.
10. Bein B., J. Renner, D. Caliebe, R. Hanss, M. Bauer, S. Fraund, and J. Scholz. 2008. The effects of interrupted or continuous administration of sevoflurane on preconditioning before cardio‐pulmonary bypass in coronary artery surgery: comparison with continuous propofol. Anaesthesia 63:1046‐1055.
11. Belhomme D., J. Peynet, M. Louzy, J. M. Launay, M. Kitakaze, and P. Menasché. 1999. Evidence for preconditioning by isoflurane in coronary artery bypass graft surgery. Circulation 100:340‐344.
12. Bezstarosti K., S. Das, J. M. J. Lamers, and D. K. Das. 2006. Differential proteomic profiling to study the mechanism of cardiac pharmacological preconditioning by resveratrol. J. Cell. Mol. Med 10:896‐907.
13. Bradford M. M. 1976. A rapid and sensitive method for the quantitation of microgram quantities of protein utilizing the principle of protein‐dye binding. Anal. Biochem 72:248‐254.
14. Bukhari E. A., I. B. Krukenkamp, P. G. Burns, G. R. Gaudette, J. J. Schulman, M. R. al‐Fagih, and S. Levitsky. 1995. Does aprotinin increase the myocardial damage in the setting of ischemia and preconditioning? Ann. Thorac. Surg 60:307‐310.
15. Buljubasic N., J. Marijic, D. F. Stowe, J. P. Kampine, and Z. J. Bosnjak. 1992. Halothane reduces dysrhythmias and improves contractile function after global hypoperfusion in isolated hearts. Anesth. Analg 74:384‐394.
16. Buljubasic N., D. F. Stowe, J. Marijic, D. L. Roerig, J. P. Kampine, and Z. J. Bosnjak. 1993. Halothane reduces release of adenosine, inosine, and lactate with ischemia and reperfusion in isolated hearts. Anesth. Analg 76:54‐62.
17. Bulteau A., K. C. Lundberg, M. Ikeda‐Saito, G. Isaya, and L. I. Szweda. 2005. Reversible redox‐dependent modulation of mitochondrial aconitase and proteolytic

Literature 95
activity during in vivo cardiac ischemia/reperfusion. Proc. Natl. Acad. Sci. U.S.A 102:5987‐5991.
18. Burwell L. S., S. M. Nadtochiy, and P. S. Brookes. 2009. Cardioprotection by metabolic shut‐down and gradual wake‐up. Journal of Molecular and Cellular Cardiology 46:804‐810.
19. Cason B. A., A. K. Gamperl, R. E. Slocum, and R. F. Hickey. 1997. Anesthetic‐induced preconditioning: previous administration of isoflurane decreases myocardial infarct size in rabbits. Anesthesiology 87:1182‐1190.
20. Chen C., G. R. Budas, E. N. Churchill, M. Disatnik, T. D. Hurley, and D. Mochly‐Rosen. 2008. Activation of aldehyde dehydrogenase‐2 reduces ischemic damage to the heart. Science 321:1493‐1495.
21. Chinnasamy G., and C. Rampitsch. 2006. Efficient solubilization buffers for two‐dimensional gel electrophoresis of acidic and basic proteins extracted from wheat seeds. Biochim. Biophys. Acta 1764:641‐644.
22. Clark B. N., and H. B. Gutstein. 2008. The myth of automated, high‐throughput two‐dimensional gel analysis. Proteomics 8:1197‐1203.
23. Clarke S. J., I. Khaliulin, M. Das, J. E. Parker, K. J. Heesom, and A. P. Halestrap. 2008. Inhibition of mitochondrial permeability transition pore opening by ischemic preconditioning is probably mediated by reduction of oxidative stress rather than mitochondrial protein phosphorylation. Circ. Res 102:1082‐1090.
24. Cope D. K., W. K. Impastato, M. V. Cohen, and J. M. Downey. 1997. Volatile anesthetics protect the ischemic rabbit myocardium from infarction. Anesthesiology 86:699‐709.
25. Corbett J. M., M. J. Dunn, A. Posch, and A. Görg. 1994. Positional reproducibility of protein spots in two‐dimensional polyacrylamide gel electrophoresis using immobilised pH gradient isoelectric focusing in the first dimension: an interlaboratory comparison. Electrophoresis 15:1205‐1211.
26. Cordwell S. J., D. J. Basseal, B. Bjellqvist, D. C. Shaw, and I. Humphery‐Smith. 1997. Characterisation of basic proteins from Spiroplasma melliferum using novel immobilised pH gradients. Electrophoresis 18:1393‐1398.
27. Corthals G. L., V. C. Wasinger, D. F. Hochstrasser, and J. C. Sanchez. 2000. The dynamic range of protein expression: a challenge for proteomic research. Electrophoresis 21:1104‐1115.
28. Cortón M., G. Villuendas, J. I. Botella, J. L. San Millán, H. F. Escobar‐Morreale, and B. Peral. 2004. Improved resolution of the human adipose tissue proteome at alkaline and wide range pH by the addition of hydroxyethyl disulfide. Proteomics 4:438‐441.
29. Cribier A., L. Korsatz, R. Koning, P. Rath, H. Gamra, G. Stix, S. Merchant, C. Chan, and B. Letac. 1992. Improved myocardial ischemic response and enhanced collateral circulation with long repetitive coronary occlusion during angioplasty: a prospective study. J. Am. Coll. Cardiol 20:578‐586.
30. De Hert S. G., S. Cromheecke, P. W. ten Broecke, E. Mertens, I. G. De Blier, B. A. Stockman, I. E. Rodrigus, and P. J. Van der Linden. 2003. Effects of propofol, desflurane, and sevoflurane on recovery of myocardial function after coronary surgery in elderly high‐risk patients. Anesthesiology 99:314‐323.
31. De Hert S. G., B. Preckel, M. W. Hollmann, and W. S. Schlack. 2009. Drugs mediating myocardial protection. Eur J Anaesthesiol 26:985‐995.
32. Dean R. T., S. Fu, R. Stocker, and M. J. Davies. 1997. Biochemistry and pathology of radical‐mediated protein oxidation. Biochem. J 324 ( Pt 1):1‐18.
33. Deutsch E., M. Berger, W. G. Kussmaul, J. W. Hirshfeld, H. C. Herrmann, and W. K.

96 Literature
Laskey. 1990. Adaptation to ischemia during percutaneous transluminal coronary angioplasty. Clinical, hemodynamic, and metabolic features. Circulation 82:2044‐2051.
34. Di Lisa F., and P. Bernardi. 1998. Mitochondrial function as a determinant of recovery or death in cell response to injury. Mol. Cell. Biochem 184:379‐391.
35. Doliba N. M., N. M. Doliba, Q. Chang, A. M. Babsky, K. Wroblewski, B. H. Natelson, and M. D. Osbakken. 1999. Mitochondrial oxidative phosphorylation in heart from stressed cardiomyopathic hamsters. J. Mol. Cell. Cardiol 31:543‐553.
36. Dunn M. Detection of proteins in polyacrylamide gels by silver staining. In The Protein Protocols Handbook, 2nd ed. Humana Press Inc.
37. Dyballa N., and S. Metzger. 2009. Fast and sensitive colloidal coomassie G‐250 staining for proteins in polyacrylamide gels. J Vis Exp.
38. Ebel D., J. Müllenheim, H. Südkamp, T. Bohlen, J. Ferrari, R. Huhn, B. Preckel, and W. Schlack. 2004. Role of tyrosine kinase in desflurane‐induced preconditioning. Anesthesiology 100:555‐561.
39. Eisen A., E. Z. Fisman, M. Rubenfire, D. Freimark, R. McKechnie, A. Tenenbaum, M. Motro, and Y. Adler. 2004. Ischemic preconditioning: nearly two decades of research. A comprehensive review. Atherosclerosis 172:201‐210.
40. Evans G., C. H. Wheeler, J. M. Corbett, and M. J. Dunn. 1997. Construction of HSC‐2DPAGE: a two‐dimensional gel electrophoresis database of heart proteins. Electrophoresis 18:471‐479.
41. Feng J., M. Zhu, M. C. Schaub, P. Gehrig, B. Roschitzki, E. Lucchinetti, and M. Zaugg. 2008. Phosphoproteome analysis of isoflurane‐protected heart mitochondria: phosphorylation of adenine nucleotide translocator‐1 on Tyr194 regulates mitochondrial function. Cardiovasc. Res 80:20‐29.
42. Ferrari R. 1996. The role of mitochondria in ischemic heart disease. J. Cardiovasc. Pharmacol 28 Suppl 1:S1‐10.
43. Fert‐Bober J., R. S. Basran, J. Sawicka, and G. Sawicki. 2008. Effect of duration of ischemia on myocardial proteome in ischemia/reperfusion injury. Proteomics 8:2543‐2555.
44. Fleisher L. A., J. A. Beckman, K. A. Brown, H. Calkins, E. L. Chaikof, E. Chaikof, K. E. Fleischmann, W. K. Freeman, J. B. Froehlich, E. K. Kasper, J. R. Kersten, B. Riegel, J. F. Robb, S. C. Smith, A. K. Jacobs, C. D. Adams, J. L. Anderson, E. M. Antman, C. E. Buller, M. A. Creager, S. M. Ettinger, D. P. Faxon, V. Fuster, J. L. Halperin, L. F. Hiratzka, S. A. Hunt, B. W. Lytle, R. Nishimura, J. P. Ornato, R. L. Page, B. Riegel, L. G. Tarkington, and C. W. Yancy. 2007. ACC/AHA 2007 Guidelines on Perioperative Cardiovascular Evaluation and Care for Noncardiac Surgery: Executive Summary: A Report of the American College of Cardiology/American Heart Association Task Force on Practice Guidelines (Writing Committee to Revise the 2002 Guidelines on Perioperative Cardiovascular Evaluation for Noncardiac Surgery) Developed in Collaboration With the American Society of Echocardiography, American Society of Nuclear Cardiology, Heart Rhythm Society, Society of Cardiovascular Anesthesiologists, Society for Cardiovascular Angiography and Interventions, Society for Vascular Medicine and Biology, and Society for Vascular Surgery. J. Am. Coll. Cardiol 50:1707‐1732.
45. Fountoulakis M., B. Takács, and H. Langen. 1998. Two‐dimensional map of basic proteins of Haemophilus influenzae. Electrophoresis 19:761‐766.
46. Frässdorf J., A. Borowski, D. Ebel, P. Feindt, M. Hermes, T. Meemann, R. Weber, J. Müllenheim, N. C. Weber, B. Preckel, and W. Schlack. 2009. Impact of preconditioning protocol on anesthetic‐induced cardioprotection in patients having

Literature 97
coronary artery bypass surgery. J. Thorac. Cardiovasc. Surg 137:1436‐1442, 1442.e1‐2.
47. Goodwin G. W., P. M. Rougraff, E. J. Davis, and R. A. Harris. 1989. Purification and characterization of methylmalonate‐semialdehyde dehydrogenase from rat liver. Identity to malonate‐semialdehyde dehydrogenase. J. Biol. Chem 264:14965‐14971.
48. Görg A., G. Boguth, C. Obermaier, and W. Weiss. 1998. Two‐dimensional electrophoresis of proteins in an immobilized pH 4‐12 gradient. Electrophoresis 19:1516‐1519.
49. Görg A., C. Obermaier, G. Boguth, A. Csordas, J. J. Diaz, and J. J. Madjar. 1997. Very alkaline immobilized pH gradients for two‐dimensional electrophoresis of ribosomal and nuclear proteins. Electrophoresis 18:328‐337.
50. Görg A., C. Obermaier, G. Boguth, and W. Weiss. 1999. Recent developments in two‐dimensional gel electrophoresis with immobilized pH gradients: wide pH gradients up to pH 12, longer separation distances and simplified procedures. Electrophoresis 20:712‐717.
51. Görg A. 2004. 2‐D Electrophoresis, Principles and Methods, 3rd ed. GE Healthcare Limited.
52. Görg A., W. Weiss, and M. J. Dunn. 2004. Current two‐dimensional electrophoresis technology for proteomics. Proteomics 4:3665‐3685.
53. Grussenmeyer T., S. Meili‐Butz, T. Dieterle, E. Traunecker, T. P. Carrel, and I. Lefkovits. 2008. Quantitative proteome analysis in cardiovascular physiology and pathology. I. Data processing. J. Proteome Res 7:5211‐5220.
54. Guillonneau F., V. Labas, C. Auvin, and D. Praseuth. 2001. A reliable and simple method for two‐dimensional electrophoresis and identification of HeLa nuclear alkaline nucleic acid‐binding proteins using immobilized pH gradient. Electrophoresis 22:4391‐4403.
55. Guo Y., W. J. Wu, Y. Qiu, X. L. Tang, Z. Yang, and R. Bolli. 1998. Demonstration of an early and a late phase of ischemic preconditioning in mice. Am. J. Physiol 275:H1375‐1387.
56. Hanouz J., A. Yvon, M. Massetti, O. Lepage, G. Babatasi, A. Khayat, H. Bricard, and J. Gérard. 2002. Mechanisms of desflurane‐induced preconditioning in isolated human right atria in vitro. Anesthesiology 97:33‐41.
57. Hanouz J., L. Zhu, S. Lemoine, C. Durand, O. Lepage, M. Massetti, A. Khayat, B. Plaud, and J. Gérard. 2007. Reactive oxygen species mediate sevoflurane‐ and desflurane‐induced preconditioning in isolated human right atria in vitro. Anesth. Analg 105:1534‐1539.
58. Hausenloy D. J., and D. M. Yellon. 2009. Preconditioning and postconditioning: underlying mechanisms and clinical application. Atherosclerosis 204:334‐341.
59. Hoving S., B. Gerrits, H. Voshol, D. Müller, R. C. Roberts, and J. van Oostrum. 2002. Preparative two‐dimensional gel electrophoresis at alkaline pH using narrow range immobilized pH gradients. Proteomics 2:127‐134.
60. Hunzinger C., W. Wozny, G. P. Schwall, S. Poznanović, W. Stegmann, H. Zengerling, R. Schoepf, K. Groebe, M. A. Cahill, H. D. Osiewacz, N. Jägemann, M. Bloch, N. A. Dencher, F. Krause, and A. Schrattenholz. 2006. Comparative profiling of the mammalian mitochondrial proteome: multiple aconitase‐2 isoforms including N‐formylkynurenine modifications as part of a protein biomarker signature for reactive oxidative species. J. Proteome Res 5:625‐633.
61. Islam C. F., R. T. Mathie, M. D. Dinneen, E. A. Kiely, A. M. Peters, and P. A. Grace. 1997. Ischaemia‐reperfusion injury in the rat kidney: the effect of preconditioning. Br J Urol 79:842‐847.

98 Literature
62. Iuso A., S. Scacco, C. Piccoli, F. Bellomo, V. Petruzzella, R. Trentadue, M. Minuto, M. Ripoli, N. Capitanio, M. Zeviani, and S. Papa. 2006. Dysfunctions of Cellular Oxidative Metabolism in Patients with Mutations in the NDUFS1 and NDUFS4 Genes of Complex I. Journal of Biological Chemistry 281:10374‐10380.
63. Julier K., R. da Silva, C. Garcia, L. Bestmann, P. Frascarolo, A. Zollinger, P. Chassot, E. R. Schmid, M. I. Turina, L. K. von Segesser, T. Pasch, D. R. Spahn, and M. Zaugg. 2003. Preconditioning by sevoflurane decreases biochemical markers for myocardial and renal dysfunction in coronary artery bypass graft surgery: a double‐blinded, placebo‐controlled, multicenter study. Anesthesiology 98:1315‐1327.
64. Jungblut P., A. Otto, E. Zeindl‐Eberhart, K. P. Plessner, M. Knecht, V. Regitz‐Zagrosek, E. Fleck, and B. Wittmann‐Liebold. 1994. Protein composition of the human heart: the construction of a myocardial two‐dimensional electrophoresis database. Electrophoresis 15:685‐707.
65. Kalenka A., M. H. Maurer, R. E. Feldmann, W. Kuschinsky, and K. F. Waschke. 2006. Volatile anesthetics evoke prolonged changes in the proteome of the left ventricule myocardium: defining a molecular basis of cardioprotection? Acta Anaesthesiol Scand 50:414‐427.
66. Kane L. A., C. K. Yung, G. Agnetti, I. Neverova, and J. E. Van Eyk. 2006. Optimization of paper bridge loading for 2‐DE analysis in the basic pH region: application to the mitochondrial subproteome. Proteomics 6:5683‐5687.
67. Kang D., Y. S. Gho, M. Suh, and C. Kang. 2002. Highly sensitive and fast protein detection with Coomassie Brilliant Blue in sodium dodecyl sulfate‐polyacrylamide gel electrophoresis. Bull. Korean Chem. Soc. 23:1511‐1512.
68. Karas M., and F. Hillenkamp. 1988. Laser desorption ionization of proteins with molecular masses exceeding 10,000 daltons. Anal. Chem 60:2299‐2301.
69. Kedishvili N. Y., K. M. Popov, P. M. Rougraff, Y. Zhao, D. W. Crabb, and R. A. Harris. 1992. CoA‐dependent methylmalonate‐semialdehyde dehydrogenase, a unique member of the aldehyde dehydrogenase superfamily. cDNA cloning, evolutionary relationships, and tissue distribution. J. Biol. Chem 267:19724‐19729.
70. Kenrick K. G., and J. Margolis. 1970. Isoelectric focusing and gradient gel electrophoresis: a two‐dimensional technique. Anal. Biochem 33:204‐207.
71. Kersten J. R., T. J. Schmeling, P. S. Pagel, G. J. Gross, and D. C. Warltier. 1997. Isoflurane mimics ischemic preconditioning via activation of K(ATP) channels: reduction of myocardial infarct size with an acute memory phase. Anesthesiology 87:361‐370.
72. Kim N., Y. Lee, H. Kim, H. Joo, J. B. Youm, W. S. Park, M. Warda, D. V. Cuong, and J. Han. 2006. Potential biomarkers for ischemic heart damage identified in mitochondrial proteins by comparative proteomics. Proteomics 6:1237‐1249.
73. Kloner R. A., and R. B. Jennings. 2001. Consequences of brief ischemia: stunning, preconditioning, and their clinical implications: part 1. Circulation 104:2981‐2989.
74. Kloner R. A., and R. B. Jennings. 2001. Consequences of brief ischemia: stunning, preconditioning, and their clinical implications: part 2. Circulation 104:3158‐3167.
75. Klose J. 1975. Protein mapping by combined isoelectric focusing and electrophoresis of mouse tissues. A novel approach to testing for induced point mutations in mammals. Humangenetik 26:231‐243.
76. Klose J., and U. Kobalz. 1995. Two‐dimensional electrophoresis of proteins: an updated protocol and implications for a functional analysis of the genome. Electrophoresis 16:1034‐1059.
77. Kohin S., C. M. Stary, R. A. Howlett, and M. C. Hogan. 2001. Preconditioning improves function and recovery of single muscle fibers during severe hypoxia and

Literature 99
reoxygenation. Am. J. Physiol., Cell Physiol 281:C142‐146. 78. Korzick D. H., J. C. Kostyak, J. C. Hunter, and K. W. Saupe. 2007. Local delivery of
PKCepsilon‐activating peptide mimics ischemic preconditioning in aged hearts through GSK‐3beta but not F1‐ATPase inactivation. Am. J. Physiol. Heart Circ. Physiol 293:H2056‐2063.
79. Kume M., Y. Yamamoto, S. Saad, T. Gomi, S. Kimoto, T. Shimabukuro, T. Yagi, M. Nakagami, Y. Takada, T. Morimoto, and Y. Yamaoka. 1996. Ischemic preconditioning of the liver in rats: implications of heat shock protein induction to increase tolerance of ischemia‐reperfusion injury. J. Lab. Clin. Med 128:251‐258.
80. Kuzuya T., S. Hoshida, N. Yamashita, H. Fuji, H. Oe, M. Hori, T. Kamada, and M. Tada. 1993. Delayed effects of sublethal ischemia on the acquisition of tolerance to ischemia. Circ. Res 72:1293‐1299.
81. Lamberti C., E. Pessione, M. G. Giuffrida, R. Mazzoli, C. Barello, A. Conti, and C. Giunta. 2007. Combined cup loading, bis(2‐hydroxyethyl) disulfide, and protein precipitation protocols to improve the alkaline proteome of Lactobacillus hilgardii. Electrophoresis 28:1633‐1638.
82. Landoni G., G. G. L. Biondi‐Zoccai, A. Zangrillo, E. Bignami, S. D'Avolio, C. Marchetti, M. G. Calabrò, O. Fochi, F. Guarracino, L. Tritapepe, S. De Hert, and G. Torri. 2007. Desflurane and sevoflurane in cardiac surgery: a meta‐analysis of randomized clinical trials. J. Cardiothorac. Vasc. Anesth 21:502‐511.
83. Lang S. C., A. Elsässer, C. Scheler, S. Vetter, C. P. Tiefenbacher, W. Kübler, H. A. Katus, and A. M. Vogt. 2006. Myocardial preconditioning and remote renal preconditioning‐‐identifying a protective factor using proteomic methods? Basic Res. Cardiol 101:149‐158.
84. Lange M., A. Redel, T. M. Smul, C. Lotz, T. Nefzger, J. Stumpner, C. Blomeyer, F. Gao, N. Roewer, and F. Kehl. 2009. Desflurane‐induced preconditioning has a threshold that is lowered by repetitive application and is mediated by beta(2)‐adrenergic receptors. J. Cardiothorac. Vasc. Anesth 23:607‐613.
85. Lescuyer P., J. Strub, S. Luche, H. Diemer, P. Martinez, A. Van Dorsselaer, J. Lunardi, and T. Rabilloud. 2003. Progress in the definition of a reference human mitochondrial proteome. Proteomics 3:157‐167.
86. Li H., Y. Xiao, Y. Gao, and T. Yang. 2006. Comparative proteomics analysis of differentially expressed phosphoproteins in adult rat ventricular myocytes subjected to diazoxide preconditioning. Drug Metabol Drug Interact 21:245‐258.
87. Li X., B. B. Patel, E. L. Blagoi, M. D. Patterson, S. H. Seeholzer, S. H. Seehozer, T. Zhang, S. Damle, Z. Gao, B. Boman, and A. T. Yeung. 2004. Analyzing alkaline proteins in human colon crypt proteome. J. Proteome Res 3:821‐833.
88. Li Z. B., P. W. Flint, and M. O. Boluyt. 2005. Evaluation of several two‐dimensional gel electrophoresis techniques in cardiac proteomics. Electrophoresis 26:3572‐3585.
89. Liu Y., and J. M. Downey. 1992. Ischemic preconditioning protects against infarction in rat heart. Am. J. Physiol 263:H1107‐1112.
90. Liu Y., H. Kato, N. Nakata, and K. Kogure. 1992. Protection of rat hippocampus against ischemic neuronal damage by pretreatment with sublethal ischemia. Brain Res 586:121‐124.
91. Lowry O. H., N. J. Rosebrough, A. L. Farr, and R. J. Randall. 1951. Protein measurement with the Folin phenol reagent. J. Biol. Chem 193:265‐275.
92. Magalhães A. D., S. Charneau, J. Paba, R. A. Guércio, A. R. Teixeira, J. M. Santana, M. V. Sousa, and C. A. Ricart. 2008. Trypanosoma cruzi alkaline 2‐DE: Optimization and application to comparative proteome analysis of flagellate life stages. Proteome Sci 6:24.

100 Literature
93. McGregor E., and M. J. Dunn. 2003. Proteomics of heart disease. Hum. Mol. Genet. 12:R135‐144.
94. Meco M., S. Cirri, C. Gallazzi, G. Magnani, and D. Cosseta. 2007. Desflurane preconditioning in coronary artery bypass graft surgery: a double‐blinded, randomised and placebo‐controlled study. Eur J Cardiothorac Surg 32:319‐325.
95. Miyawaki H., X. Zhou, and M. Ashraf. 1996. Calcium preconditioning elicits strong protection against ischemic injury via protein kinase C signaling pathway. Circ. Res 79:137‐146.
96. Møller I. M., and B. K. Kristensen. 2006. Protein oxidation in plant mitochondria detected as oxidized tryptophan. Free Radic. Biol. Med 40:430‐435.
97. Molloy M. P., B. R. Herbert, B. J. Walsh, M. I. Tyler, M. Traini, J. C. Sanchez, D. F. Hochstrasser, K. L. Williams, and A. A. Gooley. 1998. Extraction of membrane proteins by differential solubilization for separation using two‐dimensional gel electrophoresis. Electrophoresis 19:837‐844.
98. Molloy M. P., E. E. Brzezinski, J. Hang, M. T. McDowell, and R. A. VanBogelen. 2003. Overcoming technical variation and biological variation in quantitative proteomics. Proteomics 3:1912‐1919.
99. Moon K., B. L. Hood, P. Mukhopadhyay, M. Rajesh, M. A. Abdelmegeed, Y. Kwon, T. P. Conrads, T. D. Veenstra, B. Song, and P. Pacher. 2008. Oxidative inactivation of key mitochondrial proteins leads to dysfunction and injury in hepatic ischemia reperfusion. Gastroenterology 135:1344‐1357.
100. Müllenheim J., D. Ebel, J. Frässdorf, B. Preckel, V. Thämer, and W. Schlack. 2002. Isoflurane preconditions myocardium against infarction via release of free radicals. Anesthesiology 96:934‐940.
101. Murry C. E., R. B. Jennings, and K. A. Reimer. 1986. Preconditioning with ischemia: a delay of lethal cell injury in ischemic myocardium. Circulation 74:1124‐1136.
102. Neely C. F., and I. M. Keith. 1995. A1 adenosine receptor antagonists block ischemia‐reperfusion injury of the lung. Am. J. Physiol 268:L1036‐1046.
103. Nelson S. R., T. L. Pazdernik, and F. E. Samson. 1992. Copper plus ascorbate inactivates lactate dehydrogenase: are oxygen radicals involved? Proc. West. Pharmacol. Soc 35:37‐41.
104. Neuhoff V., N. Arold, D. Taube, and W. Ehrhardt. 1988. Improved staining of proteins in polyacrylamide gels including isoelectric focusing gels with clear background at nanogram sensitivity using Coomassie Brilliant Blue G‐250 and R‐250. Electrophoresis 9:255‐262.
105. Novalija E., S. G. Varadarajan, A. K. S. Camara, J. An, Q. Chen, M. L. Riess, N. Hogg, and D. F. Stowe. 2002. Anesthetic preconditioning: triggering role of reactive oxygen and nitrogen species in isolated hearts. Am. J. Physiol. Heart Circ. Physiol 283:H44‐52.
106. O'Farrell P. H. 1975. High resolution two‐dimensional electrophoresis of proteins. J. Biol. Chem 250:4007‐4021.
107. Ohlmeier S., C. Scharf, and M. Hecker. 2000. Alkaline proteins of Bacillus subtilis: first steps towards a two‐dimensional alkaline master gel. Electrophoresis 21:3701‐3709.
108. Olsson I., K. Larsson, R. Palmgren, and B. Bjellqvist. 2002. Organic disulfides as a means to generate streak‐free two‐dimensional maps with narrow range basic immobilized pH gradient strips as first dimension. Proteomics 2:1630‐1632.
109. Osborne D. L., T. Y. Aw, G. Cepinskas, and P. R. Kvietys. 1994. Development of ischemia/reperfusion tolerance in the rat small intestine. An epithelium‐independent event. J. Clin. Invest 94:1910‐1918.

Literature 101
110. Ouyang Y., S. Kuroda, T. Kristián, and B. K. Siesjö. 1997. Release of mitochondrial aspartate aminotransferase (mAST) following transient focal cerebral ischemia suggests the opening of a mitochondrial permeability transition pore. Neuroscience Research Communications 20:167‐173.
111. Ovize M., R. A. Kloner, and K. Przyklenk. 1994. Stretch preconditions canine myocardium. Am. J. Physiol 266:H137‐146.
112. Park J., Y. Chun, M. Kim, Y. Park, S. J. Kwak, and S. C. Park. 1998. Metabolic modulation of cellular redox potential can improve cardiac recovery from ischemia‐reperfusion injury. International Journal of Cardiology 65:139‐147.
113. Patton W. F. 2002. Detection technologies in proteome analysis. J. Chromatogr. B Analyt. Technol. Biomed. Life Sci 771:3‐31.
114. Pearte C. A., C. D. Furberg, E. S. O'Meara, B. M. Psaty, L. Kuller, N. R. Powe, and T. Manolio. 2006. Characteristics and Baseline Clinical Predictors of Future Fatal Versus Nonfatal Coronary Heart Disease Events in Older Adults: The Cardiovascular Health Study. Circulation 113:2177‐2185.
115. Pennington K., E. McGregor, C. L. Beasley, I. Everall, D. Cotter, and M. J. Dunn. 2004. Optimization of the first dimension for separation by two‐dimensional gel electrophoresis of basic proteins from human brain tissue. Proteomics 4:27‐30.
116. Petrak J., R. Ivanek, O. Toman, R. Cmejla, J. Cmejlova, D. Vyoral, J. Zivny, and C. D. Vulpe. 2008. Déjà vu in proteomics. A hit parade of repeatedly identified differentially expressed proteins. Proteomics 8:1744‐1749.
117. Piriou V., P. Chiari, F. Lhuillier, O. Bastien, J. Loufoua, O. Raisky, J. S. David, M. Ovize, and J. J. Lehot. 2002. Pharmacological preconditioning: comparison of desflurane, sevoflurane, isoflurane and halothane in rabbit myocardium. Br J Anaesth 89:486‐491.
118. Piriou V., J. Mantz, G. Goldfarb, M. Kitakaze, P. Chiari, S. Paquin, C. Cornu, J. Lecharny, P. Aussage, E. Vicaut, A. Pons, and J. Lehot. 2007. Sevoflurane preconditioning at 1 MAC only provides limited protection in patients undergoing coronary artery bypass surgery: a randomized bi‐centre trial. Br J Anaesth 99:624‐631.
119. Pleissner K. P., S. Sander, H. Oswald, V. Regitz‐Zagrosek, and E. Fleck. 1996. The construction of the World Wide Web‐accessible myocardial two‐dimensional gel electrophoresis protein database "HEART‐2DPAGE": a practical approach. Electrophoresis 17:1386‐1392.
120. Potgieter H. C., J. B. Ubbink, S. Bissbort, M. J. Bester, J. H. Spies, and W. J. Vermaak. 1997. Spontaneous oxidation of methionine: effect on the quantification of plasma methionine levels. Anal. Biochem 248:86‐93.
121. Przyklenk K., B. Bauer, M. Ovize, R. A. Kloner, and P. Whittaker. 1993. Regional ischemic 'preconditioning' protects remote virgin myocardium from subsequent sustained coronary occlusion. Circulation 87:893‐899.
122. Rabilloud T. 1998. Use of thiourea to increase the solubility of membrane proteins in two‐dimensional electrophoresis. Electrophoresis 19:758‐760.
123. Rabilloud T., C. Adessi, A. Giraudel, and J. Lunardi. 1997. Improvement of the solubilization of proteins in two‐dimensional electrophoresis with immobilized pH gradients. Electrophoresis 18:307‐316.
124. Raddatz K., D. Albrecht, F. Hochgräfe, M. Hecker, and M. Gotthardt. 2008. A proteome map of murine heart and skeletal muscle. Proteomics 8:1885‐1897.
125. Redel A., M. Lange, V. Jazbutyte, C. Lotz, T. M. Smul, N. Roewer, and F. Kehl. 2008. Activation of mitochondrial large‐conductance calcium‐activated K+ channels via protein kinase A mediates desflurane‐induced preconditioning. Anesth. Analg

102 Literature
106:384‐391 126. Riess M. L., A. K. S. Camara, L. G. Kevin, J. An, and D. F. Stowe. 2004. Reduced
reactive O2 species formation and preserved mitochondrial NADH and [Ca2+] levels during short‐term 17 degrees C ischemia in intact hearts. Cardiovasc. Res 61:580‐590.
127. Riess M. L., A. K. S. Camara, Q. Chen, E. Novalija, S. S. Rhodes, and D. F. Stowe. 2002. Altered NADH and improved function by anesthetic and ischemic preconditioning in guinea pig intact hearts. Am J Physiol Heart Circ Physiol 283:H53‐60.
128. Roepstorff P., and J. Fohlman. 1984. Proposal for a common nomenclature for sequence ions in mass spectra of peptides. Biomed. Mass Spectrom 11:601.
129. Sakai J., H. Ishikawa, S. Kojima, H. Satoh, S. Yamamoto, and M. Kanaoka. 2003. Proteomic analysis of rat heart in ischemia and ischemia‐reperfusion using fluorescence two‐dimensional difference gel electrophoresis. Proteomics 3:1318‐1324.
130. Sawicki G., and B. I. Jugdutt. 2004. Detection of regional changes in protein levels in the in vivo canine model of acute heart failure following ischemia‐reperfusion injury: functional proteomics studies. Proteomics 4:2195‐2202.
131. Schott R. J., S. Rohmann, E. R. Braun, and W. Schaper. 1990. Ischemic preconditioning reduces infarct size in swine myocardium. Circ. Res 66:1133‐1142.
132. Schuh C. 2008. Kardioprotektive Wirkung volatiler Anästhetika (Poster). Deutscher Anästhesiecongress, Nürnberg.
133. Schulenberg B., T. N. Goodman, R. Aggeler, R. A. Capaldi, and W. F. Patton. 2004. Characterization of dynamic and steady‐state protein phosphorylation using a fluorescent phosphoprotein gel stain and mass spectrometry. Electrophoresis 25:2526‐2532.
134. Schwertz H., T. Längin, H. Platsch, J. Richert, S. Bomm, M. Schmidt, H. Hillen, G. Blaschke, J. Meyer, H. Darius, and M. Buerke. 2002. Two‐dimensional analysis of myocardial protein expression following myocardial ischemia and reperfusion in rabbits. Proteomics 2:988‐995.
135. Sedlic F., D. Pravdic, M. Ljubkovic, J. Marinovic, A. Stadnicka, and Z. J. Bosnjak. 2009. Differences in production of reactive oxygen species and mitochondrial uncoupling as events in the preconditioning signaling cascade between desflurane and sevoflurane. Anesth. Analg 109:405‐411.
136. Sedlic F., D. Pravdic, M. Ljubkovic, J. Marinovic, A. Stadnicka, and Z. J. Bosnjak. 2009. Differences in production of reactive oxygen species and mitochondrial uncoupling as events in the preconditioning signaling cascade between desflurane and sevoflurane.
137. Sergeev P., R. da Silva, E. Lucchinetti, K. Zaugg, T. Pasch, M. C. Schaub, and M. Zaugg. 2004. Trigger‐dependent gene expression profiles in cardiac preconditioning: evidence for distinct genetic programs in ischemic and anesthetic preconditioning. Anesthesiology 100:474‐488.
138. Shevchenko A., M. Wilm, O. Vorm, and M. Mann. 1996. Mass spectrometric sequencing of proteins silver‐stained polyacrylamide gels. Anal. Chem 68:850‐858.
139. Shizukuda Y., R. T. Mallet, S. C. Lee, and H. F. Downey. 1992. Hypoxic preconditioning of ischaemic canine myocardium. Cardiovasc. Res 26:534‐542.
140. da Silva R., T. Grampp, T. Pasch, M. C. Schaub, and M. Zaugg. 2004. Differential activation of mitogen‐activated protein kinases in ischemic and anesthetic preconditioning. Anesthesiology 100:59‐69.
141. Smul T. M., M. Lange, A. Redel, N. Burkhard, N. Roewer, and F. Kehl. 2006.

Literature 103
Desflurane‐induced preconditioning against myocardial infarction is mediated by nitric oxide. Anesthesiology 105:719‐725.
142. Spiekermann P., J. Brückner, and W. Kübler. 1969. Präischämische Belastung und Wiederbelebungszeiten des Herzens. Verh Dtsch Ges Kreislaufforsch 33:358‐64.
143. Stanley B. A., I. Neverova, H. A. Brown, and J. E. Van Eyk. 2003. Optimizing protein solubility for two‐dimensional gel electrophoresis analysis of human myocardium. Proteomics 3:815‐820.
144. Steinberg T. H., B. J. Agnew, K. R. Gee, W. Leung, T. Goodman, B. Schulenberg, J. Hendrickson, J. M. Beechem, R. P. Haugland, and W. F. Patton. 2003. Global quantitative phosphoprotein analysis using Multiplexed Proteomics technology. Proteomics 3:1128‐1144.
145. Sweetlove L. J., J. L. Heazlewood, V. Herald, R. Holtzapffel, D. A. Day, C. J. Leaver, and A. H. Millar. 2002. The impact of oxidative stress on Arabidopsis mitochondria. Plant J 32:891‐904.
146. Tanaka K., D. Weihrauch, F. Kehl, L. M. Ludwig, J. F. LaDisa, J. R. Kersten, P. S. Pagel, and D. C. Warltier. 2002. Mechanism of preconditioning by isoflurane in rabbits: a direct role for reactive oxygen species. Anesthesiology 97:1485‐1490.
147. Tanaka K., H. Waki, Y. Ido, S. Akita, Y. Yoshida, T. Yoshida, and T. Matsuo. 1988. Protein and polymer analyses up to <I>m/z</I> 100 000 by laser ionization time‐of‐flight mass spectrometry. Rapid Communications in Mass Spectrometry 2:151‐153.
148. Tanaka N., H. Takahashi, H. Kitano, M. Matsuoka, S. Akao, H. Uchimiya, and S. Komatsu. 2005. Proteome approach to characterize the methylmalonate‐semialdehyde dehydrogenase that is regulated by gibberellin. J. Proteome Res 4:1575‐1582.
149. Taylor S. W., E. Fahy, J. Murray, R. A. Capaldi, and S. S. Ghosh. 2003. Oxidative post‐translational modification of tryptophan residues in cardiac mitochondrial proteins. J. Biol. Chem 278:19587‐19590.
150. Thornton J., S. Striplin, G. S. Liu, A. Swafford, A. W. Stanley, D. M. Van Winkle, and J. M. Downey. 1990. Inhibition of protein synthesis does not block myocardial protection afforded by preconditioning. Am. J. Physiol 259:H1822‐1825.
151. Toller W. G., E. R. Gross, J. R. Kersten, P. S. Pagel, G. J. Gross, and D. C. Warltier. 2000. Sarcolemmal and mitochondrial adenosine triphosphate‐ dependent potassium channels: mechanism of desflurane‐induced cardioprotection. Anesthesiology 92:1731‐1739.
152. Toma O., N. C. Weber, J. I. Wolter, D. Obal, B. Preckel, and W. Schlack. 2004. Desflurane preconditioning induces time‐dependent activation of protein kinase C epsilon and extracellular signal‐regulated kinase 1 and 2 in the rat heart in vivo. Anesthesiology 101:1372‐1380.
153. Vegh A., L. Szekeres, and J. R. Parratt. 1991. Transient ischaemia induced by rapid cardiac pacing results in myocardial preconditioning. Cardiovasc. Res 25:1051‐1053.
154. Wang S., R. Zhu, B. Peng, M. Liu, Y. Lou, X. Ye, Z. Xu, D. Liu, and X. Peng. 2006. Identification of alkaline proteins that are differentially expressed in an overgrowth‐mediated growth arrest and cell death of Escherichia coli by proteomic methodologies. Proteomics 6:5212‐5220.
155. Warltier D. C., M. H. al‐Wathiqui, J. P. Kampine, and W. T. Schmeling. 1988. Recovery of contractile function of stunned myocardium in chronically instrumented dogs is enhanced by halothane or isoflurane. Anesthesiology 69:552‐565.
156. Weber N. C., and W. Schlack. 2008. Inhalational anaesthetics and cardioprotection. Handb Exp Pharmacol 187‐207.
157. Weber N. C., C. Goletz, R. Huhn, Y. Grueber, B. Preckel, W. Schlack, and D. Ebel.

104 Literature
2008. Blockade of anaesthetic‐induced preconditioning in the hyperglycaemic myocardium: the regulation of different mitogen‐activated protein kinases. Eur. J. Pharmacol 592:48‐54.
158. Weber N. C., O. Toma, J. I. Wolter, D. Obal, J. Müllenheim, B. Preckel, and W. Schlack. 2005. The noble gas xenon induces pharmacological preconditioning in the rat heart in vivo via induction of PKC‐epsilon and p38 MAPK. Br. J. Pharmacol 144:123‐132.
159. Wen J., and N. Garg. 2004. Oxidative modification of mitochondrial respiratory complexes in response to the stress of Trypanosoma cruzi infection. Free Radic. Biol. Med 37:2072‐2081.
160. Westbrook J. A., J. X. Wheeler, R. Wait, S. Y. Welson, and M. J. Dunn. 2006. The human heart proteome: Two‐dimensional maps using narrow‐range immobilised pH gradients. Electrophoresis 27:1547‐1555.
161. White M. Y., S. J. Cordwell, H. C. K. McCarron, A. M. Prasan, G. Craft, B. D. Hambly, and R. W. Jeremy. 2005. Proteomics of ischemia/reperfusion injury in rabbit myocardium reveals alterations to proteins of essential functional systems. Proteomics 5:1395‐1410.
162. Whitehouse C. M., R. N. Dreyer, M. Yamashita, and J. B. Fenn. 1985. Electrospray interface for liquid chromatographs and mass spectrometers. Anal. Chem 57:675‐679.
163. Wong R., A. M. Aponte, C. Steenbergen, and E. Murphy. 2010. Cardioprotection leads to novel changes in the mitochondrial proteome. Am. J. Physiol. Heart Circ. Physiol 298:H75‐91.
164. Wu S., P. Wan, J. Li, D. Li, Y. Zhu, and F. He. 2006. Multi‐modality of pI distribution in whole proteome. Proteomics 6:449‐455.
165. Yabe K., and S. Takeo. 1997. Does glycogen depletion play an important role in ischemic preconditioning? Heart Vessels 12:136‐142.
166. Yan L., D. E. Vatner, S. Kim, H. Ge, M. Masurekar, W. H. Massover, G. Yang, Y. Matsui, J. Sadoshima, and S. F. Vatner. 2005. Autophagy in chronically ischemic myocardium. Proc. Natl. Acad. Sci. U.S.A 102:13807‐13812.
167. Yellon D. M., A. M. Alkhulaifi, and W. B. Pugsley. 1993. Preconditioning the human myocardium. Lancet 342:276‐277.
168. Zaugg M., and M. C. Schaub. 2003. Signaling and cellular mechanisms in cardiac protection by ischemic and pharmacological preconditioning. J. Muscle Res. Cell. Motil 24:219‐249.
169. Zheng M., C. Reynolds, S. Jo, R. Wersto, Q. Han, and R. Xiao. 2005. Intracellular acidosis‐activated p38 MAPK signaling and its essential role in cardiomyocyte hypoxic injury. FASEB J. 19:109‐111.

Appendix 105
6 Appendix

106 Appendix
A. Supplementary data
Table A.1: Buffer combinations for improving protein solubility resolution during IEF1.
IEF buffer stock solution
(including CHAPS) Reducing agents Solvents
IEF strip U TU TU‐ASB DTT HED glycerol/isopropanol
a/A
b/B
c/C
d/D
e/E
f/F
g/G
h/H
i/I
j/J
k/K
l/L
1 In support of the multiple subproteomic analyses to be conducted, the 2‐DE experiments on the neutral‐acidic subproteomes were carried out by MD students Christian Schuh and Hendrik Vogt.
(A) Water‐soluble proteins
Figure A.1a: Optimal IEF separation by mix and matching buffer compositions.

Appendix 107
(B) Detergent‐soluble proteins
Figure A.1b: Optimal IEF separation by mix and matching buffer composition. 250 µg protein was solubilized in the different IEF buffers mentioned in Table A.1, applied by in‐gel rehydration on 13 cm IPG strips pH 4‐7, and focused according to the standard IEF protocol (chapter 2.5). Panel (A) shows the effect of the buffer compositions for water‐soluble proteins, panel (B) demonstrates the effect for detergent‐soluble proteins.
Table A.2: Amino acid sequences of differentially expressed proteins during DES‐PC. Red amino acid sequences were identified by MS/MS fragmentation; underlined peptides account for PMF data.
Spot ID Accession No. Entry name
# 16/59 AST‐2
NP_037309 aspartate aminotransferase, mitochondrial [Rattus norvegicus]
1 MALLHSGRVL SGMAAAFHPG LAAAASARAS SWWTHVEMGP PDPILGVTEA FKRDTNSKKM 61 NLGVGAYRDD NGKPYVLPSV RKAEAQIAGK NLDKEYLPIG GLADFCKASA ELALGENSEV 121 LKSGRFVTVQ TISGTGALRV GASFLQRFFK FSRDVFLPKP SWGNHTPIFR DAGMQLQGYR 181 YYDPKTCGFD FSGALEDISK IPEQSVLLLH ACAHNPTGVD PRPEQWKEMA AVVKKKNLFA 241 FFDMAYQGFA SGDGDKDAWA VRHFIEQGIN VCLCQSYAKN MGLYGERVGA FTVVCKDAEE 301 AKRVESQLKI LIRPLYSNPP LNGARIAATI LTSPDLRKQW LQEVKGMADR IISMRTQLVS 361 NLKKEGSSHN WQHITDQIGM FCFTGLKPEQ VERLTKEFSV YMTKDGRISV AGVTSGNVGY 421 LAHAIHQVTK
# 17 NDUFS1
NP_001005550 NADH‐ubiquinone oxidoreductase 75 kDa subunit, mitochondrial precursor [Rattus norvegicus]
1 MLRIPVKRAL IGLSKSPKGY VRSTGTAASN LIEVFVDGQS VMVEPGTTVL QACEKVGMQI 61 PRFCYHERLS VAGNCRMCLV EIEKAPKVVA ACAMPVMKGW NILTNSEKSK KAREGVMEFL 121 LANHPLDCPI CDQGGECDLQ DQSMMFGSDR SRFLEGKRAV EDKNIGPLVK TIMTRCIQCT 181 RCIRFASEIA GVDDLGTTGR GNDMQVGTYI EKMFMSELSG NIIDICPVGA LTSKPYAFTA 241 RPWETRKTES IDVMDAVGSN IVVSTRTGEV MRILPRMHED INEEWISDKT RFAYDGLKRQ 301 RLTEPMVRNE KGLLTYTSWE DALSRVAGML QSFEGKAVAA IAGGLVDAEA LVALKDLLNK 361 VDSDTLCTEE IFPNEGAGTD LRSNYLLNTT IAGVEEADVV LLVGTNPRFE APLFNARIRK 421 SWLHNDLKVA LIGSPVDLTY RYDHLGDSPK ILQDIASGNH EFSKVLNAAK KPMVVLGSSA 481 LQRDDGAAIL AAVSSIAQKI RVASGAAAEW KVMNILHRIA SQVAALDLGY KPGVEAIRKN 541 PPKLLFLLGA DGGCITRQDL PKDCFIVYQG HHGDVGAPIA DVILPGAAYT EKSATYVNTE 601 GRAQQTKVAV TPPGLAREDW KIIRALSEIA GITLPYDTLD QVRNRLGEVS PNLVRYDDVE 661 EANYFQQASE LAKLVDQEFL ADPLVPPQLT IKDFYMTDSI SRASQTMAKC VKAVTEGAQA 721 VEEPSIC

108 Appendix
Table A.2continued: Amino acid sequences of differentially expressed proteins during DES‐PC. # 34 PPA2
NP_001129343 inorganic pyrophosphatase 2, mitochondrial[Rattus norvegicus]
1 MRALLPLLSV GRGWRVGAAA LPPRRVMSLY RTEELGHPRS KDYRLFFKHV AGHYISPFHD 61 IPLKADCEEE HGIPRKKARN DEYKASFNMV VEIPRWTNAK MEIATEEPLN PIKQDTKNGR 121 LRYTPNIFPH KGYIWNYGAL PQTWEDPHLK DKSTNCCGDN DPIDVCEIGS KVLSRGDVVH 181 VKILGTLALI DQSETDWKII AINVNDPEAE KFHDIDDVKK FKPGYLEATV NWFRLYKVPD 241 GKPENKFAFN GEFKNKAFAL EVINSAHEHW KEMVMKKCDK GAISCVNVHI CDSPFHCTTE 301 EARSLVESIP TPSMSKESSV EEEVWHFLRN # 49 Aco‐2
NP_077374 aconitate hydratase, mitochondrial precursor[Rattus norvegicus]
1 MAPYSLLVTR LQKALGVRQY HVASALCQRA KVAMSHFEPS EYIRYDLLEK NINIVRKRLN 61 RPLTLSEKIV YGHLDDPANQ EIERGKTYLR LRPDRVAMQD ATAQMAMLQF ISSGLPKVAV 121 PSTIHCDHLI EAQLGGEKDL RRAKDINQEV YNFLATAGAK YGVGFWRPGS GIIHQIILEN 181 YAYPGVLLIG TDSHTPNGGG LGGICIGVGG ADAVDVMAGI PWELKCPKVI GVKLTGTLSG 241 WTSPKDVILK VAGILTVKGG TGAIVEYHGP GVDSISCTGM ATICNMGAEI GATTSVFPYN 301 HRMKKYLSKT GRADIANLAE EFKDHLVPDP GCQYDQVIEI NLNELKPHIN GPFTPDLAHP 361 VADVGTVAEK EGWPLDIRVG LIGSCTNSSY EDMGRSAAVA KQALAHGLKC KSQFTITPGS 421 EQIRATIERD GYAQILRDVG GIVLANACGP CIGQWDRKDI KKGEKNTIVT SYNRNFTGRN 481 DANPETHAFV TSPEIVTALA IAGTLKFNPE TDFLTGKDGK KFKLEAPDAD ELPRSDFDPG 541 QDTYQHPPKD SSGQRVDVSP TSQRLQLLEP FDKWDGKDLE DLQILIKVKG KCTTDHISAA 601 GPWLKFRGHL DNISNNLLIG AINIENGKAN SVRNAVTQEF GPVPDTARYY KKHGIRWVVI 661 GDENYGEGSS REHAALEPRH LGGRAIITKS FARIHETNLK KQGLLPLTFA DPSDYNKIHP 721 VDKLTIQGLK DFAPGKPLNC IIKHPNGTQE TILLNHTFNE TQIEWFRAGS ALNRMKELQQ # 71 ALB
NP_599153 serum albumin precursor[Rattus norvegicus]
1 MKWVTFLLLL FISGSAFSRG VFRREAHKSE IAHRFKDLGE QHFKGLVLIA FSQYLQKCPY 61 EEHIKLVQEV TDFAKTCVAD ENAENCDKSI HTLFGDKLCA IPKLRDNYGE LADCCAKQEP 121 ERNECFLQHK DDNPNLPPFQ RPEAEAMCTS FQENPTSFLG HYLHEVARRH PYFYAPELLY 181 YAEKYNEVLT QCCTESDKAA CLTPKLDAVK EKALVAAVRQ RMKCSSMQRF GERAFKAWAV 241 ARMSQRFPNA EFAEITKLAT DLTKINKECC HGDLLECADD RAELAKYMCE NQATISSKLQ 301 ACCDKPVLQK SQCLAEIEHD NIPADLPSIA ADFVEDKEVC KNYAEAKDVF LGTFLYEYSR 361 RHPDYSVSLL LRLAKKYEAT LEKCCAEGDP PACYGTVLAE FQPLVEEPKN LVKTNCELYE 421 KLGEYGFQNA ILVRYTQKAP QVSTPTLVEA ARNLGRVGTK CCTLPEAQRL PCVEDYLSAI 481 LNRLCVLHEK TPVSEKVTKC CSGSLVERRP CFSALTVDET YVPKEFKAET FTFHSDICTL 541 PDKEKQIKKQ TALAELVKHK PKATEDQLKT VMGDFAQFVD KCCKAADKDN CFATEGPNLV 601 ARSKEALA
# 94 MMSDH
NP_112319 methylmalonate‐semialdehyde dehydrogenase,mitochondrial precursor [Rattus norvegicus]
1 MAAAVAAAAA VRSRILQVSS KVNSTWCPAS SFSSSSVPTV KLFIDGKFVE SKSDKWIDIH 61 NPATNEVVGR VPQSTKAEME AAVAACKRAF PAWADTSILS RQQVLLRYQQ LIKENLKEIA 121 RLITLEQGKT LADAEGDVFR GLQVVEHACS VTSLMLGETM PSITKDMDLY SYRLPLGVCA 181 GIAPFNFPAM IPLWMFPMAM VCGNTFLMKP SERVPGATML LAKLLQDSGA PDGTLNIIHG 241 QHEAVNFICD HPDIKAISFV GSNQAGEYIF ERGSRNGKRV QANMGAKNHG VVMPDANKEN 301 TLNQLVGAAF GAAGQRCMAL STAVLVGEAK KWLPELVERA KNLRVNAGDQ PGADLGPLIT 361 PQAKERVCNL IDSGAKEGAS ILLDGRKIKV KGYENGNFVG PTIISNVKPS MTCYKEEIFG 421 PVLVVLETET LDEAIKIVND NPYGNGTAIF TTNGAIARKY AHMVDVGQVG VNVPIPVPLP 481 MFSFTGSRSS FRGDTNFYGK QGIQFYTQLK TITSQWKEED ATLSSPAVVM PTMGR
# 105 NDUFV1
NP_001006973 NADH dehydrogenase [ubiquinone] flavoprotein 1,mitochondrial precursor [Rattus norvegicus]
1 MLAARHFLGG SVPVRVSVRL SSGTTAPKKT SFGSLKDEDR IFTNLYGRHD WRLKGAQRRG 61 DWYKTKEILL KGPDWILGEM KTSGLRGRGG AGFPTGLKWS FMNKPSDGRP KYLVVNADEG 121 EPGTCKDREI MRHDPHKLVE GCLVGGRAMG ARAAYIYIRG EFYNEASNLQ VAIREAYEAG 181 LIGKNACDSD YDFDVFVVRG AGAYICGEET ALIESIEGKQ GKPRLKPPFP ADVGVFGCPT 241 TVANVETVAV SPTICRRGGT WFAGFGRERN SGTKLFNISG HVNHPCTVEE EMSVPLKELI 301 EKHAGGVLGG WDNLLAVIPG GSSTPLIPKS VCETVLMDFD ALVQAQTGLG TAAVIVMNSS 361 TDIVKAIARL IEFYKHESCG QCTPCREGVD WMNKVMARFV KGDARPAEID SLWEISKQIE 421 GHTICALGDG AAWPVQGLIR HFRPELEDRM QRFAQQHQAR QAAS

Appendix 109
Table A.2continued: Amino acid sequences of differentially expressed proteins during DES‐PC.#129/130 CAII
NP_062164 carbonic anhydrase 2[Rattus norvegicus]
1 MSHHWGYSKS NGPENWHKEF PIANGDRQSP VDIDTGTAQH DPSLQPLLIC YDKVASKSIV 61 NNGHSFNVEF DDSQDFAVLK EGPLSGSYRL IQFHFHWGSS DGQGSEHTVN KKKYAAELHL 121 VHWNTKYGDF GKAVQHPDGL AVLGIFLKIG PASQGLQKIT EALHSIKTKG KRAAFANFDP 181 CSLLPGNLDY WTYPGSLTTP PLLECVTWIV LKEPITVSSE QMSHFRKLNF NSEGEAEELM 241 VDNWRPAQPL KNRKIKASFK # 131 CAI
NP_001101130 carbonic anhydrase 1[Rattus norvegicus]
1 MASADWGYDS KNGPDQWSKL YPIANGNNQS PIDIKTSEAK HDSSLKPVSV SYNPATAKEI 61 VNVGHSFHVV FDDSSNQSVL KGGPLADSYR LTQFHFHWGN SNDHGSEHTV DGAKYSGELH 121 LVHWNSAKYS SAAEAISKAD GLAIIGVLMK VGPANPNLQK VLDALSSVKT KGKRAPFTNF 181 DPSSLLPSSL DYWTYFGSLT HPPLHESVTW VICKESISLS PEQLAQLRGL LSSAEGEPAV 241 PVLSNHRPPQ PLKGRTVRAS F # 160 AST‐1
NP_036703 aspartate aminotransferase, cytoplasmic[Rattus norvegicus]
1 MAPPSFFAQV PQAPPVLVFK LIADFRDDPD PRKVNLGVGA YRTDDSQPWV LPVVRKVEQK 61 IANDHSLNHE YLPILGLAEF RSCASQLVLG DNSPALRENG VGGVQSLGAT GALRIGADFL 121 ARWYNGTDNK NTPVYVSSPT WENHNGVFSA AGFKDIRSYR YWDAEKRGLD LQGFLNDLEN 181 APEFSIFVLH ACAHNPTGTD PTEEEWKQIA AVMKRRFLFP FFDSAYQGFA SGDLEKDAWA 241 IRYFVSEGFE LFCPQSFSKN FGLYNERVGN LTVVGKEHDS VLRVLSQMEK IVRITWSNPP 301 AQGARIVATT LSNPELFKEW KGNVKTMADR ILTMRSELRA RLEALKTPGT WSHITEQIGM 361 FSFTGLNPKQ VEYLVNEKHI YLMPSGRINM CGLTTKNLDY VATSINEAVT KFQ # 201 LDH‐B
NP_036727 L‐lactate dehydrogenase B chain[Rattus norvegicus]
1 MATLKEKLIA PVADDETAVP NNKITVVGVG QVGMACAISI LGKSLADELA LVDVLEDKLK 61 GEMMDLQHGS LFLQTPKIVA DKDYSVTANS KIVVVTAGVR QQEGESRLNL VQRNVNVFKF 121 IIPQIVKYSP DCTIIVVSNP VDILTYVTWK LSGLPKHRVI GSGCNLDSAR FRYLMAEKLG 181 IHPSSCHGWI LGEHGDSSVA VWSGVNVAGV SLQELNPEMG TDNDSENWKE VHKMVVDSAY 241 EVIKLKGYTN WAIGLSVADL IESMLKNLSR IHPVSTMVKG MYGIENEVFL SLPCILNARG 301 LTSVINQKLK DDEVAQLRKS ADTLWDIQKD LKDL
# 501 UQCRC1
NP_001004250 ubiquinol‐cytochrome c reductase core protein 1 [Rattus norvegicus]
1 MAASAVCRAA CSGTQALLRT CRSPALLRLP ALRGTATFVQ ALQSVPETQV SVLDNGLRVA 61 SEQSSHPTCT VGVWIDVGSR YETEKNNGAG YFLEHLAFKG TKNRPGNALE KEVESIGAHL 121 NAYSTREHTA YLIKALSKDL PKVVELLADI VQNISLEDSQ IEKERDVILR EMQENDASMQ 181 NVVFDYLHAT AFQGTPLAQA VEGPSENVRR LSRTDLTDYL SRHYKAPRMV LAAAGGVKHQ 241 QLLDLAQDHF SSVSQVYEED AVPSITPCRF TGSEIRHRDD ALPLAHVAIA VEGPGWANPD 301 NVALQVANAI IGHYDCTYGG GVHLSSPLAS VAVANKLCQS FQTFNISYSE TGLLGAHFVC 361 DAMSIDDMIF FLQGQWMRLC TSATESEVTR GKNILRNALI SHLDGTTPVC EDIGRSLLTY 421 GRRIPLAEWE SRIEEVDAQM VREVCSKYFY DQCPAVAGYG PIEQLSDYNR IRSGMFWLRF
Table A.3: Amino acid sequence of succinyl CoA ligase.
pI 9,9 Mr 37.6 NP_446204 Succinyl CoA ligase [GDP‐forming] subunit alpha, mitochondrial precursor [Rattus norvegicus]
1 MTAAVVAAAA TATMVSGSSG LAAARLLSRT FLLQQNGIRH GSYTASRKNI YIDKNTKVIC 61 QGFTGKQGTF HSQQALEYGT KLVGGTTPGK GGKKHLGLPV FNTVKEAKEK TGATASVIYV 121 PPPFAAAAIN EAIDAEIPLV VCITEGIPQQ DMVRVKHKLT RQGKTRLIGP NCPGIINPGE 181 CKIGIMPGHI HKKGRIGIVS RSGTLTYEAV HQTTQVGLGQ SLCIGIGGDP FNGTNFIDCL 241 DVFLKDPATE GIVLIGEIGG HAEENAAEFL KEHNSGPKAK PVVSFIAGIT APPGRRMGHA 301 GAIIAGGKGG AKEKISALQS AGVIVSMSPA QLGTCMYKEF EKRKML

110 Appendix
Table A.4: Theoretical MS/MS fragmentation of doubly oxidized peptides of Aco‐2.
LTGTLSGW2(ox)TSPK (aa 234‐245)
Unmodified peptide di‐oxidized peptide
1247,663 Da [M+H]1+ 1279,663 Da [M+H]1+
b‐ions residue y‐ions b‐ions residue y‐ions
114,092 1 L 12 114,092 1 L 12
215,140 2 T 11 1134,580 215,140 2 T 11 1166,580
272,161 3 G 10 1033,532 272,161 3 G 10 1065,532
373,209 4 T 9 976,510 373,209 4 T 9 1008,510
486,293 5 L 8 875,463 486,293 5 L 8 907,463
573,325 6 S 7 762,379 573,325 6 S 7 794,379
630,346 7 G 6 675,347 630,346 7 G 6 707,347
816,426 8 W 5 618,325 848,426 8 fW 5 650,325
917,473 9 T 4 432,246 949,473 9 T 4 432,246
1004,505 10 S 3 331,198 1036,505 10 S 3 331,198
1101,558 11 P 2 244,166 1133,558 11 P 2 244,166
12 K 1 147,113 12 K 1 147,113
EGW2(ox)PLDIR (aa 371‐378) Unmodified peptide di‐oxidized peptide
985,54 Da [M+H]1+ 1017,60 Da [M+H]1+
b‐ions residue y‐ions b‐ions residue y‐ions
130,050 1 E 8 130,050 1 E 8
187,072 2 G 7 856,468 187,072 2 G 7 888,151
373,151 3 W 6 799,447 405,151 3 fW 6 831,151
470,204 4 P 5 613,367 502,204 4 P 5 613,367
583,288 5 L 4 516,315 615,288 5 L 4 516,315
698,315 6 D 3 403,231 730,315 6 D 3 403,231
811,399 7 I 2 288,204 843,399 7 I 2 288,204
8 R 1 175,120 8 R 1 175,120

Appendix 111
2(ox)WVVIGDENYGESSR (aa 657‐671) Unmodified peptide di‐oxidized peptide
1667,80 Da [M+H]1+ 1699,80 Da [M+H]1+
b‐ions residue y‐ions b‐ions residue y‐ions
187,087 1 W 15 219,087 1 W 15
286,156 2 V 14 1481,687 318,156 2 V 14 1481,687
385,224 3 V 13 1382,619 417,224 3 V 13 1382,619
498,308 4 I 12 1283,550 530,308 4 I 12 1283,550
555,329 5 G 11 1170,466 587,329 5 G 11 1170,466
670,356 6 D 10 1113,445 702,356 6 D 10 1113,445
799,399 7 E 9 998,418 831,399 7 E 9 998,418
913,442 8 N 8 869,375 945,442 8 N 8 869,375
1076,505 9 Y 7 755,332 1108,505 9 Y 7 755,332
1133,527 10 G 6 592,269 1165,527 10 G 6 592,269
1262,569 11 E 5 535,248 1294,569 11 E 5 535,248
1319,591 12 G 4 406,205 1351,591 12 G 4 406,205
1406,623 13 S 3 349,184 1438,623 13 S 3 349,184
1493,655 14 S 2 262,152 1525,655 14 S 2 262,152
15 R 1 175,120 15 R 1 175,120

112 Appendix
EGW2(ox)PLDIR (aa 371‐378)
2(ox)WVVIGDENYGESSR (aa 657‐671)
Figure A.2: MS/MS spectra of the doubly oxidized peptides of Aco‐2. The respective b‐ and y‐ions are indicated for unequivocal identification of the modified tryptophan.

Appendix 113
B. Publications
Journal articles: • Dyballa N. and Metzger S. (2009). Fast and sensitive colloidal coomassie G‐
250 staining for proteins in polyacrylamide gels. J Vis Exp. 2009 Aug 3; (30).
Doi 10.3791/1431
• Dyballa N. (2008). Sensitive Coomassie‐Färbung. Laborjournal, Service‐
Magazin für Medizin und Biowissenschaften, Heft 4/2008
Book chapter: • Dyballa N. and Metzger S. Coomassie staining in quantitative proteomics.
Contribution to Methods in Molecular Biology, Vol.xxx: Quantitative Methods
in Proteomics, Humana Press (in preparation).
Abstracts: • Dyballa N., Schuh C., Vogt H., Metzger S., and Weber N. (2009). Cardiac
proteome alterations during the time course of desflurane preconditioning in
vivo. European Journal of Anaesthesiology, Vol. 26, Suppl. 45
• Dyballa N., Schuh C., Vogt H., Schlack W., Weber N.C., and Metzger S. (2008).
Proteomic analysis of cardiac targets involved in anesthetic‐induced
preconditioning. Wiley’s GoProteomics, HUPO Abstracts 2008, POS‐WED‐113
• Dyballa N., Metzger S., Toma O., Schlack W., and Hauck‐Weber N.C. (2007).
An improved proteomics‐based approach for the analysis of modifications in
the cardioprotection by pharmacological preconditioning. Naunyn‐
Schmiedeberg’s Archives of Pharmacology, Vol. 375, Suppl. 1
• Dyballa N., Weber N.C., Metzger S., Toma O., and Schlack W. (2006).
Proteomic analysis of pharmacologically preconditioned rat myocardium by
two‐dimensional gel electrophoresis. Naunyn‐Schmiedeberg’s Archives of
Pharmacology, Vol. 372, Suppl. 1