analysis of dynamic retail electricity rates and...
TRANSCRIPT

Taylor VanderKley
Ahlmahz Negash, Daniel Kirschen
7-25-2014
IEEE Conference on Sustainable Technology
Analysis of Dynamic Retail Electricity Rates and Domestic Demand Response
Programs

Overview
• Background
• Modified Real Time Price (mRTP)
• Rate Comparisons
– Case Study 1: House Categorization
– Case Study 2: Yearly Savings Analysis
• Findings
• Further Exploration

Background

State of Residential DR in the U.S. • Advanced Metering Infrastructure (AMI) penetration
increased from 4.8 % in 2008 to 23.9 % in 2012
• However only 2.1 million (~1.68 %) US residential customers reported TOU participation in 2012
• The proposed rate design, “Modified Real Time Price” (mRTP) attempts to solve the issue of participation
Source: FERC, "Assessment of Demand Response & Advanced Metering”, 2012.

Modified Real Time Price (mRTP)

California ISO (CAISO) Grid Condition RTP
• Customers receive a signal updating them on grid conditions
• Scale from 0-10, matching the grid condition to a certain multiple of the off or on peak average price

CAISO Grid Condition Index • Blue : Use Now
• Green: Use Freely
• Yellow: Use Cautiously, Defer Tasks if Possible
• Red: Use Sparingly, Shut Down Low Priority Devices
Source: CAISO, “White Paper Proposal – Wholesale Grid State Indicator
to Enable Price Responsive Demand”, 2012

mRTP

Daily Example: Comparison of Rates
0 5 10 15 20 25 20
30
40
50
60
hour
$/M
Wh
Day 2
mRTP1 mRTP10 Flat

Rate Comparisons

Case Study 1: House Categories
• Smart meter data from nine houses were analyzed.
• Houses fell into one of three categories
– Houses that benefit from mRTP (Houses 6-9)
– Houses that benefit from the flat rate (Houses 1, 2 & 4)
– Houses that are indifferent to rate design (Houses 3 & 5)

Average Daily Loads: Houses 6-9

Average Daily Loads: Houses 1, 2 & 4

Average Daily Loads: Houses 3 & 5

Case Study 2:Yearly Savings Analysis
• Goals:
– Determine the amount of potential savings of each household (Δ), & pick a representative for each category
– Differentiate between savings due to switching to mRTP and the savings due to shifting/ reducing load
– Determine who service providers should focus their attention

Assumptions
• When households participate, they shift their load without reducing
• Household shift behavior is the same
– Dependent on two factors:
• n, the # of hours participated daily
• s, the overall amount of shifted load in kW
Shifted load, s was evenly distributed amongst the n cheapest hours of the same day

Quantifying DR Participation
• Two metrics to quantify DR: Frequency (F) & Magnitude (M)
– Frequency is measured in percent of hours where shifting occurs
– Magnitude is measured in percent of load shifted at each instance of participation
– F and M are both broken into 4 subsets

Quantifying DR Participation (cont.)
Breakdown of the Four Different
Frequency Participation Levels
Breakdown of the Four Different
Magnitude Participation Levels

Yearly Savings Analysis (cont.)
• One household was selected for each category
– House 8: Benefits from mRTP, Δ = + 6.87%/yr
– House 4: Benefits from the flat rate, Δ = -3.52%/yr
– House 3: Indifferent to rate design, Δ = 0.03 %/yr

Yearly Savings: Benefits from mRTP

Component of Yearly Savings Due to Shifting Load: Benefits from mRTP

Yearly Savings: Benefits from Flat Rate

Component of Yearly Savings Due to Shifting Load: Benefits from Flat Rate

Yearly Savings: Indifferent from Rate Design
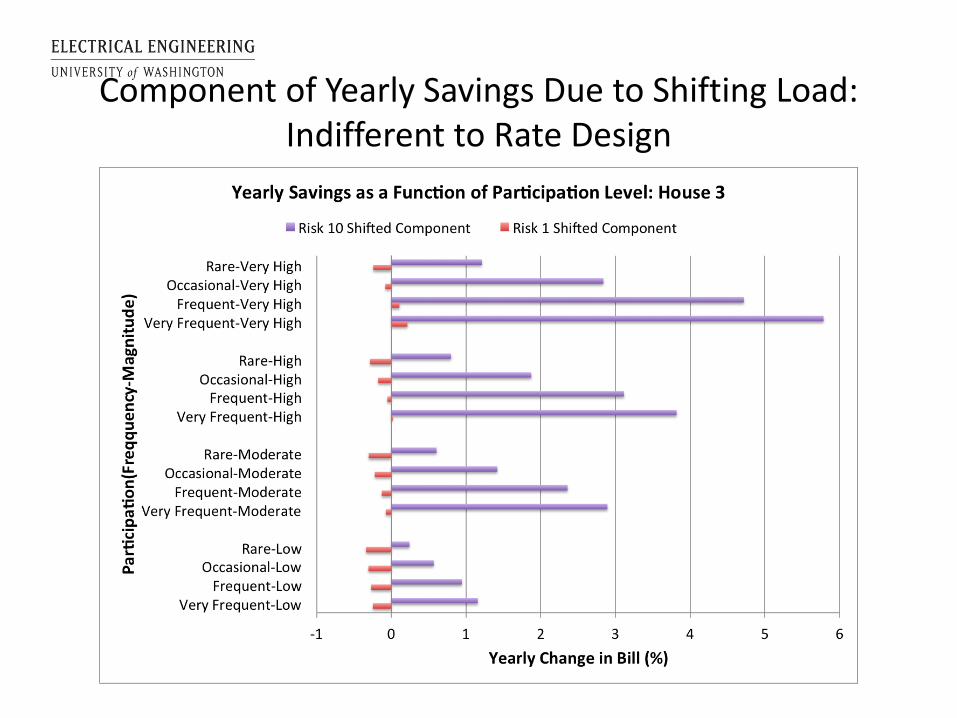
Component of Yearly Savings Due to Shifting Load: Indifferent to Rate Design

Main Conclusion
Households with average load profiles like the indifferent category, have the most incentive to participate in DR with mRTP.

Further Exploration
• Customer behavior is not ideal: Developing a model with random customer behavior
• Exploration of mRTP in different regions of the United States
• Quantifying the effect of grid condition indexing (incentivizing participation on the front end)

Questions?