analysis of edp performance contract nas2--13 758 final ... · pdf fileanalysis of edp...
TRANSCRIPT
NASA-CR-Z 95726
ANALYSIS OF EDP PERFORMANCE
Contract NAS2--13 758
FINAL REPORT
14 February 1994
R_ised
4 April 1994
Prepared for:
National Aeronautics and Space AdministrationAmes Research Center
Moffett Field, California
Loral Federal Systems
3700 Bay Area Blvd.
ttouston, Texas 77058
,4"O" O-
eq t_ _e_I ,.. 4"
,,1" U 0
o_.0 -'- C%w _0
tl. 0 r,'_O,.J
.J Oaa<_ C_._
,0 t=.- •N,-aa
ur EO,w L
I Z_"
ZUaC_
,-4"0
_g
https://ntrs.nasa.gov/search.jsp?R=19940025440 2018-04-24T12:23:38+00:00Z

04/15/94 14:08 _30I 621 013_ NAS._ CA$I
CENTER RELEASE FORM
NASA MiSCellaneOus Publications
OO2
O)
PUBUCLY AVAILABLE
LIMITED:
Avallabl_ Only From:
Dste
(CF_ 9/9_)
APR 15 '94 10=89 301 621 0t34 PREiE.082
_00"39_d 80:0I 17G, I ! _UN

Contents
1. Introduction
,
.
.
Scope
Performance Analysis Factors (SOW Subtask 1)
Selection of Benchmarks and Mixes (SOW Subtask 2)
5. Performance versus Power (SOW Subtask 3)
6. Consideration of New Features (SOW Subtask 4)
7. Performance Calculations (SOW Subtask 5)
8. Performance Measurements
9. Observations and Discussions of Results
10. Summary, Conclusions, & Recommendations (SOW Subtask 6)
11. References
i

1.0 Introduction
The objective of this contract was the investigation of the potential
performance gains that would result from an upgrade of the Space
Station Freedom (SSF) Data Management System (DMS) Embedded
Data Processor (EDP) "386" design with the Intel Pentium (registered
trade-mark of Intel Corp.) "586" microprocessor. The Pentium
("586") is the latest member of the industry standard Intel X86 family
of CISC (Complex Instruction Set Computer) microprocessors.
This contract was scheduled to run in parallel with an internal IBM
Federal Systems Company (FSC) Internal Research and Development
(IR&D) task that had the goal to generate a baseline flight design for
an upgraded EDP using the Pentium.
2.0 Scope
This final report summarizes the activities performed in support ofthe referenced contract.
Our plan was to baseline performance analyses and measurements
on the latest state-of-the-art commercially available Pentium
processor, representative of the proposed space station design, and
then phase to an IBM capital funded breadboard version of the flight
design (if available from IR&D and Space Station work) for additionalevaluation of results.
Unfortunately, the phase-over to the flight design breadboard did
not take place, since the IBM Data Management System (DMS) for
the Space Station Freedom was terminated by NASA before the
referenced capital funded EDP breadboard could be completed. The
baseline performance analyses and measurements, however, were
successfhlly completed, as planned, on the commercial Pentium
hardware. The results of those analyses, evaluations, and
measurements are presented in this final report.
2

3.0 Performance Analysis Factors (SOW Subtask 1)
The hardware and software factors delineated in Figure I were
deemed to be significant as to influence on the instruction executionrate of the Pentium based EDP. These factors were derived from the
flow model shown in Figure 2, which for analysis purposes, shows the
flow direction from main memory to the CPU (the model works with
flow in either direction, however).
These factors are shown grouped into an Equation-for-Actual-MIPS
(EFAM), shown in Figure 3 (a). The EFAM will yield the upper limit
of performance (the Von Neumann Limit-VNL) for the Pentium, as
shown in Figure 3 (b), when all factors are set to their
maximum/minimum (optimum) values.
The triple path pipelined (superscaler) Pentium will exhibit an
absolute VNL for integer performance of "2f' (which is 132 MIPS at
66 Megahertz clocking rate) and an absolute VNL of 'T' for operation
with all instructions running floating point data (66 MIPS).
Currently published vendor (Intel Corp.) optimized perfomlance
results indicate that an efficiency of only 51% is achieved with the
SPECint92 benchmark (SPECint92=67.4 MIPS), but an efficiency of
96% with the SPECfp92 (SPECfp92=63.6 MIPS). An examination ofthe Pentium flow model shows:
Q For integer performance--only one flow path is effectively utilized
on the average; or that the average instruction is taking
approximately two clock cycles,
• For floating-point performance--excellent results are achieved, i.e.
the single floating-point path remains essentially full.
3

J i
...sym_,oI
0
• _,_:v_ ,ue_o Y'y cyr.,le (_sec) "_
• LZ CO.cheh,'?-r_-r,o(rT,,) _.
• /- I ctche k,_- V'c.-,'o (_/'o) _ h.,, _OAc de l_/. (_sec). ¢pu bus &.'_') cycle _+_
(:t_: #. _ u_berj i..re_ er)
( ¢pc - i.s_lvc,_s pe_ cFle ). £.s_ru_+.'_ "m_x (cFcle_ pe_",'_z.,:.)_,z,....',_
o___ _.
J I
l-FIGURe' .1 : 1'gERFoRMAN_ " A/,/'A/.Y'$1._ I':,_.CTO/"_$
4-


I I II i

An examination of the Pentium architecture at other clock rates
reveals consistency for the integer performance. At 90 Megahertz, the
vendor optimized results are 90 SPECint92 MIPS; and tbr the P54C
the vendor optimized results at 100 Megahertz are 100 SPECint92
MIPS. Both of these yield an efficiency of 50% when compared withthe Von Neumann Lhnit of "2f".
The floating-point performance, based on published vendor
optimized results, however tends to fall in efficiency at the higher
frequencies. The 90 Megahertz version exhibits 72 SPECfp92 MIPS,
while the 100 Megahertz P54C is reported at 81 SPECfp92 MIPS.
These performance values are approximately 80% efficient--down by
16% from the 96% efficiency of the 66 Megahertz version under test
and evaluation in this project. This efficiency, however, is still quite
high, and may merely indicate that the floating-point efficiency for the
Pentium superscaler design should be realistically considered in the
80 to 90 per-cent range (maximum).
The EFAM and the Pentium architecture will be referenced and
discussed again in the section comparing theoretical performance withactual measured results.
4.0 Selection of Benchmarks and Mixes (SOW Subtask 2)
Various benchmarks and mixes, as listed in Figure 4 (a & b), were
examined for consideration as "standard" measures of performance for
the EDP processor family, i.e. from 386 versions--through 586
versions--onto future versions utilizing the Intel X86 instruction set
architecture. A unified means of measurement is considered key for
understanding the performance gains from generation to generation
and for understanding the performance differences that may
potentially result from EDP variations, such as application
7

I I
.',._"
_ Ata×ES
_ev¢lo _ed -to £*v_ lU#'ZZ ICoe.._TO .17J;oA& _,.l_A.. oerosp,_./u_c. 2$Ax
A/vO I__._,%_'/N_ - Po/N'_"SulrdF.t,
--- I I
FIGu_F_ . ...........:----.-_----_--_. ..... .......................

dependencies, card types, etc. Definitions of the two measurementsets are as follows:
Mixes--Figure 4 (a)--Generally computed for a processor by hand,
using instruction timing data from the hardware reference manual.
The "mix" is typically controlled by the number or the percentage
of the instruction types used. Mixes are useful as "rules-of-thumb"
for computers, and are usually easy to compute (in machine
language). Mixes are not often available as software packages.
Mixes are usual.ly designed to represent a particular
problem/application type-such as, integer, scientific, aerospace
(GN&C), floating point, etc. Mixes can be as simple as one
instruction, as in the case for the integer ADD mix. The strategy
behind a mix is to quickly represent the machine performance with
a number that is relatively easy to calculate, but actually yields a
rating that is commensurate with realistic throughput for that
application. The best historical example of this is the 80/20 mix
that was used in the 60's & 70's for aerospace computers. The 80%
"add" portion would realistically represent the application, and the
20% "multiply" portion would typically cover the rest of the
machine overhead from executive software to input-output
operations, etc.
Q Benchmarks--Figure 4 (b)--Benchmarks are usually larger and
more comprehensive pieces or groups of actual software, designed
to represent a particular application, mode of operation, language,
operating system, or some combination of these. Benchmarks, as
with mixes, can also be designed to exercise architectural features
of the computer, such as cache memories, pipelining, floating point,
memory management, etc. Due to the fact that benchmarks are
software packages, they may be transported from machine to
machine, and many are becoming essentially standardized. Many
of these software based benchmarks (SPECMARKS, Whetstone,
q

Dhrystone, etc.) are utilized by the industry
between models in an architectural family and
between competing architectures.
for comparisons
for comparisons
Criteria used for evaluation of the benchmarks and mixes included:
• Does it realistically and/or accurately represent real throughput?
How easy is it to use-or how easy are result numbers generated? Is
it controlled by software means? Does it require hand calculations,
assembly, or any hand coding?
• How transportable and consistent is the benchmark/mix across
various platforms?
• How standard is the benchmark/mix within the industry?
• Are relative comparisons between computers meaningful?
• How adaptable is the benchmark/mix to architectural and/or
parameter changes?
• Is the benchmark/mix "fooled" by architectural tricks or features,
such as pipelining, caching, etc.?
• How tailored is the benchmark/mix--will it reflect a bias for a
particular application or architecture?
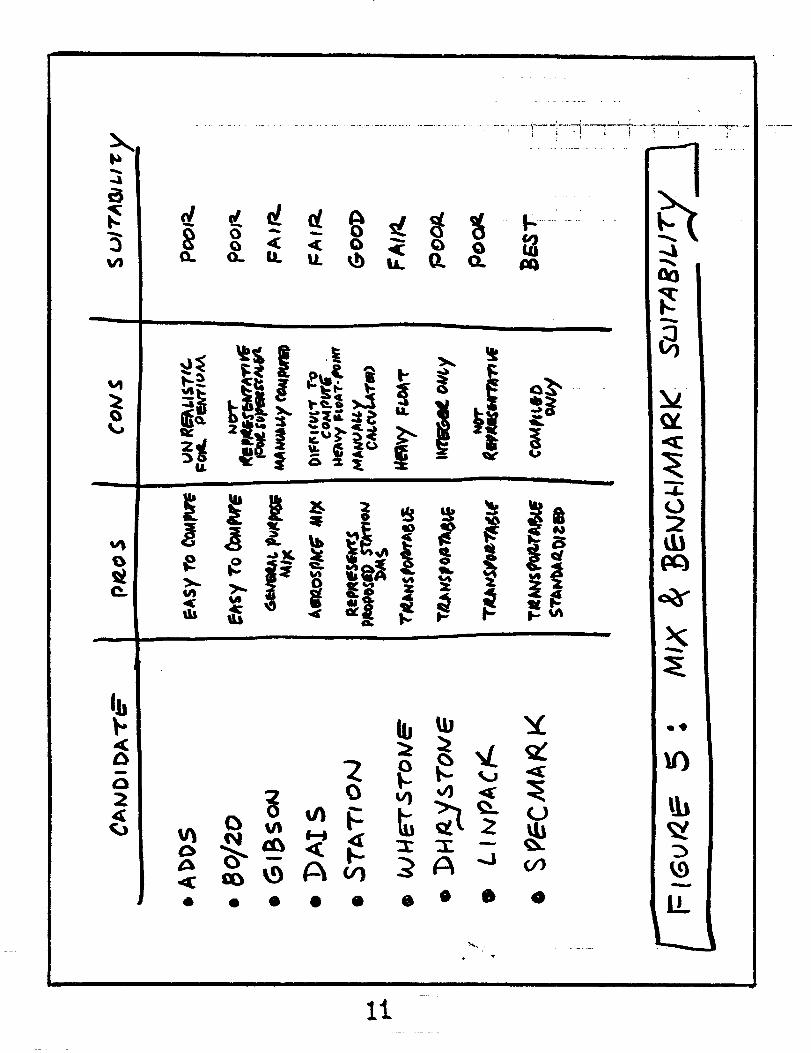
A summary of the advantages, disadvantages, and suitability of the
particular benchmarks and mixes are showal in Figure 5. The final
trade matrix results are then summarized numerically in Figure 6 tbrall of the benclmlark mad mix sets considered.
10
II l II IIIII -- mm .......
t
Ib
2
................................................................. ] _ . i
6
b tu "Xl
• • • • _ • _ O
I III IIIIlUl r |ilil ii In

| _- Ln t_ 0 0
!
lZ

After these considerations of the benchmark and mix candidates it
was determined that the SPECMARK suite would be used (as
indicated in the August 4, 1993, kickoff meeting between IBM and
NASA Ames for this project), since it is becoming a universally
accepted de-facto "standard".
5.0 Performance versus Power (SOW Subtask 3)
When implemented with the low-power version of the Pentium
(P54C), the upgraded flight version of the EDP-16 (to be designated
as EDP-16P) will potentially have a lower total power dissipation.
The removal of the 386 and 387 chips from the EDP-16 will typically
reduce the overall page power by 6 to 8 watts. The addition of the
P54C will add back approximately 4 watts when running at full clock.
The P54C is anticipated to be designed with on-chip power switching
for the various functional areas-which will permit power to
automatically vary from a fraction of a watt to full power, as a function
of performance. Unused portions of the chip will be permitted to drop
into the quiescent mode, dissipating essentially "near-zero" power,
when not in use by the application (software) running. The range of
power anticipated for the EDP-16P flight version will potentially be:
• At full capability (for the > 40 MIPS goal),
At idle (in standby mode),
-- ZI. w ,rs
t5
These values are based on the current power dissipation estimate for
the EDP-16 (with its 386 and 387 chips).
6.0 Consideration of New Features (SOW Subtask 4)
New features available with the Pentium were surveyed from a
performance point of view in order to determine if any should be
candidates for consideration in the EDP-16P design. The new features
of the Pentium examined included the following:
• The triple superscaler pipeline (two integer plus one floating point
path),
• Automatic on-chip power switching,
• Self-checking functions (redundancy and fault-tolerance aids),
• Performance monitoring and control,
• New instructions,
• New architectural features.
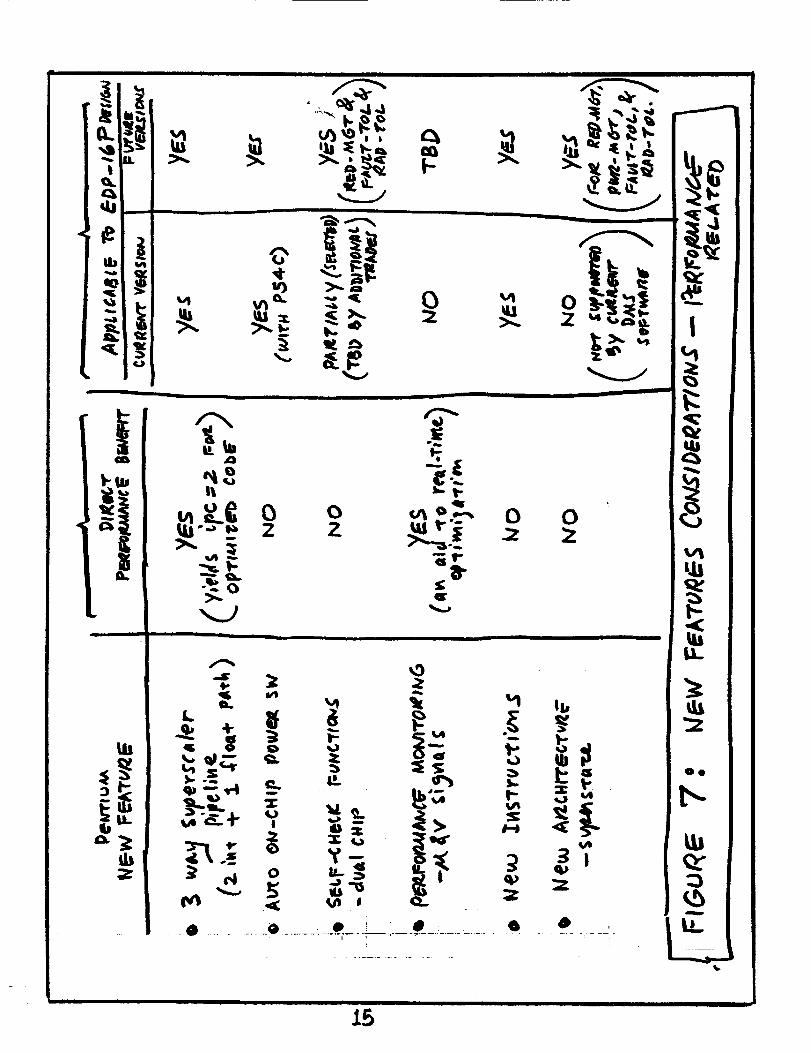
Figure 7 provides an overview of the results of the consideration of
new features in the Pentium from a performance point of view. The
most significant new feature that can potentially benefit throughput is
the three parallel flows within the superscaler architecture--two paths
for integer instructions and one path for floating-point instructions.
This feature will theoretically permit the number of instructions
executed per clock cycle to approach two (IPC=2). The architecture
attempts to automatically fill up to two of the pipes at any given time,
but is highly dependent upon the instruction flow presented by the
compiler. For this reason, existing 386 and 486 code, unless
recompiled, will execute in the Pentium with IPC = 1+A, where A will
14
I I
p.
I.L
oo
t",-
.t5

vary from zero to about 0.1 to 0.2, depending on the code layout and
the ability of the hardware to sort out the flow in real-time. As will be
seen, the results of our performance measurements will show
essentially an IPC=I when compared with vendor results that were
typically optimized for IPC=2.
7.0 Performance Calculations (SOW Subtask 5)
Performance calculations and estimates for the selected benchmark
and mix set are shown in Figure 8. The data is tabulated into two
side-by-side columns for comparison of the 20 MHz 386 EDP-16 with
the projected 586 EDP-16P (flight version). The data in the chart for
the 586 EDP-16P is shown at 60 MHz, which was the speed of the
commercial version used for performance measurements. This will
permit meaningful comparisons to be made.
The data for the "station-mix" clearly indicates that file 40 MIPS
goal for the EDP-16P is achievable and that the clock rate can be
reduced to 33 1/3 MHz to reach this level of throughput. At this set-
point a realistic IPC of 1.2 is utilized--i.e., allowing for 20 %
utilization of the multiple integer and floating-point paths through the
chip. This level of utilization does not place severe demands on the
compiler, and should be reached also with 386 and 486 code that is
carried forward to the 586 without a recompile. This should be
beneficial to projects where conservation of existing software without
additional rework or where budget limitations are key. Figure 8
shows these parameters for the 40 MIPS goal. Figure 9 shows a
graphical derivation of the set-point that yields the 40 MIPS result
with the 33 1/3 MHz clock at the IPC of 1.2 (20 % multipath
utilization).
For reference purposes, the "station-mix" is listed in Figure 10 for
the X86 instruction set architecture. This mix will yield an in-line
flow for the 386, and can be malaipulated to utilize the parallel
16

_,'7


II Im
M_olvlc_' _U _
MOVF R/MMOY_ M/A.PuSH I__ovF R_R.Mov,_ R_ ZJ CC "rA Ke_,./CC FAtt..ALIJ 2. Rp_.
Ioo.o
I II
I! •

multipath flow for the 586 (integer instructions flowing in parallel "U"
and "V" paths when permitted by the alignments; and floating-pointfollowing its path).
8.0 Performance Measurements
8.1 Hardware Configuration
The hardware configuration used for the measurements included a
commercial IBM PS/2 Server Model 95-560 and an IBM PS/2 Model
80. The Model 95-560 machine was equipped with an Intel Corp.
Pentiurn central processor unit nmning at 60 Megahertz, 64
Megabytes of main memory and a 256 kilobyte level-2 cache. The
PS/2 Model 80 was equipped with a 386 central processor unit
nmning at 20 Megahertz, a 387 floating-point coprocessor, and 16
Megabytes of main memory. The Model 80 was chosen because it
was the commercial design baseline for the Space Station DMSEmbedded Data Processor (EDP).
In addition to the two PS/2 machines, an IBM RISC/6000-730
workstation was available and was used for early familiarization with
the benchmark software before the PS/2 95-560 became available.
Although not part of this task, the benchmark data obtained from file
RISC/6000 is included in this report merely for additional comparisonand references purposes.
8.2 Software Configuration
AIX Version 1.3, a UNIX based operating system, was used onboth PS/2 platforms since the execution of the SPEC benchmark
software assumes the presence of a L_-IX based system. In addition,
AIX Version 1.3 also supports the X86 family of processors, includingthe Pentium (586).
20

8.3 Benchmark Software
The SPEC benchmark software was used to measure the
performance of the Pentium PS/2 and the 386 PS/2. The SPEC-92
benchmark release consisted of two separate suites to measure integer
operations and floating-point operations. The integer suite, CINT92,
consisted of six integer intensive benchmark programs, written in C
language. The floating-point suite, CFP92, consisted of 14 benchmark
programs, written in C and FORTRAN; stressing both single and
double precision floating-point operations.
Table 1 presents a list of the benchmark programs that make up
each suite with a brief description of each.
The SPEC benchmark procedure was to nm each program on the
system to be measured with only one process active. The resulting run
time was then recorded and normalized by dividing by a reference
time supplied by SPEC. This reference time corresponds to the time
necessary to nm the same program on a DEC VAX 11/780 computer,
as measured by SPEC. The resulting number constituted the
SPECratio for that particular benchmark routine. After all of the
programs in a suite were executed, the geometric mean of all the
individual program SPECratios were computed. This result was the
single metric for each suite, known as the SPECint92 (for the integer
results), and the SPECfp92 (for the floating-point results).
8.4 Benchmark Execution
The SPEC benchmark software was originally intended for
measuring the performance of different workstation platforms. In
order to facilitate this, the software is provided in a source code
lbnnat that must be compiled for the system under analysis. The need
for compilation results in the benchmark metrics reflecting not only
the raw processor performance, but also the performance of the
gl
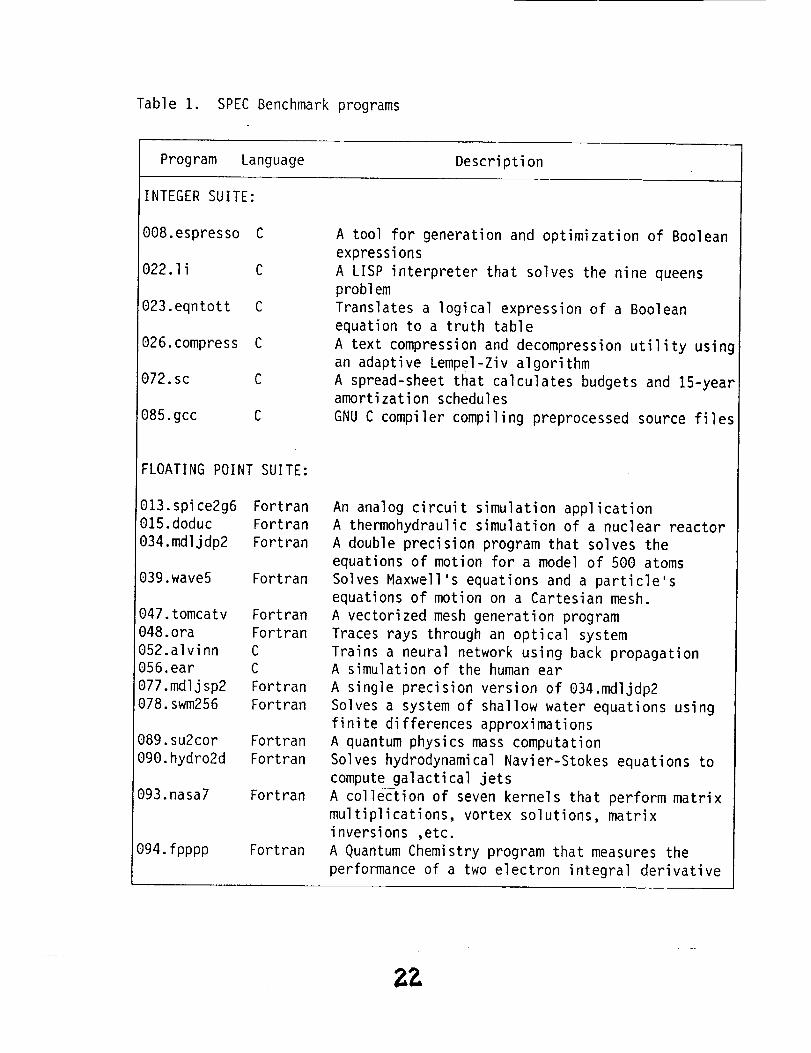
Table 1. SPEC Benchmark programs
Program Language Description
INTEGER SUITE:
888.espresso C
822.1i C
823.eqntott C
026.compress C
072.sc C
085.gcc C
A tool for generation and optimization of Boolean
expressions
A LISP interpreter that solves the nine queens
problem
Translates a logical expression of a Boolean
equation to a truth table
A text compression and decompression utility using
an adaptive LemPel-Ziv algorithm
A spread-sheet that calculates budgets and 15-year
amortization schedules
GNU C compiler compiling preprocessed source files
FLOATING POINT SUITE:
013.spice2g6 Fortran
815.doduc Fortran
034.mdljdp2 Fortran
@39.wave5 Fortran
847.tomcatv Fortran
048.ora Fortran852.alvinn C056.ear C
077.mdljsp2 Fortran
878.swm256 Fortran
889.su2cor Fortran
890.hydro2d Fortran
093.nasa7 Fortran
894.fpppp Fortran
An analog circuit simulation application
A thermohydraulic simulation of a nuclear reactor
A double precision program that solves the
equations of motion for a model of 500 atoms
Solves Maxwell's equations and a particle's
equations of motion on a Cartesian mesh.
A vectorized mesh generation program
Traces rays through an optical system
Trains a neural network using back propagationA simulation of the human ear
A single precision version of 034.mdljdp2
Solves a system of shallow water equations using
finite differences approximations
A quantum physics mass computation
Solves hydrodynamical Navier-Stokes equations to
compute galactical jets
A collection of seven kernels that perform matrix
multiplications, vortex solutions, matrix
inversions ,etc.
A Quantum Chemistry program that measures the
performance of a two electron integral derivative
2Z

compilers. Since the goal of this project was the comparison of the
Pentium performance to that of the 386-EDP, and not differences in
compilers, the benchmark programs were compiled (but not optimized
for the multiple execution paths) in the Pentium PS/2 and then copied
(as load modules) to the 386 PS/2. This eliminated any compiler
effects from the SPEC metrics--including any optimization for
multiple path execution for the 586 (the case where IPC equals 2).
The compilers used were an IBM AIX PS/2 C, version 1.2, and an
IBM AIX PS/2 VS FORTRAN compiler, version 1.1.1.
8.5 Elimination of Two Metrics--Problems Encountered
Many of the SPEC software benchmarks have been derived from
publicly available applications and have evolved to a point where they
can be ported to many different platforms. A significant number of
tools and procedures are provided with the software to aid the users in
nmning the benchmark for their particular architecture. Regardless of
this, however, individual hardware and compiler idiosyncrasies may
still affect the success of some program executions. This was the case
with 085.gcc and 039.wave5 routines. The programs ran to
completion, but comparison with the expected SPEC results were not
successful. Consequently, these two routines were eliminated fromthe benchmarks.
8.6 Software Compatibility
The Pentium (586) instruction set was advertised to be fully
compatible with the 386 instruction set, even though five new
instructions were added. There were no incompatibility issues noted
during the execution of the SPEC benclunark software suites or with
the other commercial operating systems and compilers used.
8.7 Performance Measurement Results and Comparisons
SPEC benchmark results are shown in Table 2 (Integer Suite--
SPEeint92) and Table 3 (Floating-Point Suite-SPECfp92). As can
be seen in the tables, the Pentium processor provides, as expected, a
significant performance improvement over the 386 processor for both
integer and floating-point programs. Since the objective of the projectwas to compare realistic applications, no efforts were made to
optimize the performance through manipulation of code, procedures,
compiler parameters, etc. Therefore, the resulting data presented
should reflect viable performance results that may be compared to
determine performance ratios between the two processors. The
Pentium results, when compared with SPECMARK values published
by the chip vendor, indicate that our 60 MHz version is nmning at
approximately unity IPC-the vendor results being about twice our
values, indicating that their code was optimized for IPC=2.
Tables 2 and 3 also include, as a courtesy, tile additional results
obtained for the IBM RISC 6000-730 (running AIX version 3.1).
9.0 Observations and Discussions of Results
The performance of the Pentium microprocessor is clearly superior
to that offered by its 386 predecessor. The following observations ofthe measurements and evaluations were made:
The performance ratio between the 20 MHz 386 and the 60 MHz
586 was found to be approximately 10:1 for the non-optimized(IPC=]) case, nmning the station-mix;
• Pentium pertbnnance can achieve an additional 2:1 boost over the
above ratio through optimization of the parallel flow (IPC=2),

Table 2. SPEC Benchmark Comparisons - Integer Suite (SPECint92)
BenchmarkSPEC
Reference
Time
(Sec)
Oe8.espresso 2278
RS/6888-738
Elapsed
Time
(Sec)
110.0
SPECratio
20.64
PS/2-80 (386)
(20 MHz)
ElapsedTime
(Sec)SPECratio
1.80
PS/2-95 (PENTIUM)
(60 MHz)
ElapsedTime
(Sec)SPECratio
1261.3 64.1 35.41............ I ......... I ....... I ......... I ....... I ......... I ................
022.1i 6210 292.2 21.25 2328.3 2.67 127.3 48.78
............ I ......... I ....... I ......... I--- .... I ......... I ....... I .........
023.eqntott 1100 42.4 25.94 719.4 1.53 46.6 23.61............ I ......... I ....... I ......... I ....... I ......... I ....... I .........
026.compress 2770 130.7 21.19 1540.0 1.80 140.0 19.79
............ I ......... I ....... I ......... I ....... I ......... I ....... I ..........
072.sc 4530 218.5 20.73 2060.8 2.20 130.5 34.71
Geom Mean:
SPECint92 21.31 1.96 30.87
Execution time measured in a VAX 11-780 processorReference SPEC time=
SPECratio = Execution time of system being measured divided by theReference SPEC time
SPECint92 = Geometric mean (nth root of the product) of the individual values
in the SPECratio column
Z5

Table 3. SPEC Benchmark Comparisons - Floating Point Suite (SPECfp92)
Benchmark
SPEC
Reference
Time
(Sec)
813.spice2g6 24008
RS/6000-730
Elapsed
Time
(Sec)
815.1
SPECratio
29.44
PS/2-80 (386)(20 MHz)
Elapsed
Time SPECrati
(Sec)
13352.1 1.88
PS/-95(68
Elapsedo Time
(Sec)
849.8
(PENTIUM)MHz)
SPECratio
28.27
015.doduc 1860 61.9 30.05 1735.0 1.07 58.7 31.69
034.mdljdp2 7090 157.3 45.07 8735.7 0.81 212.5 33.36
047.tomcatv 2650 32.0 82.81 2963.5 0.89 134.6 19.69
048.ora 7420 183.9 40.35 5118.0 1.45 152.8 48.56
052.alvinn 7690 110.2 69.78 5626.2 1.37 164.2 46.83
056.ear 25500 463.0 55.08 21388.8 1.19 508.4 50.16
077.mdljdp2 3350 172.4 19.43 10539.8 0.32 172.0 19.48
-
089.su2cor 12900 159.8 80.73 7995.9 1.61 460.5 28.01
090.hydro2d 13700 284.6 48.14 15882.2 0.86 541.0 25.32
093.nasa7 16800 206.5 81.36 18582.2 0.90 1115.8 15.06
094.fppp
Geom Mean:
SPECfp92
9200 188.1 48.91
Reference SPEC time: Execution
SPECratio = Execution time of system
Reference SPEC time
8015.91 54.891.15 167.6
1.01
a VAX 11-780
43.18 29.73
time measured in processor
being measured divided by the
SPECfp92 = Geometric mean (nth root of the product) of the individual values
in the SPECratio column

Q When clock rates are equalized for 386 and 586, the performance
ratio running the station-mix (with IPC=I) remains at
approximately 4:1 (12 MIPS versus 45 MIPS for both at 60 MHz);
with IPC=2, this ratio grows back to 10:1 (12 M]PS vs. 118 MIPS).
10.0 Conclusions, and Recommendations (SOW Subtask 6)
An upgrade of the Space Station 386-EDP-16 to the Pentium based
586-EDP-16P is deemed to be feasible, based on the results of our
evaluations. The 40 MIPS goal (for station-mix) appears to be
adequately achievable with a 33 1/3 MHz clock--allowing for 20 per-
cent fill of the parallel paths (IPC=I.2). This EDP-16P configurationshould then yield approximately 17 MIPS for both SPECint92 and
SPECfp92, at IPC=I, and approximately 34 MIPS peak for both suiteswith IPC=2.
The following recommendations for additional analysis, evaluationand testing are included for your consideration:
The actual flight implementation of the EDP-16P should be made
with the low-power P54C version of the Pentium; lower power
dissipation results from the smaller geometry, and on-chip powerswitching permits near quiescence,
A parallel EDAC implementation should be considered for the
EDP-16P design to eliminate the in-line time delay between main
memory and the on-chip level one cache (to permit lower
cost/slower main memory chips). The analysis and results
presented in this work assumed that the EDAC and memory cycletime was short enough to present zero wait conditions to the CPU,
The dual chip capability of the Pentium architecture should be
investigated tbr operation in both fault-tolerant modes and in
radiation-tolerant modes. The master/slave cross compare error
27

detection capability permits near 100 % coverage of soIVtransienterrors,
Additional measurements of the EDP-16P are needed to isolate and
determine the remainder of the hardware and software performance
parameters, as indicated in Figure 1,
I The superstate for power management should be investigated for
utilization in redundancy management and fault-tolerance
applications; additional software residing at this level can perform
operations transparent to the conventional application softwarerunning,
Q Enhanced performance monitoring and control (in real-time) can be
achieved with the Pentium, to provide advanced AGE capabilities;
in addition, two special signals (IU and IV) indicate the progress
through the integer pipelines--potentially useful for dynamicallycontrolling the instruction stream for achievement of maximum
throughput.
11.0 References
1. Perfomlance Analysis and Kernel Size Study of the Lynx real-time
Operating System; Liu, Gibson, & Fernquist; Computing-in-Aerospace 9; San Diego, October 1993.
. Operation of Commercially-Based Microprocessor Technology in
a Space Radiation Environment; Yelverton; Computing-in-Aerospace 9; San Diego, October 1993.
, Teclmique and Applications of Device Driver Dynamic Loading;
Liu, Gibson, & Fernquist; Computing-in-Aerospace 9; SanDiego, October 1993.
28
4. P5 Engineering Data Books--Architecture and Instruction Set;Intel Corporation; 1992
5. EDP-16P Design Notes; Hai Vu; IBM Federal Systems, Houston;November 1993
6. IBM PS/2 Pentium Design Notes; IBM Boca Raton; 1992
7. Performance Calculation Notes;
Systems; Houston, 1993.
Yelverton; IBM Federal
8. Performance Measurements Notes; Alari; IBM Federal Systems;Houston, 1993.