analysis of electrical phenomena occurring in thermally assisted
TRANSCRIPT
12
Analysis of Electrical Phenomena Occurring in Thermally Assisted Mechanical Dewatering
Processes (TAMD)-a Preliminary Study
Akrama Mahmoud1, Aurora Fernandez1 and Patricia Arlabosse2
1 UMR5504, UMR792 Ingenierie des Systemes Biologiques el des Precedes, Toulouse 2 RAPSODEE CENTRE (UMR CNRS 2392), Ecole des Mines d'Albi-Carmaux
France
1. Introduction
The design, modelling and simulation of solid-liquid separation processes remain a challenging area due to difficulties in quantifying distribution of the phases in the filter cake, and in acquiring reliable experimental data for model development. Usually, overall mechanical dewatering parameters, such as filtrate volume, average volume fraction of solids, or cake thicknesses are measured. A more fundamental approach is to determine the internal structure of filter cakes, i.e., the profile of the solid volume fraction, in order to investigate the role of the material behaviour during compression steps. In most cases, profiles of solid volume fraction have been investigated using electrical resistance meters (Shirato & Aragaki, 1972; Chase & Willis, 1991). During the measurements, iron pins are positioned at the wall of the filter cell, disturbing the liquid flow and cake formation. Some investigators studied profiles of solid volume fraction in filtration cakes with X-rays (Bierck et al., 1988; Tiller et al., 1990) or nuclear magnetic resonance (NMR) (Horsfield et al., 1989). In our knowledge, the investigation of the solid distribution in a filter cake by electrical tomography technique has not been reported before. This contribution describes preliminary studies for the application of electrical resistance tomography (ERT) for the determination of local volume fractions of solids in a filter cake during the thermally assisted mechanical dewatering process (TAMD) (Fernandez et al., 2005). ERT is a non intrusive and non-destructive technique, which does not influence cake. Moreover, electrical resistance tomography (ERT) belongs to real-time, low-cost, easy to implement and fast techniques which exploit differences in the electrical properties of solids and liquids. Electrical resistance tomography basically consists in reconstruction of the conductivity distribution from electrical data which characterize the electrical response of a medium. The electrical current flow in a saturated packed bed submitted to an electrical field is depending on the solid and liquid phases, namely the dispersed and the continuous phases, which have different properties. Several theories have been proposed for the transport of electrical current in mixtures (Helfferich, 1962). However, most of the theories are based on the assumptions of either a regular lattice-type arrangement or a completely random distribution of the components that are not well adapted for filtration cakes. Electrical conductivity of saturated packed bed varies with the mobility and affinity of ions with
www.intechopen.com

Recent Advances in Modelling and Simulation
202
which solid particles are in contact (Helfferich, 1962). For very low specific conductivity of the liquid phase, the specific conductivity of the packed bed is enhanced by the presence of solid particles. In contrast, when liquid phase conductivity is high, their contribution to electrical transport becomes more significant. This is especially useful in ERT applications where concentration of electrolyte plays a significant role. Nevertheless, the electrical features of solid particles have been little investigated, in spite of the appreciable ohmic drops measured in packed beds. The present chapter concerns the investigation of the electrical behaviour of a packed-bed, with particular emphasis on bed conductivity determination. For this, different packed-beds have been constituted using potassium chloride solutions, as liquid phase, and model materials, with different particle size distribution, as solid phase. The electrical conductivities of the packed-beds were determined, using a model for the conductivity of two-phase media, by measurement of the bed impedance in a lab cell with two facing Pt sheets. Then the primary potential distribution and current density (field analysis) in a TAMD dedicated cell were carried out in a two-dimensional domain using Femlab ™ software. Current density field deduced from the potential field led to second estimation of the electrical bed conductivity. The measured bed conductivities were compared to the numerical predictions and the consistency of these techniques is discussed. After this introductive section, section 2 gives a brief overview of the electrical tomography technique. Section 3 devotes to the introduction of different strategies for data collection and section 4 concerns with the primary sensors (electrodes) of a typical ERT system. Section 5 discusses mathematics for describing electrical fields in ERT, and numerical methods used to approximate the solution. After that, a study of the theoretical relationship between packed-bed conductivity and solid content is carried out in section 6, and the proposed plug flow model is described. The experimental procedures and some experimental results are presented and discussed in sections 7 and 8. Section 9 describes the numerical approach to tomography-forward problem with an emphasis on modelling and computation used to predict current density fields using Femlab Multiphysics®. Finally, conclusions are given in section 10.
2. A historical overview
Tomography methods are mainly employed for obtaining estimated images of a cross section of an object. X-ray tomography was the first to be developed (in 1960s) and its use is now routine not only in medicine but in some industrial applications as well (internal inspection of mechanical components and flaw detection in materials, for example). Since then a number of new tomography methods aimed at industrial processes have emerged, collectively known as process tomography (Williams & Beck 1995). The main goal of process tomography methods, which started to develop in the mid 1980s, is to produce an image of the phase or component distribution in an industrial process using only external sensors and without causing any perturbation to it. In other words, process tomography provides a way of 'looking' inside the process, from the outside and with no need for physical intrusion or alteration, in a radically new global approach to gathering structural information on the process, unlike the traditional methods based on local sampling. Examples of suitable processes are those occurring in mixing or stirring vessels, fluidized bed reactors, separator tanks, or a pipeline carrying multiphase flow. There is a whole range of principles and techniques that can be exploited in process tomography,
www.intechopen.com

Analysis of Electrical Phenomena Occurring in Thermally Assisted Mechanical Dewatering Processes (TAMD)-a Preliminary Study
203
including electrical methods based on impedance measurement, ultrasound, magnetic resonance, optical methods and those based on ionizing radiation (X- and gammarays). Generally speaking, ionizing radiation methods produce images with the highest definition, but are relatively slow to achieve. On the other hand, electrical methods yield lower solution images but are much faster, robust and relatively inexpensive. In particular with regard to electrical impedance tomography, or electrical tomography for short, there has been a very noticeable progress in the last few years. This type of tomography has three main modalities: electrical capacitance tomography (ECT), electromagnetic tomography (EMT) and electrical resistance tomography (ERT), as shown in Table 1. Each of these techniques has its advantages, disadvantages and limitations. The choice of a particular technique is usually dictated by many, very often contradictory, factors. These include: physical properties of the constituents of multiphase flow, the desired spatial and temporal resolution of imaging, cost of the equipment, its physical dimensions, human resources needed to operate it, and potential hazards to the personnel involved (e.g. radiation).
Table 1. Comparison of electrical tomography techniques: principles and applications
In electrical capacitance tomography or ECT (Beck et al., 1997; Gamio, 1997; Plaskowski et al., 1995), normally used with mixtures where the continuous phase is non-conducting, the sensor employed is made of a circular array of electrodes distributed around the cross-section to be examined, and the capacitance between all the different electrode-pair combinations is measured. With the help of a computer and a suitable image reconstruction algorithm, this information is used to create a map showing the variation of the dielectric constant (or relative permittivity ( )) inside the sensor area, thus providing an indication of the physical distribution of the various components of the mixture. In this particular case,
www.intechopen.com

Recent Advances in Modelling and Simulation
204
the electrodes can be located on the outside of a non-conducting pipe, in order to simplify sensor construction and avoid direct contact with the process fluids. A second external grounded metallic pipe serves as an electric screen and to provide mechanical resistance. In principle, ECT has important applications in multiphase flow measurement, particularly gas-oil two-phase flow, which often occurs in many oil wells. Additionally, ECT has potential applications to imaging, monitoring and controlling numerous industrial multiphase processes. However, so far the main limiting factor to the practical application of ECT has been the lack of fidelity or accuracy of the images obtained using the available image reconstruction methods (Yang & Peng, 2003). On the other hand, more sophisticated methods, based on iterative local optimization techniques, generally require one or more regularization parameters whose optimal value depends precisely on the (unknown) image to be reconstructed. The regularization employed has the effect of smoothing the image contours, making it more diffuse. Thus, better and more accurate image reconstruction methods are still being developed in the context of this application. Electromagnetic tomography (EMT), based on the measurement of complex mutual inductance, is relatively new and is so far unexploited for process tomography applications. This form of EMT could more accurately be termed ‘mutual inductance tomography' and can extract data on permeability ( ) and conductivity ( ) distributions. EMT can be selected for processes involving mixtures of ferromagnetic and/or conductive materials. It may applied in following or concentration measurements of ferrite labelled particles in transport and separation processes, foreign-body detection and location for inspection equipment such as used in the food processing, textile and pharmaceutical industries, crack or fault detection, and possibly imaging water concentration where the water phase is significantly ionized to ensure a high conductivity (Al-Zeibak & Saunders, 1993). In electrical resistance tomography (ERT), the basic aim is to reconstruct the distribution of electrical conductivity ( ) within an object from measurements of voltage around the periphery of a vessel. Potential applications for ERT technique are where the continuous phase is electrically conducting while the dispersed phase could be conducting or insulating. Such conditions are typically found in minerals processing applications, medical field, petrochemical field, pressure filtration, mixing, transport and separation processes (Slater et al., 2002; William & beck, 1995; Brown, 2000; Wang et al., 1999; Bond et al., 1999). Of the three techniques mentioned above, ERT is, in certain cases, the easiest to implement and the most attractive method for real-time imaging due to the availability of multi-plane measurement systems and the scalability of ERT sensors. They are also small, which makes the equipment more mobile. The low spatial resolution is well counter-balanced by high temporal resolution. In this work, it was decided to investigate the use of electrical resistance tomography (ERT) as a means of measuring the volume fraction of solids in a thermally assisted mechanical dewatering process (TAMD). Thermally assisted mechanical dewatering (TAMD) is a new process for energy-efficient liquid/solid separation which enhances conventional-device efficiency. The main idea of this process is to supply a flow of heat in mechanical dewatering processes to favour the reduction of the liquid content. An electrical tomography system will be used to image the electrical conductivity of the filtration cake. Since the conductivity of the cake depends on the product nature and composition, but also on the temperature and specific conductivity of the solid fraction, a digital treatment of the
www.intechopen.com
Analysis of Electrical Phenomena Occurring in Thermally Assisted Mechanical Dewatering Processes (TAMD)-a Preliminary Study
205
electric signals will allow a calculation of the volume fraction of solids profile inside the filtration cake. This non-intrusive measurement method will contribute largely to the understanding of the physical mechanisms involved in thermal dewatering.
3. Electrical measurement strategies
In electrical tomography technique, electrodes are distributed on the internal wall of the cell, a current is injected between a source/sink electrode pair and the corresponding differences of potential are recorded between the other pairs. The procedure is repeated for other source/sink pairs to reconstruct the spatial distribution of the conductivity of the internal medium. There are four mean strategies of data collection: adjacent, opposite, diagonal and conducting boundary (Dickin & Wang, 1996). For brevity, in the following the most common methods to configure electrodes in ERT were described.
3.1 Adjacent strategy
Brown & Segar (1987) suggested a method whereby the current is applied through two neighbouring electrodes and the voltage is measured successively from all other adjacent electrode pairs. Current is then applied through the next pair of electrodes and the voltage measurements repeated. The procedure is repeated until all the independent measurements have been made. Figure la illustrates the application of this method for a cylindrical volume conductor with N equally spaced electrodes. The adjacent measurement yields N2
measurements. However, of these, only (N(N-1)/2) are independent. Furthermore, to avoid electrode/electrolyte contact resistance problems, the voltage is not measured at a current-injecting electrode and therefore the total number of independent measurements is reduce to (N(N-3)/2).The adjacent strategy has a non-uniform current distribution since most of the current density travels near the peripheral electrodes. Therefore, the current density at the centre of the vessel is relatively low which makes the strategy very sensitive to measurement error and noise (Hua et al., 1993).
3.2 Opposite strategy
The opposite strategy, as the name suggests and as shown in Figure Ib, applies current through diametrically opposed electrodes. The electrode adjacent to the current-injecting electrode is used as the voltage reference. Thus, for a particular pair of current-injecting electrodes, the voltages are measured with respect to the reference at all the electrodes except the current-injecting ones. The next set data is obtained by switching the current to the next pair of opposite electrodes in the clockwise direction and the voltage reference electrode is changed accordingly. The whole procedure is repeated until all independent measurements have been made. Compared with adjacent strategy, the opposite strategy is less sensitive to conductivity changes at the boundary since most of the current flows through the central part of the region. Hua et al. (1993) noted that the opposite strategy yields a relatively good distinguishability due to the even distribution of currents. The number of independent measurements is given by N(3N -l)/8 (Breckon & Podcock, 1988). Consequently, the image resolution will be decreased down to 23% compared to the adjacent strategy for the same number of electrodes (Breckon & Podcock, 1985). Although the adjacent strategy results in slightly more independent measurements, the opposite strategy results in better quality measurements. This is due to the fact that the current is
www.intechopen.com

Recent Advances in Modelling and Simulation
206
more uniformly distributed in the opposite strategy and, therefore, less sensitive to noise (Dickin & Wang, 1996).
Figure 1. (a) The adjacent measurement strategy illustrated for a cylindrical volume conductor and N equally spaced electrodes, (b) The opposite measurement strategy
4. Sensors of ERT
Several recommendations for the design of ERT sensors are available in the literature pyakowski et al., 1999; Dickin & Wang, 1996; Wang et al., 1995; Hua et al., 1993). A number of important factors must be considered. The electrodes must be in direct contact with the process fluid to be analyzed. While being invasive, electrodes should be as non-intrusive as possible. The electrodes must be more conductive than the process fluid in order to obtain reliable measurements. For the majority of process application, the electrodes are metallic, e.g. stainless steel, silver, gold, platinum, silver palladium or any suitable material exhibiting similar properties. The material of construction should be selected by considering the following factors (Dickin & Wang, 1996): cost, ease of fabrication and installation, good electrical conductivity, and resistance to abrasion and corrosion. Other factors can be added such as compatibility with the vessel construction material, thermal expansion properties, safety, reliability and robustness. Positioning of the electrodes is important, because the reconstruction algorithm employed in data analysis uses assumptions regarding the relative location of the electrodes. Electrodes are commonly located at equidistant positions around the periphery of the vessel to map electrical conductivity variations across a plane or planes of interest. The size of the electrodes is also an important factor. Ideally, current-injecting electrodes should have a large surface area to ensure that an even current density is generated, while the voltage measuring electrodes should have a small surface area, ideally a needle point, in order to avoid averaging across several equipotentials (Dickin & Wang,
www.intechopen.com
Analysis of Electrical Phenomena Occurring in Thermally Assisted Mechanical Dewatering Processes (TAMD)-a Preliminary Study
207
1996). The optimal electrode size is dependent on a number of parameters, including the background conductivity. Despite these alternative recommendations, primarily for reasons of simplicity, identically sized electrodes are generally used for both current injection and voltage measurement. When choosing the number of electrodes N, it must be noted that the time taken to acquire data and reconstruct the image is a function of N, whereas the spatial resolution is proportional to , where L is the number of independent measurements. Finally, a primary consideration when building the sensors into vessel is the length of the signal-carrying cable between the electrode and the current injection/voltage measurement circuitry. Therefore, the electrodes are connected to the data-acquisition system by short lengths of co-axial cable to reduce the effect of the extraneous environmental noise and interference.
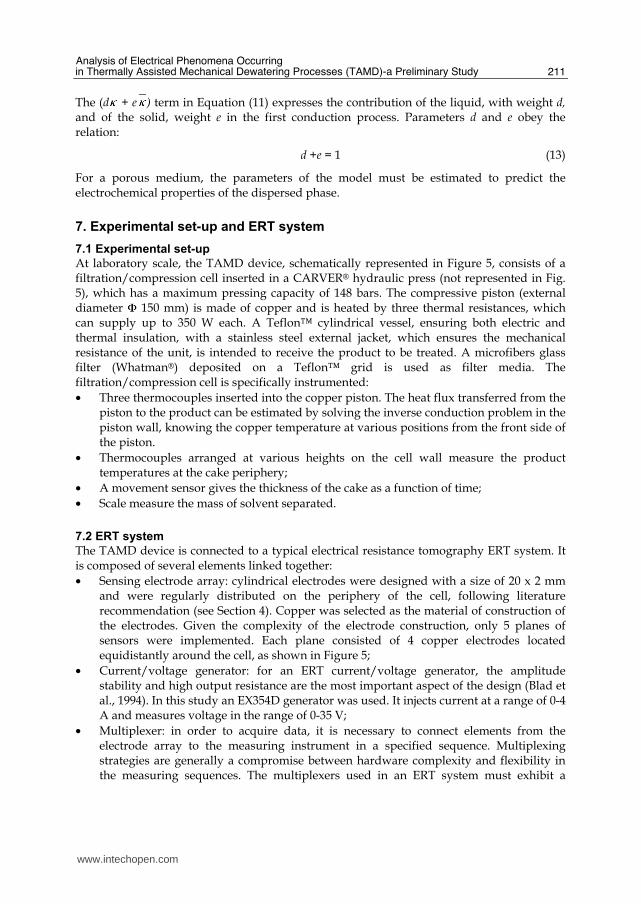
5. Governing equations
The main idea of the ERT is rather simple. With a known conductivity distribution, b , and injection current pattern, I0 , as shown in Figure 2, the resultant voltage distribution, V , at the boundary of the system as well as at its interior can be determined uniquely by the Laplace equation:
(1)
where is the domain of the interest and its boundary. The boundary conditions are as follows:
(2)
(3)
on the assumption that there is no current source inside the system. Here n is the unit normal vector.
Figure 2. ERT forward and inverse problems
www.intechopen.com

Recent Advances in Modelling and Simulation
208
Hence, the basic idea of the ERT technique is to determine (or 'reconstruct') the unknown conductivity distribution in the system with voltage data measured only at the boundary of the system using a proper image reconstruction algorithm. Resolution of the Laplace Equation (1) to obtain the voltage distribution under the known conductivity distribution is usually called 'Forward Problem'. The problem to determine the unknown conductivity distribution-the major task of the ERT-is known as a very hard 'Inverse Problem' due to its nonlinearity and ill-conditioning phenomena (Cho et al., 1999). Therefore, it is almost essential (i) to develop an accurate ERT measuring technique for the practical implementation of the ERT and (ii) to develop a fast and reliable ERT inverse problem solver. Along with the hardware improvements, several algorithms have been proposed to reconstruct the unknown conductivity by processing the measured data.
6. Flow parameter calculation using ERT
With conductivity data from ERT, the local volume fraction of solids, , can be determined by applying the Maxwell equation (Maxwell, 1981; Lucas et al., 1999; George et al., 2000):
2
b
s
b
κ κε
β κ β κ
−=
+ (4)
where is the conductivity of the continuous phase, b is the local bed conductivity, is
the volume fraction of the dispersed phase of conductivity , and is given by
1;12
κ κ α κβ α
α κκ κ
− −= = =
++ (5)
Electrical conductivity of saturated packed beds is complex because of the presence of two
conducting phases, namely the dispersed, , and the continuous phases, . According to Maxwell, the validity of Equation (4) is limited to small volume fractions. However, various researches found that Equation (4) produced good agreement with experimental data over a wide range of void fractions (Neal & Nader, 1973; Turner, 1976). If the dispersed phase is assumed to be a non-conductive material, the Equation 4 can be simplified as follows:
(6)
where K is the relative conductivity ( ). The conductivity of the continuous phase, ,
can be found easily with a widely available commercial conductivity meter, while the local bed conductivity is determined from the pixel conductivity of ERT image. If Maxwell's equation is expanded as a Taylor series, the solids assumed to be non-conductive and only two terms are considered, the following equation results:
(7)
where the value of the exponent x is 1.5, as originally determined by Bruggeman (1935). Rayleigh (1892) attempted to calculate the conductivity of regular arrays of spheres under conditions when their interactions could not be neglected. The result of Rayleigh's treatment, after correcting a numerical error in the original paper, is
www.intechopen.com

Analysis of Electrical Phenomena Occurring in Thermally Assisted Mechanical Dewatering Processes (TAMD)-a Preliminary Study
209
(8)
which applies in strictness only when the spheres are arranged in cubic order, and, further,
when e s is moderate. Other theoretical solutions to take into account the effect of the presence of solids on the electrical flux field exist, such as the obtained by Merdith & Tobias (1960) for oil-in-water emulsions:
(9)
For non-conducting solids, the Equation (9) can be simplified as following:
(10)
Concerning Merdith's works, they have little advantage over the use of Equation (7) with an empirically determined value for the exponent x. The relative conductivity with respect to volume fraction of solids has been plotted in Figure 3, for non-conducting solids, together with theoretical solutions by Maxwell, Rayleigh, Bruggeman and Merdith, respectively.
Figure 3. Relative conductivity versus volume fraction of solid
www.intechopen.com

Recent Advances in Modelling and Simulation
210
In contrast to the case of a saturated packed beds of solid inert particles (as in the present study), the geometrical, electrical and chemical properties of particles are sensitive to the chemical composition of the liquid, continuous phase, as adsorption equilibrium prevails. First attempts in modelling often involved regular lattice arrangements, as that suggested by Baron (Helfferich, 1962) who considered a statistical cage model. However, most approaches were not valid for solid particles in contact with one another. A more realistic model was developed decades ago (Wyllie et al., 1955; Mahmoud et al., 2006). It relies upon the 'porous-plug' model described below. The electrical current is considered to pass through three different paths within the bed: (i) through alternating layers of particles and interstitial solution, (ii) through particles in contact with each another, and in the channel of the liquid phase (iii). In most cases, process (i) predominates, however contribution of (ii) is significant for low-conducting liquids. If the conductivity of the liquid is considerably higher than that of the particles, the third mechanism becomes the most important. The principle can be depicted in terms of electrical resistances in parallel, as shown in Figure 4, each of them corresponding to one conduction process.
Figure 4. The 'porous-plug' model. A: schematic representation of the three paths for the current. B, simplified model consisting in three conductance elements in parallel. C, extension of the model
From the electrical circuit, the bed conductivity, b, may be written as is the sum of contributions 1, 2, and 3, of the three conductance elements:
(11)
where the parameters a, b and c are the fractional cross-section equivalents of the three elements:
a + b + c = 1 (12)
www.intechopen.com
Analysis of Electrical Phenomena Occurring in Thermally Assisted Mechanical Dewatering Processes (TAMD)-a Preliminary Study
211
The (d + e ) term in Equation (11) expresses the contribution of the liquid, with weight d, and of the solid, weight e in the first conduction process. Parameters d and e obey the relation:
d +e = 1 (13)
For a porous medium, the parameters of the model must be estimated to predict the electrochemical properties of the dispersed phase.
7. Experimental set-up and ERT system
7.1 Experimental set-up
At laboratory scale, the TAMD device, schematically represented in Figure 5, consists of a filtration/compression cell inserted in a CARVER® hydraulic press (not represented in Fig. 5), which has a maximum pressing capacity of 148 bars. The compressive piston (external diameter 150 mm) is made of copper and is heated by three thermal resistances, which can supply up to 350 W each. A Teflon™ cylindrical vessel, ensuring both electric and thermal insulation, with a stainless steel external jacket, which ensures the mechanical resistance of the unit, is intended to receive the product to be treated. A microfibers glass filter (Whatman®) deposited on a Teflon™ grid is used as filter media. The filtration/compression cell is specifically instrumented:
• Three thermocouples inserted into the copper piston. The heat flux transferred from the piston to the product can be estimated by solving the inverse conduction problem in the piston wall, knowing the copper temperature at various positions from the front side of the piston.
• Thermocouples arranged at various heights on the cell wall measure the product temperatures at the cake periphery;
• A movement sensor gives the thickness of the cake as a function of time;
• Scale measure the mass of solvent separated.
7.2 ERT system
The TAMD device is connected to a typical electrical resistance tomography ERT system. It is composed of several elements linked together:
• Sensing electrode array: cylindrical electrodes were designed with a size of 20 x 2 mm and were regularly distributed on the periphery of the cell, following literature recommendation (see Section 4). Copper was selected as the material of construction of the electrodes. Given the complexity of the electrode construction, only 5 planes of sensors were implemented. Each plane consisted of 4 copper electrodes located equidistantly around the cell, as shown in Figure 5;
• Current/voltage generator: for an ERT current/voltage generator, the amplitude stability and high output resistance are the most important aspect of the design (Blad et al., 1994). In this study an EX354D generator was used. It injects current at a range of 0-4 A and measures voltage in the range of 0-35 V;
• Multiplexer: in order to acquire data, it is necessary to connect elements from the electrode array to the measuring instrument in a specified sequence. Multiplexing strategies are generally a compromise between hardware complexity and flexibility in the measuring sequences. The multiplexers used in an ERT system must exhibit a
www.intechopen.com

Recent Advances in Modelling and Simulation
212
number of properties: such us low on-resistance, fast switching speed, low inter-switch cross talk, low cost, high reliability and low power consumption. However, because acquisition time is the critical factor in TAMD-process, the relatively low switching speeds of the reeds (typically tens of milliseconds) combined with their cost and reliability preclude their use. Consequently, Agilent 34970A 16-channel multiplexers were selected. They have the following properties: 50 Q on-resistance, 600 ms on-off transition time and 30 mA continuous switched current,
• Data acquisition system (DAS), a variety of injection strategies can be used to carry out electrical conductivity measurement and export data to a reconstruction algorithm. The enhanced data acquisition system working in an opposite measurement strategy (see Section 3.2). As the name implies, courant, I, is injected through diametrically opposing electrodes. The resulting potential differences, V, are measured on adjacent electrodes that are not used for current injection. Other specifications of the DAS are: current range 0-25 mA; frequency 9600 Hz; voltage range 0-5 V; frame speed could be increased up to 1000 ms. The measurement time is governed by the number of electrodes, the measurement strategy, current injection pattern, frequency of applied current, target accuracy for concentration measurements. This measurement time must be chosen according to whether steady or transient states are to be observed. Usually, when the time of measurement is required to be small, the time between two measurements must also be small; hence, the quantity of data to be reconstructed increases.
Here the switching time of the relays is 100 ms, 450 ms for permutations in a plane and 1000 ms for passage from one plane to another. Therefore, the total time needed to acquire five planes frame data is 5200 ms.
Figure 5. Schematic diagram of the measurement principle of ERT system
www.intechopen.com

Analysis of Electrical Phenomena Occurring in Thermally Assisted Mechanical Dewatering Processes (TAMD)-a Preliminary Study
213
7.3 Materials used
Five models of synthetic mineral and organic aqueous suspensions with particle sizes ranging from 11 to 60 μm were used for this study: (talc, kaolin, cellulose105, cellulose101, and microcrystalline cellulose (MMC)). The particle size distribution of these materials was determined using laser diffraction spectrometry (Malvern Master Sizer MS20). Then saturated synthetic suspensions of each material type were made up with a conducting continuous phase, such as diluted potassium chloride solutions.
8. Measurement of the electrical conductivity in laboratory cell
8.1 Experimental set-up Conductivity measurements were carried out in a cubic lab cell 2 cm in dimensions. Flat platinum electrodes were fixed at two opposite inner walls of the cell. The electrodes were connected to an Autolab PGSTAT 20 potentiostat with a sine function generator. The cell was first filled with the liquid phase using a polyethylene syringe and the electrochemical impedance was measured at zero cell voltage. The voltage amplitude was 5 mV and the frequency of the signal varied from 30 kHz to 30 Hz, with ten points per decade. The amount of liquid introduced was determined accurately, taking into account the meniscus of the G/L interface, corresponding to an excess of liquid. The error involved in filling the cell was estimated at approx. 2% in the 8 cm3 cell volume. After measurement of the liquid conductivity, the solid was introduced in the cell, and the bed was compacted by vibrating the cell; the excess liquid was removed using a syringe. Compact beds were obtained after the top shiny surface of the liquid over the packed bed disappeared and was replaced by the granular, irregular surface of the packed bed, uncovered by the liquid. Impedance spectra were then recorded. The formerly used solution was thereafter diluted with pure water by 20-30% and the solids were rinsed in the obtained liquid. The experimental procedure of successive measurements with the liquid, then with particles bed, was repeated. Solutions were progressively diluted until their conductivity was of the order of 10-4 S cm-1. The intercept of the impedance spectrum recorded at rest potential with the real axis led to the ohmic resistance, R, and the conductivity of the medium, K, was deduced using the relation:
1 l
R Sκ = (14)
where l is the electrode gap (2 cm), and S the electrode area (2x2 cm2). Nevertheless after calibration, the l/S ratio was taken at 0.52 cm-1. Besides, former experiments conducted with packed beds of inert materials with conducting solutions allowed estimation of parameter c (se Section 6). Numerous measurements conducted with the softest model materials led to c=0.33. This value agrees well with the value obtained by Martin et al. from modelling of heat transfer in packed beds (Raghavan & Martin, 1995), with a liquid void fraction of 40%. Then, for these model materials, only two independent parameters had to be determined amongst the series a - e.
8.2 Experimental results
Figure 6 shows the conductivity of the different packed beds versus the conductivity of the interstitial solution. The variation depends on the concentration of electrolyte solution and
www.intechopen.com

Recent Advances in Modelling and Simulation
214
the material grade, as expected. At zero liquid phase conductivity, the current takes its way exclusively through particles which are in contact with on another (the second conductance element (ii)). Even when particle contribution to bed conductivity is very small (because of the small contact area of the particles), the bed conductivity at these conditions can not be equal to zero. The bed conductivity in dilute solutions increases rapidly and is far below than that of the liquid: ions are mainly transferred by the liquid phase. The difference between b and decreases for higher concentrations of electrolyte, as shown in Figure 6, and the contribution of the liquid phase in the ion transport becomes more significant. At
the 'equicanductance' point ( b = = ), the bed conductivity is equal to the solution conductivity. This point represents also the conductivity of the corresponding model material.
Figure 6. Variation of the bed conductivity with the solution conductivity. Dotted lines are for theoretical results
8.3 Modelling of conductivities by the porous-plug model
Fitting of the experimental curves to the model gave access to the values of the parameters involved in the 'porous-plug' model. Agreement between experimental data and theoretical variations was generally good, as shown in Figure 6. The 'equiconductance' point, as explained in the previously paragraphs, represents the conductivity of the corresponding model material bed and the values obtained are given in Table 2. This Table shows good
agreement between the theoretical predictions of and the experimental values. Figure 7 schematically illustrates the ion flux within the backed beds, both horizontally and vertically, following the electrical circuit shown in Figure 4. In Figure 7, the current flows in the vertical direction. Gray-filled blocks represent the solid phase contribution whereas white blocks correspond to the solution phase. From the left, they illustrate transport through both the solution in contact to the solid phase, the solid phase, and the solution phase, respectively. For all model materials, the current is mainly transported through the alternating layers of particles and solution. Therefore, the model materials used in this study are less conductive than the solution to be treated, as expected. Although the 'porous-plug'
www.intechopen.com

Analysis of Electrical Phenomena Occurring in Thermally Assisted Mechanical Dewatering Processes (TAMD)-a Preliminary Study
215
model illustrates the pattern of the ionic flux, the conductivity of the backed bed is an important operating variable for the sake of maximum ion flux. The conductivity parameters were used to predict the conductivity of model material beds impregnated with a 1 M potassium chloride solutions. Conductivity of the solution was 0.112 S cm-1.
Material Diameter
(µm)
Theoretical electrical conductivity 105 (S/cm)
Experimental electrical conductivity 105 (S/cm)
Cellulose 105 20 0.72 0.77
Cellulose 101 60 5.65 6.05
Microcrystalline cellulose (MMC) 40 0.62 0.68
Kaolin 6 2.10 2.17
Talc 11 0.47 0.45
Table 2. Experimental and theoretical conductivities of the solid particles
Cellulose 105 Cellulose 101 MMC Kaolin Talc Figure 7. Representation of the ratio between the solid and solution phases; grey blocks are solid phases and white blocks are solution phases. Current flows vertically in the representation
9. Estimation of the bed conductivity from TAMD cell
As indicated before, bed conductivity will be a function of product nature, liquid composition, temperature and specific conductivity of the solid fraction in the cell. Ideally, the full three-dimensional problem would be solved; even when, this problem is complex. Due to the experimental limitations and computational facilities, in this work, only the calculation from the primary distribution of potential and current density was made with the following assumptions:
• 2-D analysis has been carried out;
• liquid void fraction was fixed at 40%;
• initial stage was first considered (at t = 0);
• at room temperature;
www.intechopen.com

Recent Advances in Modelling and Simulation
216
• uniform composition of the conductivity;
• absence of concentration gradients. Fortunately, the conductivity of the suspension varies slowly in the axial direction, which allows significant simplifications to the forward problem. At low frequency electrical current, the material in the imaging area follows Ohm's law Equation (1). Boundary conditions are modelled as follows:
anode cellV V= , 0
cathodeV = (15)
. 0b
V
nκ
∂=
∂ on the inert walls (16)
where V is the electrical potential, n is the unit normal vector and Vcell is the electrical potential considered for the primary distribution. This problem can be solved analytically only for a few configurations. The geometry of our system requires a numerical method. Different numerical methods can be used in complex geometries such as the finite difference method (FDM), boundary element method (BEM), and finite element method (FEM).
9.1 Iterative calculation of the bed conductivity
In the present study, the Conductive Media DC application mode from Femlab ™ software was used to determine the electrical potential field in TAMD cell (see Figure 8). The forward problem is computed on a FEM grid consisting of 12512 triangular elements as shown in Figure 8a.
(a) (b) Figure 8. (a) Finite element grid used for the forward problem. The grid consists of 12512 triangular elements, (b) Talc's distribution of the potential and current lines. (Vcell = 1.7 V, I = 0.0017 A)
For an applied current, I, injected through opposing electrodes (H and L) and an electrical potential, Vcell, the current density field is deduced from the electrical potential field using a
postulated value for the bed conductivity, best. Integration of the current along the cathode
(V = 0) yields close estimates for the cell current value, Iest. A new estimation for the bed
www.intechopen.com

Analysis of Electrical Phenomena Occurring in Thermally Assisted Mechanical Dewatering Processes (TAMD)-a Preliminary Study
217
conductivity can then be obtained from the estimated and applied currents, Iest and I respectively:
new est
b b
est
I
Iκ κ= (17)
Satisfactory convergence is usually obtained after a few iterations, yielding the bed conductivity for the current-voltage couple considered.
9.2 Porous-plug model application for bed conductivity
The bed conductivity was calculated using Equation (11), and taking into account both the actual conductivity of the solid and the local variations of , as explained below. Beds are assumed to be of uniform composition. With respect to the liquid phase, the packed bed was modelled as a porous-plug flow reactor, with negligible dispersion. The porous-plug flow was approximated by cascade of n beds of uniform composition, with height ∆x, so that lb = n∆x high of bed. The overall bed was modelled as a circuit of n electrical resistances in parallel, because of the cross-flow configuration of the system. Therefore:
( ) ( ), 0
1 1bl
b b
b x x b b
w x wx x x
R R d dκ κ
Δ
Δ= = ≈ ∂∑ ∑ ∫ (18)
where db is the width of the bed and w is the depth of the cell. The average bed conductivity, was defined from overall bed resistances, Rb
,
1b
b
b av b
dR
wlκ= (19)
Leading to:
( ),
0
1bl
b av b
b
x xl
κ κ= ∂∫ (20)
It can be observed that the axial variation of the bed conductivity was not accounted for the calculations of primary distributions, which allow the average conductivity to be estimated.
9.3 Comparison of the two approaches
The bed conductivity values determined by both methods are reported in Table 3. Data calculated from the value of the electrical potential and subsequent treatment through calculations of the primary distribution of potential/current density, are in good agreement with the experimental value estimated using porous-plug model. As a matter of fact, electrochemical cells in which the electrolyte is of uniform composition can be characterized by secondary or primary current distribution, depending on whether or not electrode kinetic effects are significant, respectively. Therefore, the present work concerned with the primary current does not take into account the electrode polarization. More rigorous calculation to overcome this inherent problem could have been made by
www.intechopen.com

Recent Advances in Modelling and Simulation
218
• Considering the secondary potential distribution in the cell. When slow electrode kinetics are taken into account, the electrolytic solution near the electrodes is no longer an equipotential surface, and the result of the calculations is the so-called secondary current distribution. This point requires more thorough investigation;
• Modelling was carried out with a volume fraction of the solid, , fixed at 60%. For a more complete analysis, a sensitivity study of the bed conductivity to the volume fraction of solids must be performed. Then modelling may be done using Equation (4) for a volume fraction of solid varying from 54 to 66%, which corresponds to ± 10% of parameter variations, as usually used. As an example, the influence of these variations on the bed conductivity is shown in Figure 9 for talc suspensions. The computed bed conductivity decreases to 0.029 S cm-1 for a differential of + 10% from the face value, and increases to 0.041 S cm-1 for a - 10% variation. The response of the model is linear for a variation of ± 10% of this parameter around the face value. The sensitivity coefficient of the bed conductivity b to the parameter will be written as follows:
( )b s
b
s
S
κ εκ
ε
∂=
∂ (21)
The reduced sensitivity coefficient of the bed conductivity to a parameter is
computed by finite difference as:
( ) ( )
'
2
b s s b s s
b s
s
S
κ ε δε κ ε δεκ ε
δε
+ − −= (22)
The use of reduced coefficients, which have the dimension of bed conductivity, allows a direct comparison of the parameters influences. A negative (respectively a positive) value of
means that an increase of the volume fraction of solid results in a decrease (respectively
an increase) of the bed conductivity.
Material
Numerical electrical conductivity of bed (S/cm)
Experimental electrical conductivity of bed (S/cm)
Cellulose 105 0.056 0.061
Cellulose 101 0.088 0.097
Microcrystalline cellulose (MMC) 0.061 0.067
Kaolin 0.052 0.059
Talc 0.035 0.039
Table 3. Experimental and numerical of the bed conductivity obtained with a liquid void fraction of 40%. (Vcell = 1.7 V, I = 0.0017 A)
www.intechopen.com

Analysis of Electrical Phenomena Occurring in Thermally Assisted Mechanical Dewatering Processes (TAMD)-a Preliminary Study
219
Figure 9. Variation of bed conductivity with the volume fraction of solid variations for talc suspensions and for a face value fixed at 60%
10. Conclusion
Electrical resistance tomography is a technique able to identify solid/liquid distribution in packed beds by identification of the bed conductivity and its subsequent modelling as a function of electrical properties of each phase. It can be performed via an array of equispaced electrodes inserted into the periphery of a process cell to map non-intrusively the spatial distribution of electrical current within. The methods of analyzing measured data of ERT system were presented and applied to estimate volume fraction of solids. The ohmic drop in conducting beds was determined using two techniques. Electrical conductivity of model material in electrolyte solutions was shown to obey the two-phase plug flow model developed decades ago by Wyllie et al. (1954). In particular, for ERT, the solution and the solid-liquid interaction terms prevail, leading to bed conductivity smaller than the electrolyte solution conductivity. Parameters of the model were determined for model material beds, allowing first estimation of the electrical conductivity of the packed beds. Using the voltage of the cell, primary distribution of potential led to a second estimation of the bed conductivity, which was plotted versus the liquid conductivity. Agreement with application of Wyllie's model was good. Future work will focus on the application of the porous-plug flow model to three-dimensional geometry since the link by Wyllie model promise for extending the analysis to more complicated geometries. Furthermore, variations in electrical conductivity need to be link to variations in temperature since it is well known that an increase in temperature leads to a decrease in electrical conductivity.
www.intechopen.com

Recent Advances in Modelling and Simulation
220
11. References
Al-Zeibak, S. & Saunders, N. H. (1993). A Feasibility study of in vivo electromagnetic imaging. Phys. Med. Bio/., Vol. 38, No. 1,151-160, ISSN 1361-6560
Beck, M. S.; Byars, M.; Dyakowski, T.; Waterfall, R.; He, R.; Wang, S. M. & Yang, W. Q. (1997). Principles and industrial applications of electrical capacitance tomography. Measurement & Control, Vol. 30,197-200, ISSN 0020-2940
Blad, B.; Johnnesson, J.; Bachman, B. & Lindsrom, K. (1994). Waveform generator for electrical impedance tomography using linear interpolation with multiplying D/A converters. Journal of Medical Engineering & Technology, Vol. 18, No. 5,173-178, ISSN 7776358
Bond, J.; Cullivanu, J. C; Climpson, N.; Faulkes, I.; Jia, X.; Knstuch, J. A.; Paylon, D.; Wang, M.; Wang, S. J.; West, R. M. & Williams, R. (1999). Industrial Monitoring of Hydrocyclone Operation Using Electrical Resistance Tomography. Mineral Engineering, Vol. 12, No. 10,1245-1252, ISNN 0892-6875
Breckon, W. R. & Picdcok, M. K. (1985). Mathematical aspects of BIT imaging. Clin. Phys. Physiol. Meas. ,Vol. 8, No. 4, 77-84, ISSN 0143-0815
Breckon, W. R. & Picdcok, M. K. (1988). Some mathematical aspects of EFT mathematic and computer science in medical imaging, M. A. Viergever and A. E. Todd-Pokropk (Berlin: Springer), PP 351-362
Brown, B.H.; Seagar, A.D. & Barber, D. C. (1987). Electrical impedance imaging. IEE Proceedings, Part A: Physical Science, Measurement and Instrumentation, Management and Educati, Vol. 134, No. 2,201-210, ISNN 0143-702X
Brown, B. (2001). Medical impedance tomography and process impedance tomography: A brief review. Measurement Science and Technology, Vol. 12, No. 8, 991-996, ISSN 0957- 0233
Bruggeman, D.A.G. (1935). Berechnung verschiedener ohysikalischer Konstanten von heterogenen Substanzen. I. Dielectrizitatkonstanten und Leitfahigkeiten der Mischkorper aus isotropen Substanzen. Ann. Physik Leipzig, Vol. 24, 636-679, ISSN 0003-3804
Cho, K.-H.; Kim, S. & Lee, Y.-J. (1999). A fast BIT image reconstruction method for the two-phase flow visualization. Int. Comm. Heat Mass Transfer, Vol. 5, No. 26, 637-646, ISSN 0735-1933
Dickin, F. & Wabg, M. (1996). Electrical resistance tomography for process applications. Measurement Sciences and Technology, Vol. 7, No. 3,247-260, ISSN 0957-0233
Dyakowski, T.; Miko, M.; Vlaev, D.; Mann, R.; Follows, G. W.; Boxman, A. & Wilson, M. P. W. (2000). Imaging nylon polymerisation by applying electrical tomography. Chemical Engineering Journal, Vol. 77, No. 1,105-109, ISSN 1385-8947
Fernandez, A.; Arlabosse, P. & Descoins, N. (2005). Thermally assisted mechanical dewatering: state of the art and new developments. Chem. Eng. Transactions, Vol. 7, 737-742, ISBN 88-900775-8-1
Gamio J. C. (1997). A High-sensitivity Flexible-excitation Electrical Capacitance Tomography System. PhD Thesis, University of Manchester Institute of Science and Technology, UK.
www.intechopen.com
Analysis of Electrical Phenomena Occurring in Thermally Assisted Mechanical Dewatering Processes (TAMD)-a Preliminary Study
221
George, D. L.; Torczynski, J. R.; Shollenbeger, K. A.; Cfhen, T. J. & Ceceio, S. L. (2000). Validation of electrical-impedance tomography for measurements of material distribution in tow-phase flows. International journal of Multiphase Flow, Vol. 26, No. 4,549-581, ISSN 0301-9322
Hua, P.; Woo, E. J.; Webster, J. G. & Tompkins, W. J. (1987). Effect of the measurement method on noise handling and image quality of EFT imaging. Proceedings of the 9th annual conference of the IEEE engineering in medicine and biology society, pp. 1429-1430, Institute of electrical and electronics engineers; Piscataway, N.J. : Order from IEEE Service Center,, New York
Lucas, G. P.; Cory, J.; Waterfall, R.; Loh, W. W. & Dickin, F. J. (1999). Measurement of the solids volume fraction and velocity distribution in solid-liquid flows using dual-plane electrical resistance tomography. Flow Meas. Instrum., Vol. 10, No. 4, 249-258, ISSN 0955-5986
Mahmoud, A.; Muhr, L.; Grevillot, G.; Valentin, G. & Lapicque, F. (2006). Ohmic drops in the ion-exchange bed of cationic electrodeionization cells. Journal of Applied Electrochemistry, Vol. 3, No. 36,277-285, ISSN 0021-891X
Maxwell, J.C. (1981). A Treatise on Electricity and Magnetism. Clarendon Press, ISBN 0-486- 60636-8, Oxford.
Meredith, R. E., & Tobias, C. W. (1960). Resistance to potential flow through a cubical array of spheres, Journal of applied Physics, Vol. 31, No. 7,1270-1273, ISSN 0021-8979
Neal, G. H. & Nader, W. K. (1974). Prediction of transport process within porous media: diffusion flow processes within an homogeneous swarm of spherical particles, AIChE Journal, Vol. 20, No. 3,530-538, ISSN 1547-5905
Plaskowski, A.; Beck, M. S.; Thorn, R. & Dyakowski, T. (1995). Imaging Industrial Flows: Applications of Electrical Process Tomography. Institute of Physics Publishing, ISBN 9780750302968, UK.
Raghavan, V.R. & Martin, H. (1995). Modelling of two-phase thermal conductivity. Chemical Engineering and Processing, Vol. 34,439-446, ISSN 0255-2701
Rayleigh, L. (1892). On the Influence of Obstacles arranged in Rectangular Order upon the Properties of a Medium. The London, Edinburgh and Dublin Philosophical Magazine and journal of Science, 5th series, Vol. 34,481-502
Slater, L.; Binley, A.; Versteeg, G.; Cassiani, R.; Birken, R. & Sandberg, S. (2002). A 3D ERT study of solute transport in a large experimental tank. Journal of Applied Geophysics Vol. 49, No. 4,211-229, ISSN 0926-9851
Spiegler, K. S.; Yoest, R. L. & Wyllie, M. R. J. (1956). Electrical potentials across porous plugs and membranes. Ion-exchange resin-solution systems. Discuss. Faraday Soc., Vol. 21,174-185, ISSN 1754-7679
Turner, J. C. R. (1976). Two-phase conductivity: the electrical conductance of liquid-fluidized beds of spheres. Chemical Engineering Science, Vol. 31, No. 6, 487-492, ISSN 0009- 2509
Wang, M.; Dickin, F. J. & Williams, R. A. (1995). The grouped-node technique as means of handling large electrode surfaces in electrical impedance tomography. Physiological measurement, Vol. 16, A219-A226, ISSN 0967-3334
Wang, M.; Donvard, A.; Vlaey, D. & Mann, R. (2000). Measurements of gas-liquid mpixing in stirred vessel using electrical resistance tomography (ERT). Chemical Engineering Journal, Vol. 77, No. 1, 93-98, ISSN 1385-8947
www.intechopen.com

Recent Advances in Modelling and Simulation
222
Williams, R. A.; Beck, M. S. (1995). Process Tomography: Principles, Techniques and Applications, Butterworth-Heinemman, ISBN 0750607440
Wyllie, M.R.J. & Southwick, P.P. (1954). An experimental investigation of the S.P. and resistivity phenomena in shaly sand. /. Petroleum Technol. Vol. 6, 44-57, ISSN 0368- 2722
Wyllie, M.R. J., Sauer, M.C., Southwick, P. F. and Spiegler, K. S (1955). Electrical Conductance of Porous Plugs, Ion Exchange Resin-solution Systems. Ind. and Eng. Chem., Vol. 47,2187, ISSN 0019-7866
Yang, W. Q. & Peng, L. (2003). Image reconstruction algorithms for electrical capacitance tomography. Measurement Science and Technology, Vol. 14, No. 1, R1-R13, ISSN 0957-0233
www.intechopen.com

Modelling and SimulationEdited by Giuseppe Petrone and Giuliano Cammarata
ISBN 978-3-902613-25-7Hard cover, 688 pagesPublisher I-Tech Education and PublishingPublished online 01, June, 2008Published in print edition June, 2008
InTech EuropeUniversity Campus STeP Ri Slavka Krautzeka 83/A 51000 Rijeka, Croatia Phone: +385 (51) 770 447 Fax: +385 (51) 686 166www.intechopen.com
InTech ChinaUnit 405, Office Block, Hotel Equatorial Shanghai No.65, Yan An Road (West), Shanghai, 200040, China
Phone: +86-21-62489820 Fax: +86-21-62489821
This book collects original and innovative research studies concerning modeling and simulation of physicalsystems in a very wide range of applications, encompassing micro-electro-mechanical systems, measurementinstrumentations, catalytic reactors, biomechanical applications, biological and chemical sensors,magnetosensitive materials, silicon photonic devices, electronic devices, optical fibers, electro-microfluidicsystems, composite materials, fuel cells, indoor air-conditioning systems, active magnetic levitation systemsand more. Some of the most recent numerical techniques, as well as some of the software among the mostaccurate and sophisticated in treating complex systems, are applied in order to exhaustively contribute inknowledge advances.
How to referenceIn order to correctly reference this scholarly work, feel free to copy and paste the following:
Akrama Mahmoud, Aurora Fernandez and Patricia Arlabosse (2008). Analysis of Electrical PhenomenaOccurring in Thermally Assisted Mechanical Dewatering Processes (TAMD)-a Preliminary Study, Modellingand Simulation, Giuseppe Petrone and Giuliano Cammarata (Ed.), ISBN: 978-3-902613-25-7, InTech,Available from:http://www.intechopen.com/books/modelling_and_simulation/analysis_of_electrical_phenomena_occurring_in_thermally_assisted_mechanical_dewatering_processes__ta

© 2008 The Author(s). Licensee IntechOpen. This chapter is distributedunder the terms of the Creative Commons Attribution-NonCommercial-ShareAlike-3.0 License, which permits use, distribution and reproduction fornon-commercial purposes, provided the original is properly cited andderivative works building on this content are distributed under the samelicense.