analysis of enterprises in the pharmaceutical sector · i.e. enterprises operating in the...
TRANSCRIPT


Analysis of enterprises in the pharmaceutical sector
Central Balance Sheet Studies
July | 2016
25
Lisbon, 2016 • www.bportugal.pt

ANALYSIS OF ENTERPRISES IN THE PHARMACEUTICAL SECTOR | Central Balance Sheet Studies 25 | 2016 • Banco de Portugal Av.
Almirante Reis, 71 | 1150-012 Lisboa • www.bportugal.pt • Publisher Statistics Department • Design Communications Directorate
| Image and Graphic Design Unit • ISBN 978-989-678-457-7 (online) • ISSN 1647-9688 (online) • Legal deposit No 320300/10

Foreword
This analysis is based on data obtained from
Informação Empresarial Simplificada – IES
(Simplified Corporate Information) and held in
the Central Balance Sheet Database of Banco
de Portugal. Through IES, enterprises are able
to meet their obligation to report their annual
accounts simultaneously to the Ministries of
Finance and Justice, Banco de Portugal and
Statistics Portugal (Instituto Nacional de
Estatística – INE).
IES is usually reported within six and a half
months of the financial year end, which, for
most enterprises resident in Portugal,
corresponds to 15 July of the year following the
reference year. This analysis uses IES data for
2014, the latest as at the cut-off date for this
publication.
Data reported by enterprises through IES is
subject to quality control by Banco de Portugal
mainly to ensure that the accounting
information for the economic year is coherent
and complete and that the main aggregates are
consistent throughout the years.
In addition to information obtained through
IES, this publication features complementary
data on the financing of enterprises in Portugal
available in other databases of the Statistics
Department of Banco de Portugal, in particular
Central de Responsabilidades de Crédito (Central
Credit Register – CCR). This information
characterises a significant share of the liabilities
of Portuguese enterprises, particularly loans
from the resident financial sector.


Summary
This study analyses the pharmaceutical sector,
i.e. enterprises operating in the pharmaceutical
industry, wholesale of pharmaceutical goods
and retail sale of pharmaceutical goods.
In 2014 the pharmaceutical sector comprised
around 3,500 enterprises, accounting for 1 per
cent of the total number of enterprises in
Portugal, 3 per cent of turnover and 1 per cent
of the number of employees. Compared with
2006 and total enterprises, the pharmaceutical
sector posted positive developments in terms
of the number of enterprises, turnover and
number of employees.
By economic activity segment, the retail sale of
pharmaceutical goods had the largest share of
enterprises and employees in the sector
(70 per cent and 48 per cent respectively).
However, 65 per cent of turnover was
generated by the wholesale of pharmaceutical
goods. By size class, microenterprises
accounted for the largest share (81 per cent)
while small and medium-sized enterprises
(SMEs) reflected most of turnover and the
number of employees (42 per cent and 45 per
cent respectively).
Head offices were mostly concentrated in the
Lisbon and Porto districts. As a whole, these
enterprises represented 76 per cent of
turnover in the pharmaceutical sector.
Turnover was chiefly generated by enterprises
established for more than 20 years (59 per
cent), similarly to total enterprises in Portugal
(54 per cent).
Only 4 per cent of enterprises were exporters,
accounting for 15 per cent of the
pharmaceutical sector’s turnover. In the
pharmaceutical industry, however, the share of
exporting enterprises was higher (75 per cent
of turnover associated with one-quarter of
enterprises).
Following three consecutive years where
activity fell (although at increasingly less
negative rates), the pharmaceutical sector’s
turnover grew by 3 per cent in 2014,
5 percentage points (p.p.) more than in 2013.
Operating expenses also grew by 3 per cent,
chiefly due to the contribution from the cost of
goods sold and materials consumed (CoGS)
(2 p.p.).
The pharmaceutical sector’s EBITDA increased
by 8 per cent in 2014, standing below the
change seen in 2013 (15 per cent).
Approximately 64 per cent of the sector’s
enterprises posted positive changes in EBITDA,
10 p.p. above those for total enterprises.
EBITDA was negative for 21 per cent of the
sector’s enterprises (14 p.p. less than in total
enterprises).
In 2014, following the growth trend of the
previous two years, return on equity in the
pharmaceutical sector, which always exceeded
that of total enterprises in the 2010-14 period,
totalled 9 per cent (1 p.p. increase from 2013).
The operating margin amounted to 6 per cent
and the net margin to 3 per cent (8 per
cent and 1 per cent respectively in total
enterprises).
The pharmaceutical sector’s capital ratio stood,
on average, at 38 per cent (30 per cent in total
enterprises). Interest-bearing debt corresponded
to 43 per cent of the sector’s liabilities, below that
seen for total enterprises (57 per cent).
Data available for 2015, compiled by Banco de
Portugal’s Central Credit Register, shows that
credit granted to the pharmaceutical sector by
the resident financial system has declined since
2011. The non-performing loans ratio stood at
12.5 per cent, below that for total enterprises
(16.2 per cent).
In 2014 the sector’s liabilities decreased by
1 per cent and interest expenses declined by
10 per cent. The financial pressure ratio stood
at 13 per cent, below that seen for 2013 (by
3 p.p.) and total enterprises in 2014 (28 per
cent).
Trade credit accounted for 34 per cent of the
pharmaceutical sector’s liabilities in 2014, more
than for total enterprises (16 per cent).
However, net trade credit financing was more
negative in the pharmaceutical sector (6 per
cent, compared with 3 per cent in total
enterprises), although the retail sale of
pharmaceutical goods posted positive net
trade credit financing levels (8 per cent of
turnover).


Contents
1. Introduction | 11
2. Structure and dynamics | 12
2.1. Structure | 12
2.2. Concentration | 16
2.3. Dynamics | 17
Box 1 | The relevance of the export sector | 19
3. Economic and financial analysis | 21
3.1. Economic environment | 21
3.2. Activity and profitability | 21
3.2.1. Turnover | 21
3.2.2. Operating expenses | 25
3.2.3. EBITDA | 26
3.2.4. Profitability | 27
Box 2 | Assets structure of enterprises in the pharmaceutical sector | 30
3.3. Financial situation | 32
3.3.1. Financial structure | 32
Box 3 | Bank loans granted by the resident financial system | 35
3.3.2. Financial costs and solvency | 38
3.3.3. Trade credit financing | 40
ANNEX | 43
Methodological summary | 46
Abbreviations and acronyms | 47
References | 48
Central Balance Sheet Studies | 49

Analysis of enterprises in the pharmaceutical sector
1. Introduction
2. Structure and dynamics
Box 1 | The relevance of the export sector
3. Economic and financial analysis
Box 2 | Assets structure of enterprises in the
pharmaceutical sector
Box 3 | Bank loans granted by the resident
financial system


Analysis of enterprises in the pharmaceutical sector • 7 | 2016 11
1. Introduction
This study assesses the economic and financial
situation of enterprises1 operating in the
pharmaceutical sector, based on information
compiled by the Central Balance Sheet
database of Banco de Portugal.2
For the purposes of this analysis, the
pharmaceutical sector comprises enterprises
operating in the pharmaceutical industry, the
wholesale of pharmaceutical goods and the
retail sale of pharmaceutical goods. According
to data published by Statistics Portugal
(Instituto Nacional de Estatística – INE), these
activities accounted for approximately 2.7 per
cent of gross value added of non-financial
corporations in Portugal in 2014.3
The sector was divided into the following
economic activity segments, obtained by
aggregating several activities, taking into
account the Portuguese Classification of
Economic Activities, Revision 3 (CAE-Rev.3):
• Pharmaceutical industry: composed of
division 21 – manufacture of basic
pharmaceutical products and pharmaceutical
preparations (part of Section C –
manufacturing), which includes the sector’s
manufacturing base.
• Wholesale of pharmaceutical goods:
composed of subclass 46460 – wholesale of
pharmaceutical goods (part of Section G –
wholesale and retail trade, repair of motor
vehicles and motorcycles), including
distributors of the pharmaceutical industry,
both national and representatives from
multinational pharmaceutical companies.
• Retail sale of pharmaceutical goods:
composed of subclass 47730 – retail sale of
pharmaceutical products in specialised stores
(part of Section G – wholesale and retail trade,
repair of motor vehicles and motorcycles),
which includes enterprises that deliver
pharmaceutical goods directly to consumers.
The analysis focuses chiefly on the 2010-14
period, on the basis of Simplified Corporate
Information (Informação Empresarial Simplificada –
IES). Furthermore, 2006 is also used as
reference year for developments in the sector,
as well as more recent data on bank loans and
non-performing loans for 2015.
This study also characterises the
pharmaceutical sector for a range of selected
indicators as regards the dispersion of results
obtained by enterprises, thus avoiding
distortions triggered by extreme values. An
analysis is also carried out on the contributions
from economic activity segments and size
classes to determining aggregate results.
In addition, this publication compares results
for the pharmaceutical sector and total
enterprises in Portugal.4
Chapter 2 analyses the sector’s structure, in
terms of economic activity, size, geographical
location and maturity of its enterprises. Data on
market concentration and corporate dynamics
are also presented.
Chapter 3 reviews recent turnover
developments to determine the extent to
which these are reflected in profitability. This
involves breaking down the effects that
influence profitability into operating and
financial components of corporate business,
while providing information on the solvency
capacity of enterprises.
The Annex provides a table summarising the
main indicators and a methodological
summary with the definition of the main
concepts used throughout the study. The
statistical series under analysis is also available
on Banco de Portugal’s website (in Excel
format).

12 BANCO DE PORTUGAL • Central Balance Sheet Studies • 25
2. Structure and dynamics
2.1. Structure
In 2014 the pharmaceutical sector accounted
for around 3,500 enterprises, i.e. 1 per cent of
total enterprises in Portugal (Table 1),
representing 3 per cent of turnover and 1 per
cent of the number of employees. Compared
with 2006, the sector’s share in total
enterprises increased across all variables
under review: 0.3 p.p. in terms of turnover and
the number of employees and 0.2 p.p. in terms
of the number of enterprises.
Table 1 • Share of the pharmaceutical sector in total enterprises (2006 and 2014)5
Number of enterprises Turnover Number of employees
2006 2014 2006 2014 2006 2014
Pharmaceutical sector 0.67 % 0.92 % 3.03 % 3.29 % 1.04 % 1.31 %
Pharmaceutical industry 0.04 % 0.04 % 0.32 % 0.36 % 0.23 % 0.24 %
Wholesale of
pharmaceutical goods 0.19 % 0.24 % 2.15 % 2.13 % 0.47 % 0.44 %
Retail sale of
pharmaceutical goods 0.44 % 0.64 % 0.56 % 0.80 % 0.34 % 0.63 %
By economic activity segment, in 2014 the
largest share of enterprises and employees
was in the retail sale of pharmaceutical goods
(70 per cent and 48 per cent, respectively)
(Chart 1). However, taking into account
turnover, the wholesale of pharmaceutical
goods was the most relevant (65 per cent)
concentrating 33 per cent of the sector’s
employees. The pharmaceutical industry was
the least representative segment across all
variables, with only 4 per cent of enterprises
and 19 per cent of employees.
By size class,6 the pharmaceutical sector was
similar to total enterprises, with a large share of
microenterprises (81 per cent) across the
various economic activity segments, although
less in the pharmaceutical industry (Table 2).
Small and medium-sized enterprises (SMEs)
were the most representative in terms of the
number of employees (45 per cent), with a
larger share in the pharmaceutical industry and
the wholesale of pharmaceutical goods (51 per
cent and 59 per cent respectively).
Chart 1 • Structures | By economic activity segment (2014)
Number of enterprises Turnover Number of employees
4 %
26 %
70 %
11 %
65 %
24 %19 %
33 %
48 %
11 %
65 %
24 %
V o l ume
de negócios
Pharmaceutical industry Wholesale of pharmaceutical goods Retail sale of pharmaceutical goods

Analysis of enterprises in the pharmaceutical sector • 7 | 2016 13
In the retail sale of pharmaceutical goods,
microenterprises accounted for 62 per cent of
the number of employees, aggregating 63 per
cent of turnover in this segment. In the
pharmaceutical industry and wholesale of
pharmaceutical goods, the largest share of
turnover was associated with large enterprises
(53 per cent and 51 per cent respectively).
In 2014 turnover and the number of employees
in the pharmaceutical sector were, on average,
higher than in total enterprises (3.6 and
1.4 times respectively) (Chart 2). Turnover in
the pharmaceutical industry and wholesale of
pharmaceutical goods was, on average,
approximately 9.7 and 8.8 times higher
respectively than in total enterprises,
contributing significantly to the figures posted
by the sector as a whole. The same applies to
the pharmaceutical industry as regards the
average number of employees (around 6.6
times higher than six employees per
enterprise, on average, in total enterprises).
The average enterprise is larger in this segment
due to the small contribution of
microenterprises to their structure in terms of
turnover and number of employees. By
contrast, the average enterprise in the retail
sale of pharmaceutical goods was greatly
similar to the average national enterprise as
regards turnover and the number of
employees.
By geographical location,7 in 2014 and
similarly to total enterprises, the head offices of
enterprises in the pharmaceutical sector were
concentrated in the Lisbon and Porto districts
Chart 2 • Average turnover and average number of employees | Ratio to total
enterprises (total enterprises = 1) (2014)
Average turnover
Average number of employees
Table 2 • Structures | By size class (2014)
Indicator Size Total
enterprises
Pharmaceutical
sector
Pharmaceutical
industry
Wholesale of
pharmaceutical
goods
Retail sale of
pharmaceutical
goods
Number of
enterprises
Microenterprises 89.5 % 80.7 % 62.5 % 72.1 % 85.1 %
SMEs 10.3 % 18.4 % 31.9 % 25.7 % 14.9 %
Large enterprises 0.3 % 0.8 % 5.6 % 2.1 % 0.0 %
Turnover
Microenterprises 15.4 % 17.9 % 1.5 % 3.9 % 62.8 %
SMEs 41.7 % 42.1 % 45.2 % 44.9 % 33.4 %
Large enterprises 42.8 % 39.9 % 53.3 % 51.2 % 3.8 %
Number of
employees
Microenterprises 27.7 % 33.7 % 1.6 % 11.5 % 61.6 %
SMEs 44.9 % 44.6 % 50.6 % 59.2 % 32.2 %
Large enterprises 27.4 % 21.7 % 47.7 % 29.3 % 6.3 %
Note: Shaded cells identify the most important size class in each segment/indicator.
3.6
9.7 8.8
1.2
0
2
4
6
8
10
Pharmaceutical
industry
Wholesale of
pharmaceutical
goods
Retail sale of
pharmaceutical
goods
Pharmaceutical
sector
By economic activity segment
1.4
6.6
1.81.0
0
2
4
6
8
Pharmaceutical
industry
Wholesale of
pharmaceutical
goods
Retail sale of
pharmaceutical
goods
Pharmaceutical
sector
By economic activity segment

14 BANCO DE PORTUGAL • Central Balance Sheet Studies • 25
across all indicators. As a whole, these districts
aggregated 51 per cent of the sector’s
enterprises, 64 per cent of the number of
employees and 76 per cent of turnover
(Table 3).
Geographical concentration was also
substantial across all economic activity
segments, except for the retail sale of
pharmaceutical goods. The pharmaceutical
industry and the wholesale of pharmaceutical
goods were particularly concentrated in Lisbon,
which aggregated more than 60 per cent of
enterprises, turnover and employees. In the
retail sale of pharmaceutical goods, and
despite Lisbon’s predominance (with 25 per
cent of the segment’s turnover), Porto and
Setúbal were still relevant (with 19 per cent and
8 per cent of turnover respectively).
Furthermore, Viseu plays an important role in
the pharmaceutical industry (14 per cent of
turnover and number of employees), together
with Porto (17 per cent and 16 per cent
respectively).
Figure 1 illustrates the relative share of the
pharmaceutical sector’s turnover, as well as its
economic activity segments, in total enterprises
for each district.
Table 3 • Geographical location | By economic activity segment (2014)
Number of enterprises Turnover Number of employees
District (Top 3) % of total District (Top 3) % of total District (Top 3) % of total
Total
enterprises
Lisbon 28.1 % Lisbon 43.9 % Lisbon 35.1 %
Porto 17.9 % Porto 16.2 % Porto 18.6 %
Braga 7.9 % Braga 6.1 % Braga 8.7 %
Pharmaceutical
sector
Lisbon 36.3 % Lisbon 53.7 % Lisbon 47.2 %
Porto 14.9 % Porto 22.3 % Porto 17.2 %
Setúbal 6.7 % Coimbra 4.3 % Viseu 5.0 %
Pharmaceutical
industry
Lisbon 67.4 % Lisbon 64.9 % Lisbon 61.2 %
Porto 11.8 % Porto 16.6 % Porto 15.6 %
Viseu 5.6 % Viseu 14.1 % Viseu 14.2 %
Wholesale of
pharmaceutical
goods
Lisbon 60.0 % Lisbon 62.5 % Lisbon 72.4 %
Porto 16.1 % Porto 24.6 % Porto 13.3 %
Setúbal 5.1 % Coimbra 4.4 % Coimbra 3.4 %
Retail sale of
pharmaceutical
goods
Lisbon 25.6 % Lisbon 25.2 % Lisbon 24.3 %
Porto 14.6 % Porto 18.6 % Porto 20.5 %
Setúbal 7.6 % Setúbal 7.7 % Setúbal 8.2 %

Analysis of enterprises in the pharmaceutical sector • 7 | 2016 15
In 2014 the share of the pharmaceutical sector
in turnover of enterprises with head offices in
each national district was below 6 per cent.
Nonetheless, the sector played a greater role in
the Coimbra, Viseu and Porto districts, as well
as in the Autonomous Region of the Azores.
The retail sale of pharmaceutical goods was
most relevant in the inland districts and the
Autonomous Region of the Azores. The
wholesale of pharmaceutical goods aggregated
4 per cent of turnover generated by
enterprises having their head office in Coimbra
and 3 per cent in both Lisbon and Porto. It was
also important in the Autonomous Region of
the Azores, particularly in Angra do Heroísmo,
where it aggregated 5 per cent of turnover of
enterprises having their head office there. The
pharmaceutical industry was residually
relevant across all districts, except for Viseu
(2 per cent of turnover of enterprises with their
head office there was generated by this
segment).
Figure 1 • Geographical location by district | Share in total enterprises in the district
(turnover – 2014)
Pharmaceutical sector Pharmaceutical industry
Wholesale of pharmaceutical goods Retail sale of pharmaceutical goods
Note: Information on the pharmaceutical sector reflects the sum of figures for its segments, shown individually in the other maps.
Key to the figure: [0 %; 1.0 %] ]1.0 %; 2.5 %] ]2.5 %; 4.0 %] ]4.0 %; 6.0 %]

16 BANCO DE PORTUGAL • Central Balance Sheet Studies • 25
Taking into account the distribution of turnover
by enterprise maturity,8 the sector under
review was not significantly different from total
enterprises: 59 per cent of the pharmaceutical
sector’s turnover was generated by enterprises
established for more than 20 years (54 per cent
in total enterprises) (Chart 3). Enterprises in this
maturity class were more relevant in the
pharmaceutical industry and wholesale of
pharmaceutical goods, aggregating 75 per cent
and 73 per cent, respectively, of turnover. By
contrast, enterprises established for less than
20 years accounted for around 85 per cent of
turnover in the retail sale of pharmaceutical
goods, with the largest share (34 per cent)
being accounted for by enterprises established
for five to ten years.
2.2. Concentration
In 2014 the pharmaceutical sector’s turnover
was less concentrated than in total enterprises:
10 per cent of enterprises generated 77 per
cent of the sector’s turnover (in total
enterprises, 10 per cent of enterprises were
responsible for 89 per cent of turnover). This
distribution was noteworthy even considering
only 1 per cent of enterprises (responsible for
46 per cent of the sector’s turnover and 64 per
cent in total enterprises) (Chart 4).
By economic activity segment, the wholesale of
pharmaceutical goods had the highest level of
concentration (38 per cent and 83 per cent of
turnover was associated with 1 per cent and 10
per cent of its largest enterprises, respectively).
At the other end of the spectrum, in the retail
sale of pharmaceutical goods, turnover was
more dispersed, to the extent that 1 per cent
and 10 per cent of its largest enterprises
Chart 3 • Structures | By maturity class (turnover – 2014)
Chart 4 • Distribution of turnover (2014)
8 % 8 % 2 % 4 %20 %
13 % 16 %10 % 10 %
34 %25 % 17 %
12 % 13 %
31 %54 % 59 %75 % 73 %
15 %
0 %
20 %
40 %
60 %
80 %
100 %
Pharmaceutical
industry
Wholesale of
pharmaceutical
goods
Retail sale of
pharmaceutical
goods
Total enterprises Pharmaceutical
sector
By economic activity segment
Up to 5 years From 5 to 10 years From 10 to 20 years More than 20 years
64 %
46 %
11 %
38 %
9 %
89 %
77 %73 %
83 %
31 %
0 %
20 %
40 %
60 %
80 %
100 %
Pharmaceutical
industry
Wholesale of
pharmaceutical goods
Retail sale of
pharmaceutical goods
Total enterprises Pharmaceutical sector By economic activity segment
Percentage of turnover generated by 1 % of enterprises
Percentage of turnover generated by 10 % of enterprises

Analysis of enterprises in the pharmaceutical sector • 7 | 2016 17
generated 9 per cent and 31 per cent of the
segment’s turnover, respectively.
2.3. Dynamics
In 2014 the number of enterprises increased
more substantially in the pharmaceutical
sector (2.5 per cent) than in total enterprises
(1.5 per cent) (Chart 5). The number of
enterprises in the sector grew more than in
total enterprises throughout the entire period
under review, which led to an increase in its
relative importance in the sectoral structure of
total enterprises. Nonetheless, in the period
under review, 2014 was the year when the
increase in the number of active enterprises in
the sector was less substantial, given that
between 2010 and 2013 rates of change stood
between 3 per cent and 4 per cent.
The birth/death ratio in the pharmaceutical
sector amounted to 1.6 in 2014, compared with
1.2 in total enterprises (Chart 6). All economic
activity segments posted ratios above 1.
Moreover, in the 2010-14 period, birth/death
ratios in the retail sale of pharmaceutical goods
were always higher than in the sector under
review, despite a slight decrease from 2011
onwards (from 3.2 in 2011 to 1.8 in 2014). In
the pharmaceutical industry, this ratio
amounted to 1.8 in 2014, significantly higher
than in 2010 (0.2).
A comparison of 2010 and 2014 with 2006
shows that developments in the
pharmaceutical sector were positive, in terms
of both the number of enterprises and the
number of employees (Chart 7), although most
notably in the 2006-10 period. In the wholesale
of pharmaceutical goods, the number of
employees declined in the 2006-14 period as a
whole, despite a positive change in the number
of enterprises. By contrast, cumulative changes
in the retail sale of pharmaceutical goods over
this period were positive for both indicators. In
the pharmaceutical industry, despite negative
developments in the number of enterprises,
the number of employees remained close to
2006 levels.
Chart 5 • Demographic indicators of the pharmaceutical sector
Chart 6 • Birth/death ratio
7 % 7 %7 %
8 %
6 %
4 % 3 %4 %
5 %4 %
-5 %
0 %
5 %
10 %
2010 2011 2012 2013 2014
Birth rate - Pharmaceutical sector
Death rate - Pharmaceutical sector
Rate of change of the number of enterprises - Pharmaceutical sector
Rate of change of the number of enterprises - Total enterprises
0.21.3 1.0 0.9 1.81.1 1.0 1.6 1.5 1.43.1 3.2 2.1 1.9 1.8
1.0
1.3
1.0
1.1 1.2
2.0 2.01.9
1.7 1.6
0.0
0.5
1.0
1.5
2.0
2.5
3.0
3.5
2010 2011 2012 2013 20140.0
0.5
1.0
1.5
2.0
2.5
3.0
3.5
2010 2011 2012 2013 2014
Pharmaceutical industry
Wholesale of pharmaceutical goods
Retail sale of pharmaceutical goods
0.0
0.5
1.0
1.5
2.0
2.5
3.0
3.5
2010 2011 2012 2013 2014
Total enterprises
Pharmaceutical sector

18 BANCO DE PORTUGAL • Central Balance Sheet Studies • 25
In 2014 approximately 4 per cent of enterprises
in the pharmaceutical sector were high-growth
enterprises (HGEs)9 (Chart 8), i.e. with average
annual growth in turnover greater than 20 per
cent per year, over a three-year period. During
the same year, 8 per cent of total enterprises
were classified as HGEs.
Between 2010 and 2014 the share of HGEs in
the pharmaceutical sector decreased by 3 p.p.,
while in total enterprises it remained stable.
The share of HGEs in the sector under review
was, to a large extent, explained by the weight
of these enterprises in the pharmaceutical
industry and wholesale of pharmaceutical
goods (7 per cent and 8 per cent respectively),
to the detriment of the retail sale of
pharmaceutical goods (3 per cent). This
segment seems to have contributed to reduce
the share of HGEs in the sector as a whole, due
to the great number of enterprises associated
with this activity.
By contrast, the sector’s share of enterprises
with negative average annual growth rates in
turnover (per annum, over a three-year period)
increased by 39 p.p. between 2010 and 2014,
standing at 71 per cent in 2014 (increase of
approximately 3 p.p., to 57 per cent, in total
enterprises). As such, the share of these
enterprises in 2014 was more substantial in the
sector under review than in total enterprises,
as opposed to 2010. The share of enterprises
with negative annual growth rates in 2014 was
more significant in the retail sale of
pharmaceutical goods (77 per cent, 47 p.p.
more than in 2010).
Chart 7 • Developments in the pharmaceutical sector and in total enterprises between 2006
and 2014 | Cumulative change from 2006 (2006=100)
2010 2014
Chart 8 • Potential population of high-growth enterprises | Average annual growth rate
(over a three-year period)
3
27
-6
16
34
2
13
2
-6
46
-20
0
20
40
60
80
Total
enterprises
Pharmaceutical
sector
Pharmaceutical
industry
Wholesale of
pharmaceutical
goods
Retail sale of
pharmaceutical
goods
6
46
-9
34
56
-6
18
0
-13
73
-20
0
20
40
60
80
Total
enterprises
Pharmaceutical
sector
Pharmaceutical
industry
Wholesale of
pharmaceutical
goods
Retail sale of
pharmaceutical
goods
-40.0
-20.0
0.0
20.0
40.0
60.0
80.0
100.0
Total das
empresas
Setor
farmacêutico
Indústria
farmacêutica
Comércio por
grosso de
produtos
farmacêuticos
Comércio a
retalho de
produtos
farmacêuticos
Number of enterprises Number of employees
55 % 57 %
32 %
71 %
41 %50 %
77 %
37 % 35 %
61 %
26 %
53 %42 %
20 %8 % 8 % 7 % 4 % 7 % 8 % 3 %
0 %
20 %
40 %
60 %
80 %
100 %
2010 2014 2010 2014 Pharmaceutical
industry
Wholesale of
pharmaceutical
goods
Retail sale of
pharmaceutical
goods
Total enterprises Pharmaceutical sector By economic activity segment (2014)
AAGR < 0 % 0 % ≤ AAGR ≤ 20 % AAGR > 20 %

Analysis of enterprises in the pharmaceutical sector • 7 | 2016 19
Box 1 | The relevance of the export sector
In 2014 the export sector10 comprised 4 per cent of the number of enterprises, 15 per
cent of turnover and 18 per cent of the number of employees of enterprises in the
pharmaceutical sector, i.e. below that recorded in total enterprises (6 per cent, 37 per cent
and 25 per cent respectively) (Chart 9). This was similar to figures for 2013, both in the
pharmaceutical sector and in total enterprises.
Export activities played a greater role in larger enterprises. In 2014, 28 per cent of large
enterprises in the pharmaceutical sector were exporting companies, accounting for 15
per cent of turnover and 38 per cent of the number of employees (Chart 10). By contrast,
only 2 per cent of microenterprises in the pharmaceutical sector were part of the export
sector, accounting for 4 per cent of turnover and 2 per cent of the number of employees
in this class size.
In the pharmaceutical industry, the export sector aggregated 75 per cent of turnover and
the number of employees, corresponding to 25 per cent of the segment’s enterprises. In
turn, in the retail sale of pharmaceutical goods, the export sector’s importance was
residual across all three indicators.
Chart 9 • Share of the export sector (2014)
Chart 10 • Share of the export sector | By economic activity segment and size class
(2014)
6 %4 %
37 %
15 %
25%
18 %
0 %
5 %
10 %
15 %
20 %
25 %
30 %
35 %
40 %
Total enterprises Pharmaceutical sector
Number of enterprises Turnover Number of employees
2 %
10 %
28 % 25 %
11 %
0 %4 %
20 %
15 %
75 %
10 %
0 %2 %
21 %
38 %
75 %
12 %
0 %
0 %
10 %
20 %
30 %
40 %
50 %
60 %
70 %
80 %
Microenterprises SMEs Large enterprises Pharmaceutical
industry
Wholesale of
pharmaceutical
goods
Retail sale of
pharmaceutical
goods
By size class By economic activity segment
Number of enterprises Turnover Number of employees

20 BANCO DE PORTUGAL • Central Balance Sheet Studies • 25
By size class and taking into account the number of enterprises, SMEs and large
enterprises played a greater role in the export pharmaceutical sector (47 per cent and 5
per cent respectively) than in the remaining enterprises of the sector as a whole (17 per
cent and 1 per cent respectively). By contrast, microenterprises were highly concentrated
in the remaining enterprises of the sector (82 per cent) (Chart 11). SMEs aggregated 57
per cent of the export pharmaceutical sector and were responsible for 51 per cent of the
number of employees. In the remaining enterprises as a whole, 41 per cent of the number
of employees were associated with microenterprises.
By economic activity segment, the pharmaceutical industry was the most representative
within the export pharmaceutical sector, taking into account turnover and the number of
employees (55 per cent and 77 per cent respectively), by contrast to the marginal weight
of this activity in the remaining enterprises of the sector as a whole (Chart 12). The retail
sale of pharmaceutical goods was on the opposite end of the spectrum, given that its
importance to the export pharmaceutical sector was residual. The wholesale of
pharmaceutical goods aggregated 71 per cent of exporting companies in the
pharmaceutical sector and approximately 45 per cent of its turnover.
Chart 11 • Structure considering the inclusion in the export sector | By size class
(2014)
Number of enterprises
Turnover
Number of employees
Chart 12 • Structure considering the inclusion in the export sector | By economic
activity segment (2014)
Number of enterprises
Turnover
Number of employees
82 %
17 %1 %
48 %
47 %
5 %
Exporting
sector
Remaining
enterprises
20 %
40 %
40 %
5 %
57 %
39 %
Exporting
sector
Remaining
enterprises
41 %
43 %
16 %
3 %
51 %
46 %
Exporting
sector
Remaining
enterprises
20 %
40 %
40 %
5 %
57 %
39 %
V o lume de negócios
Microenterprises SMEs Large enterprises
Setor
exportador
Restantes
empresas
3 %
24 %
72 %
24 %
71 %
4 %
Exporting
sector
Remaining
enterprises
3 %
68 %
29 %
55 %
45 %
0.4 %
Exporting
sector
Remaining
enterprises
6 %
36 %
59 %
77 %
22 %
0.4 %
Exporting
sector
Remaining
enterprises
6 %
36 %
59 %
77 %
22 %
0 %
Pharmaceutical industry Wholesale of pharmaceutical goods Retail sale of pharmaceutical goods
Setor
exportador
Restantes
empresas

Analysis of enterprises in the pharmaceutical sector • 7 | 2016 21
3. Economic and financial analysis
3.1. Economic environment
In 2014 the Portuguese GDP grew by 0.9 per
cent in real terms, following a 1.1 per cent
decrease in 2013. Excluding public
consumption (0.5 per cent reduction), all of the
remaining components posted positive
developments (Table 4).
Private consumption increased by 2.2 per cent
(following a 1.2 per cent decrease in 2013), as a
result of the acceleration in the consumption of
non-durable goods and services. Gross fixed
capital formation increased by 2.8 per cent
(following a 5.1 per cent fall in 2013), recording
a positive change for the first time since 2009.
Imports grew by 7.2 per cent, accelerating from
2013 (4.7 per cent), while exports decelerated,
despite a positive change of 3.9 per cent
(growth of 7.0 per cent in 2013).
With regard to 2015, data published by
Statistics Portugal point to GDP growth of 1.5
per cent. The main components of GDP grew
more than in the same period one year
before.11
Table 4 • GDP and main expenditure components | Real year-on-year rate of change
2010 2011 2012 2013 2014
(p)
2015
(p)
GDP 1.9 % -1.8 % -4.0 % -1.1 % 0.9 % 1.5 %
Private consumption 2.4 % -3.6 % -5.5 % -1.2 % 2.2 % 2.6 %
Public consumption -1.3 % -3.8 % -3.3 % -2.0 % -0.5 % 0.6 %
Gross fixed capital formation -0.9 % -12.5 % -16.6 % -5.1 % 2.8 % 3.9 %
Exports 9.5 % 7.0 % 3.4 % 7.0 % 3.9 % 5.2 %
Imports 7.8 % -5.8 % -6.3 % 4.7 % 7.2 % 7.4 %
Sources: INE and Banco de Portugal.
Note: (p) – preliminary data.
3.2. Activity and profitability
3.2.1. Turnover
Following three consecutive years of a fall in
activity (albeit with increasingly less negative
rates), the pharmaceutical sector’s turnover
grew by 3 per cent in 2014 (5 p.p. more than in
2013). Developments in the sector’s turnover
compared favourably with total enterprises,
whose turnover increased by 2 per cent from
2013 (Chart 13).
By size class, large enterprises (2 p.p.,
associated with a 6 per cent increase of
turnover) and SMEs (1.3 p.p., due to 3 per cent
growth) made sizable contributions to turnover
growth. Activity in microenterprises declined by
1 per cent, resulting in a negative contribution
of 0.2 p.p. to the sector’s turnover
developments.
By economic activity segment, the wholesale of
pharmaceutical goods and the retail sale of
pharmaceutical goods were behind a recovery
in the pharmaceutical sector’s activities.
Turnover in these segments increased by 3 per
cent and 7 per cent respectively. However,
given its larger relative share in the
pharmaceutical sector, the wholesale of
pharmaceutical goods contributed more
substantially to aggregate changes in the sector
(2.0 p.p.), followed by the retail sale of
pharmaceutical goods (1.6 p.p.). In turn, in the
pharmaceutical industry, turnover declined by
3 per cent, making a negative contribution of

22 BANCO DE PORTUGAL • Central Balance Sheet Studies • 25
0.3 p.p. to the sector’s aggregate
developments.
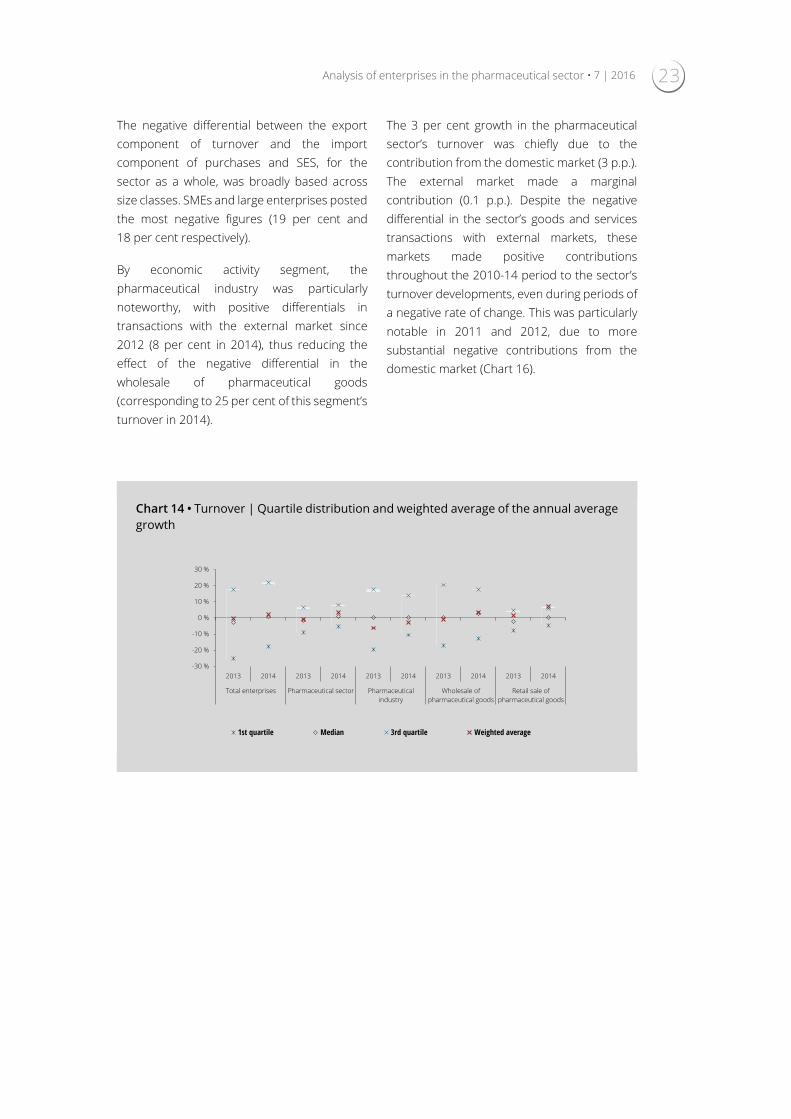
The distribution of the turnover growth rate
between 2013 and 2014 suggests more
positive developments in most enterprises in
the pharmaceutical sector (Chart 14), given that
the various distribution points (first quartile,
median and third quartile) were higher in 2014
than in 2013. However, the weighted average
and the sector’s distribution median moved
further apart. Although the sector’s average
turnover growth stood at 3 per cent, changes
in half of its enterprises were below 0.7 per
cent over the same period.
Also in the various economic activity segments,
changes were overall positive in the different
distribution points of individual data. This
change was mostly concentrated in the first
quartile and the distribution median, thus
reducing dispersion among these distributions.
However, there was no bias in the average
value with respect to the individual position of
the segments’ enterprises only in the wholesale
of pharmaceutical goods. In the retail sale of
pharmaceutical goods, although turnover
increased, on average, by 7 per cent, half of its
enterprises posted changes below 0.4 per cent.
Turning to the pharmaceutical industry,
although aggregate turnover declined by 3 per
cent, more than half of its enterprises
increased their turnover in individual terms.
The differential between the export
component of turnover and the import
component of purchases and supplies and
external services (SES), as a percentage of
turnover, was negative in the pharmaceutical
sector during the entire time horizon under
review. In 2014 the sector’s imports exceeded
exports by 15 per cent of turnover, in contrast
to total enterprises, whose balance was
positive at 0.2 per cent (Chart 15).
Chart 13 • Turnover | Contributions (p.p.) to the annual growth rate (%)
By size class
By economic activity segment
-8
-6
-4
-2
0
2
4
6
2010 2011 2012 2013 2014
Microenterprises SMEs Large enterprises
Total enterprises
(growth rate)
Pharmaceutical sector
(growth rate)
-8
-6
-4
-2
0
2
4
6
2010 2011 2012 2013 2014
Pharmaceutical industry Wholesale of pharmaceutical goods
Retail sale of pharmaceutical goods Total enterprises
(growth rate)Pharmaceutical sector
(growth rate)
Analysis of enterprises in the pharmaceutical sector • 7 | 2016 23
The negative differential between the export
component of turnover and the import
component of purchases and SES, for the
sector as a whole, was broadly based across
size classes. SMEs and large enterprises posted
the most negative figures (19 per cent and
18 per cent respectively).
By economic activity segment, the
pharmaceutical industry was particularly
noteworthy, with positive differentials in
transactions with the external market since
2012 (8 per cent in 2014), thus reducing the
effect of the negative differential in the
wholesale of pharmaceutical goods
(corresponding to 25 per cent of this segment’s
turnover in 2014).
The 3 per cent growth in the pharmaceutical
sector’s turnover was chiefly due to the
contribution from the domestic market (3 p.p.).
The external market made a marginal
contribution (0.1 p.p.). Despite the negative
differential in the sector’s goods and services
transactions with external markets, these
markets made positive contributions
throughout the 2010-14 period to the sector’s
turnover developments, even during periods of
a negative rate of change. This was particularly
notable in 2011 and 2012, due to more
substantial negative contributions from the
domestic market (Chart 16).
Chart 14 • Turnover | Quartile distribution and weighted average of the annual average
growth
-30 %
-20 %
-10 %
0 %
10 %
20 %
30 %
2013 2014 2013 2014 2013 2014 2013 2014 2013 2014
Total enterprises Pharmaceutical sector Pharmaceutical
industry
Wholesale of
pharmaceutical goods
Retail sale of
pharmaceutical goods
1st quartile Median 3rd quartile Weighted average

24 BANCO DE PORTUGAL • Central Balance Sheet Studies • 25
Chart 15 • Differential between the export component of turnover and the import
component of purchases and SES | As a percentage of turnover (2014)
Chart 16 • Turnover | Contributions from the external and domestic markets (p.p.) to
the annual growth rate (%)
0.2 %
-15 %
-1 %
-19 % -18 %
8 %
-25 %
-0.3 %
-40 %
-20 %
0 %
20 %
Micro SMEs Large Pharmaceutical
industry
Wholesale of
pharmaceutical
goods
Retail sale of
pharmaceutical
goods
Total
enterprises
Pharmaceutical
sector
By size class By economic activity segment
2.6
-3.9
-7.1
-1.51.3 1.1
-8.2
-6.5
-1.33.3
1.9
2.10.9 0.9
0.90.0 1.2 0.9
0.1
0.1
-10
-7
-4
-1
2
5
8
2010 2011 2012 2013 2014 2010 2011 2012 2013 2014
Total enterprises Pharmaceutical sector
Internal market External market Turnover

Analysis of enterprises in the pharmaceutical sector • 7 | 2016 25
3.2.2. Operating expenses12
Operating expenses in the pharmaceutical sector,
similarly to turnover, increased by 3 per cent in
2014 (2 per cent growth in total enterprises)
(Chart 17).
The SES component grew more markedly (5 per
cent). Employee expenses and cost of goods
sold and materials consumed (CoGS) increased
by 3 per cent. However, the CoGS component
made the largest contribution to aggregate
developments, as it accounted for 76 per cent of
operating expenses in the pharmaceutical sector
(59 per cent in total enterprises).
The greatest importance of CoGS in the sector’s
operating expenditure structure was broadly
based across economic activity segments,
although more substantial in the wholesale of
pharmaceutical goods and the retail sale of
pharmaceutical goods (79 per cent and 78 per
cent respectively) (Chart 18). SES were more
important in the pharmaceutical industry
(27 per cent), where employee expenses were
also more relevant (22 per cent).
Chart 17 • Operating expenses | Contributions (p.p.) to the annual growth rate (%)
Chart 18 • Operating expenses | Structure (2014)
-8 %
-6 %
-4 %
-2 %
0 %
2 %
4 %
2010 2011 2012 2013 2014
Employee costs SES
CoGS Operating expenses (growth rate)
59 %76 %
51 %
79 % 78 %
26 %
12 %
27 %
12 % 7 %
15 % 12 %22 %
9 % 15 %
0 %
20 %
40 %
60 %
80 %
100 %
Pharmaceutical
industry
Wholesale of
pharmaceutical goods
Retail sale of
pharmaceutical goods
Total enterprises Pharmaceutical sector By economic activity segment
CoGS SES Employee costs

26 BANCO DE PORTUGAL • Central Balance Sheet Studies • 25
3.2.3. EBITDA13
In the pharmaceutical sector, EBITDA growth
slowed down, similarly to total enterprises. In
2014 the sector’s EBITDA increased by 8 per
cent, i.e. 7 p.p. below 2013 (1 per cent in total
enterprises in 2014, 9 p.p. below 2013)
(Chart 19).
The positive change in the sector’s EBITDA in
2014 was largely due to developments in
EBITDA of the retail sale of pharmaceutical
goods (24 per cent increase from 2013,
contributing with more than 5 p.p. to changes
in the aggregate EBITDA of the pharmaceutical
sector).
Approximately 64 per cent of enterprises in the
pharmaceutical sector posted positive rates of
change in EBITDA, 10 p.p. more than for total
enterprises (Table 5).
Taking account the various size classes, 65 per
cent of microenterprises posted positive rates
of change in EBITDA in 2014, compared with
63 per cent and 50 per cent in SMEs and large
enterprises respectively.
By economic activity segment, 68 per cent of
enterprises in the retail sale of pharmaceutical
goods had posted positive rates of change in
EBITDA in 2014, compared with 55 per cent in
the wholesale of pharmaceutical goods and
50 per cent in the pharmaceutical industry.
Furthermore, the share of enterprises with
negative EBITDA in the pharmaceutical sector
was lower than in total enterprises (21 per cent
and 35 per cent respectively). This indicator
was lower in larger enterprises: 25 per cent in
microenterprises, 8 per cent in SMEs and 7 per
cent in large enterprises.
The share of enterprises with negative EBITDA
decreased across all size classes compared
with 2013. The most substantial reductions
were recorded by microenterprises (3 p.p.) and
SMEs (2 p.p.).
By economic activity segment, the
pharmaceutical industry and the wholesale of
pharmaceutical goods had the largest share of
enterprises with negative EBITDA (31 per cent
in both cases, above 17 per cent in the retail
sale of pharmaceutical goods). The
pharmaceutical industry was the only activity
segment where the share of enterprises with
negative EBITDA increased from 2013, albeit
residually.
Chart 19 • EBITDA | Annual growth rate
-40 %
-30 %
-20 %
-10 %
0 %
10 %
20 %
2010 2011 2012 2013 2014
Pharmaceutical sector Total enterprises

Analysis of enterprises in the pharmaceutical sector • 7 | 2016 27
Table 5 • EBITDA | Share of enterprises with positive EBITDA growth rate and negative EBITDA
3.2.4. Profitability
In 2014, following an upward trend over the
previous two years, return on equity in the
pharmaceutical sector increased by 1 p.p. from
2013, reaching 9 per cent (Chart 20).
Developments in return on equity in the
pharmaceutical sector were in line with (but
above) developments in profitability for total
enterprises. In 2014, in particular, growth in the
pharmaceutical sector was higher than in total
enterprises, where return on equity stood at
3 per cent.
The pharmaceutical industry posted the
highest profitability (12 per cent in 2014), as has
been the case since 2011. Profitability in the
wholesale of pharmaceutical goods and the
retail sale of pharmaceutical goods was 8 per
cent and 7 per cent, respectively, in 2014.
The quartile distribution of return on equity in
pharmaceutical enterprises shows the sector’s
favourable position compared with total
enterprises (higher distribution values, in both
2013 and 2014). Furthermore, compared with
2013 there was a marked increase in figures
associated with each distribution point of this
indicator for the pharmaceutical sector (first
quartile, median and third quartile), which
suggests an overall improvement in individual
profitability of the sector’s enterprises.
However, unlike other segments, this did not
reflect an increase in the average profitability of
the pharmaceutical industry, which, in fact
declined by 2 p.p. in 2014 from the previous
year (Chart 21).
In line with that seen for total enterprises, the
dispersion of individual profitability of
pharmaceutical enterprises widened in 2014.
The interquartile range (obtained as the
difference between the third and first quartiles)
grew by 6 p.p. from 2013 (4 p.p. increase in
total enterprises). Nonetheless, the difference
between the central distribution value (median)
and the weighted average of profitability in the
pharmaceutical sector decreased to 0.2 p.p.,
showing that the average profitability of the
pharmaceutical sector was not biased with
respect to the individual position of the sector’s
enterprises.
Among the various economic activity segments,
the pharmaceutical industry was the most
noteworthy, which, although posting the
highest average profitability in 2014, was the
Enterprises with positive
EBITDA growth rate
Enterprises with negative
EBITDA
2013 2014 2013 2014
Total enterprises 53.6 % 53.9 % 36.2 % 35.3 %
Pharmaceutical sector 62.4 % 64.3 % 24.4 % 21.4 %
By size class
Microenterprises 62.0 % 64.9 % 27.6 % 24.6 %
SMEs 64.1 % 62.6 % 10.6 % 8.3 %
Large enterprises 57.7 % 50.0 % 7.7 % 6.9 %
By economic activity
segment
Pharmaceutical industry 59.1 % 49.6 % 29.9 % 30.7 %
Wholesale of
pharmaceutical goods 58.7 % 55.3 % 32.9 % 30.9 %
Retail sale of
pharmaceutical goods 63.9 % 68.3 % 20.9 % 17.3 %

28 BANCO DE PORTUGAL • Central Balance Sheet Studies • 25
segment with the least favourable segment
overall position, taking into account the
enterprises’ individual profitability. In the
pharmaceutical industry, all distribution points
were below those in the other segments. In
fact, in the pharmaceutical industry the
weighted average (12 per cent) showed a
positive bias (8 p.p.) compared with the
distribution’s median (4 per cent), which
suggests that this segment comprises a
relatively small subset of enterprises with
higher profitability and a substantial influence
over the segment’s average profitability. This
contrasted with the other segments, whose
median and average value were closer.
A more detailed analysis of profitability in the
pharmaceutical sector and its activity segments
is shown on the basis of the operating margin
(EBITDA/Income) and the net margin (Net profit
for the year/Income)13 (Chart 22).
In 2014 the pharmaceutical sector’s operating
margin amounted to 6 per cent of income,
2 p.p. below that for total enterprises. By
contrast, in the net margin, the pharmaceutical
sector compared favourably with total
enterprises (3 per cent and 1 per cent
respectively).
The pharmaceutical industry had the highest
operating (17 per cent) and net margins (8 per
cent) as well as the highest differential between
both margins (9 p.p.). In the retail sale of
pharmaceutical goods, the operating margin
and the net margin amounted to 7 per cent and
3 per cent respectively. In turn, the wholesale
of pharmaceutical goods had the lowest
differential between the margins (2 p.p.), which,
in both cases, were lower than in other
segments (4 per cent in the operating margin
and 2 per cent in the net margin).
The largest differential in the pharmaceutical
industry was due to the greater importance of
the depreciation and amortisation component
to its earnings, due to its distinctive asset and
liabilities structure. In 2014, while 37 per
Chart 20 • Return on equity
Chart 21 • Return on equity | Quartile distribution and weighted average
11 %
9 %
13 % 14 %
12 %12 %
4 % 4 %
7 %8 %
11 %
6 %
0 %
4 %
7 %
0 %
2 %
4 %
6 %
8 %
10 %
12 %
14 %
16 %
2010 2011 2012 2013 2014
Pharmaceutical industry Wholesale of pharmaceutical goods
Retail sale of pharmaceutical goods Pharmaceutical sector
Total enterprises
-20 %
0 %
20 %
40 %
2013 2014 2013 2014 2013 2014 2013 2014 2013 2014
Total enterprises Pharmaceutical sector Pharmaceutical
industry
Wholesale of
pharmaceutical goods
Retail sale of
pharmaceutical goods
1st quartile Median 3rd quartile Weighted average

Analysis of enterprises in the pharmaceutical sector • 7 | 2016 29
cent of the pharmaceutical sector’s assets were
associated with non-current assets, 53 per cent
were associated in the pharmaceutical
industry, largely due to the contribution from
tangible fixed assets, but also intangible fixed
assets. This component was even more
important to the retail sale of pharmaceutical
goods, where the non-current assets
component accounted for 55 per cent of this
segment’s liabilities (Chart 23). By contrast, the
considerably diverse structure of assets (as well
as liabilities) of the wholesale of pharmaceutical
goods, with approximately 80 per cent of assets
associated with current assets and 55 per cent
of liabilities associated with current liabilities,
was clearly related to trade credits. ‘Box 2 –
Asset structure of enterprises in the
pharmaceutical sector’ presents these results
in detail as well as recent developments in
these components. Section 3.3.1 analyses the
liabilities component in the balance sheet of
pharmaceutical enterprises.
Chart 22 • Profit | Weight in income (2014)
Chart 23 • Assets and liabilities structure of the pharmaceutical sector (2014)
8 %
6 %
17 %
4 %
7 %
1 %
3 %
8 %
2 %3 %
0 %
3 %
6 %
9 %
12 %
15 %
18 %
Pharmaceutical
industry
Wholesale of
pharmaceutical goods
Retail sale of
pharmaceutical goods
Total enterprises Pharmaceutical sector By economic activity segment
EBITDA/Income NYP/Income
37 %
53 %
20 %
55 %
63 %
47 %
80 %
45 %
35 % 37 % 32 % 37 %
3 %5 %
3 %3 %
16 %21 %
10 %
24 %
46 %38 %
55 %
36 %
0 %
20 %
40 %
60 %
80 %
100 %
Asset Liabilities Asset Liabilities Asset Liabilities Asset Liabilities
Pharmaceutical sector Pharmaceutical industry Wholesale of pharmaceutical
goods
Retail sale of pharmaceutical
goods
Non-current assets Current assets Equity (except NPY) NPY Non-current liabilities Current liabilities

30 BANCO DE PORTUGAL • Central Balance Sheet Studies • 25
Box 2 | Assets structure of enterprises in the pharmaceutical sector
In 2014 the pharmaceutical sector’s assets chiefly comprised items associated with
current assets (63 per cent), in contrast to total enterprises, where such items
corresponded to 47 per cent of their assets. Compared with 2010, the breakdown of
assets into current and non-currents assets was virtually unchanged, both in the
pharmaceutical sector as a whole and all its size classes and economic activity segments,
although the composition of these subsets had changed somewhat.
By size class, SMEs and large enterprises were key for the current asset component’s
position in the pharmaceutical sector’s assets, representing 68 per cent and 66 per cent
of total assets respectively. In microenterprises, both sets of items had similar weights,
with current assets accounting for 52 per cent of total assets.
Turning to economic activity segments, the breakdown of assets into current and
non-current assets was, in the wholesale of pharmaceutical goods, more strongly
associated with current assets than in the pharmaceutical sector as a whole (with these
items accounting for 81 per cent of assets in this segment). In the pharmaceutical industry
and the retail sale of pharmaceutical goods, the breakdown into current and non-current
assets was more similar to total enterprises. Therefore, the asset structure of enterprises
in the pharmaceutical sector as a whole was somewhat determined by the structure of
enterprises in the wholesale of pharmaceutical goods.
In 2014 customers and intangible assets aggregated 27 per cent and 16 per cent
respectively of the sector’s assets, i.e. well above total enterprises (13 per cent and 8 per
cent respectively). Tangible assets and financial investments played a less important role
in the pharmaceutical sector (11 per cent and 8 per cent respectively) than in total
enterprises (26 per cent and 15 per cent respectively) (Chart 24).
Chart 24 • Assets structure (2014)
0 %
20 %
40 %
60 %
80 %
100 %
Microenterprises SMEs Large
enterprises
Pharmaceutical
industry
Wholesale of
pharmaceutical
goods
Retail sale of
pharmaceutical
goods
Total enterprises Pharmaceutical
sector
By size class By economic activity segment
Tangible fixed assets (A) Intangible assets (B) Financial investments (C)
Other non-current assets (D) Customers Cash and bank deposits
Other current assets (A + B + C + D) = Non-current assets

Analysis of enterprises in the pharmaceutical sector • 7 | 2016 31
Turning to size classes, intangible assets were more relevant in microenterprises (28 per
cent), while customers was the most important item for large enterprises and SMEs
(34 per cent and 32 per cent respectively). With regard to economic activity segments, the
share of customers in assets of the wholesale of pharmaceutical goods (44 per cent) and
intangible assets in the retail sale of pharmaceutical goods (34 per cent) was particularly
noteworthy, as it stood well above that seen for the pharmaceutical sector as a whole.
In 2014 the pharmaceutical sector’s assets increased by around 2 per cent from the
previous year. This increase contrasts with a decline in total enterprises (2 per cent) and
negative changes in both sectors in 2013 (4 per cent and 1 per cent respectively) (Table 6).
The increase in the pharmaceutical sector’s assets resulted from positive contributions of
other current asset items (2 p.p., associated with a 20 per cent increase) and cash and
bank deposits (1 p.p., associated with 14 per cent growth). By contrast, customers made
a negative contribution to developments in assets (2 p.p., associated with a 6 per cent
decline). In total enterprises, changes in the asset growth rate were mostly due to financial
investments (negative contribution of 2 p.p., associated with a 10 per cent decrease).
Table 6 • Assets | Contributions from components (p.p.) to the annual
growth rate (%)
Total enterprises Pharmaceutical
sector
2013 2014 2013 2014
Total assets (annual growth rate) -1.4 -1.9 -4.0 1.5
Contributions
to the annual
growth rate in
assets of the
pharmaceutical
sector
(p.p.)
Non-
current
assets
Tangible fixed assets -0.3 0.0 -0.1 -0.4
Intangible assets 0.0 -0.2 0.5 0.4
Financial investments -0.2 -1.5 -0.6 0.2
Other non-current assets 0.2 0.1 0.0 -0.1
Current
assets
Customers -0.4 -0.1 -3.1 -1.7
Cash and bank deposits 0.3 0.5 -0.2 1.1
Other current assets -1.1 -0.7 -0.6 2.1

32 BANCO DE PORTUGAL • Central Balance Sheet Studies • 25
3.3. Financial situation
3.3.1. Financial structure
In 2014 the pharmaceutical sector had a capital
ratio of 38 per cent, 8 p.p. higher than in total
enterprises. The sector’s capital ratio
increased, on average, by 4 p.p. from 2010,
favourably comparing with total enterprises
(1 p.p. decrease) (Chart 25).
An analysis of individual values, both in 2010
and 2014, shows that the average capital ratio
was less biased in the pharmaceutical sector
than in total enterprises (-2 p.p. difference
between the weighted average and the median
in the pharmaceutical sector and 5 p.p. in total
enterprises in 2014).
The capital ratio was relatively similar
regardless of the size class of the sector’s
enterprises (around 38 per cent in 2014).
However, in SMEs, this indicator’s median stood
approximately 6 p.p. above the average value,
which suggests that half of the sector’s SMEs
had a capital ratio of more than 45 per cent.
This contrasted with the other size classes,
where the average value was practically the
same as the median.
By economic activity segment, the
pharmaceutical industry had the highest capital
ratio (42 per cent) and the wholesale of
pharmaceutical goods the lowest (35 per cent),
although 7 p.p. higher than this segment’s
median. In turn, the average capital ratio of the
retail sale of pharmaceutical goods (40 per
cent) stood 6 p.p. below the median.
In 2014, 16 per cent of the pharmaceutical
sector’s enterprises were particularly
vulnerable, as they posted negative equity.
Similarly to the entire 2010-14 period, this
compared favourably with that seen in total
enterprises (30 per cent in 2014) (Table 7).
Moreover, between 2010 and 2014 the share
of enterprises with negative equity rose slightly
in the pharmaceutical sector (2 p.p.), but grew
more substantially in total enterprises (4 p.p.).
None of the large enterprises in the sector had
negative equity throughout the period under
review. In 2014, 19 per cent of
microenterprises and approximately 6 per cent
of SMEs in the sector had negative equity. In
total SMEs, this share has declined, in contrast
to that seen in the sector as a whole.
Chart 25 • Capital ratio | Weighted average and distribution median
24 % 25 %
36 % 40 % 38 %45 %
38 % 38 %28 %
46 %
31 % 30 %34 %
38 % 37 % 38 % 38 %42 %
35 %40 %
0 %
20 %
40 %
60 %
2010 2014 2010 2014 Micro SMEs Large
enterprises
Pharmaceutical
industry
Wholesale of
pharmaceutical
goods
Retail sale of
pharmaceutical
goods
Total enterprises Pharmaceutical sector By size class (2014) By economic activity segment (2014)
Mediana Média ponderada

Analysis of enterprises in the pharmaceutical sector • 7 | 2016 33
Table 7 • Capital ratio | Share of enterprises with negative equity
2010 2014
Total enterprises 25.5 % 29.5 %
Pharmaceutical sector 14.7 % 16.4 %
By size class
Microenterprises 17.3 % 19.1 %
SMEs 6.6 % 5.5 %
Large enterprises 0.0 % 0.0 %
By economic activity
segment
Pharmaceutical industry 13.0 % 18.6 %
Wholesale of pharmaceutical
goods 22.9 % 25.2 %
Retail sale of pharmaceutical
goods 11.7 % 12.9 %
By economic activity segment, the wholesale of
pharmaceutical goods had the highest share of
enterprises with negative equity (25 per cent in
2014). By contrast, in the retail sale of
pharmaceutical goods, only 13 per cent of
enterprises had the same issue. Despite its
intermediate position (19 per cent), in the
pharmaceutical industry the share of
enterprises with negative equity grew the most
compared with 2010 (6 p.p.).
Similarly to most economic activity sectors in
Portugal, debt financing is a relevant source of
funds for enterprises in the pharmaceutical
sector. In 2014 interest-bearing debt15
accounted for 43 per cent of the
pharmaceutical sector’s liabilities, 14 p.p. below
that seen for total enterprises (Chart 26).
Bank loans16 and intra-group financing (23 per
cent and 14 per cent of liabilities respectively)
were the main interest-bearing debt
components in the sector. Debt securities had
a marginal share (2 per cent), but played a
greater role in the liabilities of the sector’s large
enterprises (7 per cent). The share of bank
loans in SMEs and large enterprises was also
noteworthy (21 per cent and 19 per cent of
their liabilities), but still less than in total
microenterprises (34 per cent of liabilities).
Turning to economic activity segments, bank
loans totalled 40 per cent of liabilities in the
retail sale of pharmaceutical goods and 37 per
cent in the pharmaceutical industry. In the
wholesale of pharmaceutical goods, the share
of bank loans was lower (10 per cent of
liabilities), while intra-group financing played a
greater role (23 per cent).
Trade credits accounted for 34 per cent of
liabilities in the pharmaceutical sector, 18 p.p.
above the share registered in total enterprises.
This component played a greater role in SMEs
and large enterprises (36 per cent of liabilities,
Chart 26 • Liabilities structure (2014)
0 %
20 %
40 %
60 %
80 %
100 %
Micro SMEs Large Pharmaceutical
industry
Wholesale of
pharmaceutical
goods
Retail sale of
pharmaceutical
goods
Total
enterprises
Pharmaceutical
sector
By size class By economic activity segment
Debt securities (A) Bank loans (B) Intra-group financing (C)
Other financial debt (D) Trade credits Other liabilities
(A + B + C + D) =
Interest-bearing debt

34 BANCO DE PORTUGAL • Central Balance Sheet Studies • 25
in both cases) than in microenterprises (28 per
cent).
With regard to economic activity segments,
trade credits accounted for 44 per cent of
liabilities in the wholesale of pharmaceutical
goods, 25 per cent in the retail sale of
pharmaceutical goods and 19 per cent in the
pharmaceutical industry.
Liabilities in the pharmaceutical sector
decreased very slightly in 2014 (by 1 per cent,
i.e. below the 2 per cent decline in total
enterprises), following an 8 per cent fall in 2013
(2 per cent in total enterprises) (Table 8).
Marginal developments in the pharmaceutical
sector’s liabilities chiefly resulted from a
counterbalance between developments in the
various components, most notably a negative
contribution from bank loans (3.4 p.p.) and
positive contributions from other liabilities
(1.9 p.p.), intra-group financing (0.8 p.p.) and
debt securities (0.6 p.p.). This contrasted with
that seen in 2013, when all components, except
for other liabilities, made a negative
contribution to developments in the sector’s
liabilities, particularly intra-group financing
(with a negative contribution of 4.6 p.p.).
Table 8 • Liabilities | Contributions from components (p.p.) to the annual growth rate (%)
2013 2014
Total enterprises -2.3 -1.9
Pharmaceutical sector -7.9 -0.8
Components
(contributions in p.p.)
Debt securities -0.4 0.6
Bank loans -0.6 -3.4
Intra-group financing -4.6 0.8
Other financial debt -1.1 -0.2
Trade credits -2.1 -0.5
Other liabilities 0.9 1.9

Analysis of enterprises in the pharmaceutical sector • 7 | 2016 35
Box 3 | Bank loans granted by the resident financial system17
In 2014 loans obtained from the financial sector accounted for 54 per cent of the
pharmaceutical sector’s interest-bearing debt (23 per cent of total liabilities). In the same
year, 66 per cent of enterprises in the pharmaceutical sector had borrowed from the
financial sector resident in Portugal18 (57 per cent in total enterprises).
Loans granted by the resident financial system to the pharmaceutical sector have
decreased since 2011 and totalled € 1,192 million at the end of 2015, i.e. € 116 million less
than in 2014. This downward trend of the past few years was common to the sector’s three
segments (Chart 27).
In 2015 microenterprises and SMEs held 45 per cent and 40 per cent, respectively, of loans
granted by the financial system to the pharmaceutical sector, while large enterprises held
15 per cent (Chart 28). Compared with the structure seen in 2010, the relative weight of
microenterprises increased by 13 p.p., thus making them the group that made the highest
contribution to the sector’s indebtedness to the resident financial system.
By economic activity segment, at the end of 2015 the retail sale of pharmaceutical goods
held the largest share (58 per cent) of funds obtained by the pharmaceutical sector from
the resident financial system, followed by the wholesale of pharmaceutical goods (24 per
cent) and the pharmaceutical industry (18 per cent).
Chart 27 • Loans granted by the resident financial system to the pharmaceutical
sector (EUR millions)
Chart 28 • Structure of funds obtained by the pharmaceutical sector from the
resident financial system (2010 and 2015)
By size class
By economic activity segment
0
300
600
900
1,200
1,500
1,800
Mar. Jun. Sep. Dec. Mar. Jun. Sep. Dec. Mar. Jun. Sep. Dec. Mar. Jun. Sep. Dec. Mar. Jun. Sep. Dec. Mar. Jun. Sep. Dec.
2010 2011 2012 2013 2014 2015
Pharmaceutical sector Pharmaceutical industry
Wholesale of pharmaceutical goods Retail sale of pharmaceutical goods
32 %
42 %
25 %
45 %
40 %
15 %
Microenterprises SMEs Large enterprises
2015
2010
21 %
28 %
51 %
18 %
24 %
58 %
Pharmaceutical industry Wholesale of pharmac. goodsRetail sale of pharmac. goods
2015
2010
36 BANCO DE PORTUGAL • Central Balance Sheet Studies • 25
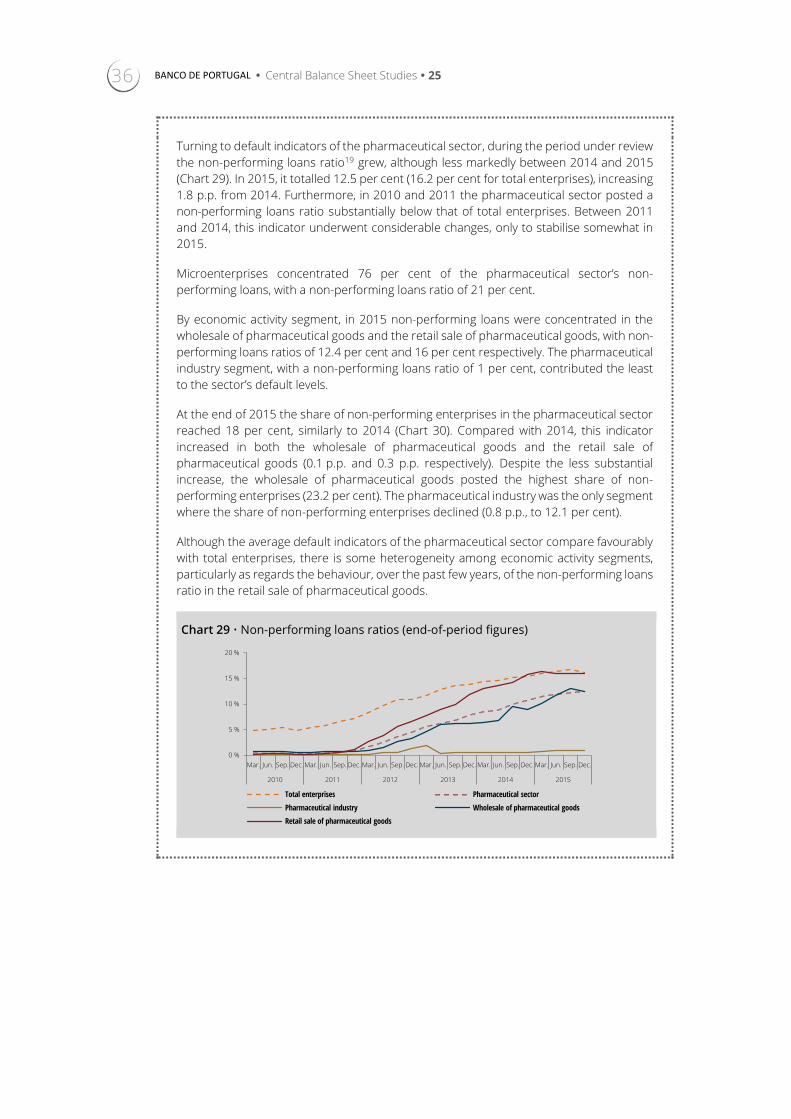
Turning to default indicators of the pharmaceutical sector, during the period under review
the non-performing loans ratio19 grew, although less markedly between 2014 and 2015
(Chart 29). In 2015, it totalled 12.5 per cent (16.2 per cent for total enterprises), increasing
1.8 p.p. from 2014. Furthermore, in 2010 and 2011 the pharmaceutical sector posted a
non-performing loans ratio substantially below that of total enterprises. Between 2011
and 2014, this indicator underwent considerable changes, only to stabilise somewhat in
2015.
Microenterprises concentrated 76 per cent of the pharmaceutical sector’s non-
performing loans, with a non-performing loans ratio of 21 per cent.
By economic activity segment, in 2015 non-performing loans were concentrated in the
wholesale of pharmaceutical goods and the retail sale of pharmaceutical goods, with non-
performing loans ratios of 12.4 per cent and 16 per cent respectively. The pharmaceutical
industry segment, with a non-performing loans ratio of 1 per cent, contributed the least
to the sector’s default levels.
At the end of 2015 the share of non-performing enterprises in the pharmaceutical sector
reached 18 per cent, similarly to 2014 (Chart 30). Compared with 2014, this indicator
increased in both the wholesale of pharmaceutical goods and the retail sale of
pharmaceutical goods (0.1 p.p. and 0.3 p.p. respectively). Despite the less substantial
increase, the wholesale of pharmaceutical goods posted the highest share of non-
performing enterprises (23.2 per cent). The pharmaceutical industry was the only segment
where the share of non-performing enterprises declined (0.8 p.p., to 12.1 per cent).
Although the average default indicators of the pharmaceutical sector compare favourably
with total enterprises, there is some heterogeneity among economic activity segments,
particularly as regards the behaviour, over the past few years, of the non-performing loans
ratio in the retail sale of pharmaceutical goods.
Chart 29 • Non-performing loans ratios (end-of-period figures)
0 %
5 %
10 %
15 %
20 %
Mar. Jun. Sep. Dec. Mar. Jun. Sep. Dec. Mar. Jun. Sep. Dec. Mar. Jun. Sep. Dec. Mar. Jun. Sep. Dec. Mar. Jun. Sep. Dec.
2010 2011 2012 2013 2014 2015
Total enterprises Pharmaceutical sector
Pharmaceutical industry Wholesale of pharmaceutical goods
Retail sale of pharmaceutical goods

Analysis of enterprises in the pharmaceutical sector • 7 | 2016 37
Chart 30 • Percentage of non-performing enterprises (end-of-period figures)
0 %
5 %
10 %
15 %
20 %
25 %
30 %
35 %
Mar. Jun. Sep. Dec. Mar. Jun. Sep. Dec. Mar. Jun. Sep. Dec. Mar. Jun. Sep. Dec. Mar. Jun. Sep. Dec. Mar. Jun. Sep. Dec.
2010 2011 2012 2013 2014 2015
Total enterprises Pharmaceutical sector
Pharmaceutical industry Wholesale of pharmaceutical goods
Retail sale of pharmaceutical goods

38 BANCO DE PORTUGAL • Central Balance Sheet Studies • 25
3.3.2. Financial costs and solvency
In 2014 interest expenses in the
pharmaceutical sector declined, on average, by
10 per cent from the previous year, i.e. more
than in total enterprises (7 per cent) (Chart 31).
The average rate of change in the sector’s
interest expenses was closer to the distribution
median of individual rates of change (2 p.p.
differential). This contrasted with total
enterprises (13 p.p.), where a substantial share
of enterprises posted declines in interest
expenses higher than those suggested by the
average rate of change.
Interest expenses of microenterprises and
large enterprises declined by 16 per cent and
14 per cent respectively, while in SMEs the
reduction was less substantial (4 per cent).
However, half of the large enterprises posted a
fall in interest expenses of more than 29 per
cent, by contrast to the class average.
The decline in interest expenses was also
broadly based across economic activity
segments, partially due to a reduction in
interest-bearing debt. The pharmaceutical
industry posted the most marked fall in interest
expenses (15 per cent). In the wholesale of
pharmaceutical goods and the retail sale of
pharmaceutical goods, interest expenses
decreased by 10 per cent and 7 per cent
respectively. The analysis of the distribution
median of the various segments shows,
however, a negative bias in the average value of
the growth rate in interest expenses of the
pharmaceutical industry, by contrast to a
positive bias in the other segments. In the
wholesale of pharmaceutical goods, half of the
enterprises posted reductions in interest
expenses of more than 14 per cent, compared
with 12 per cent in the retail sale of
pharmaceutical goods and 10 per cent in the
pharmaceutical industry.
In 2014 the financial pressure ratio of the
pharmaceutical sector, assessed by the weight
of interest expenses in the sector’s aggregate
EBITDA, decreased by 3 p.p. from the previous
year, to 13 per cent. Similarly to the entire
2010-14 period, this ratio was higher in total
enterprises (28 per cent in 2014) (Chart 32).
The reduction in the pharmaceutical sector’s
financial pressure was broadly based across
size classes and economic activity segments.
Although microenterprises and the retail sale
of pharmaceutical goods posted the highest
declines in 2014 (7 p.p. and 6 p.p. respectively),
they had the highest financial pressure levels
(18 per cent, in both cases).
Despite the lower financial pressure exerted on
the pharmaceutical sector, individual data
shows that, in 2014, 20 per cent of enterprises
did not generate enough EBITDA to pay interest
expenses on their interest-bearing debt, which
is still below that seen in total enterprises
(34 per cent) (Chart 33). Conversely, financial
pressure was below 0.5 for 73 per cent of
enterprises in the pharmaceutical sector
(61 per cent in total enterprises).
Chart 31 • Interest expenses | Weighted average and median of the annual growth rate
-29 %
-20 % -19 %
-12 %
-14 %
-6 %
-29 %
-10 %-14 % -12 %
-20 %
-7 %-5 %
-10 %
-16 %
-4 %
-14 % -15 %
-10 %-7 %
-40 %
-20 %
0 %
2010 2014 2010 2014 Micro SMEs Large Pharmaceutical
industry
Wholesale of
pharmaceutical
goods
Retail sale of
pharmaceutical
goods
Total enterprises Pharmaceutical sector By size class (2014) By economic activity segment (2014)
Median Weighted average

Analysis of enterprises in the pharmaceutical sector • 7 | 2016 39
Approximately 88 per cent of large enterprises
retained at least half of the available EBITDA
after paying their interest expenses (83 per cent
in SMES and 70 per cent in microenterprises).
By economic activity segment, the
pharmaceutical industry and the retail sale of
pharmaceutical goods were particularly
noteworthy, where 75 per cent of enterprises
faced financial pressure levels below 0.5. The
wholesale of pharmaceutical goods posted the
largest share of enterprises whose EBITDA was
not enough to pay their interest expenses
(29 per cent).
Chart 32 • Weight of interest in EBITDA | By size class and economic activity segment
(2013 and 2014)
Chart 33 • Financial pressure | Distribution of enterprises by performance level (2014)
Note: The class ‘Above 1’ includes enterprises with negative EBITDA.
30 %
16 %
24 %
15 % 14 %13 %
15 %
24 %28 %
13 %
18 %
13 %12 % 11 %
12 %
18 %
0 %
5 %
10 %
15 %
20 %
25 %
30 %
35 %
Micro SMEs Large Pharmaceutical
industry
Wholesale of
pharmaceutical
goods
Retail sale of
pharmaceutical
goods
Total
enterprises
Pharmaceutical
sector
By size class By economic activity segment
2013 2014
61 %73 % 70 %
83 % 88 %75 %
65 %75 %
5 %
7 % 8 %
7 %4 %
5 %
6 %
8 %34 %
20 % 23 %11 % 8 %
20 %29 %
17 %
0 %
20 %
40 %
60 %
80 %
100 %
Micro SMEs Large Pharmaceutical
industry
Wholesale of
pharmaceutical
goods
Retail sale of
pharmaceutical
goods
Total enterprises Pharmaceutical
sector
By size class By economic activity segment
Up to 0.5 From 0.5 to 1 Above 1

40 BANCO DE PORTUGAL • Estudos da Central de Balanços • 25
3.3.3. Trade credit financing
In 2014 trade credit financing accounted for
the largest share of liabilities in the
pharmaceutical sector (34 per cent, compared
with 16 per cent in total enterprises).
Days payable outstanding stood at 77 days in
the pharmaceutical sector (similarly to total
enterprises), while days sales outstanding
stood at 86 days (74 days in total enterprises).
On average, the sector’s enterprises took nine
more days to receive from their customers
than to pay their suppliers, conversely to total
enterprises, whose days sales outstanding
were lower than days payable outstanding.
Compared with 2013, days payable
outstanding and days sales outstanding in the
pharmaceutical sector decreased by four and
eight days respectively, more than in total
enterprises (two days for both indicators).
The net indicator of trade credit financing
relates accounts payable and accounts
receivable to turnover, thus helping to
understand how this funding is used by
enterprises. A positive value implies that the
enterprise’s accounts payable is above
accounts receivable, which means that the
enterprise is obtaining financing from
suppliers. A negative value in this indicator
implies that accounts receivable is above
accounts payable, which overall means that the
enterprise is financing its customers.
In 2014 trade credit financing of the
pharmaceutical sector as a percentage of
turnover stood at -6 per cent, which shows that
the sector did not obtain financing in net terms
through this means. In line with total
enterprises (-3 per cent in 2014), this was stable
throughout the period under review (Chart 34).
However, net trade credit financing of the
pharmaceutical sector improved slightly in
2014 compared with 2013 (1.5 p.p.), following
the trend seen since 2011 (conversely to the
high stability of this indicator in total
enterprises).
In 2014 the sector’s microenterprises posted a
positive balance in this indicator,
corresponding to 8 per cent of turnover.
Conversely, SMEs and large enterprises had net
trade credit financing of -9 per cent of turnover,
thus reflecting, in both cases, an improvement
for the third consecutive year. Consequently,
SMEs and large enterprises contributed to the
improvement in this indicator in the sector as a
whole, due to a reduction in its negative
balance compared with 2013 (by 2 p.p. and
3 p.p. respectively). Turning to
microenterprises, although positive, net trade
credit financing decreased from 2013 (2 p.p.).
Taking into account the various economic
activity segments, the retail sale of
pharmaceutical goods was the only segment
that obtained net trade credit financing (8 per
cent of turnover). In the other segments, net
trade credit financing was negative (11 per cent
in the wholesale of pharmaceutical goods and
6 per cent in the pharmaceutical industry). The
recovery in the balance of the wholesale of
pharmaceutical goods in 2014 (3 p.p.) was a key
factor behind sectoral developments
compared with 2013, in contrast to negative
changes in the other segments (2 p.p. in both
cases).
These data are confirmed by the assessment of
individual net trade credit financing of
pharmaceutical enterprises.
Approximately three-quarters of enterprises in
the retail sale of pharmaceutical goods posted
positive values in this indicator, accounting for
a similar share in the segment’s turnover
(74 per cent). In the other segments, the
opposite was the case, with negative
differentials between accounts receivable and
accounts payable in 57 per cent of enterprises
in the pharmaceutical industry and 61 per cent
of enterprises in the wholesale of
pharmaceutical goods (these enterprises
accounted for 63 per cent and 78 per cent of
turnover in each segment, respectively).
The segmentation by the different activities
that are comprised within the pharmaceutical
sector determined that most of its enterprises
(63 per cent) posted positive net trade credit
financing. However, the most substantial share
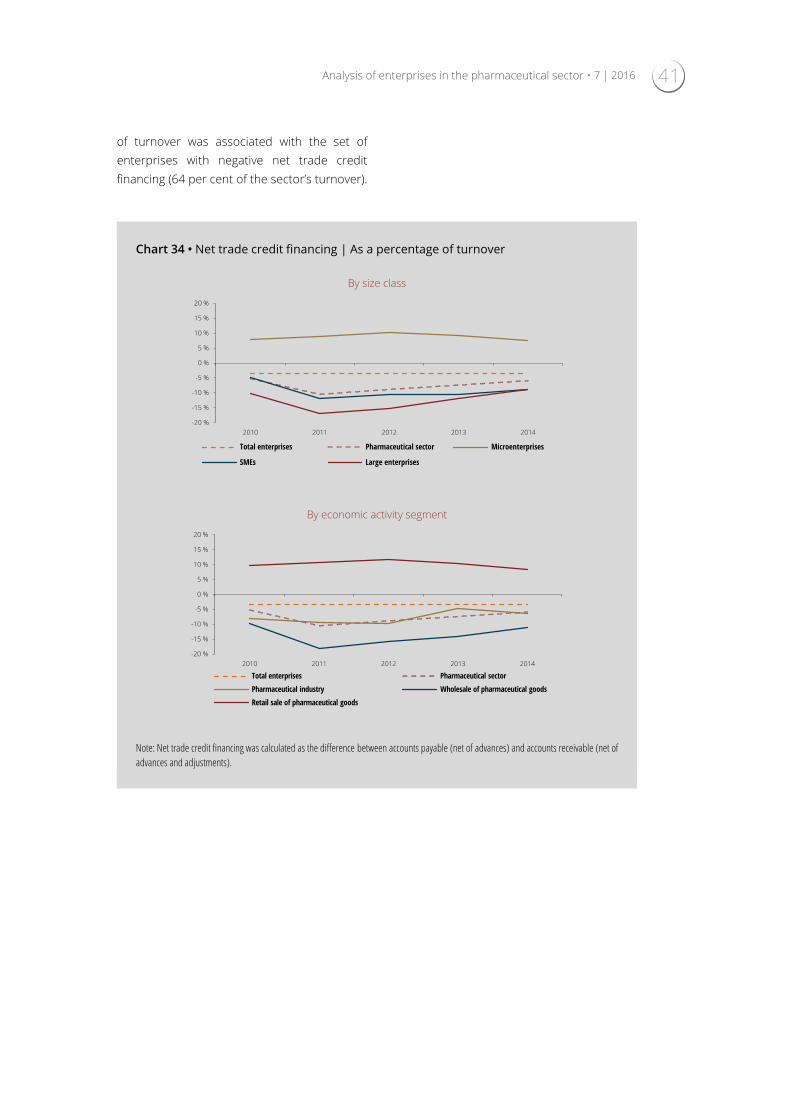
Analysis of enterprises in the pharmaceutical sector • 7 | 2016 41
of turnover was associated with the set of
enterprises with negative net trade credit
financing (64 per cent of the sector’s turnover).
Chart 34 • Net trade credit financing | As a percentage of turnover
By size class
By economic activity segment
Note: Net trade credit financing was calculated as the difference between accounts payable (net of advances) and accounts receivable (net of
advances and adjustments).
-20 %
-15 %
-10 %
-5 %
0 %
5 %
10 %
15 %
20 %
2010 2011 2012 2013 2014
Total enterprises Pharmaceutical sector Microenterprises
SMEs Large enterprises
-20 %
-15 %
-10 %
-5 %
0 %
5 %
10 %
15 %
20 %
2010 2011 2012 2013 2014
Total enterprises Pharmaceutical sector
Pharmaceutical industry Wholesale of pharmaceutical goods
Retail sale of pharmaceutical goods

42 BANCO DE PORTUGAL • Estudos da Central de Balanços • 25
Notes
1. For the sake of simplicity, this study refers to ‘enterprise’ and ‘corporation’ interchangeably. Both refer to enterprises that comprise the institutional
non-financial corporations (NFCs) sector. The NFC sector is one of the economy’s institutional sectors. The institutional sectorisation of economic agents is
carried out in accordance with the 2010 European System of National and Regional Accounts (ESA 2010), approved by Council Regulation (EC) No
549/2013 of 25 May 2013. ESA 2010 is a harmonised reference on the compilation methodology and deadline for release of the national accounts of EU
countries, including statistics under Banco de Portugal's responsibility. Underlying the series under analysis (2010-14) is a definition of the ESA 2010
population. Based on the national accounts standard, sole proprietors are included in the households’ institutional sector. Hence, all data on the NFC
sector throughout this study exclude sole proprietors (in Portugal these represent around two-thirds of the number of enterprises, but only 5 per cent of
the respective turnover).
2. The Central Balance Sheet Database of Banco de Portugal is a database with economic and financial information on NFCs in Portugal. Information is
based on annual accounting data reported within the scope of Informação Empresarial Simplificada – IES (Simplified Corporate Information) and
quarterly accounting data reported by enterprises through the quarterly survey of non-financial corporations. Annual data cover nearly all NFCs and
quarterly data cover around 4,000 enterprises, representing 50 per cent of turnover in the sector. For further details on the activities of the Central Balance
Sheet Database, see Supplements to the Statistical Bulletin 1/2008 – Simplified reporting: inclusion of the Simplified Corporate Information in the Statistics on
Non-Financial Corporations from the Central Balance Sheet Database, and 2/2013 – Statistics on non-financial corporations of the Central Balance Sheet Database:
Methodological notes, as well as the Central Balance Sheet Study |19 – Sector Tables and Enterprise and Sector Tables: Methodological Notes. Long Time Series 1995-
2013 of November 2014.
3. Based on data from the integrated business accounts system (Sistema de Contas Integradas das Empresas) of Statistics Portugal, available at www.ine.pt.
4. For more details on total enterprises, see Central Balance Sheet Study | 23 – Sectoral analysis of non-financial corporations in Portugal 2010-2015 of November
2015.
5. Some totals in the tables and charts may not add up due to rounding.
6. The definition of size classes used in this study is detailed in the Annex.
7. Geographical location refers to the district where the enterprise’s head office is located.
8. The definition of enterprise maturity used in this study is detailed in the Annex.
9. As defined in Eurostat-OECD Manual on Business Demography Statistics, high-growth enterprises are enterprises whose average annual turnover growth
is greater than 20 per cent per annum over a three-year period. Turnover is used as a variable for the calculation of the rate. For more information, see
Central Balance Sheet Study | 12 – Structure and dynamics of non-financial corporations in Portugal 2006-2012 of November 2013.
10. The definition of export sector is detailed in Central Balance Sheet Study | 22 - Analysis of enterprises in the export sector in Portugal of June 2015.
11. For more information on economic developments in Portugal, please refer to the Economic Bulletin of June 2016, available at www.bportugal.pt.
12. The ‘operating expenses’ aggregate is calculated as the sum of the cost of goods sold and materials consumed (CoGS), supplies and external services
(SES) and employee expenses.
13. EBITDA means earnings before interest, taxes, depreciation and amortisation.
14. For the sake of simplicity, this study refers to the term ‘income’ which corresponds to ‘total net income’, obtained through the sum of turnover, variation
in production, capitalised production, operating subsidies, other income and gains, and interest and other similar income.
15. Interest-bearing debt refers to all liabilities with payable interest. See the Annex for a more detailed definition.
16. ‘Box 3 | Loans granted by the resident financial system’ provides additional information in this source of funding.
17. Information taken from the Central Credit Register, a database managed by Banco de Portugal, which gathers information provided by participating
entities (resident institutions) regarding credit granted. For more information, please refer to Banco de Portugal Booklet No 5, Central de Responsabilidades
de Crédito (Portuguese version only).
18. These include banks, savings banks and mutual agricultural credit banks (generically called ‘banks’ in this study), as well as factoring companies,
credit-purchase financing companies and financial leasing companies. Over 95 per cent of credit granted by resident credit institutions to NFCs in 2015
came from banks.
19. The non-performing loans ratio is based on information on credit granted by resident CIs in Banco de Portugal’s Central Credit Register by calculating
the ratio of the amount of credit overdue to total credit obtained. Credit is deemed to be overdue when the respective repayments are not paid on the
due payment dates. Credit customers may default as regards principal and/or interest and other expenditure. Credit is deemed to be overdue, in the case
of principal, once the maximum period of 30 days after maturity has elapsed without settlement and, in the case of interest and other expenses, once the
due date for settlement has passed. This information is based on credit balances recorded in the balance sheets of financial institutions, which may refer
to closed enterprises, given that part of the debt may yet be repaid, where there are assets and personal guarantees, even after the enterprise has closed.
After the enterprise has ceased activities, it very often happens that a significant part of the credit is still recorded as non-performing loans and gradually
replaced by loan write-offs. For more information, please refer to the Economic Bulletin of May 2015, available at www.bportugal.pt.

Annex
Main indicators of the pharmaceutical
sector
Methodological summary


Análise das empresas do setor farmacêutico • 7 | 2016 45
ANNEX • Main indicators of the pharmaceutical sector (2014)
Sector characterisation Activity Financing Profitability
Turnover held
by large
enterprises
Turnover held by the
largest enterprises
(TOP 10%)
Growth rates
Capital ratio
Growth rates Net
trade credit
financing (% of
turnover)
Weight of
interest in
EBITDA
Credit obtained from
resident CIs
(end of 2015) Return on
equity
Turnover EBITDA Trade
credits Bank loans
% of non-
performing
enterprises
Non-
performing
loans ratio
Total
enterprises 43% 89% 2% 1% 30% -1% -8% -3% 28% 29% 16% 3%
Pharmaceutical
sector 40% 77% 3% 8% 38% -1% -13% -6% 13% 18% 12% 9%
Pharmaceutical
industry 53% 73% -3% -2% 42% -6% -7% -6% 11% 12% 1% 12%
Wholesale of
pharmaceutical
goods
51% 83% 3% 8% 35% 2% -28% -11% 12% 23% 12% 8%
Retail sale of
pharmaceutical
goods
4% 31% 7% 24% 40% -9% -7% 8% 18% 16% 16% 7%
Share of the pharmaceutical sector
Number of enterprises Turnover Number of employees
2006 2014 2006 2014 2006 2014
Total enterprises 0.67% 0.92% 3.03% 3.29% 1.04% 1.31%

46 BANCO DE PORTUGAL • Central Balance Sheet Studies • 25
Methodological summary
Capital ratio: Ratio of equity to total assets.
Economic activity segment: The enterprises
classified in Sections K – Financial and insurance
activities; O – Public administration and defence;
Compulsory social security, T – Activities of
households as employers; Undifferentiated goods-
and services-producing activities of households for
own use and U – Activities of extraterritorial
organisations and bodies in CAE-Rev. 3, were
excluded from this analysis as they do not fall
within the NFC institutional sector.
Financial pressure: Ratio of interest expenses to
EBITDA.
Interest-bearing debt: Interest-bearing debt
refers to all liabilities with payable interest,
obtained through debt securities issues, loans
granted by credit institutions and financial
companies, intra-group financing and other
loans.
Maturity: Enterprise maturity refers to the age
of the enterprise as at the analysis reference
date. Four maturity classes are considered: up
to five years; from five to (but not including) ten
years; from ten to (but not including) 20 years;
and more than 20 years.
Pharmaceutical sector: For the purposes of this
study, the pharmaceutical sector comprises
enterprises from division 21 – manufacture of basic
pharmaceutical products and pharmaceutical
preparations (pharmaceutical industry), subclass
46460 (wholesale of pharmaceutical goods) and
subclass 47730 (retail sale of pharmaceutical goods).
Quartile distribution: In order to calculate
quartiles, the enterprise values for the indicator
under analysis are ranked in ascending order.
The first quartile corresponds to the value of
the enterprise in the position corresponding to
25% of the ordered sample (i.e. where 25% of
enterprises show a lower value for that
indicator and 75% a higher value). The second
quartile (or median) corresponds to 50%, i.e.
the indicator value for this enterprise divides
the breakdown into two halves, where one half
of the enterprises shows a higher value and the
other half a lower value. The third quartile
corresponds to the 75% position of the
ordered sample (75% of enterprises show a
lower value for that indicator, and only 25%
show a higher value). The interquartile range
(obtained as the difference between the third
and first quartiles) provides an indication of
distribution dispersion. For further details on
the calculation of these statistical measures,
please refer to the Central Balance Sheet Study | 6
– New enterprise and sector tables: adjustment to the
Accounting Standards System, December 2011.
Return on equity: Ratio of net income for the
year to equity. As both items (numerator and
denominator) may be positive or negative, at
individual level, the indicator is only calculated
in situations where equity is positive.
Size of the enterprise: Enterprises were grouped
into three classes: microenterprises, small and
medium-sized enterprises and large
enterprises. The criteria for this classification
were taken from the European Commission
Recommendation of 6 May 2003 concerning
the definition of micro, small and medium-sized
enterprises. According to this
Recommendation, microenterprises are
defined as enterprises which employ fewer
than 10 persons and whose annual turnover
and/or balance sheet total does not exceed €2
million. For the purpose of this study, small and
medium-sized enterprises (SMEs) exclude
microenterprises, employ fewer than 250 and
more than 10 persons and have an annual
turnover between €2 million and €50 million
and/or an annual balance sheet total between
€2 million and €43 million. Large enterprises
are any enterprises which are not classified
above.

Analysis of enterprises in the pharmaceutical sector • 7 | 2016 47
Abbreviations and acronyms
CAE Portuguese Classification of Economic Activities
CIs credit institutions
CoGS cost of goods sold and materials consumed
EBITDA earnings before interest, taxes, depreciation and amortisation
ESA 2010 European system of national and regional accounts 2010
GDP gross domestic product
HGEs high-growth enterprises
IES Informação Empresarial Simplificada (Simplified Corporate Information)
INE Instituto Nacional de Estatística (Statistics Portugal)
NFCs Non-financial corporations
p.p. percentage points
SES supplies and external services
SMEs small and medium-sized enterprises (excluding microenterprises)

48 BANCO DE PORTUGAL • Central Balance Sheet Studies • 25
References
Banco de Portugal (2008), Simplified reporting: inclusion of the Simplified Corporate Information in the
Statistics on Non-Financial Corporations from the Central Balance Sheet Database, Supplement 1/2008
to the Statistical Bulletin, May 2008. http://www.bportugal.pt/en-US/Estatisticas/PublicacoesEstatisticas/Pages/SuplementosaoBoletimEstatistico.aspx
Banco de Portugal (2013), Statistics on non-financial corporations of the Central Balance Sheet
Database: Methodological notes, Supplement 2/2013 to the Statistical Bulletin, October 2013. http://www.bportugal.pt/en-US/Estatisticas/PublicacoesEstatisticas/Pages/SuplementosaoBoletimEstatistico.aspx
Banco de Portugal (2014), Sector Tables and Enterprise and Sector Tables: Methodological Notes. Long
Time Series 1995-2013, Central Balance Sheet Studies, No 19, November 2014. http://www.bportugal.pt/en-US/ServicosaoPublico/CentraldeBalancos/Pages/EstudosdaCentraldeBalancos.aspx
Banco de Portugal (2015), Central de Responsabilidades de Crédito, Banco de Portugal Booklets, No 5,
April 2015 (Portuguese version only). http://www.bportugal.pt/pt-PT/PublicacoeseIntervencoes/Banco/CadernosdoBanco/Paginas/CadernosdoBanco.aspx
Banco de Portugal (2015), Analysis of enterprises in the export sector in Portugal, Central Balance Sheet
Studies, No 22, June 2015. http://www.bportugal.pt/en-US/ServicosaoPublico/CentraldeBalancos/Pages/EstudosdaCentraldeBalancos.aspx
Banco de Portugal (2015), Economic Bulletin, May 2015. http://www.bportugal.pt/en-US/EstudosEconomicos/Publicacoes/BoletimEconomico/Pages/BoletimEconomico.aspx
Banco de Portugal (2015), Sectoral analysis of non-financial corporations in Portugal 2010-2015, Central
Balance Sheet Studies, No 23, November 2015. https://www.bportugal.pt/en-US/ServicosaoPublico/CentraldeBalancos/Tumbnails%20List%20Template/Study%20CB%2023_2015_EN.pdf
Banco de Portugal (2015), Economic Bulletin, June 2016. https://www.bportugal.pt/en-US/EstudosEconomicos/Publicacoes/BoletimEconomico/Publications/bol_econ_june16_e.pdf
Decree-Law No 381/2007 of 14 November on the definition of the Portuguese Classification of
Economic Activities, Revision 3 (CAE-Rev.3) (Portuguese version only).
Commission Recommendation of 6 May 2003 concerning the definition of micro, small and
medium-sized enterprises (2003/361/EC).
Regulation (EU) No 549/2013 of the European Parliament and of the Council of 21 May 2013 on
the European system of national and regional accounts in the European Union.

Analysis of enterprises in the pharmaceutical sector • 7 | 2016 49
Central Balance Sheet Studies
1 | Enterprise and sector tables, November 2010
2 | Structure and dynamics of non-financial corporations in Portugal, December 2010
3 | Sectoral analysis of non-financial corporations in Portugal, September 2011
4 | Sectoral analysis of manufacture of food products, November 2011
5 | Sectoral analysis of accommodation and food service activities, November 2011
6 | New enterprise and sector tables: adjustment to the Accounting Standards System,
December 2011
7 | Sectoral analysis of non-financial corporations in Portugal 2010/2011, April 2012
8 | Sectoral analysis of non-financial corporations in Portugal 2011/2012, November 2012
9 | Sectoral analysis of the manufacture of textiles and wearing apparel, November 2012
10 | Sectoral analysis of the manufacture of footwear, November 2012
11 | Analysis of the agricultural sector, December 2012
12 | Structure and dynamics of non-financial corporations in Portugal, 2006-2012, November
2013
13 | Sectoral analysis of non-financial corporations in Portugal, 2012/2013, November 2013
14 | Analysis of the automobile industry, December 2013
15 | Analysis of the construction sector, January 2014
16 | Analysis of the information and communication activities sector, April 2014
17 | Analysis of the tourism sector, October 2014
18 | Sectoral analysis of non-financial corporations in Portugal 2009-2014, November 2014
19 | Sector tables and enterprise and sector tables – Methodological Notes (Long Time Series
1995-2013), November 2014
20 | Analysis of the mechanical engineering sector, March 2015
21 | Analysis of maritime sector companies, May 2015
22 | Analysis of enterprises in the export sector in Portugal, June 2015
23 | Sectoral analysis of non-financial corporations in Portugal 2010-2015, November 2015
24 | Analysis of enterprises in the wood, cork and paper sectors, January 2016
25 | Analysis of enterprises in the pharmaceutical sector, July 2016