analysis of farmer preferences for wheat variety traits in ethiopia
TRANSCRIPT

ANALYSIS OF FARMER PREFERENCES FOR WHEAT VARIETY TRAITS
IN ETHIOPIA: A GENDER-RESPONSIVE STUDY
A Thesis
Presented to the Faculty of the Graduate School
of Cornell University
In Partial Fulfillment of the Requirements for the Degree of
Masters of Science
by
Katherine Margaret Nelson
January 2013

© 2013 Katherine Margaret Nelson

ABSTRACT
This study highlights gender differences in the Ethiopian wheat production system and
determines trait preferences for different segments of the population. Surveys from 158 men and
147 women farmers were used to evaluate preferences for six traits of bread wheat: number of
productive tillers; density of kernels per spike; resistance to rust disease; size of grain; color of
grain; and price in Ethiopian Birr per 100kg bag of seed. A conjoint analysis of their responses
to 18 trait combinations revealed that the number of tillers was the most important trait in the
overall sample. However, cluster analysis revealed seven distinct respondent segments
characterized by different trait preferences. Segment membership was weakly correlated with
gender, socio-economic status, usage factors, and constraints to production. The methodology
and results should be useful to breeders in evaluating trade-offs among various traits.
iii
BIOGRAPHICAL SKETCH
Katherine M. Nelson earned her Bachelor of Arts degree in Sociology in 2002 from the University of
Colorado in Boulder. In 2010 she joined the Masters of Science program at Cornell University in Crop
and Soil Sciences.
While pursuing her degree, she worked as the teaching assistant for the Master of Professional Studies
program in International Agriculture and Rural Development. She interned at the International Rice
Research Institute in 2010 and is currently a full time agronomy extension employee.
Katherine presented her research at international conference meetings and workshops including the 2011
Borlaug Global Rust Initiative annual meeting.
Katherine’s master’s thesis entitled “Analysis of farmer preferences for wheat variety traits in Ethiopia: A
gender responsive study,” was supervised by Dr. John Duxbury, Dr. Ronnie Coffman, and Dr. Sarah
Davidson Evanega.

iv
I hereby dedicate this thesis to my family. They have provided their unconditional love, support,
knowledge, and encouragement throughout this journey.

v
ACKNOWLEDGMENTS
This thesis would not have been possible without the guidance and support of several people. Firstly, I
would like to thank the Durable Rust Resistance in Wheat project for providing the funding for this
research and the travel to Ethiopia. My utmost gratitude goes to the team in Ethiopia: Dr. Bedada Girma,
Sakatu Hunduma, Sintayehu Abebe, and Yeshi Chiche. I will never forget the sincerity and
encouragement you all showed by opening your homes to me and treating me as family during my stay in
Ethiopia. Dr. Bedada provided his extensive knowledge of Ethiopian agriculture, an abundance of
research advice, and unfailing kindness and patience throughout. I consider Sakatu Hunduma my
Ethiopian sister; she has dedicated countless hours of research and has been my inspiration as we tackled
the hurdles of fieldwork together. Sintayehu Abebe is my Ethiopian brother that has provided his
knowledge and time to ensuring the success of this research. Yeshi Chice shared her academic and
personal insights and guided me in working with women in Ethiopia.
Dr. John Duxbury, Professor in Crop and Soil Sciences Department, who trusted in me and advocated for
a multi-disciplinary approach to crop sciences and extension research as my thesis advisor.
Dr. Ronnie Coffman, Professor of Plant Breeding and Genetics/Director of DRRW/Academic Director of
College of Agriculture and Life Sciences International Programs, who always saw my potential and
provided encouragement throughout my studies as co-chair thesis advisor.
Dr. Sarah Davidson Evanega, Assistant Director of DRRW/Adjunct Professor of Plant Breeding and
Genetics, who gave me the support to be structured and the autonomy to be creative while providing the
leadership to overcome the obstacles and complete this research.
Dr. Louise Sperling, Principle Researcher at the International Center for Tropical Research (CIAT), who
provided direction in the planning and budgeting of the research project and kept me on track throughout
the process.

vi
Last but not the least, Dr. Robert Nelson, my father and mentor, for the incredible patience and unfailing
perseverance to coach me through the smallest details and give me the strength and confidence to
challenge myself to always strive to be better.

vii
TABLE OF CONTENTS
ABSTRACT ..................................................................................................................................... i
BIOGRAPHICAL SKETCH ......................................................................................................... iii
ACKNOWLEDGMENTS .............................................................................................................. v
1. Introduction .............................................................................................................................. 1
1.1 Global importance of wheat ................................................................................................ 2
Food security and wheat dependence .................................................................................. 3
1.2 Gender and development ..................................................................................................... 3
1.3 Constraints to production – wheat rust diseases ................................................................ 6
1.4 Durable Rust Resistance in Wheat project ......................................................................... 8
1.5 Wheat adaptability and variability ...................................................................................... 9
Agronomic adaptability ........................................................................................................ 9
Variability in end-use quality ............................................................................................. 10
1.6 Ethiopia 11
Constraints to production in Ethiopia ................................................................................ 12
Influence of gender on adoption ......................................................................................... 15
Gender in development ....................................................................................................... 18
1.7 Objectives ............................................................................................................................ 19
2. Materials and methods ........................................................................................................... 20
2.1 Gender-responsive study design ......................................................................................... 20
Training on gender-sensitive research ............................................................................... 20
Study design ........................................................................................................................ 22
2.2 Focus group discussions .................................................................................................... 26
2.3 Perceptions and evaluations of existing varieties ............................................................ 29
2.4 Gender-roles ...................................................................................................................... 35
2.5 Conjoint analysis study ...................................................................................................... 36
Phenotypic traits and levels ............................................................................................... 38
Varietal combinations and visual stimuli ........................................................................... 38
Experimental design ........................................................................................................... 40
Data entry ........................................................................................................................... 41
Wealth index calculation .................................................................................................... 41

viii
Ordinary least squares model ............................................................................................ 42
Adjusted R2 ......................................................................................................................... 44
Relative importance ............................................................................................................ 44
Cluster model ..................................................................................................................... 45
Multinomial logit model ..................................................................................................... 46
3. Results and discussion ............................................................................................................ 47
3.1 Focus group discussions .................................................................................................... 47
Flour quality ....................................................................................................................... 47
Dough quality ..................................................................................................................... 48
Bread quality ...................................................................................................................... 50
3.2 Gender roles in wheat production ..................................................................................... 52
3.3 Perceptions and evaluation of existing varieties ............................................................... 56
Demographic statistics ....................................................................................................... 56
Yield statistics ..................................................................................................................... 57
Varieties .............................................................................................................................. 58
Fungicide application ......................................................................................................... 61
Factor analysis ................................................................................................................... 64
3.4 Conjoint analysis ............................................................................................................... 67
Cluster I prefers large grain size ....................................................................................... 72
Sub-Cluster I prefers high yielding, low price wheat seed ................................................. 74
Cluster I Multinomial Logit modeling ................................................................................ 75
Cluster II prefers white grain ............................................................................................. 77
Cluster II Multinomial Logit Model ................................................................................... 79
Sub-cluster III dislikes 650birr price and prefers lax, small, red wheat grain .................. 80
Cluster III has typical preferences ..................................................................................... 81
Cluster III Multinomial Logit Model .................................................................................. 82
Cluster IV prefers rust resistant wheat ............................................................................... 83
Cluster IV Multinomial Logit Model .................................................................................. 84
Cluster V prefers high seed price ....................................................................................... 84
Cluster V Multinomial Logit Model ................................................................................... 85
4. Conclusion ............................................................................................................................... 87

ix
REFERENCES ............................................................................................................................. 92
APPENDICES ............................................................................................................................ 100
Appendix 1 Positioning study survey...................................................................................... 100
Appendix 2 Conjoint survey ................................................................................................... 106
Appendix 3 Examples of conjoint survey cards showing the visual representation of number of
tillers and density of kernels per spike ................................................................ 113
Appendix 4 Images used for the conjoint survey to depict 8, 5, and 2 tillers ......................... 114
Appendix 5 Images used for the conjoint survey to depict lax and dense kernels .................. 115
Appendix 6 Picture of the seed samples shown to respondents during the conjoint survey to
depict seed size and color ................................................................................... 116
Appendix 7 Division of four clusters to nine showing where each cluster splits to form a new
cluster. This can be interpreted as Cluster II (green) that has a strong preference
for white grain and Cluster V (blue) preferring high seed price are comprised of
members that have the strongest similarity in preferences. ................................ 117

x
LIST OF FIGURES
Figure 1 Map of Ethiopia highlighting the study area in the Arsi zone, a major wheat growing
district in the Oromia region .......................................................................................... 26
Figure 2 The Kaiser criterion suggests dropping all factors with eigenvalues less than one ....... 33
Figure 3 The Cattell scree plot test recommends to drop the components where the elbow turns in
the curve ......................................................................................................................... 33
Figure 4 The graph shows color-coded bars that represent the seven clusters (the transparent red
and yellow columns represent the small n sub-clusters that are combined with the
clusters of matching colors for later analysis). The height of each bar represents the
weight of importance that each cluster gives to the different traits. As evidenced by the
graph, there are seven market segments with distinct trait preferences. ........................ 69

xi
LIST OF TABLES
Table 1 Agro-ecological information from the four surveyed districts ........................................ 31
Table 2 Farmers evaluated familiar wheat varieties on 36 trait characteristics ............................ 32
Table 3 Respondent summary of perceived quality traits for different processing phases .......... 51
Table 4 List of tasks related to wheat production ......................................................................... 53
Table 5 Summary of the respondent’s demograhic statistics ........................................................ 57
Table 6 Summary of yield statistics showing the percent of respondents growing more than one
variety, the number of hectares allocated to wheat, and the yield in tonnes per hectare 58
Table 7 Varieties grown by respondents in 2010 and the year the variety was released in Ethiopia
........................................................................................................................................ 60
Table 8 Percent of respondents desiring to grow select varieties in 2011 and the percentage that
were female from that subset ........................................................................................... 61
Table 9 Information on popular fungicides used to treat rust in Ethiopia .................................... 63
Table 10 Summary of respondent fungicide statistics .................................................................. 64
Table 11 Factor loadings from factor analysis reveal the degree to which each of the trait
characteristics contributes to each factor ....................................................................... 67
Table 12 Strength of preference, relative importance, and adjusted R2
for the overall population
and each cluster. The overall population had the strongest preference for the number of
tillers trait with 8 tillers being their preferred level. Each cluster values the individual
traits and levels differently............................................................................................. 68
Table 13 Summary of the average demographics, management, and perceptions for the overall
population and each cluster. The highlighted boxes show which factors differ
significantly from the cluster mean compared to the mean of the overall sample and the
other clusters. ................................................................................................................. 70
Table 14 The percentage of respondents from the overall population and each cluster that have
rated the corresponding trait level as their ‘favorite’. Note the highlighted boxes
revealing the percent of respondents that preferred such trait levels as lax, small, red,
susceptible seed. ............................................................................................................. 71

xii
Table 15 Probability of cluster membership based on the effect of various demographic and
management variables. The dark grey boxes reveal the variables that contribute to
cluster membership within a 10% significance level (p<0.10) and the light grey boxes
highlight variables within a 20% significance level (p<0.20). ...................................... 76

1
1. Introduction
Wheat is one of the world’s most important staple food crops (Curtis, 2002). Wheat sustains
millions of lives and livelihoods, accounting for one-fifth of humanity’s food (CIMMYT, 2011).
Wheat is under threat from virulent strains of the stem rust disease (Singh et al., 2008). Ethiopia
is an ideal place to conduct wheat research because it is one of a few countries where the new
strains of stem rust (frequently referred to as Ug99 rust races) have been found (Singh et al.,
2006). Ethiopia is also one of the poorest nations and is most at risk of a food crisis if a stem rust
epidemic were to occur (World Bank, 2012). Concerted efforts are being made to speed the
breeding process so that susceptible wheat varieties can be replaced by resistant varieties in
farmers’ fields (DRRW, 2010), but adoption of new varieties is slow and sporadic (Bishaw,
2010). Using conjoint analysis methods, I examine farmer preferences for wheat variety traits to
understand the factors that drive adoption of new varieties.
Millions of dollars (Gallo et al., 1996) and countless hours are spent each year in developed
countries on understanding consumer demand and marketing for agricultural products but
relatively fewer funds are funneled into agricultural marketing in a developing country context.
Wheat is a highly varied product that is characterized by many stages of development that all
have different traits. Breeding programs mainly focus on increasing yield, whereas traits like
seed color, end-use quality, and biomass may also be important to farmers (Bishaw, 2010). I use
a ratings-based conjoint analysis method (Green and Srinivasan, 1978) to understand and
characterize groups of farmers that value different traits in wheat. The results presented in this
paper will provide insights into the heterogeneity of wheat trait preferences among small-holder
farmers from the Hetossa district in the central highlands of Ethiopia. This research shows the

2
potential for using conjoint analysis to help guide plant breeding priorities in the development of
farmer-responsive varieties (Baidu-Forson et al., 1997).
1.1 Global importance of wheat
Wheat (Triticum spp.) is one of the world’s most important cereal grains. It is grown on 220
million hectares (Singh and Trethowan, 2007) constituting 15.4 percent of the world’s arable
land (more land area than any other crop) and it is grown in almost all countries and climates
(FAOSTAT 2009; Curtis, 2002). It is the staple food for 4.5 billion people in over 94 developing
countries worldwide (Braun et al., 2010). Wheat provides nearly 55 percent of carbohydrates and
more than 20 percent of the calories and protein consumed globally (Bushuk, 1998). Wheat has
the highest content of protein of all the staple foods and contains essential minerals, vitamins,
and lipids. It is the primary source of protein in developing countries, with 1.2 billion people
dependent on wheat for survival (CIMMYT, 2011). It has been projected that the demand for
wheat in the developing world will increase 60 percent by 2050 (CIMMYT, 2011), which is a
sobering forecast considering global wheat yields have remained constant for more than a
decade. Millions of people’s livelihoods in the developing world are, and will continue to be,
threatened by insufficient wheat production coupled with climate-change induced yield
reduction, global wheat price spikes, increasing costs of inputs, and virulent new strains of
diseases and pests. And, while developing countries are at the greatest risk of food shortages,
they also have the most potential for increased production.

3
Food security and wheat dependence
World wheat production increased dramatically from 1951-1990, mainly due to an increase in
grain yield per hectare rather than an increase in production area (Curtis, 2002). Consumption
worldwide has also increased rapidly since the early 1960’s. Wheat consumption in developing
countries rose 35 percent during the period 1963-1976 (Curtis, 2002). Due to the increases in
wheat production from the high-yielding, disease resistant, semi-dwarf varieties of the Green
Revolution, poverty and hunger were dramatically reduced. Gains in wheat production have
since leveled off, and many developing countries still produce well below their potential. The
world population growth rate from 1993 to 2000 was 1.5 percent, while the growth rate of wheat
production from 1985 to 1995 was 0.9 percent (Curtis, 2002). In many countries in South East
Asia and Sub-Saharan Africa, the population growth rate is significantly higher, between two to
four percent. As population growth continues to surpass the growth of wheat production, there
will be serious food shortages for future generations. In addition, where developing countries
already lag in wheat production, climate-change scientists estimate increased temperatures that
are likely to reduce wheat production by 20-30 percent (CIMMYT, 2011). Developing countries
will suffer the greatest impact of climate change and food insecurity with a world population
expected to reach 9 billion by the year 2050, or roughly a 35 percent increase. This population
increase will mostly come from rapid growth of developing countries in tropical regions that
even now cannot produce sufficient food.
1.2 Gender and development
A large majority of smallholder farmers and food producers in Asia and Africa are women
(FAO, 1995). Smallholder farmers, especially poor women, will be at greatest risk of food

4
insecurity and are extremely important to the future of food stability in developing nations
(McCarney, 1991). Women in developing countries often have less access to resources and
education, less decision-making power, and more responsibilities given their dual reproduction
and production roles (BMGF, 2008). For these same reasons, it is critical to engage women in
research agendas and to design for women when planning agricultural development projects. The
importance of men, boys, and girls is not to be diminished by the inclusion of women but, rather,
all members of the family unit, especially the most vulnerable, should be considered when
designing innovative approaches to development challenges (BMGF, 2008). Improving equity
for women must involve the inclusion of men or else development programs have the potential
of exacerbating inequity and marginalizing women from their communities. And vice versa,
development programs that do not engage women may result in interventions that create more
work and burden on female family members (Feldstein, 1994). Designing projects to be gender-
responsive and gender-sensitive is a more effective approach to livelihood improvement that
extends beyond simply increasing yields to consider improved access to resources, decreased
labor demands on women and girls, and better familial nutrition. Here, I use the definition of
gender-sensitivity as “recognizing the differences, inequalities, and specific needs of women and
men and acting on this awareness” (FMWC, 2002). Defining the term ‘gender-responsive’ is key
to being able to understand and achieve the project design objectives. According to the FAO
(1999), gender-responsive agricultural planning responds to the different priorities of diverse
groups of farmers where these differences are based on gender and other socio-economic factors.
Because women and men farmers have taken an active part in planning agricultural development
activities the development planners are aware of these differences and of how best to respond to

5
them. The process involves a commitment from both farmers and planners to carry-out the
activities together (FAO, 1999).
The greatest potential for improvement of wheat production is in developing countries where
mean yields are well below the global average (CIMMYT, 2011). Increasing production and
decreasing losses through the adoption of high-yielding, disease-resistant varieties and improved
management practices is key to stabilizing food security in developing countries. In order to
design innovations and make recommendations for improved management practices, we must
first understand local farming practices and gender roles in farming. These recommendations
may then have the potential to increase the efficiency of current production practices while
minimizing soil degradation, natural resource depletion, and labor demands (Feldstein & Jiggins,
1994).
Farmers grow varieties that are trusted in their area, perform well under their specific conditions
and management, and satisfy their end-use needs (Pena et al., 2002). If a variety does not meet
these criteria, a farmer is unlikely to adopt it (Negatu and Parikh, 1999; Dahl et al., 2001). The
acceptability of a variety could vary significantly depending on the location of the farmer, socio-
economic status, end-use goals, gender, etc. Therefore, it is unlikely that there is one “super”
variety that all farmers will adopt (and this would be undesirable for plant breeders as well). The
length of time for a variety to become “widely adopted” can take 15 to 20 years and few varieties
ever get there (Ceccarelli, 2012). This could be partially attributed to a breeding process that
does not account for usage versatility1 or variety performance under suboptimal soil and
management conditions, which are the reality for the vast majority of small-holder farmers.
1CIMMYT breeding programs test for quality based on protein levels usig the principle that higher protein results in higher loaf volume (Bushuk 1998). But there are many uses for wheat and large loaf volume is not always a desired characteristic (ie. flat breads, injera, etc).

6
Wheat breeding programs that target developing countries must consider the multiplicity of
constraints and utilization so new varieties will meet the needs of more farmers.
1.3 Constraints to production – wheat rust diseases
Wheat plants are subject to a variety of biotic and abiotic stresses including: diseases (fungal,
bacterial, and viral); pests (insects, weeds, nematodes, birds, and mammals); and environmental
stresses including drought, flooding, extreme temperature, poor soil fertility (i.e. nutrient
availability, pH, toxicity, and salinity). The fungal wheat rust diseases, leaf rust (Puccinia
recondita), yellow/stripe rust (Puccinia striiformis) and stem rust (Puccinia graminis tritici),
pose a serious and constant threat to wheat production and cause major annual losses around the
world (Singh et al., 2006). Fields infected with rust disease produce millions of spores that are
carried by wind to infect other fields. Rust diseases are difficult to control and breeding for rust
resistant varieties proves to be the most effective measure of control. According to wheat rust
expert Ravi Singh (2010), approximately 100 million hectares (almost half of global wheat
production) are highly susceptible to leaf rust and yellow/stripe rust causing major annual losses
during rust epidemics.
Yellow/stripe rust is the most widespread and common of the rust diseases. Crops infected with
yellow rust can suffer yield losses between 10 to 70 percent depending on the susceptibility of
the cultivar, earliness of the initial infection, rate of disease development and duration of the
disease (Chen, 2005). The most lethal type of rust, however, is stem rust, which often causes 100
percent losses (Park et al., 2007). Even an epidemic of yellow/stripe rust would fail to destroy a
crop with the same “killing power” of stem rust (Biffen, 1931). Stem rust was once the most
feared disease of wheat because it could decimate a healthy looking crop just weeks before

7
harvest leaving nothing but broken stems and shriveled grains. During the North American
epidemic in 1953-54, up to 35 percent of the spring wheat crop and 80 percent of the durum
wheat was lost from a stem rust outbreak (Stakman and Harrar, 1957). The near complete
annihilation of durum wheat in two consecutive years demonstrated that stem rust could become
pandemic in years when environmental conditions favor rust development and cultivars are
susceptible (Stakman and Harrar, 1957). Soon after this epidemic, millions of dollars flooded
into international wheat research to develop wheat varieties that were resistant to stem rust
(Dubin and Brennan, 2009). This thrust of research resulted in the high-yielding, semi-dwarf,
rust-resistant varieties of the Green Revolution that helped to increase yields and reduce global
poverty and hunger in the 1960’s. This stem rust resistance prevailed for 40 years (DRRW,
2010). The disease was thought to be eradicated which resulted in years of scientific
complacency on stem rust research and a lack of funding for stem rust research during this time
(McIntosh & Pretorius, 2011). But, as Norman Borlaug (2008) commented, stem rust never
sleeps. A virulent new strain of stem rust disease appeared in Uganda in 1999 (Pretorius et al.,
2000). This strain, aptly named Ug99, was able to infect previously resistant wheat varieties
carrying the widely used stem rust resistance gene Sr31. By 2004 the fungus had spread to fields
in Kenya and Ethiopia and was continuing to spread east, now reaching as far east as Iran and as
far south as South Africa (Singh et al., 2011). Up to 90 percent of the world’s commercial wheat
varieties in production today are susceptible to the Ug99 lineage of stem rust and billions of
people could suffer food shortages if another epidemic occurs (Singh et al., 2011).

8
1.4 Durable Rust Resistance in Wheat project
In 2008, the Bill & Melinda Gates Foundation awarded Cornell University a three year grant for
the Durable Rust Resistance in Wheat (DRRW) project, and a five year grant was awarded in
2011. The objectives are to mitigate the threat of virulent stem rust races through pathogen
surveillance activities and breeding initiatives so that susceptible varieties will be replaced with
durably resistant wheat varieties (DRRW, 2010). The project is an international collaboration
between 23 research institutions and scientists and farmers from over 40 countries. Wheat
varieties that are developed under the project carry resistance for yellow rust and stem rust using
traditional plant breeding techniques.
The goal of replacing susceptible varieties with durably resistant varieties will not be achieved
simply through breeding efforts but must also include improvements to the current seed
multiplication and dissemination pathways in developing countries. As with any product, it is
important to understand the target market because farmer perceptions contribute heavily to the
adoption of new varieties (Bishaw, 2010). It is common for farmers from developing countries to
save seed and plant the same variety of wheat for more than 20 years because changing to a new
variety may seem risky to them (Ceccarelli, 2012). Additionally, farmer management practices
and end-uses may differ considerably within a small area or between socio-economic groups in
the same area. Furthermore, different varieties will respond better in certain environments and
the quality of a product depends heavily upon the characteristics of the variety. The adoption of
new varieties of wheat depends on what farmers look for to satisfy their grain yield expectations,
their quality needs, and the market demand (Pena, 2002).

9
There is considerable variation within wheat cultivars and the reason wheat is widely accepted
throughout the world across different cultures is because of its agronomic adaptability,
variability in end-use products, and storage capability. Given the wide-range of uses and growing
conditions, recommendations for varieties should be context specific rather than one-size-fits-all
solutions. It is imperative to understand local farming practices, constraints to production, and
utilization to create varieties that are appropriate for the agronomic practices, environmental
conditions, and end-use purposes of the target group.
1.5 Wheat adaptability and variability
Agronomic adaptability
Wheat has been cultivated for thousands of years and is widely claimed to be one of the key
factors that enabled the emergence of city-based societies. People were able to settle due to its
wide adaptability and the fact that wheat can be easily and safely stored for long periods of time.
In addition, wheat requires minimal processing for consumption and is easily transported. Wheat
can grow over a wide range of elevations, climatic conditions, and soil fertility conditions
(Nuttonson, 1955). Wheat cultivation is most successful between the latitudes of 30° and 60°N
and 27° and 40°S but it can be grown from the Arctic Circle to high elevations near the equator
(up to 3000 masl) (Nuttonson, 1955). Even though the optimal growing temperature is 25°C, it
can be grown in temperatures ranging from 3°C to 32°C (Briggle, 1980). The optimal rainfall for
wheat is between 900-1100 mm throughout the growing season, but wheat can be grown in
xerophytic to littoral moisture regimes with average annual rainfall between 250 to 1750 mm
(Leonard and Martin, 1963).

10
Wild types, landraces, improved varieties, and certified seed are all grown in varied conditions
and exhibit wide trait variations. Wheat can be classified as either winter wheat or spring wheat.
Winter wheat is grown in temperate climates and requires a vernalization period where young
plants remain dormant throughout the winter (0°-5°C) before flowering in the spring. Spring
wheat is planted in the spring and generally matures by late summer, to early autumn. The length
of time to maturity is wide, ranging from three months to possibly more than 8 months.
Variability in end-use quality
Wheat flour can be used to make many different types of products with a range of uses, textures,
and flavors. Wheat is unique in its ability to form leavened bread due to the viscoelastic
properties of gluten (Bushuk, 1998). The gluten helps to trap carbon dioxide into bubbles that are
formed during fermentation, which in turn causes dough to rise. Many different products can be
made from wheat flour including leavened breads, flat breads, pasta, cakes, cookies, crackers,
and pastries. In addition, the grains can be eaten whole if boiled or roasted or mashed into
porridge and they can be fermented to make alcohol. Other parts of the wheat plant are used as
animal fodder, fuel for cooking, construction material for roofing thatch, bed stuffing, and other
household utilities. Different varieties of wheat grain are characterized by varying levels of
kernel hardness, protein content, and visco-elasticity that affect the quality of the end-use
product (Pena, 2002). These large differences in grain composition and processing quality among
wheat cultivars mean that one cultivar that is suitable to prepare one type of food may not be
suitable to prepare a different one. For instance, very hard, light-colored, translucent grains are
superior for making noodles, whereas dark, hard, high-protein wheat is best for making leavened
bread products, and soft, light-colored, very low protein wheat is preferred for crackers and

11
pastries (Pena, 2002). The type of cultivar has a strong influence on the characteristics, taste, and
appearance of wheat products as well as the marketability of the grain (Pena, 2002).
Wheat breeding programs tend to focus on increasing yields, often at the expense of other valued
traits (Araus et al., 2008). Smallholder farmers in developing countries use wheat for many
purposes and their preferences for traits may differ depending on the end-use. It is common for a
smallholder farmer to grow several varieties of wheat for different purposes (Di Falco et al.,
2006). They may grow one variety that is low yielding and susceptible to lodging, because the
bread quality is excellent and the lengthy stalks are superior for use as roofing material. Another
variety may be high-yielding but mediocre quality that they sell as a cash crop and yet another
variety that is highly susceptible to disease but has large grains ideal for making a traditional
dish. It is important that plant breeders understand the complex trade-offs that farmers make
among traits. This will provide insight into traits that may be valued by farmers so these traits
can then be promoted to the next generation during the breeding process.
1.6 Ethiopia
Ethiopia is considered one of the world’s poorest countries ranking 169th
out of 181 countries
(World Bank, 2012). Its economy is heavily reliant on agriculture, which results in severe food
shortages during crop disease outbreaks and periods of severe drought. The majority of Ethiopian
farmers are resource-poor, small-holder farmers that depend on staple crops for subsistence and
as a source of income when they have a marketable surplus. Ethiopia ranks second in sub-
Saharan Africa in total wheat area and production. The Ethiopian highlands are considered a
center of diversity for wheat and it has been cultivated in this region for several millennia with
little change in farm implements and farming practices among small-holder farmers. Wheat is

12
mainly cultivated in the southeastern, central, and northwestern highlands at altitudes ranging
from 1500-2800masl primarily under rain-fed conditions.
Wheat is one of the most important cereal crops cultivated in the country (Bayeh, 2010). Wheat
production ranks fourth in area coverage surpassed only by Teff (Eragrostis tef), Maize (Zea
mays), and Sorghum (Sorghum bicolor) and it is the third largest crop in total production (CSA,
2011). The national average of wheat production is 1.74 t/ha (CSA, 2011) which is 24% of the
African average and 58% of the global average (FAO, 2009). The relatively low mean yield may
be partially attributed to the low level of adoption of improved varieties and improved
management techniques (Kotu et al., 2000). Ethiopia imports more wheat than any other crop at
1.74 million tons annually (FAOSTAT, 2009) and consumption is increasing much faster than
production with an annual population growth rate of three percent (CIA World Factbook, 2012).
Ethiopian farmers have little capacity to rebound from unpredictable events such as the
prolonged droughts of 2011, or the yellow rust epidemic of 2010. Increasing wheat production is
important to the economic stability and food security of Ethiopia.
There are three broad categories of wheat producers in Ethiopia: 1) small-scale farmers, 2) state
farms, and 3) producer cooperatives. Small-scale farmers are responsible for 76 percent of total
wheat production (Bayene, 1989). They comprise the largest wheat area, have the lowest yields
and have the least capacity to withstand unexpected events.
Constraints to production in Ethiopia
Ethiopian farmers face a number of constraints to production including biotic and abiotic
stresses. These constraints differ depending on the area but farmers may face drought, flooding,

13
poor soil conditions, severe weed competition, and the infestation of diseases and pests. In
addition to these agro-ecological constraints, small-holder farmers lack access to modern
equipment, sources for improved seed, and affordable inputs.
Of the biotic factors, the most detrimental are the wheat rust diseases, particularly yellow/stripe
rust and stem rust. Less than ten percent of wheat currently grown in Ethiopia is resistant to
yellow/stripe or stem rust, therefore, the adaptation and adoption of new wheat varieties is
crucial to the future of food security in Ethiopia (Singh et al., 2006). Average losses to yellow
rust amount to approximately 20 percent and, during an epidemic year, such as 2010, losses can
amount to 70-80 percent in untreated or late-treated fields (personal communication with Bedada
Girma, Principal Scientist for DRRW project in Ethiopia, June 2011). The epidemic in 2010 can
be attributed to favorable climatic conditions that allowed for early infection and sustained the
disease throughout the growing season. Farmers were not prepared for the infestation and there
were limited supplies of fungicide to combat the disease. Farmers experienced significant crop
losses and subsequent loss of household food and income (ICARDA, 2011).
In addition to yellow rust, the ability of Ethiopian farmers to meet current and future demands
for wheat production is threatened by the virulent Ug99 stem rust lineage. This strain of stem
rust was first found in Ethiopia in 2004. The majority of bread wheat varieties grown in Ethiopia
are susceptible to the Ug99 strain of stem rust and small-scale farmers do not have the ability to
combat a stem rust outbreak with fungicides alone, as proven by the yellow rust epidemic.
Fungicide is expensive and there is not enough supply in Ethiopia for farmers to have access to
apply in a timely manner. The effect of stem rust is far more destructive than yellow rust.
Genetic resistance is the safest and best control strategy for resource-poor farmers in addition to
14
being the most environmentally friendly and profitable option for farmers that can multiply seed
(DRRW, 2010). In Ethiopia, the cost to treat one hectare with fungicide ranges from $30-$80
USD annually (personal communication with farmers, June 2011) whereas rust-resistant varieties
have little additional cost and may be more profitable for farmers.2 In addition, the rust-resistant
varieties will protect crops from both yellow/stripe rust and stem rust throughout the growing
period. Even in the absence of a stem rust outbreak, farmers should see an average yield increase
of around 20 percent from protection against typical yellow rust occurrence.
Since the appearance of Ug99, the Ethiopian Crop Variety Register has released approximately
28 resistant varieties but only a few rust-resistant wheat varieties are being planted by a small
percentage of farmers (DRRW, 2010). Ethiopia releases more varieties of wheat each year than
most other African nations, yet new varieties are seldom adopted (Mekbib, 1997; Bishaw, 2004).
Although many varieties of improved seed have been released in Ethiopia, the average use of
rust-resistant wheat seed is only about four percent (CSA, 2008). Many more farmers will need
to adopt rust-resistant varieties in order to withstand future rust outbreaks in Ethiopia. One
variety, Digelu, accounts for about half of the resistant seed that is grown in Ethiopia and another
four varieties account for the other 50 percent (DRRW, 2010). Many rust-resistant varieties are
released that are never adopted because there is no demand for them, while a few rust-resistant
varieties are in high demand but cannot be multiplied and disseminated efficiently by the current
seed production system. The low adoption rates can be attributed to many factors including the
inefficient seed production and delivery system, a shortage of farmer acceptable varieties, and
the lack of a system for raising awareness about the existence and benefits of new varieties.
2 The initial cost of the seed may be up to $11-$12/100kg higher than the cost of non-resistant seed depending on the market demand. However,
this is not an annual expense because farmers can save seed from year to year and make a significant profit by selling rust-resistant seed to other
farmers at a higher price (100kg of new seed would yield 30-45 times that amount), however, access to this seed is severely limited by the
complex distribution system.

15
Many studies have looked at seed production issues and seed sources (Bishaw, 2010; Ensermu et
al. 1998; Negatu & Parikh, 1999; Kotu et al., 2000; Negatu, Mwangi and Tesemma, 1992;
Alemayehu, 1999; Agidie et al., 2000) but relatively little research exists on farmer acceptability
of new varieties. In order to be acceptable, the varieties must be agronomically suitable,
marketable, and appropriate for quality and usage needs. In the past, wheat breeding programs
focused primarily on increasing grain yield, possibly at the expense of other traits that may be
important to farmers (i.e. protein amount, grain color, or plant biomass for animal fodder,
roofing material, etc.). There is increasing recognition within breeding programs of the
importance of gender differences in farmer preference, although relatively little research exists in
this area (CIMMYT, 2010). This is the motivation to conduct a study to understand men’s and
women’s preferences for different wheat traits and the inherent trade-offs that farmer’s make
among individual traits in their decision to grow a new variety.
Influence of gender on adoption
Since 1961, the increased opportunity cost of women’s time in sub-Saharan Africa (SSA) has led
to a 167 percent increase in consumption of easy-to-prepare staples such as wheat (Kennedy and
Reardon, 1994). Yet the much smaller increase in grain production over the same period required
imports to meet demand. There is significant potential to increase production on small-scale
farms with improved technology such as disease resistant varieties, soil fertility management,
and weed control. But, without addressing gender specific constraints and preferences, the full
potential may never be reached (Klawitter et al., 2009).
Gender is thought to influence varietal acceptance (Klawitter et al., 2009), and therefore it is
critical to analyze men’s and women’s perceived values of both pre- and post-harvest traits in

16
wheat varieties. Post-harvest and cooking characteristics are rarely evaluated in breeding projects
even though they are known to be important to women. A recent study by Sperling (2010) notes
that in order to reach women and the poor with plant breeding projects, an emphasis is needed on
the performance of cultivars in intercropped systems, the importance of end-use products as food
for humans and fodder for animals, the earliness of production, labor demand characteristics,
post-harvest processing concerns, and culinary dimensions.
Ethiopian women do not have equal access to land, credit, agricultural resources, technology, or
agricultural extension services (Frank 1999). This disparity hinders women’s ability to benefit
equally from farming activities. Furthermore, although women have an active role in wheat
production and processing, they are often not considered “farmers” within cultural perceptions
and the social framework in Ethiopia (Frank, 1999). It should be noted that concerted efforts
have been made in the past decade to focus policy more on gender within the agricultural system,
but access to resources and participation in extension activities still remain a major constraint to
gender equity. Despite the large contribution to farming activities by women, many communities
still do not consider women to be farmers (Frank 1999). Rural communities define the term
“farmer” as someone who can independently perform the activities of plowing and sowing.
Although women participate in many physically demanding activities, plowing is considered to
be a man’s activity that is too difficult and inappropriate for women. The ownership of oxen, for
example, is considered essential to farm effectively and women rarely own the oxen and do not
have the same access to other agricultural resources. Even in circumstances where they do own
oxen (i.e. if their husband died), it is not culturally acceptable for them to engage in plowing
activities. Therefore, women are not considered to be farmers or at best are thought of as weak
farmers. In rare circumstances, female heads of households have been known to plow their fields

17
so perhaps the perceived inability of women to plow is based more on cultural perception than on
actual physical inability. The cultural expectation that women cannot or should not plow could
be seen as a measure to limit women’s control of assets. According to Masefield (1998), male
farmers refuse to consider women as farmers because men feel that if women were provided the
same access to land and other resources as male-headed households, they would then engage in
repeated marriages without care and the entire socio-economic fabric of society would be
destroyed.
Women also have less ability to purchase inputs and improved seed because they do not have
control over assets such as land and oxen to serve as collateral for credit. The effect of this
disparity on adoption of agricultural technologies is evident in the central highlands of Ethiopia
where 30 percent of male-headed households (MHH) adopted improved varieties compared to
only 14 percent of female-headed households (FHH) (Tiruneh et al., 2001).
Women (both as farmers and development agents) are underrepresented in the current
agricultural extension system in Ethiopia. When women farmers are included in extension
activities, they are mostly female head of household (FHH). Although it is important to include
women from FHH, a comparison of only FHH and MHH provides limited insights about broader
gender structures because it ignores the majority of women that live and farm in MHH (Doss,
1999). The current extension system rarely targets women in MHH although these women often
participate equally in wheat farming activities and decision-making processes. In fact, when the
entire wheat production process is analyzed, women may even contribute more to wheat
production than men. This is due to the sole involvement of women in most post-harvest
activities, such as processing for food preparation and seed cleaning, in addition to their

18
involvement in wheat farming activities. Also, women from both FHH and MHH may face
different constraints due to differences in the household’s access to resources. For instance,
women from FHH may have more decision-making power than women in MHH, but less access
to land as collateral, resulting in lower comparable household access to credit and inputs than the
female members in a MHH.
Because gender is thought to be an important factor affecting the perceptions of wheat traits and
subsequent adoption of wheat varieties, examining only the gender of the head of household
summarizes just one component of the many gender-linked barriers to technology adoption
(Doss, 1999). Men and women often have different responsibilities in regards to farming, family
nutrition, and off-farm income, which may result in differing preferences for traits in wheat
varieties. The end-use purpose of the crop may also influence varietal trait preference. For these
reasons, it is important to examine not only the gender of farmers but also management and
usage factors.
Gender in development
The length of time from developing and releasing a variety to wide-scale adoption of a variety
averages 15 to 20 years but this timeframe can be reduced through participatory breeding
measures, varietal selection, and gender analysis (Lilja and Dixon 2008). Agricultural initiatives
aimed at the adoption of improved varieties can be more targeted and responsive to the needs of
women by understanding their preferences and constraints, thereby creating demand-based
products that suit the needs of the target audience to improve variety adoption and wheat yields.
The documentation of men’s and women’s preferences enables breeders to set priorities that
incorporate gender preferences and usage criteria into their breeding process. The result of such

19
breeding measures should produce varieties that can be targeted to specific segments of the
population such as subsistence farmers, women farmers, or market-oriented farmers.
1.7 Objectives
The main objectives were to understand gender roles in wheat production in the central highlands
of Ethiopia, to define important pre- and post-harvest characteristics of wheat (both negative and
positive), to calculate the weighted preference that men and women farmers have for specific
traits, and to characterize membership in preference segments based on similar demographic and
management statistics. All of this information in combination may be useful in understanding the
factors that influence the adoption of new wheat varieties. The research was carried out in
collaboration with the Durable Rust Resistance in Wheat (DRRW) project, the Ethiopian
Institute of Agricultural Research (EIAR), and the Kulumsa Agricultural Research Center
(KARC). The study uses focus group discussions and semi-structured interviews to inform the
field survey questions and the conjoint analysis survey.
The specific objectives were to:
Understand the roles of men and women in all stages of wheat production including the
decision-process of growing a new variety, purchasing/trading/recycling varieties, seed
preparation, land preparation, planting, weeding, harvesting, threshing, processing,
storing seed, transporting, and selling;
Ask farmers to score familiar varieties based on their opinion of how well they perform
in the different stages of production;
Identify subjective properties of wheat quality during different bread processing stages
(milling, kneading, leavening, cooking) that are perceived as positive or negative and
why;
Document farmer perception of a combination of wheat traits to determine the individual
value that each trait has on the product as a whole;

20
Identify segments of farmers that have similar preferences;
Categorize membership in the preference segments based on demographic and
management information;
Without research to understand farmer preferences, it is possible that new varieties of wheat may
not meet farmer standards and adoption rates will remain low. As a result, wheat yields will
continue to produce well below their potential and food security in Ethiopia will continue to be
an issue.
2. Materials and methods
2.1 Gender-responsive study design
Many Ethiopian farmers will simultaneously grow several varieties for different purposes (cash
crop vs. household consumption for specific traditional dishes vs. roofing material). It is
necessary to include women (both HH and not) in preference studies because the differences in
household activities and utilities may lead to important insights about the perceptions of wheat
traits related to gender, utility, socio-economic status, decision-making authority, and
constraints. Therefore, it is important to implement gender-responsive research designs to
understand these factors.
Training on gender-sensitive research
The first step in planning this research was to conduct a training program on gender-sensitive
research practices for the researchers at the Kulumsa Agricultural Research Center (KARC).
Yeshi Chiche, the gender specialist from the Ethiopian Institute of Agricultural Research
(EIAR), conducted a three-day workshop at KARC from March 28-29, 2011. Participants of the

21
workshop included 11 researchers from KARC: wheat breeders, agronomists, soil/water
scientists and socio-economists; and 14 agricultural extension agents from the Ministry of
Agriculture (MOA) in Hetossa and Tiyo woredas (districts). The objective of the training was to
equip participants with knowledge and tools in gender analysis. Gender analysis is defined as
examining the differences in women’s and men’s lives, including those which lead to social and
economic inequality for women, with the view of applying this understanding to policy
development in order to address inequalities and power differences between males and females
(CRS, 2010).
The major areas of training were:
Concepts of gender
Relevance of gender to agricultural research
Gender as a development component
Methods of gender analysis and participatory data collection
Gender-sensitive research design
The participants came away with a core understanding of terminology and gender related issues.
They learned practical methods to perform gender analysis relating to agriculture and the
household economy. Several activities were initiated to raise awareness about gender issues and
dynamics. Participants introduced themselves using symbolic illustration to understand how men
and women view themselves based on cultural influences. These descriptions were then used as
an example of how societal expectations contribute to norms, values, and cultural influences and
how these can change over time or under different socio-economic circumstances. The
participants had an opportunity to learn from each other through examples that were grounded in

22
personal experiences. A main component of the training involved field-simulated problem
solving based on realistic examples. Participants brainstormed solutions for contexts they might
face while conducting the gender research for the DRRW project. A PowerPoint presentation,
prepared in English, was used for defining concepts, while the local language (Amharic) was
used for explanation and discussion. Exercises included brainstorming sessions, household
mapping exercises, and time allocation charts. Some factors that influenced the particular
approach used included the short duration of the training and limited prior knowledge of gender
concepts and gender analysis tools.
Study design
In designing a gender-responsive study, it is critical to recognize the social and cultural
constraints faced by women so the study can accommodate their schedules and address any
limitations on their time. Several studies have shown that the adoption of improved technologies
and participation in extension activities can have a negative impact on women’s labor demands
(Doss, 1999; Tiruneh et al., 2001). This is not a reason to stop including women in extension
activities but, rather, it is proof that simply including women is not equivalent to designing
agricultural innovations and interventions for women with their needs and labor demands in
mind.
Women have valuable and varied perceptions of wheat production and processing based on their
roles and responsibilities in wheat farming and cooking. The results of a perception study would
be incomplete without the perspective of women. They contribute to decision-making processes
and influence the household choices of which varieties to grow. Highlighting the preferences of

23
both men and women (from FHH and MHH) will provide better insight into the development of
acceptable varieties.
Due to the perception of wheat as a cash crop it is typically thought that women in Ethiopia play
a minor role in wheat production, but women are in fact closely involved in almost every step. In
the design of the gender-responsive study of wheat trait preferences, we conducted in-depth
interviews, focus group discussions, and surveys with women and men farmers. These
discussions were used to characterize and partition their activities allocated to the wheat farming
enterprise, to understand how men’s and women’s respective relationships to production and
assets affect pre- and post-harvest preferences for various traits in wheat, and to understand the
value of individual wheat traits in farmer decision making processes.
In considering women’s time, labor, and cultural constraints during the design of the study, the
following guidelines were instituted:
1) Schedule interviews with women and men on separate days or time frames;
2) Invite women to bring their children;
3) Arrange activities in the morning when women were relatively less busy;
4) Schedule meeting locations that were convenient for respondents;
5) Include both female head of households and women in male headed homes;
6) Whenever possible, use women researchers to interview women farmers but when this is
not possible, use men researchers who have been trained in gender-sensitive research
practices

24
All participants in the conjoint study were compensated for their time and information at
105ETB ($6 USD). We felt it important to compensate respondents to show that we value their
knowledge, perspective, time, and cooperation. The amount of compensation was recommended
by Dr. Bedada Girma, principal scientist for the DRRW project in Ethiopia.
It is important to establish separate interview times for men and women because often when they
are interviewed during the same time, men will directly answer for women or influence their
answers. Since many of the questions pertain to the respondent’s perception of a variety, it is
critical that the respondent be able to answer based on their own preferences and not be
influenced by others. When women are interviewed separately from men, they are able to speak
openly about their opinions and roles in decision-making processes and farming activities.
Interviewing men and women separately also gave women full control over their compensation.
If they were interviewed with male family members, they may not have been able to keep the
payment for their services.
During our initial planning of the research activities, it became evident that the most convenient
time to interview women was during the morning so they could attend to their daily activities in
the afternoon. For this reason, we scheduled morning meetings with women farmers so as to
have the least impact on their schedules. In a few circumstances, the women were only available
in the afternoon so we rearranged the schedule to fit their time.
In addition, we tried to reduce the travel time for women and men by arranging several locations
within one village where we conducted interviews so that we reduced bias of including only
farmers that were located close to the agricultural extension station. This also allowed us to

25
travel to areas where women were already gathered for other purposes (i.e. training) so we did
not add burden to them.
The purpose for employing both qualitative and quantitative research methods was to gain a
better understanding of the context of Ethiopian wheat farmers and gender-roles through
structured and unstructured methods of inquiry, and to be able to create preference models that
help explain and predict farmer behavior so this information can be used to inform breeding
criteria and variety release procedures. Qualitative interviews and focus group discussions
allowed for the potential of many new and interesting directions of inquiry to arise that would be
lost in the confines of a highly structured survey alone. Given that this research was positioned
as gender-responsive, it was important to include women in all phases of inquiry and document
their preferences for agronomic and quality traits as well as the perspectives that women hold on
their ability to make decisions, and an understanding of their situation from their point of view.
The study consisted of two periods of data collection. Forty men and women farmers were
surveyed on their perception of current varieties during a six week period from May to June
2011. Out of this group, 23 farmers participated in open-ended interviews about gender roles.
The second period of data collection occurred during a six week period from December 2011 to
January 2012 where 305 farmers were surveyed using conjoint analysis techniques (Green &
Srinivasan, 1978).
The first period of data collection from May to June 2011 was conducted just before the wheat
planting season. Four major wheat growing districts (woredas) were selected from the Arsi zone
of the Oromia region (see Figure 1 for a map). This region was chosen because it is a main wheat
growing region in Ethiopia characterized by a range of different agro-ecological conditions

26
within a short distance. In addition, there are several national agricultural centers in the area that
specialize in wheat production and collaborate with the DRRW project.
Figure 1 Map of Ethiopia highlighting the study area in the Arsi zone, a major wheat growing
district in the Oromia region
2.2 Focus group discussions
Focus group discussions are a semi-structured method of qualitative data collection in which a
purposively selected group of participants gather to discuss their opinion or perception on a topic
or product that is presented by the researcher (Kumar, 1987). This method is often used in
market research to evaluate consumer perception of a product before it is released. These
discussions take advantage of the dynamic interaction between members in a group setting to
generate insights and information that would be less accessible without the group interaction.
Focus group discussions were used to identify wheat quality characteristics for food preparation
including milling, flour, dough, leavening, cooking, taste, and storage quality.

27
I conducted two sessions of focus group discussions on wheat quality characteristics. During the
first session, eight women from Hetossa district gathered in a local home and were asked to
descriptively evaluate seven different wheat samples from the milling stage through to the
quality of the bread. The samples included three distinct varieties – Kubsa, Millennium, and
Huluko – and four mixed flours from two different mills – the ‘First’ and ‘Third’ grade flour
from Asela mill and ‘Special’ and ‘Abroad’ flour from Gonde mill. The mill flours were a
mixture of ‘soft white’ and ‘hard red’ wheat varieties that were combined to make an all-purpose
flour. Each sample name or variety was undisclosed and labeled only with a number so the
participants were not aware of the particular varieties or mixed flours that we were asking them
to evaluate. It was important that the samples remain anonymous throughout the exercise as
people’s perceptions of a product are influenced by many factors that may not be intrinsic
characteristics of the product but instead could be influenced by reputation, marketing, price, or
physical appearance, none of which may actually be attributable to the superior quality of the
product.
The women were asked to describe the milling quality based on the color and vitreousness
(kernel hardness) of the grain, and the flour volume per unit of grain. The next group discussion
involved transferring 200 grams of flour from each sample into separate mixing bowls and the
women evaluated the flour based on color, texture, smell, and perceived protein content (higher
or lower relative to each other). Then the women mixed water and yeast with the flour and hand
kneaded while assessing the quality of dough in relation to the water absorption capacity,
elasticity, stickiness, texture, color, and leavening. The dough was allowed to rise for three hours
before it was wrapped in banana leaves, and baked in the traditional Ethiopian style on a clay
plate over an open fire to make a local bread called ‘diffo dabo’. Finally, the women evaluated

28
the bread quality based on the traits of color, weight, texture, pore size, leavening, hardness,
crumbliness, smell, and taste.
Some factors that influenced the study included language barriers in translating descriptive
words (some description may have been lost in translation if words did not exist in one language
or could not be translated into English). Additionally, the samples being compared were not
equivalent because the single distinct varieties were milled with their bran on and the milled
samples had the bran removed and were a mix of hard and soft wheat. So, there were many
variables that could affect preference. I accounted for the latter problem during the second
session by minimizing the number of variables so the varieties being compared were all distinct
single varieties that were treated the same from grain to milling to bread.
The second session of focus group discussions took place at the kitchen of the Kulumsa
Agricultural Research Center with nine women and three men. Four of the women were cooks in
the kitchen and the other five women worked at the research station as accountants, agronomists,
and seed specialists. The three men were wheat research scientists at the station. Five distinct
varieties were evaluated during this session: Kakaba, Hogana, Pavon 76, Huluko, and Digelu. All
of these variety samples were prepared in the traditional home-style (as opposed to purchasing
mixed flour from a mill). The grain was soaked in water for several hours and then sun dried for
two days. The dried grains were then placed in a large wooden mortar and pestle and pounded
for 20-30 minutes to remove the germ. Then the women winnowed the grain to separate the
removed germ from the rest of the grain. The samples were then individually milled at a local
mill. Once milled, the participants mixed the flour with water and yeast to make dough. The

29
dough was kneaded by hand and then left for three hours to leaven before cooking in an oven.
The process of evaluating the flour, dough, and bread was the same for both focus groups.
2.3 Perceptions and evaluations of existing varieties
Agricultural marketing strategies are used to move food along the value chain from the farm to
the consumer. These techniques are heavily employed in countries where most consumers
purchase food in supermarkets (i.e., are not the producers of their own food). The market, thus,
responds to consumer preference for products and willingness-to-pay. In a developing country
context, the producers are often also the consumers. When studying the appropriateness of
varieties to meet farmer and consumer needs, these marketing techniques can be adapted to a
developing country context (Baidu-Forson, 1997). Understanding where existing products are
positioned within the market allows for researchers to see where gaps may exist. These gaps
represent the potential for new product development to meet consumer needs. Many varieties of
wheat are currently available in Ethiopia and they may suit different agronomic and culinary
purposes. Ethiopian wheat farmers sell wheat as a cash crop but they are also consumers and
purchasers of wheat so it is important to understand their perceptions of the many varieties
available.
Many products can be made from wheat flour including flat breads, leavened breads, crackers,
cakes, cookies, pastries, and pasta. Wheat grains can be boiled, mashed, or roasted and wheat can
also be fermented to make beer. Ethiopians use wheat for a variety of dishes and they also mix
wheat flour with teff, sorghum, and barley flour to make injera (a national dish resembling a
large, thin, pancake). Different varieties of wheat are characterized by varying levels of
vitreousness, protein content, and elasticity that affect the quality of the end-use product (Pena,

30
2002). These large differences in grain composition and processing quality among wheat
cultivars mean that one cultivar that is suitable to prepare one type of food may not be suitable to
prepare a different one. For instance, very hard, light-colored, translucent grains are superior for
making noodles, whereas dark, hard, high-protein wheat is best for making leavened bread
products, and soft, light-colored, very low protein wheat is preferred for crackers and pastries
(Pena, 2002). Ethiopians value different qualities of wheat flour depending on its purpose. If they
are making leavened bread, they want strong elasticity in the dough, a good rise, and a shelf life
of several days while still remaining soft, whereas, if they are making injera, they want a
fermented thin batter that cooks into a flat, elastic pancake-like product that stays fresh for a
week or more without refrigeration. Grain quality is an important factor in the acceptability of
taste and appearance of wheat products as well as in marketability for small-scale farmers
growing wheat as a cash crop. Adoption of new varieties of wheat depends on what farmers look
for to satisfy both their grain yield expectations and their end-use quality needs.
The data were gathered over a six week period from May to June, 2011. I worked with two
research assistants, one woman and one man, from the Kulumsa Agricultural Research Center
who acted as enumerators and translators during the interviews. Four districts in the Oromia
region of Ethiopia were selected based on different agro-ecological zones and their wide-ranging
access to markets. Forty farmers, including 18 men and 12 women, were interviewed from the
following four districts: 1) Digelu Tijo, 2) Hetossa, 3) Dodota, and 4) Munessa (see Table 1 for
agro-ecological information). The districts are characterized by different soil types and length of
growing period.

31
Table 1 Agro-ecological information from the four surveyed districts
District Altitude range
(meters above sea level) Mean Annual Rainfall Characteristics
Digelu Tijo 2500-3560 masl 1000-1200mm High-altitude waterlogged soils
Hetossa 2000-2500 masl 800-850mm Mid-altitude rust-susceptible
Dodota 1500-2000 masl 500-800mm Low-altitude drought-prone area
Munessa 2200-3300 masl 1000-1200mm High-altitude with limited access
to commercial markets
Source: CSA, 2008.
The respondents were purposively chosen based on size of land holding, socio-economic status,
and gender. Since it was a small sample size, this sampling procedure was appropriate because it
helps to maximize the range of respondents within these zones. Ten wheat producing farmers
were selected from each district to participate in individual interviews that lasted approximately
two hours each. I selected farmers from three different wealth categories: less than one hectare of
land; one to three hectares; and more than three hectares. I interviewed female and male heads of
households as well as women in male headed households.
Farmers were asked several demographic questions including their age, family size, size of land
farmed, amount of land allocated to wheat production, yield of wheat, frequency of renewing
seed, and amount of seed for home consumption and sale (see Appendix 1 for the survey). They
were also asked to talk about the varieties of wheat they currently grow and constraints to
production including losses from rust disease and access to fungicide and rust-resistant wheat
seed. They discussed the decision-making process in planting new varieties and the sources and
cost of improved and local wheat varieties. Then respondents were provided a list of local and
improved varieties and asked to rate their desire to grow these varieties the next season on a

32
scale of one to five (one being “they would not grow the variety under any circumstances” and
five being “they would definitely like to grow the variety”).
The interviews were used to identify the determinant wheat variety traits that influence a
farmer’s decision to grow a wheat variety. Farmers were asked to evaluate two to three varieties
that they had ranked as ‘familiar’ or ‘very familiar’ and rate each variety based on 36 trait
characteristics (Table 2). They rated the performance of the variety on a scale of one to five (one
meaning the term ‘does not describe the variety very well’ and five meaning the term “describes
the variety very well”).
Table 2 Farmers evaluated familiar wheat varieties on 36 trait characteristics
Has excellent early vigor
Is competitive against weeds
Is drought tolerant
Is tolerant to wheat rusts
Is tolerant to water-logging
Is resistant to lodging / The stalk is strong
Matures at the right time for my region and my needs
Is the appropriate height for my needs (I am satisfied with the amount of straw residue)
Is easy to harvest and bundle
Does not shatter easily
Is easy to thresh
Stores well over time
Has high yields
Has long spikes
Has a high density of kernels per head
Responds well with low fertilizer rates
Has consistent yields year after year
Is trusted by other farmers in my area
Presents a low amount of risk to me
Seed is readily available when I need it
Price of seed is a good value
Has large grain size (TKW – Thousand Kernel Weight)
Grain color is excellent for market sale
Has a high flour volume per unit of grain (test weight)
Has excellent baking quality for dabo
Excellent water absorption of flour
Dough has excellent elasticity
Has a good ‘eye’ size for preparing injera
Excellent malting quality
Color is good for making tala
Makes soft dabo
The color of dabo is excellent
The color of injera is excellent
Has good quality straw for animal feed
Is resistant to pre-harvest sprouting
Has high tillering capacity
The scores of the 36 traits were subjected to a factor analysis procedure in the statistical program
JMP 9.0 using the principal components method. This technique is used to analyze the

33
Number Eigenvalue Percent Cum Percent 1 5.8023 42.554 42.554 2 2.3396 17.159 59.712 3 1.6946 12.428 72.141 4 1.4425 10.579 82.720 5 0.7556 5.542 88.262 6 0.6785 4.976 93.237 7 0.6674 4.895 98.132 8 0.5274 3.868 102.000 9 0.3233 2.371 104.372 10 0.2944 2.159 106.531 11 0.2312 1.696 108.227 12 0.1628 1.194 109.421
13 0.1241 0.910 110.331 14 0.0375 0.275 110.606 15 -0.0156 -0.115 110.491 16 -0.0433 -0.317 110.174 17 -0.0746 -0.547 109.627 18 -0.0853 -0.625 109.002 19 -0.1258 -0.923 108.079 20 -0.1553 -1.139 106.940 21 -0.1854 -1.360 105.580 22 -0.2204 -1.617 103.963 23 -0.2568 -1.883 102.080 24 -0.2836 -2.080 100.000
correlation between traits to determine whether a smaller number of factors could explain most
of the variability within the 36 traits. Based on the scree plot test (Cattell, 1966) to drop
components where the elbow turns in the curve (see Figure 2), and the Kaiser criterion
(Bandalos, 2009) to drop components with eigenvalues under 1.0 (see Figure 3), the thirty eight
traits could be grouped into five (Cattell) or four (Kaiser) factors. Four factors were ultimately
chosen because the group of four factors was more logical since only one trait, length of spike,
separates into the fifth group and it accounts for only five percent of the total variability.
The results of the factor analysis are described in more detail below but it is necessary to note
here that the traits were grouped into four independent categories according to four unobserved
factors interpreted as: 1) Quality traits, 2) Agronomic yield related traits, 3) Disease resistance,
and 4) Harvest/storage traits. Factor one explained 42 percent of the variance, and factors two
Figure 3 The Cattell scree plot test recommends
to drop the components where the elbow turns
in the curve Figure 2 The Kaiser criterion
suggests dropping all factors with
eigenvalues less than one

34
and three explained 24 percent and 19 percent respectively. Six traits represent 85 percent of the
variation and have the highest factor loadings in the Agronomic, Disease resistance, and Quality
factors. The following six traits that were derived from the factor analysis procedure were used
to develop the hypothetical varieties represented in the conjoint survey:
1) Number of productive tillers per plant
2) Density of kernels per spike
3) Size of grain
4) Disease resistance
5) Grain color
6) Price of seed
It should also be noted that traits that involve organoleptic evaluation, such as taste or smell,
cannot be effectively assessed using the conjoint analysis technique because respondents would
be required to evaluate more combinations than their senses can handle (Bakken et al., 2006).
There are other types of subjective tests that can account for quality preferences using
organoleptic evaluation but these are beyond the scope of this research. This is an area for further
research that, when used in combination with the results of this conjoint analysis paper, would
yield both the expected quality (visual cues) and experienced quality (organoleptic evaluation) of
wheat traits. As a continued area of research, a comparison of how the taste experience measures
up to the visual cues determining quality could provide interesting gender differences based on
the roles of men and women in the household.

35
2.4 Gender-roles
Sixteen males and seven female farmers from the four districts previously mentioned were
interviewed and asked to report on gender roles in wheat production. The respondents were
asked to describe how various wheat farming activities were carried out and discuss their role in
more than twenty different production, processing, preparation, and market-oriented tasks. The
questionnaire listed the various tasks that are commonly thought to contribute to wheat
production. We quickly learned during the interviews that the tasks are not as discrete as they
may seem and further discussion into the roles was necessary. These led to more open ended
interviews where the respondents discussed their individual tasks and new insights developed
that led to further questioning.
Twenty three farmers, a sub-sample out of the total 40, were interviewed. The full sample was
not needed to gather more information because we reached ‘saturation of information’ which is
considered satisfactory for determining sample size in qualitative studies (Mason, 2010).
Saturation is when the collection of new data does not shed any further light on the issue under
investigation (Glaser et al., 1967). This is not to say that we have exhausted all inquiry or that we
can generalize our findings to the entire population of Ethiopian farmers. Rather, for the
purposes of this study, we were satisfied with the extent of information gathered from the 23
farmers.
In addition to wheat production roles, the farmers were asked to talk about decision making
processes such as how they choose which crops and varieties to grow. The interviews inquired
about intra-household bargaining and whether decisions are determined jointly by the household
or solely by the head of household. Furthermore, respondents discussed women’s participation in

36
selling crops in the market and control over assets such as the sale of baskets, cooking
equipment, homemade beverages, etc. The results of these discussions brought to light the
complex roles of men and women in wheat production.
The data from the interviews were used to inform the quantitative survey and to provide a better
understanding of the context of Ethiopian farmers. The data were descriptive and were used to
support any theory that comes from the quantitative surveys.
2.5 Conjoint analysis study
The conjoint analysis technique was chosen for this research because it relies on the premise that
a person’s valuation of a product is based on the utility derived from the many attributes that
comprise the product as a whole (Baker, 1998). Conjoint analysis is a statistical technique used
in market research to estimate individual preference models based on how people value different
traits that make up a product. This is an ideal technique to use in the case of Ethiopian wheat
farmers because often when people are so familiar with an activity or object, they have a difficult
time describing what they like about it or why they like it. In a conjoint analysis design, a
controlled set of potential products with different combinations of traits is shown to respondents
and, by analyzing how they rate these products, the implicit valuation of the individual traits
making up the product can be determined. These preference models can be used to understand
the market demand and potential for new varieties to meet this demand. Conjoint analysis
techniques are also used as trade-off analysis tools to determine the systematic analysis of
decision making.

37
The conjoint analysis study was conducted over six weeks from December 2011 to January 2012
just after the wheat harvest in four villages (kabeles) within the Hetossa woreda. The four
villages were:
1) Hatee Handodee
2) Odaa Jila
3) Gonde Finchama
4) Boru Lencha
In addition to myself, the same two researchers from KARC that assisted with enumeration and
translation on the previous study were joined by a female district agricultural officer and several
local extension agents in administering the surveys. A total of 305 farmers were surveyed
including 158 MHH, 70 FHH, and 77 female not head of household. A combination of purposive
sampling and random sampling was employed for sample selection. The sample selection was
purposive because specific villages were selected within the district based on their location to
major roads and marketplaces and the fact that they are major wheat growing areas. I selected an
even number of men and women to be surveyed from each village (some last minute
substitutions were necessary based on respondent availability and no-shows, hence the uneven
final number of 52% male and 48% female). I used lists provided by the agricultural extension
officers at the district and village level to find out how many wheat household units were in each
village, then I randomly selected 305 farmers from the four villages to participate in the survey.
The surveys were conducted in the local language, Oromifaa, and responses were written in
English on the questionnaire. The results of the survey are intended to show the value of certain
traits to different segments of the surveyed population (see Appendix 2 for the survey).

38
Phenotypic traits and levels
The six traits to be evaluated were chosen based on the factor analysis results from the previous
study (June 2011). The conjoint survey involved farmers rating hypothetical varieties that were
based on combinations of the following traits and levels:
1) Number of productive tillers per plant (2, 5, and 8 tillers)
2) Density of kernels per spike (lax and dense)
3) Rust disease resistance (resistant and susceptible)
4) Size of grain (large and small)
5) Color of grain (white and red)
6) Price of seed (650 birr3, 850 birr, and 1050 birr)
The trait levels were selected to represent realistic trait possibilities based on information
gathered from discussions with wheat research scientists at KARC, farmers, extension agents,
seed companies, and millers.
Varietal combinations and visual stimuli
Yield is thought to be one of the most important factors influencing a farmer’s decision to grow a
variety. However, yield is not a specific agronomic trait, but instead, can be broken into several
attributes that contribute to yield: number of productive tillers per m2, density of kernels per
spike, and thousand kernel weight. I used the levels two, five, and eight productive tillers to
portray low, medium, and high number of tillers per plant. These levels were described verbally
to the respondents by a research assistant and they were shown a laminated 8.5”x11” card with a
3 17.39ETB = $1 USD Exchange rate on January 11, 2012

39
picture of a plant with either two tillers, five tillers, or eight tillers (see Appendix 3 for an
example of the cards and Appendix 4 for tiller pictures).
The density of kernels per spike was divided into two levels, lax kernels and dense kernels. The
laminated card showed a close up picture of a wheat spike depicting a lax kernel with
approximately 40 kernels loosely spaced on the spike or a dense kernel with approximately 80
kernels tightly packed on the spike (see Appendix 5).
The ‘thousand kernel weight’ is a technical term that was unlikely to be understood by many
farmers. Seed size contributes to the thousand kernel weight and is easily observable so
participants were asked to rate small or large kernel size instead of thousand kernel weight. Since
changes in size and color are relative to a standard, it is best to show actual seeds (as opposed to
pictures or verbal descriptions) representing the small and large size and the red and white color.
It is not possible to separate the color of grain from the size of the kernel so respondents were
shown grain with the following size/color combinations: small, white grain; large, white grain;
small, red grain; and large, red grain. These were displayed in a clear plastic container (see
Appendix 6).
The two levels of response to rust disease were ‘rust resistant’ and ‘rust susceptible’. The
laminated card included a close-up picture of a leaf that was either infected with rust or resistant
to rust. Due to the fact that the relative rust response is contingent on an infestation of the rust
disease, it was important that this picture was covered by an index card that could be revealed if
the respondent wanted a visual representation of the rust response so their initial opinion would
not be influenced by seeing a variety infected with rust. Before each survey, every respondent
was told that the depiction of the rust response was based on zero fungicide application during a

40
severe rust infestation similar to the rust epidemic experienced the previous year (growing
season July through December 2010).
The price represented the cost of 100kg of seed at planting time and included three levels; low at
650 ETB/100kg for seed, average at 850 birr/100kg, and high at 1050 birr/100kg. The price was
determined based on discussions with farmers, researchers, and seed companies that took the
market price of grain at harvest in December 2011 (630birr/100kg) and the trend for the
projected price of seed at planting time (average projected price of seed is market price plus
200birr).
During the explanation of the survey, the respondents were told that all other traits and
management of the “varieties” in question were to be considered equal, meaning they mature at
the same time, they were grown in the same soil under the same climatic conditions, they are all
the same height and all management was the same including seed rate, and fertilizer application.
All of the “varieties” were said to come from a trusted and reliable source.
Experimental design
The study uses six traits and a total of 14 trait levels (four of the traits have two levels each and
the ‘number of tillers’ and ‘price of seed’ traits both have three levels). There are entirely too
many combinations to have farmers evaluate all the trait combinations – 3x2x2x2x2x3 is the full
factorial design and would have resulted in 144 combinations – which is why a fractional
factorial design was used. Each of the trait levels was entered into a choice design from JMP 9.0
statistical software which generated 16 combinations. I added two more combinations to increase
the degrees of freedom for a total of 18 trait combinations. The respondents were asked to rate
these 18 combinations that represented hypothetical varieties and were depicted on laminated

41
cards (see Appendix 3 for an example of the laminated card). They rated the trait combinations
on a 7-point Likert scale (Likert, 1932) with zero indicating they “definitely would NOT buy”
the seed and six meaning they “definitely would buy the seed” at the given price. The surveys
were conducted at the village agricultural offices or in a village meeting room in a one-to-one
interview style with the research assistants translating the varietal descriptions into the local
Oromifaa language for each respondent. Each interview typically took 45 minutes to an hour.
Data entry
Each completed survey was thoroughly reviewed by the research assistants and primary
researcher so as to avoid any missing data. The surveys were coded nightly during the data
collection period. There were no surveys that contained missing data for the rating of
hypothetical varieties. Very few surveys had missing variables in the demographic section and
these were dealt with by either dropping the variable or estimating the response based on
responses to similar questions (several questions were reworded versions of previous questions
to check the validity of previous responses. For example: Q1How many hectares of wheat did
you grown last season?; Q2 List the varieties of wheat grown and hectares allocated to each
variety? ).
Wealth index calculation
It can be difficult to establish the income for farmers in developing countries because much of
their wealth may exist in livestock assets and they may rarely use currency, instead trading goods
or services. In addition, self-reported income data are notoriously unreliable and the discussion
of income may be a sensitive subject. To avoid these pitfalls and misreporting, it is common to

42
calculate a wealth index by collecting an inventory of selected assets. The following variables
were used to calculate the wealth index (with average price in parentheses):
Number of each livestock – oxen (4394 ETB), donkeys (1020 ETB), goats (694
ETB), sheep (746 ETB)
Number of 100kg sacks of wheat sold at harvest – 630 ETB
Number of 100kg sacks of wheat sold at planting – 830 ETB
Income from selling other crops
Amount of off-farm income
The price for livestock was calculated using a live feed of Ethiopian Livestock Market
Information (accessed January 3, 2012) based on the rate at the nearest market in Adama in
January 2012. The rate for a 100kg sack of wheat at harvest was based on the Hetossa market
price for wheat in December 2011 just after harvest. The rate for a 100kg sack of wheat at
planting was calculated based on an average estimate of 200 ETB difference between the prices
of wheat at harvest and planting (personal communication with farmers, extension agents and
researchers in Hetossa, December 29 2011). Income from selling other crops and the amount of
off-farm income were given by respondents as an estimated annual sum in Ethiopian birr. The
amounts from each variable were summed and assigned to respondents as a continuous variable
called the wealth index.
Ordinary least squares model
Ordinary least squares regression was used to estimate each respondent’s preference coefficients
for each trait level. The following model was used:

43
Rj=β1+β2 (2tillers) + β3 (8tillers) + β4 (loDensity) + β5 (large) + β6 (red) + β7 (rustResist)
+ β8 (loPrice) + β9 (hiPrice) + Ej
Where Rj represents the rating value given by respondent j on the 7-point Likert scale; 2tillers =
2 productive tillers per plant; 8tillers = 8 productive tillers per plant; loDensity = low density of
kernels per spike; large = large seed size; red = red color of seed; rustResist = rust disease
resistance; loPrice = 650 ETB; hiPrice = 1050 ETB. Parameter β is the slope or the “preference
coefficient” of the trait level. The independent variables were effects-coded. It is common in
conjoint analysis to use an effects-coding procedure instead of dummy coding (Tano et al.,
2002). In an effects-coding procedure for two trait levels, the usual dummy coding (0,1) is
replaced by (-1,1) where -1 is used instead of zero for the variables that are excluded to avoid the
“dummy variable trap” during estimation (Tano et al., 2002). When there are three trait levels,
such as with number of productive tillers and price, a (-1,0,1) system is used. Unlike dummy
coding, in effects-coding the reference levels have an average value of zero for each trait and are
uncorrelated with the intercept (Bech and Gyrd-Hansen, 2005). This property simplifies the
interpretation because the zero point is the average, so the interpretation is that any level above
zero is more preferred than average, while those below zero are less preferred. Dummy-coded
approaches specify that the least preferred value will be set to equal zero and all other levels will
be positive values so they do not average any specific value (Bakken, 2006). Effects-coding
generates estimates that measure the marginal change in the dependent variable as a result of a
unit change in the independent variable (Pedhazur, 1982).

44
Adjusted R2
The R2, or coefficient of determination, indicates how much of the variation in the dependent
variable is explained by the variation in the explanatory variable. One problem with the R2 is
that as more explanatory variables are added, the R2 increases regardless of the value these
explanatory variables add to the equation. We can account for this by using the adjusted R2.
The adjusted R2 adjusts for the number of explanatory variables in the model and includes a
penalty for increasing numbers of right-hand-side (RHS) variables:
adjusted R2 =
1
1*)1(1 2
kn
nR
Where, the final term (n-1)/(n-k-1) gets larger as the number of RHS variables (k) increases
resulting in a smaller adjusted R2. So, in order for the adjusted R
2 to increase as variables are
added, the R2 needs to increase by enough to overcome the penalty associated with adding more
variables. The main use for the adjusted R2 is in comparing results across studies.
Relative importance
The preference coefficients from the conjoint model were used to estimate the relative
importance (RI) of each trait. This can be achieved by considering how much difference each
trait could make in the total utility of a product. That difference is the range in the trait’s utility
values. RI’s are calculated by dividing the difference between the highest and lowest coefficient
for each trait and then summing these ranges across all traits using the following equation (Hair
et al., 2010):
RIi = (rangei * 100) / i)

45
RI values are calculated in percentages from relative ranges, obtaining a set of trait importance
values that add to 100 percent. RI values are interpreted as the percent strength of importance the
respondent placed on each trait in expressing the intention to purchase the product.
Cluster model
The cluster analysis procedure in JMP 9.0 was used to group respondents with similar preference
coefficients together. The cluster procedure hierarchically clustered the observations in the data
set using Ward’s minimum variance method (SAS, 2009). This method minimizes the total
within-cluster variance. The two clusters with the least distance between them are merged at
each step of the process. All clusters start out as a single point. Then the two closest clusters
merge to form a new cluster that replaces the two older clusters, repeating this process until the
optimum number of clusters is met (SAS, 2009). The initial distance between individual objects
must be proportional to the squared Euclidean distance using the following equation (SAS,
2009):
DKL = BKL =
If d(x,y) =
‖x-y‖
2, then the combinatorial formula is DJM =
The resulting R2 is the proportion of variance accounted for by the clusters. Several methods,
using the R2 and t
2 statistics, are useful in determining the appropriate number of clusters but this
is somewhat subjective based on the characteristics of the cluster and usefulness of the data.
Seven clusters were indicated as the best representation of the variation in the population but two

46
of the clusters had very small sample sizes (n = 9 and n = 16). The members of these clusters
represented quite different demographic characteristics to the other clusters so I decided to
examine the seven clusters and report the summary statistics results. However, the multinomial
logit analysis could not accommodate such small sample sizes so I used a five cluster model for
that analysis.
Multinomial logit model
The clusters were created by analyzing the respondent’s preference coefficients from their
ratings of the hypothetical wheat varieties. However, cluster analysis does not account for any
information based on demographic variables. As a stand-alone procedure, the cluster analysis can
only determine that there are segments of the wheat farming population that have different
strengths of preferences for specific traits, but these preference coefficients are not observable.
The conjoint analysis tool is most effective when multinomial logit analysis is performed to
reveal useful information about these segments. The multinomial logit model allows us to predict
cluster membership based on demographic variables such as gender, socio-economic status, or
education level. Each respondent’s cluster number and demographic/usage information was fed
into StataMP 12 statistical software (STATA, 2009) to calculate the probability of a respondent
being assigned to one of the five clusters based on certain demographic and usage characteristics
by using the following equation:
Pr(I)n =

47
Where, Pr(I)n is the probability that respondent n is in the ith cluster, is a vector of
demographic and management variables, and βn is the vector of preference coefficients for
respondent n.
3. Results and discussion
3.1 Focus group discussions
I conducted two focus group discussions, both of which evaluated the flour, dough, and baking
quality of different types of wheat. The two groups were differentiated by the samples they
evaluated and the method of preparation for the samples. The first group compared three distinct
single varieties that were milled with their bran on, as well as four commercially milled all-
purpose (mix of hard and soft wheat varieties) samples. The second group evaluated five distinct
varieties prepared using the traditional home method of soaking, sun-drying, and hand-grinding
the grain to remove the bran before milling.
Flour quality
During the focus group discussions, the participants evaluated the milling quality based on the
amount of seed (weight in kg) and the resulting flour volume after milling. The variety
Millennium had particularly low flour volume (compared to the other varieties Kubsa, Huluko,
Kakaba, Hogana, Pavon 76, and Digelu) which was considered a negative trait for that variety.
Collectively, the first group rated the top flour as the ‘First grade’ flour from Asela Mill and
described it as having a soft texture, white color, and fresh smell. ‘Bad’ smelling flour was
described as smelling like it has been mixed with other crops or like it has been stored for a long
time. The women said the ‘Third grade’ flour from Asela Mill had a harder texture which is not a

48
good quality. Millennium was ranked the worst variety because the color was dark red and it had
an old smell. The mixed ‘Abroad’ flour from the Gonde Mill was rated as the second favorite
variety. This is interesting considering ‘Abroad’ is Gonde Mill’s B grade flour compared to the
‘Special’ A grade flour, which was not favored by the women. In fact, the women commented
that the ‘Special’ flour was too soft and not suitable for making bread. The single variety,
Huluko, was rated third over both the ‘Third’ grade Asela Mill mixed flour and the ‘Special’
mixed flour from Gonde Mill. This is somewhat surprising considering the single varieties were
milled with their bran on which is not the traditional method of preparation. Several of the
women commented that they know the protein content is higher when the wheat is milled with
the bran on but they don’t like the brown color of the bread and prefer white bread made from
wheat without the bran. One participant said she prefers the pure white flour for home
consumption and market even though she knows the darker color flour contains higher protein.
During the discussion the women remarked that they prefer Kubsa for making bread and Galama
for market sale (although Galama was not evaluated). The variety Enkoy is preferred for its red
color in making a local fermented alcoholic beverage similar to beer that is called tala. Galama is
also reported to be good for making nefro and kolo because it has large grains. Kubsa reportedly
has the highest flour volume, followed by Galama.
Dough quality
Crumbly dough is considered poor quality and often it is thought that crumbly dough has low
protein content. Galama, although not evaluated, was mentioned by one participant as having a
low protein, crumbly dough. The participants collectively discussed the qualities of the dough for
the samples as follows:

49
The dough from Kubsa was not well liked by the women (this is interesting because
Kubsa was mentioned previously as making the best bread, so the poor quality could be
due to the untraditional preparation). The women said the dough was rough, the color was
too red, and there was no elasticity so the dough would just break apart when stretched.
They did like that the dough kneaded well and was not sticky.
The dough from the variety Huluko was preferred for making bread. The women
described the dough as being soft in texture, good in water absorption, medium in color,
and poor in elasticity. The participants of Group Two preferred Huluko the best and
discussed that it had good elasticity without sticking to the pan or to your hands and that
it has a good color.
The most negatively perceived variety was Millennium. The participants said it had hard
dough that was not sticky at all and very difficult to knead. It had a “bad brown color”
and absorbed too much water.
The ‘Abroad’ mix from Gonde Mill was too sticky which was said to be a negative
quality that would not be good for making bread. It did have good elasticity and was
considered to be medium in water absorption capacity.
The white color of the ‘Special’ mix from Gonde Mill was one of the favorites of the
women but the dough was “too hard” and the flour did not absorb very much water even
though it still had good elasticity.
The most preferred sample in the dough was the ‘First’ grade mix from Asela Mill. The
women liked this dough best for bread. The white color was the “purest”, it was
“somewhat sticky” and easy to knead and had very high elasticity.
The ‘Third’ grade mix from Asela Mill was sticky but the women remarked that it was
good for making bread. It had a good white color and was medium in water absorption.
Although Hogana was soft and had good elasticity, it was very sticky and dough is left on
hands and the container, which the participants said was a sign of poor quality.
Pavon 76, which is well-known to be a favorite for making bread, was rated the worst
quality dough by the second group. The participants said it had poor water absorption and
the dough was hard and would not stick to itself making it difficult to knead, crumbly,
and had almost no elasticity.
The second group preferred Digelu over the other varieties for its color. Digelu had poor
water absorption but was rated medium in kneading and elasticity because it was not too
sticky.

50
The second group commented that Kakaba dough was not as soft as they prefer but it
made up for this negative quality with good elasticity and stickiness.
Bread quality
The results for preference of bread quality were divided amongst both groups. Most of the
women from the first group preferred the mixed samples that came from the commercial mill but
two of the women preferred the variety Huluko. These two women said they like the dark
colored bread for home consumption because the bran was left on and they think it is healthier
and has more protein. But, they did say these varieties would not be good for market sale. Other
women commented that the bread made from Huluko was crumbly and dry which they did not
like but it had large pores which was good and they thought it would store well without molding.
The majority favorite from the first group was the “Special” mix from Gonde Mill because the
color was very white throughout; it had a good ‘spongy’ texture, good taste, and light weight.
The “First” grade from Asela Mill compared almost equally but was rated second by most of the
group.
It was noted that the dough from Kubsa was the first to rise and needed the least amount of time
for leavening. Two women rated Kubsa as their second favorite because it made “heavy” bread
and the color was not too dark considering it still had the bran on. The “Third” grade mix was
said to have a “sweet” taste and medium texture “spongy-ness”. Although it was not “pure”
white, the color was acceptable. Gonde “Abroad” mix was rated third favorite because of the
white color, but otherwise it was unnoteworthy. The worst rated variety was Millennium which
fermented/rose last, was dark red in color, and had a poor taste. The only positive comment was
that it had a softer texture than the bread made from Kubsa.

51
The second group from KARC liked the overall quality of Huluko saying that it was porous,
fluffy, had good color, and a sweet taste. Individual ratings were relatively consistent with the
highest preference for the varieties Huluko, Digelu and Hogana, and the lowest ratings for
Kakaba and Pavon 76. It was mentioned that Kakaba had small pores and made heavy bread
which they did not like. One participant mentioned that the bread from Pavon 76 was very heavy
and she thought it may be a sign that the grain had been exposed to moisture and sprouted. This
was not confirmed since the grain sample had already been used at this point but it is a plausible
explanation for why the well-liked variety known for good bread quality was not preferred
during this evaluation. See Table 3 for a summary of the respondent’s perceptions of good and
bad quality pertaining to the different processing phases.
Table 3 Respondent summary of perceived quality traits for different processing phases
Processing
phasesGood Qualities Bad Qualities
Milling High flour volume, white grain color Low flour volume, red grain color
Flour
Soft texture, white color, fresh smell,
perception of high protein content
(related to color)
Hard texture or too soft texture, dark brown
or red color, old smell
Dough
Soft texture, good water absorption,
high elasticity, pure white to light red
color, easy to knead, some stickiness,
short leavening time
Crumbly (perceived as low protein), rough
or hard texture, no stickiness or too sticky,
very low or very high water absorption, low
elasticity, red color, slow leavening
Bread
Large pore size, light weight, fluffy,
spongy texture, good smell, sweet
taste, pure white to darker white color,
easy to ball up between thumb and
forefingers
Dense weight, heavy, small pores, crumbly,
dry, dark brown or red color, sour taste
The purpose of the focus group discussions was to draw out the traits that Ethiopian people
characterize when evaluating the quality of wheat for making bread. These exercises were

52
valuable for understanding what participants look for in determining ‘good’ and ‘poor’ quality
and how this is measured descriptively by non-scientific standards. The results of the focus
group discussions are not meant to be conclusive as to what exact traits define good quality
because this is subjectively based on the perception of what ‘good quality’ means to each
consumer. Some participants preferred darker colored bread because there was a perceived
higher protein content while others only liked very pure white grains because they were best for
market sale. These discussions highlight the variability of traits related to the different stages of
making bread and show the complexities involved in testing for quality preferences. The results
also show that the characteristics of flour and dough that are perceived as ‘good’ do not
necessarily equate to good quality bread. Several participants mentioned that the dough quality
was poor because it was too sticky, not elastic enough, or had poor water absorption (which are
all thought to be important in the bread quality) and then rated the bread from this dough as their
favorite. A decreased leavening time was preferred by the focus group women which could be
significant in minimizing the length of preparation time and in freeing up more time for other
activities. The men that participated in the second focus group discussion rated the bread from
Pavon 76 highly and liked the taste while the women said it tasted off. This is just one example
and I cannot conclude that men and women have different taste preferences from this but it is
worth noting and could be a possible avenue for further study.
3.2 Gender roles in wheat production
Respondents reported on individual responsibilities for different wheat farming and household
activities. When questions about role responsibilities were asked in a format requiring a person
to assign either male or female to a farming role, generally all respondents answered the same. I

53
will explore some of the reasons why this may be the case below. It was not until respondents
were asked to describe how an activity takes place (such as preparing land or spraying
chemicals) that the discrete family or individual level of involvement was elaborated.
Respondents were asked which family member/s performed the activities listed in Table 4.
Table 4 List of tasks related to wheat production
Tasks in wheat production:
Land preparation
Planting wheat
Weeding
Applying fertilizers
Applying chemicals (fungicides, insecticides, herbicides, etc.)
Protecting crop from birds
Harvesting
Preparing the threshing site
Threshing
Winnowing
Preparing the gotera or degogo
Maintaining the gotera or degogo
Seed selection
Seed cleaning
Transporting grain to market
Selling grain (direct to buyers or to millers)
Milling grain for home consumption
Preparing and Cooking
Storing prepared products
Deciding which crops and varieties to grow
Purchasing or trading new varieties
Generally, respondents answered that men solely performed the activities of land preparation,
applying fertilizers and chemicals, and preparing the gotera/degogo4, while women’s sole
responsibilities were maintaining the gotera/degogo, seed selection, seed cleaning, milling grain
for home consumption, preparing/cooking wheat products, and storing prepared products. All
4 Grain and flour storage containers made from tree branches and/or mud mixed with straw.

54
other activities were performed by both male and female members of the household (although
equal time was not necessarily allocated by both genders in completing the activity).
However, as we probed for more description of how the activities are performed, it became
evident that women are, in fact, involved in the activities that are claimed to be the ‘sole’
responsibility of men. For example, men use oxen to plow the fields and, culturally, it is not
acceptable for women to plow, so land preparation is considered a man’s activity. But, women
participate in land preparation by following behind the plow and breaking up the clods that were
too large to be broken apart by the plow. This act requires women to use a hand tool and
physically break up the large clods. According to the Tiruneh et al. (2001) study on gender
differentials in agricultural production in the central highlands of Ethiopia, women do not
participate at all in land preparation or planting; these activities are the sole responsibility of
men. This is contrary to our findings, partly due to the descriptive quality of our questions that
allowed respondents to elaborate on their role in each activity. Another contrast between our
survey and that of Tiruneh et al. is that our respondents reported that both women and men
participate in broadcast planting.
All respondents, regardless of gender, replied that chemical application was the sole
responsibility of men. However, when asked to describe these activities further, it became clear
that women have a prominent role: women fetch the water and bring it to the field for the men to
mix with the chemicals. According to manufacturers’ instructions, fungicide tank mixes require
from 200 liters to 1000 liters of water per hectare (Syngenta Tilt 250E Approved Instruction
Pamphlet, 2010; Syngenta Mancozeb instruction label, 2007) and may need to be applied several
times throughout the growing season. Herbicides, such as 2, 4-D, require 100 liters of water per
hectare (Dow AgroSciences Frontline 2, 4-D label, 2011). Given that a source of water can

55
sometimes be several kilometers away from the field, bringing this much water to the field can
be extremely physically demanding and time consuming for women.
In most cases, respondents claim that both genders contribute to the decisions about which crops
and varieties to grow. However, when we asked men what would happen if their wife does not
agree with their decision, men responded that they would make the decision without their wife’s
input. Many men asserted that it was a joint decision unless their wife disagreed, in which case it
was the decision of the head of household. These findings are consistent with a study of gender
roles in cereal crop production systems by Hassema (2008) showing that in 69% of the cases the
husband makes the planting decision unilaterally, in 26% of the cases it is a joint decision, and in
3% of the cases the wife makes the decision unilaterally.
During interviews, a female respondent remarked that she was not happy with the food quality of
the variety Mada Walabu and she told her husband she did not want to continue to grow this
variety the next year. Her husband agreed to change to a new variety that was a better quality for
food preparation. So apparently some women in male headed households do have some decision-
making power, but it is generally not equivalent to the power of the head of household and the
final say usually depends on their husband’s preference.
Women do most of the transporting of grain to market unless there is a large amount of wheat to
be sold, in which case the men take responsibility for transporting large amounts of commercial
grain. Likewise, women can purchase and sell small amounts of grain for use in food preparation
but men are responsible for the commercial sale of large amounts of wheat.

56
3.3 Perceptions and evaluation of existing varieties
Demographic statistics
The summary of demographic statistics is shown in Table 5. The average age of the respondents
was 43.6 years old with a median of 40 years old. The median size of land holding was 3
hectares of owned land and 0.13 hectares rented. This sample included 70% male respondents
and 30% female with 80% of the respondents being the head of household. Of the average 2.61
hectares of land owned by participants, 1.75 hectares was dedicated to wheat production. The
majority of respondents (79%) reported a median yield loss of 13 quintals, or 0.74 t/ha, from
yellow rust (1 quintal = 100kg). Based on yield statistics from Table 6, the average yield was
1.79t/ha. Therefore, 0.74 t/ha loss equates to 41% reduction in average yield. It must be noted
that this data is from an abnormal year in which yellow rust infestation caused increased losses.
Even so, 21% of respondents reported no loss or even a gain. Without longitudinal data, these
gains are difficult to explain but may be due to a catastrophic event from the previous year
(drought, flooding, lodging, etc) that wiped out some or their entire crop so that any yield would
have been a gain over the previous year. The reported losses are consistent with the overall
country losses from the yellow rust epidemic from 2010 (ICARDA, 2011). Although some
respondents reported that they planned to allocate more land to grow wheat in the coming season
(there was an average increase of 0.89 hectares of wheat), the median for the planned hectarage
was the same as the amount planted to wheat the previous year (1.5 hectares).

57
Table 5 Summary of the respondent’s demograhic statistics
Age Ha own Ha rent M F HH
Ha of wheat
2010
Yield Loss
in 2010
Planned Ha of
wheat 2011
Average 43.6 2.61 1.16 70% 30% 80% 1.75 -18.9 2.64
Median 40 3 0.13 1.5 -13 1.5
Minimum 24 0 0 0.5 -200 0.5
Maximum 78 5.5 10 5 20 20
Std Dev 11.52 1.46 1.98 1.00 36.44 3.28
CV 26% 56% 170% 57% -193% 124%
Yield statistics
Determining the average yield can be complicated because many farmers grow several varieties
of wheat for different purposes and these may have significantly different yields. Table 6 shows
a summary of yield statistics separated by the number of varieties grown. All respondents grew
at least one variety of wheat on an average of 0.99 hectares of land which had a mean yield of
2.03 tonnes per hectare (t/ha). More than two-thirds of the respondents grew a second variety of
wheat on 0.92 hectares of land which averaged 1.64 t/ha yield. Eighteen percent of farmers
interviewed grew three varieties, with the third variety averaging 1.69 t/ha and less land
dedicated to these varieties. The total mean yield for the sample was 1.79 t/ha, which is slightly
higher than the national average. Without longitudinal data, it is difficult to infer much about
these statistics, especially since the data are compared to yields from a year that suffered from a
yellow rust epidemic.

58
Table 6 Summary of yield statistics showing the percent of respondents growing more than one
variety, the number of hectares allocated to wheat, and the yield in tonnes per hectare
% of N 100% 100% 68% 68% 18% 18%
# of Ha t/ha # of Ha t/ha # of Ha t/ha
Average 0.99 2.02 0.92 1.64 0.61 1.69
Median 0.75 1.26 0.63 0.98 0.50 0.82
Minimum 0.25 0.00 0.04 0.00 0.04 0.00
Maximum 3.00 9.00 2.75 8.04 1.75 4.02
Std Dev 0.672 4.040 0.732 3.646 0.542 1.735
CV 68% 200% 79% 89% 89% 103%
Total avg yield: 1.79 t/ha
1 variety 2 varieties 3 varieties
Varieties
The data in Table 7 show the different varieties grown by farmers in the four districts. Note that
the percentage of people growing these varieties is more than 100 percent because many people
grow more than one variety. The most commonly grown varieties from these areas are Kubsa,
Digelu, Tusie, and Galama. Kubsa was released in 1985 and is a very popular variety known for
high yields and adaptability to many agro-ecological conditions. It became susceptible to the
Yr27 strain of yellow rust and was severely affected during the 2010 epidemic. Kubsa is an early
maturing variety that is best grown in mid- to low-altitude areas like the Hetossa and Dodota
districts. Digelu, Tusie, and Galama are all later maturing varieties better suited for the highland
areas. Digelu is rust resistant and Tusie is tolerant to rust. Tusie is not preferred for its bread-
making quality but it is used for making noodles and garners a good market price with traders.
Farmers in Munessa will often grow Tusie for commercial sale and grow several other varieties
like Digelu and Qamadii Guracha for home consumption. Munessa is more than 20 km from a
main highway road but trade trucks will drive to this area to collect Tusie at the end of the
season. Interestingly, the farmers in Digelu Tijo did not grow Tusie although the district is

59
located near a main road with a market and easy access for traders. Farmers from Digelu Tijo
grew mostly Digelu and Galama, which are used for home consumption, with any surplus sold to
the market. Digelu is in high demand and farmers that have a surplus and storage capabilities
prefer to sell it as seed (as opposed to grain). Approximately 30%-35% of the yield from Digelu
is produced for seed. Both Kubsa and Galama have a high biomass to grain yield, albeit for
different reasons. Kubsa has a high tillering capacity and Galama is a late maturing, tall variety,
both of which are preferred by farmers for use as animal feed, fuel, and roofing material. Kakaba
and Danda’a were the most recently released rust-resistant varieties and are in high demand.
Farmers grow these varieties exclusively for the purpose of multiplying seed because the seed is
far more valuable than grain. Digelu was released five years prior to this study and although it is
being rapidly multiplied, it is still in short supply. There is undocumented evidence (observed in
farmer’s fields in January 2010) that Digelu is already starting to become susceptible to new
strains of yellow rust. Since Digelu has only single-gene resistance, this shows how important it
is to breed for durable resistance using multiple resistance genes. Multiplication and
dissemination of varieties takes several years and by the time a variety, like Digelu, with single-
gene resistance is widely adopted, it is possible that the rust disease has mutated and the variety
is no longer resistant.

60
Table 7 Varieties grown by respondents in 2010 and the year the variety was released in Ethiopia
Variety Year
released
Kubsa 1995
Digelu 2005
Simba 2000
Kakaba 2010
Batu 1984
Tusie 1997
Hawi 2000
Galama 1995
Pavon 76 1982
Mada Walabu 2000
Danda'a 2010
Some farmers, especially women, show a preference (see Table 8) to revert back to older, local,
or obsolete varieties like Batu, Mada Walabu, Israel, Qamadii Guracha, Enkoy, Kei, Romany
BC, and Salmayo. The varieties that women were most interested in growing are known for
superior bread quality (Batu, Israel, Romany BC, Salmayo), traditional dishes (Qamadii
Guracha, Mada Walabu), home-made fermented beverages (Enkoy), and good straw for roof
material (Israel, Kei). The varieties most preferred by men were the varieties with strong
marketability and high yield (Kubsa, Digelu, Kakaba, Danda’a, Tusie, and Pavon 76).

61
Table 8 Percent of respondents desiring to grow select varieties in 2011 and the percentage that
were female from that subset
Variety % of N % Female
Kubsa 33% 8%
Digelu 63% 45%
Simba 3% 0%
Kakaba 60% 25%
Batu 13% 60%
Tusie 18% 0%
Hawi 13% 40%
Galama 15% 33%
Pavon 76 28% 27%
Mada Walabu 10% 50%
Danda'a 55% 32%
Israel 18% 43%
Qamadii Guracha 5% 100%
Enkoy 10% 75%
Kei 8% 100%
Romany BC 3% 100%
Salmayo 3% 100%
Fungicide application
The epidemic of yellow rust in 2010 was caused by an outbreak of Yr27, an aggressive new
strain of yellow rust, along with favorable environmental factors that sustained the disease
throughout the growing season. The yellow rust disease attacks early in the growing season
causing plants to be stunted and weak so timely spraying is critical. Many farmers in Ethiopia
used fungicide to prevent major losses but the supply and distribution issues caused problems for
timely application. Many farmers did not have access to fungicide during the critical application
period (tillering to stem elongation) to have the maximum effect. In addition, training on proper

62
use, mixing, and application rates, along with the necessary equipment for safe application, are
not readily available. The main types of fungicide come either in liquid or powder form. The
popular liquid fungicides are Bayfidan and Tilt. Mancozeb is a common chemical used in
wettable powder form and was subsidized by the government. According to ICARDA (2010), at
least 400,000 ha of wheat (equivalent to 44% of total wheat area) were affected in the 2010
yellow rust epidemic in Ethiopia.
Table 9 shows information about the fungicides including application and dilution rates. This
information was difficult to find using internet resources and many of the sources provided
inconsistent information. Based on the respondent’s answers during surveys, the rates of
application by farmers are not consistent with label recommendations. Discussions with local
extension agents also showed a lack of knowledge regarding the application timing, rates,
intervals, and dilution levels. Neither of the product labels for Mancozeb or Bayfidan includes
wheat as a crop that can be treated using these brands nor do they include recommendations for
application levels for wheat. According to the Grains Research and Development Corporation
(2005) cereal growth guide, fungicide should be applied in the early stages of the disease
between tillering and stem elongation (up to the first 37 days after planting). Tilt lasts about 3
weeks on the plant and then needs another application if the disease persists (second application
before 55 days) (Syngenta Tilt 250E Approved Instruction Pamphlet 2010). According to
Syngenta’s Mancozeb instruction label (2007), the recommended application rate for soybeans
and peanuts is 2.2kg per hectare (wheat was not included on label). The dilution rate is roughly
100L of water per 200g of Mancozeb and it should be applied at seven to ten day intervals. The
minimum recommended rate of water to be mixed with Tilt is 200 liters per hectare. All
fungicide applications require a significant amount of water to be mixed with the chemicals to

63
dilute the solution. Many farmers’ fields may be several kilometers away from a source of water
and given that it is a woman’s role to carry the water that is mixed for chemical application, this
creates a considerable amount of extra work and can be quite time consuming for women.
Table 9 Information on popular fungicides used to treat rust in Ethiopia
Fungicide Treats Rate/hectare
Mancozeb
● Dithane M-45 or
● Manzate 200 or
● Penncozeb
Septoria , Leaf and Stem Rust,
Tan Spot
*Product label does not
include wheat
1.7-2.2kg/Ha (recommendations from beans,
and peanuts since label doesn’t include wheat)
- Mix 160-210g/100L of water
Propiconazole
● Tilt 3.6 EC
Rust, Powdery Mildew and
Septoria
500mL/Ha
Minimum 200 L of water per hectare
Bayfidan
● Triadimenol
Powdery mildew
*Product label does not
include wheat
40mL/100L or 400mL/ha
150-200g/ha (CABI Crop Protection
Compendium)
As shown in Table 10, 58% of respondents applied some kind of fungicide to their wheat crop in
2010. Of the respondents that grew a second variety, 56% applied fungicide, and 57% of those
that grew a third variety used fungicide. The average number of applications was 1.7 times. The
mean number of days after planting for the first application was 46.3 days and 58 days for the
second application. Since the recommended time for the first application is before 37 days this
implies that farmers were applying fungicide 10 days late on average. Delayed application
decreases the effectiveness of the fungicide and decreases crop yields since yellow rust infects
the crop early and retards its development.
An average of 1.56L of liquid fungicide was applied or two packets of powder (each packet
contains 1kg of powder). Farmers spent on average 461 birr ($27 USD) per hectare to treat their
fields. With an average of 1.75 ha of wheat, the expense for fungicide is 807 birr ($46 USD).

64
Even with government subsidies for fungicide, farmers spent a considerable amount to protect
their crops from yellow rust ($46 USD is roughly half a month’s wages).
Table 10 Summary of respondent fungicide statistics
Apply
Fungicide to
1st variety
2nd
Variety
3rd
variety
# of
apps
DAP 1st
app
DAP 2nd
app #Liters #Packets Cost/ha
% of N 58% 56% 57%
Avg 1.7 46.3 58 1.56 2 461
Median 2 45 60 1 2 445
Min 1 30 37 0.1 1 40
Max 3 65 74 12 3 1200
Std Dev 0.76 11.83 8.89 2.59 0.82 351
CV 45% 26% 15% 167% 41% 76%
Note: DAP = Days After Planting
Factor analysis
The respondents evaluated two to three familiar varieties based on their perceptions of each
variety’s performance in 36 trait categories. The responses were subjected to factor analysis
which combined the traits into four categories that were named based on the relationship
between the traits in each category. Factor analysis establishes collinearity between variables and
selects a smaller number of variables that can account for most or all of the variation in
explanatory variables (Negatu and Parikh, 1999). The number of factors is established using the
Kaiser method of accepting factors with eigenvalues above one and the Cattell scree plot method
(as previously mentioned in the methods section).
The four categories were named: 1) Quality, 2) Agronomic yield related characteristics, 3)
Disease Resistance, and 4) Harvest/storage (see Table 11). As shown in Table 11, the factor
loading number for each trait in the different factor columns represents the weight that trait
contributes to the factor. Factor analysis reveals that the most heavily weighted traits are

65
tolerance to rust diseases, number of tillers, number of kernels per spike, grain size, price of
seed, grain color, flour volume, baking quality and straw quality. Results of previous studies in
central, southeastern, and northwestern Ethiopia are consistent with the findings that the most
important characteristics to farmers are grain yield, grain color, grain size, marketability, and
food quality (Negatu & Parikh, 1999; Bishaw et al., 2010; Kotu et al., 2000; Negatu, Mwangi
and Tesemma, 1992; Alemayehu, 1999; Agidie et al., 2000). Yield, marketability, and food
quality are not single traits that can be evaluated; they are broad categories composed of many
traits. Factor analysis helps identify which traits from these categories are the most important to
farmers.
Factor one, explaining 42% of the variance, was named ‘quality traits’ based on the inclusion of
the following traits: grain color, flour volume, dabo quality, water absorption, dough elasticity,
injera eye size, soft dabo, dabo color, and injera color. Length of spike was also included in this
factor although it is not a quality trait. Factor two was named ‘agronomic yield related traits’ and
contributed 24% of the variance based on the traits: early vigor, weed competition, lodging
tolerance, height, threshing ease, yield, number of kernels/spike, and straw quality. Although
seed price is not an agronomic factor, it was located in factor two (perhaps because higher
yielding varieties are associated with higher priced seed). The two traits from factor three,
tolerance to rust disease and grain size, contributed enough variation to be considered their own
factor and represent 19% of the total variation. A fourth factor, named harvest traits, holds
relatively less weight than the other factors (15%). This is not to minimize the importance of
these traits which contribute significantly to yield losses if a variety shatters too easily or if it has
a short storage life. Examination of the harvest traits were outside the scope of this study but it
would make for an interesting future study to measure harvest losses by variety and how this

66
influences adoption of new varieties that have longer storage capacity or more resistance against
moisture and insects.
The six traits used to create hypothetical varieties for the conjoint study were selected from these
factors. The traits were selected based on their factor loading weight from their category and the
total across all categories (see Table 11). In addition, the trait should be singular and objective.
For instance, the traits ‘dabo color’ and ‘injera color’ have strong factor loadings but it would be
very difficult to isolate only the single color trait when asking a respondent to evaluate the color
of dabo or injera without evaluating the entire product (which includes other traits like fluffiness,
pore size, eye size, crumbliness, softness). However, the color of grain is directly attributable to
the color of the end product and is therefore the preferred option for gauging respondent
perceptions. As revealed in the focus group discussions, ‘dabo quality’ and ‘soft dabo’ are
subjective traits that are based on each individual’s opinion and would be problematic to quantify
using conjoint analysis techniques so these were avoided in the design. Of the remaining traits
with the highest factor loadings in the ‘Quality’, ‘Agronomic’ and ‘Disease resistance’ categories
the following six traits were used in the conjoint analysis design:
1) Rust tolerance
2) Number of tillers
3) Number of kernels per spike
4) Seed price
5) Grain size
6) Grain color

67
Table 11 Factor loadings from factor analysis reveal the degree to which each of the trait
characteristics contributes to each factor
Wheat trait
characteristics
Factor 1
‘Quality’
Factor 2
‘Agronomic/Yield’
Factor 3
‘Disease Resistance’
Factor 4
‘Harvest’
Early vigor 0.136871 0.536989 -0.173806 -0.007839
Weed competition 0.068058 0.544188 -0.164107 0.087723
Rust tolerance 0.100800 0.116205 0.585459 -0.162507
Lodging resistance 0.016051 0.436972 0.131496 0.063528
Height 0.181743 0.183280 0.090135 0.111312
Harvest ease 0.149039 0.092128 -0.004016 0.541822
Shatter resistance -0.013887 -0.155153 -0.209458 0.835727
Threshing ease 0.086394 0.406100 -0.097772 -0.498142
Storage length 0.041506 0.119543 0.250869 0.343355
Yield ‘number of tillers’ 0.291070 0.685952 -0.071647 -0.163041
Length of spikes 0.282895 0.117445 0.126350 0.069647
# of kernels/spike 0.349311 0.647812 0.066008 -0.007478
Seed price 0.028998 0.418740 0.088614 -0.000353
Grain size 0.427512 -0.014445 0.582804 0.190401
Grain color 0.520158 0.065128 0.289921 -0.074731
Flour volume 0.461980 0.123945 0.082954 0.293381
Dabo quality 0.860169 0.097828 0.010983 -0.062658
Flour H2O absorption 0.626151 0.081162 0.006768 0.125547
Dough elasticity 0.551116 0.124484 -0.067270 0.273395
Injera eye size 0.587791 0.292162 -0.490549 -0.038776
Soft dabo 0.803145 0.114145 0.012156 -0.104813
Dabo color 0.756840 0.205007 -0.091630 0.023614
Injera color 0.652102 0.238687 -0.480123 -0.056551
Straw quality 0.256394 0.411376 -0.538036 -0.136566
3.4 Conjoint analysis
The results of the cluster analysis and conjoint analysis are presented for the overall population
and for each cluster in Tables 12 and 13 and the most preferred levels are displayed in Table 14.
Table 12 shows the preference coefficients for the trait levels and the strength of each trait’s
relative importance given by the overall population and the seven clusters. Figure 4 shows a
graphic illustration of the strength of importance each cluster gives to the six traits. Table 13
presents the demographic, management, and perception information which is used to

68
characterize membership in a cluster. Table 14 shows the percent of respondents that have
specified each trait level as most preferred.
Table 12 Strength of preference, relative importance, and adjusted R2 for the overall population and
each cluster. The overall population had the strongest preference for the number of tillers trait with 8
tillers being their preferred level. Each cluster values the individual traits and levels differently.
Average preference coefficients, relative Importance, and adjusted R2
Attributes and levels Overall Cluster I Sub-Cluster I Cluster II Sub-Cluster III Cluster III Cluster IV Cluster V
N 305 56 16 36 9 51 45 92
Share of 305 participants
(%) 100% 18% 5% 12% 3% 17% 15% 30%
Intercept 2.58 2.27b*
1.69c*
2.23bc*
3.54a*
2.98a*
2.21bc*
2.93a*
Number of Productive T illers
8 0.68 0.86b*
1.58a*
0.62c
0.32cd*
0.65c
0.38d*
0.65c
5 0.19 0.10b
0.2b
-0.06b*
0.31ab
0.02b*
0.07b*
0.48a*
2 -0.87 -0.96bc
-1.78d*
-0.56a*
-0.63ab
-0.68a*
-0.45a*
-1.13c*
Relative importance (%) 26.68 26.12bc
35.34a*
21.05cd*
21.39bcd*
28.99ab
17.06d*
31.66a*
Density of kernels
Lax -0.43 -0.61d*
-0.79d*
-0.64d*
0.37a*
-0.13b*
-0.41c
-0.44c
Dense 0.43 0.61a*
0.79a*
0.64a*
-0.37d*
0.13c*
0.41b
0.44b
Relative Importance (%) 14.61 17.45a*
16.55ab
18.17a*
10.8ab
10.4b*
13.15ab
14.56a
Rust Disease Resistance
Susceptible -0.60 -0.35a*
-0.84c*
-0.59bc
-0.75bc
-0.56b
-1.24d*
-0.4a*
Resistant 0.60 0.35d*
0.84b*
0.59bc
0.75bc
0.56c
1.24a*
0.4d*
Relative Importance (%) 19.33 11.4e*
17.63bcde
16.82cd*
22.55bc
23.01b*
38.12a*
13.88de*
Seed size
Small -0.23 -0.64d*
-0.41c*
-0.04ab*
0.15a*
-0.26c
-0.02ab*
-0.14b*
Large 0.23 0.64a*
0.41b*
0.04cd*
-0.15d*
0.26b
0.02cd*
0.14c*
Relative Importance (%) 9.53 17.91a*
8.91bc
4.73c*
6.57bc*
11.65b*
5.75c*
7.37c*
Seed color
Red -0.32 -0.47c*
-0.44c
-0.82d*
0.46a*
-0.19b*
-0.21b*
-0.22b*
White 0.32 0.47b*
0.44b
0.82a*
-0.46d*
0.19c*
0.21c*
0.22c*
Relative Importance (%) 11.13 13.21b*
8.99bc
23.68a*
12.6bc
8.57c*
7.79c*
8.22c*
Price of seed
650ETB/100kg -0.35 -0.3b
0.45a*
-0.29b
-0.96c*
-0.32b
-0.4b
-0.47b*
850ETB/100kg -0.02 0.36a*
0.21ab*
-0.01bc
0.26ab*
-0.05c
0.06bc
-0.33d
1050ETB/100kg 0.37 -0.06c*
-0.65d*
0.3b
0.69ab*
0.38b
0.34b
0.81a*
Relative Importance (%) 18.73 13.92c*
12.58c*
15.55c*
26.1ab
17.38bc
18.13bc
24.3a*
Adjusted R2
0.55 0.56ab
0.6ab
0.54ab
0.41ab
0.47b*
0.59a
0.58a
* Significantly different (p<0.10) from overall sample in a two-tail t test or z test, as appropriate.
a, b, c, d, e Means with different superscripts are significantly different at alpha=0.10 in Tukey-Kramer HSD

69
Cluster I (18%)
Sub-Cluster I (5%)
Cluster II (12%)
Sub-Cluster III (3%)
Cluster III (17%)
Cluster IV (15%)
Cluster V (30%)
0
5
10
15
20
25
30
35
40
Re
lati
ve
Imp
ort
an
ce (%
)
Relative Importance of Traits by Cluster
Figure 4 The graph shows color-coded bars that represent the seven clusters (the transparent red and yellow columns represent the small
n sub-clusters that are combined with the clusters of matching colors for later analysis). The height of each bar represents the weight of
importance that each cluster gives to the different traits. As evidenced by the graph, there are seven market segments with distinct trait
preferences.

70
Table 13 Summary of the average demographics, management, and perceptions for the overall
population and each cluster. The highlighted boxes show which factors differ significantly from the
cluster mean compared to the mean of the overall sample and the other clusters.
Overall Cluster I Sub-Cluster I Cluster II Sub-Cluster III Cluster III Cluster IV Cluster V
N 305 56 16 36 9 51 45 92
Share of 305 participants
(%) 100% 18% 5% 12% 3% 17% 15% 30%
Demographic and Usage Info
Hatee Handodee 26% 23%bc
88%a*
25%bc
56%ab*
14%c*
42%b*
12%c*
Oda Jilaa 30% 43%ab*
13%bc
50%a*
11%abc
49%a*
9%c*
17%c*
Gonde Finchama 25% 20%bc
0%c*
22%abc
0%bc*
8%c*
44%a*
36%ab*
Boru Lencha 20% 14%bc
0%bc*
3%c*
33%abc
29%ab*
4%c*
35%a*
Age 42.57 43.54a
41.81a
43.78a
42.67a
40.61a
43.42a
42.29a
Cell phone 47% 55%ab
81%a*
31%b*
33%ab
39%b
49%ab
47%ab
Total Ha 2.15 2.39a
2.14a
2.10a
2.00a
1.93a
2.21a
2.14a
Ha owned 1.67 1.70a
1.59a
1.70a
1.61a
1.43a*
1.77a
1.74a
Ha rented in 0.47 0.67a
0.47a
0.40a
0.39a
0.50a
0.43a
0.40a
Yield Kun/ha 32.24 31.57a
32.49a
32.32a
29.21a
32.56a
34.11a
31.78a
MHH 52% 59%ab
81%a*
44%ab
78%ab
45%ab
58%ab
43%b
FHH 23% 18%a
19%a
28%a
11%a
29%a
22%a
23%a
F not HH 25% 23%ab
0%b*
28%ab
11%ab
25%ab
20%ab
34%a*
Wealth Index 40400 48125a
40999a
39257a
32354a
37165a
38462a
39569a
Red/white same nutrition 10% 14%b
50%a*
3%b
0%b
4%b
2%b*
10%b
Red grain > nutrition 15% 18%a
0%a*
11%a
33%a
20%a
7%a
17%a
White grain > nutrition 75% 68%bc
50%c*
86%ab
67%abc
76%abc
91%a*
73%abc
# of hand weedings 1.74 1.66a
1.63a
1.81a
1.44a
1.69a
2.02a*
1.71a
# of spray weedings 1.68 1.68a
1.63a
1.86a
1.33a*
1.59a
1.71a
1.70a
DAP in kg/ha 99.25 102.14a
87.50a
99.31a
88.89a
100.10a
88.89a*
105.11a
Urea kg/ha 15.35 17.50a
6.28a*
23.61a*
9.44a
16.57a
13.33a
13.28a
Compost kun/ha 27.98 34.45a
39.94a
22.39a
22.78a
23.78a
34.53a
23.77a
Sprout > once in 10 yrs 38% 36%a
63%a*
33%a
56%a
33%a
53%a*
32%a
Same resistance to sprouting 10% 7%bc
38%a*
3%bc
0%bc
8%bc
2%c*
17%ab*
Red > resistant to sprout 64% 66%a
50%a
69%a
78%a
69%a
71%a
57%a
White > resistant to sprout 25% 27%a
13%a
28%a
22%a
24%a
27%a
26%a
Rust > once in 10yrs 18% 21%a
31%a
11%a
22%a
16%a
27%a
12%a
Fungicide L/ha 0.74 0.60a*
0.50a*
0.66a
0.67a
0.82a
0.68a
0.88a*
Fungicide birr/liter 395.10 401.43a
331.38a
415.56a
294.44a
411.18a
390.96a
397.27a
Use straw roofing 84% 75%bc*
56%c*
97%a*
89%abc
88%ab
84%ab
87%ab
# in family educ'd >grade 8 1.51 1.86a
1.00a
1.06a*
0.89a
1.49a
1.80a
1.50a
Off farm income 24% 27%a
6%a*
14%a
11%a
25%a
20%a
33%a*
Prefer higher prices 64% 63%ab
13%c*
69%ab
33%bc*
71%ab
49%b*
79%a*
* Significantly different (p<0.10) from overall sample in a two-tail t test or z test, as appropriate.
a, b, c, d, e Means with different superscripts are significantly different at alpha=0.10 in Tukey-Kramer HSD

71
Table 14 The percentage of respondents from the overall population and each cluster that have
rated the corresponding trait level as their ‘favorite’. Note the highlighted boxes revealing the
percent of respondents that preferred such trait levels as lax, small, red, susceptible seed.
Percentage of respondents
Traits and Levels Overall Cluster I Sub-Cluster I Cluster II Sub-Cluster III Cluster III Cluster IV Cluster V
Number of Productive Tillers
8 77 89 100 81 56 94 64 64
5 18 9 0 8 33 6 18 36
2 5 2 0 11 11 0 18 0
Density of kernels
Lax 12 7 0 0 89 31 4 7
Dense 88 93 100 100 11 69 96 93
Rust Disease Resistance
Susceptible 8 21 0 6 11 6 0 7
Resistant 92 79 100 94 89 94 100 93
Seed size
Small 22 0 6 39 67 14 38 25
Large 78 100 94 61 33 86 62 75
Seed color
Red 14 7 0 0 100 8 27 16
White 86 93 100 100 0 92 73 84
Price of seed
650ETB/100kg 10 11 69 17 0 6 7 1
850ETB/100kg 25 63 31 28 33 18 29 1
1050ETB/100kg 65 27 0 56 67 76 64 98
Seven clusters were identified, each one defined by distinctive preferences for the different traits
and levels. However, two clusters are made up of only 16 and 9 members and I will refer to
these as sub-cluster I and sub-cluster III respectively in anticipation of the need to collapse the
number of clusters to five for certain analyses requiring larger sample sizes. Although small in
number, these members exhibit strong preferences that are unique to these clusters and the
distinct group demographics are worth studying. For these reasons, I have included the small
member clusters in the analysis for relative importance, demographics, and most-preferred level.
The multinomial logit model, however, cannot handle small cluster sizes. Therefore, I have used
five clusters for the multinomial logit model; hence the need to call them sub-clusters because
the members of these sub-clusters will be merged into their two larger clusters for the
multinomial logit analysis. Sub-cluster III is the smallest cluster with only 9 members and

72
eventually becomes part of cluster III, whereas sub-cluster I joins cluster I. Appendix 7 includes
a detailed illustration of the preference coefficients and relative importance from four clusters up
to nine clusters showing where each cluster splits.
Cluster I prefers large grain size
Cluster I, with 56 members, represents 18% of the sample and is characterized by a strong
preference for large grain size (see Table 12). Members of this group place the highest relative
importance (17.91%) on large grain size in comparison to all the other groups which ranged
between 4.73% and 11.65% relative importance. The preference for large grain is also
significantly larger than the overall population’s weighted importance of large grain size
(9.53%). The positive preference coefficient of 0.64 for large grain indicates that a wheat variety
with large grains would increase the average base rating (represented by the intercept) by 28%
on the Likert scale, holding all other variables constant. The percentage of respondents in Cluster
I (Table 14) that would choose large grain as their most-preferred level was 100% compared to
the other clusters that ranged from 33% to 86%.
In addition, Cluster I has a strong preference for the middle seed price of 850birr (Table 12).
This cluster gave an average relative importance of 13.92% for the seed price trait, and had the
strongest preference for the middle price, 850birr. The positive preference coefficient of 0.36 for
850birr denotes an increase of 16% in the average base rating for wheat varieties priced at
850birr. This was the only group that preferred the middle price range, giving both the lower
price and higher price a negative preference coefficient of -0.30 and -0.06 respectively. The
negative coefficients on these levels would decrease the base rating by 13% for low priced wheat
and 3% for high priced wheat. The results from Table 14 reveal that 63% of respondents from
73
cluster I would choose the 850birr price as the most preferred level, while only 27% prefer the
1050birr price and 11% prefer the 650birr price.
At 13.21%, grain color was of relatively lower importance compared to the other traits for this
group. However, Cluster I’s strength of importance for grain color significantly differed from
that of the overall population and clusters II, III, IV, and V. Ninety three percent of respondents
from cluster I preferred white as their grain color (Table 14).
This cluster rated the number of productive tillers with the highest relative importance of all the
traits (26.12%). Although the weight of preference for number of tillers is rated highly, it is
slightly lower than the overall average preference coefficient (26.68%) demonstrating that the
trait for number of tillers is strong among all groups and greater heterogeneity exists within the
other traits that set this group apart from the overall statistics and the other groups.
Cluster I gave rust disease resistance the lowest relative importance rating (11.4%) compared to
the other traits within this cluster and across the other six clusters. The overall sample placed
19.33% importance on rust disease resistance which proved to be significantly different than
cluster I’s rating. The relative importance for rust disease resistance was the lowest compared to
all the other clusters with a preference coefficient of 0.35 for rust resistance and -0.35 for
susceptibility, which would increase the average base rating by 15% for resistant wheat or
decrease the base rating by 15% for susceptible wheat. The strength of preference for rust
resistance was comparatively lowest among the seven clusters, with as much as 21% of the
sample favoring rust susceptibility as their preferred choice (Table 14).
This cluster did not differ significantly from the other clusters based on the demographic,
management, and perception of wheat grain/seed (Table 13).

74
Sub-Cluster I prefers high yielding, low price wheat seed
Sub-cluster I has the strongest preference for eight tillers compared to all the other clusters and
placed the most weight on tillers, kernel density, and rust resistance. Members of this group
placed 35.34% average relative importance on the tiller trait with a preference coefficient of 1.58
on eight tillers. This infers that their average base rating would almost double (94%) with the
specification of high tillering wheat varieties. Conversely, this same group places an even
stronger negative weighted coefficient on 2 tillers at -1.78. This would decrease the base rating
by 105%. This sub-cluster represents only 5% of the sample population and all 16 members
shared the same most-preferred levels on four out of the six traits (see Table 14), unanimously
choosing eight tillers, rust resistance, dense kernels, and white color as their preferred levels.
This group comprised the only members that had a strong preference for the lowest priced seed,
with a 0.45 preference coefficient compared to a range from -0.29 to -0.96 for the other clusters.
The weight of this coefficient would increase the base rating by 27% for wheat seed priced at
650birr. Some members (31%) showed a preference for the middle priced seed, with an average
coefficient of 0.21. Although there was a strong partiality towards low price, there was an even
stronger negative response to high priced seed. The 1050birr seed received a negative weight of -
0.65 which would decrease the average base rating by 39% for wheat priced at 1050birr.
According to Table 13, respondents in this group differed significantly from other clusters based
on gender (81% were male headed households and 0% were female not head of household), cell
phone ownership, the perception that grain color has an effect on grain nutrition, and the
perception that grain color does not affect sprouting resistance. In addition, this cluster has the
least number of members that use straw for roofing or who prefer high seed prices. It is
interesting that the group that places the highest importance on a large number of tillers also has
the least number of members that use straw for roofing. It was thought that one of the reasons

75
that farmers prefer varieties with many tillers is because they have alternate uses for the biomass,
such as roofing material. One explanation for this result could be that the members of this group
don’t use straw for roofing material because they sell straw or use it for different purposes.
Perhaps they don’t have enough straw and this is also why they place a strong value on high
tillering varieties because they need the straw. It could also mean that farmers value many tillers
for the presumed risk management that if there is a bad season, they will still get some
productive tillers.
Cluster I Multinomial Logit modeling
To have enough observations for solutions, the multinomial logit model combines cluster I with
the smaller sub-cluster I and quantifies the marginal effects of the demographic, management,
and perception variables on the probability of membership in this cluster as shown in Table 15.
The interpretation of the marginal effect of “cell phone” (a discrete variable) is that people that
own a cellphone are 13.5% more likely to be in cluster I. The probability of being in cluster I
increases by 22.9% for respondents from Odaa Jila. In addition, respondents are 19.1% less
likely to be in cluster I if they have a straw roof. Therefore, cluster I is represented by members
that prefer high yielding (eight tillers and dense, large seed) wheat varieties priced at 850birr, are
more likely to come from Odaa Jila than Boru Lencha, own a cellphone, and not have a roof
made from straw.

76
Table 15 Probability of cluster membership based on the effect of various demographic and
management variables. The dark grey boxes reveal the variables that contribute to cluster
membership within a 10% significance level (p<0.10) and the light grey boxes highlight variables
within a 20% significance level (p<0.20).
Marginal probabilities by cluster with respect to the vector of characteristics computed at the means
Variable Coefficient p value Coefficient p value Coefficient p value Coefficient p value Coefficient p value Mean
Constant 0.216 0.32 -0.377 0.12 0.208 0.31 -0.329 0.10 0.282 0.25
Age 0.001 0.86 0.001 0.48 -0.004 0.22 0.000 0.93 0.002 0.55 42.6
Cellphone 0.135 0.10 -0.070 0.14 -0.124 0.08 -0.024 0.59 0.083 0.32 47%
Total # of hectares 0.012 0.77 -0.007 0.79 -0.022 0.60 0.026 0.38 -0.008 0.85 2.15
Hatee Handodee 0.144 0.30 0.166 0.20 -0.135 0.24 0.082 0.41 -0.257 0.11 26%
Oda Jila 0.229 0.10 0.208 0.13 0.107 0.25 0.013 0.89 -0.558 0.00 30%
Gonde Finchama 0.063 0.65 0.165 0.20 -0.282 0.05 0.249 0.07 -0.196 0.12 25%
MHH -0.025 0.75 -0.032 0.41 0.057 0.40 0.026 0.59 -0.027 0.75 52%
Wealth index 0.000 0.60 0.000 0.49 0.000 0.62 0.000 0.88 0.000 0.81 40400
Red > nutritious -0.011 0.91 -0.020 0.69 0.040 0.61 -0.077 0.31 0.069 0.52 15%
Red > resist sprout -0.020 0.78 0.004 0.91 0.019 0.76 0.059 0.22 -0.062 0.42 64%
# of hand weeding 0.000 0.99 0.012 0.56 -0.003 0.94 0.051 0.07 -0.060 0.18 1.74
# of spray weeding -0.005 0.91 0.006 0.79 -0.066 0.17 -0.006 0.81 0.072 0.16 1.68
Urea kg/ha -0.001 0.53 0.001 0.16 -0.001 0.67 0.001 0.42 0.000 0.86 15.3
Sprout >1x in 10yrs -0.062 0.42 -0.018 0.62 0.044 0.48 0.050 0.29 -0.014 0.86 38%
No waterlogging in 10yrs -0.094 0.18 0.026 0.47 0.075 0.25 0.070 0.17 -0.077 0.31 69%
No drought in 10 yrs -0.033 0.68 0.012 0.76 0.036 0.65 0.061 0.24 -0.076 0.38 71%
No lodging in 10yrs -0.059 0.42 0.021 0.57 0.000 0.99 -0.010 0.82 0.047 0.55 70%
Rust >1x in 10yrs 0.045 0.64 0.030 0.60 0.083 0.35 0.064 0.28 -0.222 0.06 18%
Birr spent on fungicide -0.002 0.89 -0.002 0.85 0.026 0.09 -0.037 0.14 0.016 0.35 807
Wheat straw roof -0.191 0.04 0.167 0.16 0.102 0.26 0.002 0.97 -0.079 0.47 84%
# family educ'd>grade 8 0.023 0.31 -0.028 0.13 0.001 0.95 0.021 0.16 -0.017 0.52 1.51
Off-farm labor -0.010 0.90 -0.041 0.38 -0.015 0.82 -0.027 0.56 0.093 0.24 24%
Prefer high priced seed -0.155 0.22 -0.047 0.53 -0.034 0.73 -0.125 0.19 0.360 0.02 64%
n & respondent share 72.000 24% 36 12% 60 20% 45 15% 92 30%
n predicted 34 11 21 20 59
% correct 47% 31% 35% 44% 64%
Multinomial logit model likelihood ratio statistic: chi-squared=188, df=92; p<0.0000
Cluster IV Cluster V Cluster I Cluster II Cluster III
In this case, the demographic information was relatively closely correlated to cluster membership
but it is not very descriptive or explanatory. The multinomial logit model was able to correctly
predict 47%, or 34 out of 72, of the respondents in this cluster based on their demographic
information. The model incorrectly predicted that 11%, 13%, and 26% of members would be in
clusters III, IV, and V respectively. Since the actual membership in a cluster is determined by
the similarity of preferences, it is not surprising that the correlation of multinomial logit results
are low considering the demographic, management, and perception responses are used as proxy
variables to explain those preferences. Many of the demographic questions were asked with the

77
expectation that they may explain preferences for the different traits. For example, the color of
grain was known to be an important trait so, questions about the perception of color in relation to
nutritional content and sprouting resistance were intended to draw out an explanation based on a
preference for either white or red grain. I asked about straw roofs to see if this variable might be
able to explain a preference for wheat with many tillers. The multinomial logit model does not
always confirm these assumptions but in some cases the demographic responses are a good
explanatory variable.
For cluster I, it is difficult to know why people that prefer high yielding, average price wheat
seed are more likely to have a cell phone but it could be that they are market oriented
commercial farmers that use their phones as a source to obtain market information. Likewise, the
fact that cluster I prefers many tillers but is less likely to have a straw roof could be due to a
current lack of sufficient straw and, hence, the desire for varieties that produce more straw.
However, such interpretations would need to be based on further questioning of the respondents.
There could be many underlying reasons for preferring different traits and it is not possible, or
even helpful, to include them all or to speculate. More extensive knowledge of Ethiopian culture
and farming, however, could provide better insight into why certain demographics, like owning a
cell phone or having a straw roof, would explain membership in a specific cluster.
Cluster II prefers white grain
Cluster II is made up of 36 respondents, 12% of the sample, that have an overwhelming
preference for white grain. The membership in this segment is strong as this is the only cluster
that remained unchanged when moving from four clusters to nine clusters (see Appendix 7).
This cluster gave grain color a 23.68% relative importance over the other traits, with a preference
coefficient of 0.82 for white grain (Table 12). This denotes an increase of 37% in the average

78
base rating for wheat with white grains. All 36 respondents preferred white grain over red grain
(Table 14).
This cluster also had the strongest preference of any cluster for density of kernels at 18.17%
relative importance (Table 12). Kernels arranged densely on the spike were preferred with a
preference coefficient of 0.64 for dense and -0.64 for lax, meaning the base rating would either
increase or decrease by 29% depending on whether the wheat variety had a dense or lax kernel
structure.
Cluster II valued tillers and rust resistance at only 21.05% and 16.82% relative importance
respectively, which were both significantly lower than the average relative importance of the
overall sample. Seed price was given a relative importance of 15.55%, with the high price of
1050birr as the only positive coefficient at 0.30. A price of 1050birr for 100kg of seed would
increase the average base rating by 14%, whereas the lowest priced seed of 650birr would
decrease the base rating by 13%. The middle price range of 850birr had a negative coefficient of
-0.01 which has a minimal effect on the base rating (0.5%) but, interestingly, 28% of respondents
from this cluster chose 850birr as their most preferred level and 17% chose 650birr as their most
preferred level (Table 14). Cluster II placed the least amount of importance on grain size at
4.73% relative importance. Although there was a low amount of importance on this trait, the
members were most divided in their preferred level for grain size, 39% would prefer small grain
versus 61% preferring large grain.
Cluster II differed in a few demographic variables (Table 13) from the overall sample and other
clusters. The most notable descriptive characteristics were that they were least likely to own a
cellphone (only 31% had cell phones), and 97% had straw roofs.

79
Cluster II Multinomial Logit Model
Using the multinomial logit model, a few more variables were identified as significant factors
influencing membership in cluster II that were not identified in the demographic statistics. And
some of the aforementioned variables were not considered significant using this model. For
instance, the perception of white grain as more nutritious was not significant at the 20%
significance level using multinomial logit. Referring to the model in Table 15, cell phone, village
location, amount of urea, straw roofing, and number of family members with an education level
above grade 8 were significant determinants of membership in cluster II. In order to discuss
influential variables in cluster II, it was necessary to look at p-values up to 0.20. In this case, the
multinomial logit model was a weak predictor of membership. The model correctly predicted
only 31% of the respondents to be in cluster II. A weak multinomial logit model may not be
unreasonable given that respondents were assigned membership to this cluster based solely on
the similarity of preference for white grain and it may be overly ambitious to expect their
demographic information to serve as strong proxy variables.
The marginal effects were negative for the characteristics ‘cell phone’ and ‘number of family
members with education level above grade 8’. This is interpreted for a discrete variable, like cell
phone, as the probability of membership decreasing by 7% for respondents that own a cell
phone. This cluster was comprised of 56% female respondents and 44% male respondents which
could explain the decrease in probability of cluster membership based on cell phone ownership
(fewer females own phones). However, the marginal effect of gender was not identified as
significant which suggests that there are complex characteristics shared by people that own a cell
phone that are not drawn out by the other variables like age, gender, etc. For a continuous
variable, like number of family members educated above grade 8, the interpretation is that for

80
every additional family member with higher than grade 8 education, the likelihood of being in
cluster II decreases by 2.8%.
The marginal effect is small for the continuous variable ‘amount of urea usage’, accounting for
only a 0.1% increase in the probability of membership in cluster II for every 1kg per hectare
increase in urea application. Respondents from Odaa Jila were 20.8% more likely to be in cluster
II relative to those from Boru Lencha and having a roof made from straw increased the
probability of membership in this group by 16.7%.
Sub-cluster III dislikes 650birr price and prefers lax, small, red wheat grain
Sub-cluster III in the seven cluster set was a very small cluster, comprised of only nine members
(3% of the sample population), but it was so extremely different from the rest of the groups, it
was worth examining. This cluster tended to prefer the opposite trait level from every other
cluster. The members of this group placed the most importance on price, with a strong disliking
for the lowest price of 650birr. The 650birr price level received a preference coefficient of -0.96
meaning that the average base rating would decrease by 27% at the 650birr price level. None of
the members of this cluster chose 650birr as their first choice (33% chose 850birr and 67% chose
1050birr, from Table 14). Respondents preferred high priced seed giving it a preference
coefficient of 0.69, which would increase the average base rating by 20%.
This cluster was the only group that preferred red grain color, small grain size, and lax kernel
structure. The relative importance for grain color was 12.6%, which was the third highest relative
importance across the seven clusters. The coefficient was 0.46 for red grain, which would
increase the base rating by 13% and white grain would decrease the average base rating by 13%.
Every respondent in this cluster preferred red colored grain. Seed density received 10.8% relative
importance with a positive coefficient of 0.37 for lax grain, increasing the base rating by 11%.

81
Fully 89% of respondents preferred lax grain as their first choice. Grain size had the smallest
relative importance of all the traits at 6.57% importance. Wheat varieties with small grains
increase the rating by 4%.
Sub-cluster III valued the tillers trait at 21.39% relative importance. This group had similar
preference coefficients for eight tillers (0.32) and five tillers (0.31) and a strong negative
coefficient for two tillers (-0.63). This signifies an increase of 9% in the base rating for either
five or eight tillers and a rating decrease of 18% for wheat varieties with two tillers.
Referring to Table 13, this group did not differ significantly from the other groups based on their
demographics, management, or perception of wheat grain/seed. It is possible that the results are
not significant due to the small sample size of this group. Nonetheless, this cluster is composed
of members with unique preferences for the opposite trait level compared to other respondent
preferences and this was worth examining further through the Tukey-Kramer HSD (honestly
significant difference) test to find which means are different from each other. In a five cluster
model, sub-cluster III joins to become part of the larger cluster III and much of its uniqueness is
lost. The multinomial logit analysis will be discussed with cluster III.
Cluster III has typical preferences
Cluster III represents 17% of the sample with 51 members. Members of this group placed the
highest relative importance on the traits for number of tillers (28.99%), rust disease resistance
(23.01%), and seed price (17.38%) (Table 12). However, this cluster’s preferences were more
evenly distributed across the traits and did not place the highest weight of importance on any one
trait unlike the other clusters that had a strong preference for single traits. This segment had a
strong negative preference coefficient for two tillers (-0.68) versus 0.02 for five tillers and 0.65
for eight tillers. Therefore, a low tillering wheat variety would decrease the average base rating

82
by 23% whereas a level of five tillers increases the rating by only 0.7% and eight tillers by 22%.
A full 94% of respondents preferred eight tillers and none preferred two tillers. Likewise, 94%
of members in cluster III preferred rust resistant wheat, which had a preference coefficient of
0.56 resulting in a 19% increase on the base rating. This group strongly preferred wheat priced at
1050birr and almost equally disliked the lowest price of 650birr. Cluster III also preferred dense
kernels and large, white grains although the relative importance was not as strong for these traits
(10.4%, 11.65%, and 8.57% respectively).
Referring to Table 13, cluster III did not differ significantly from other groups. I will discuss the
demographic variables in more detail in the multinomial logit section.
Cluster III Multinomial Logit Model
Sub-cluster III and cluster III were joined together for multinomial logit analysis due to the small
sample size of sub-cluster III. The multinomial logit model was relatively weak for this cluster,
correctly predicting membership for only one out of three actual members of cluster III. The
model incorrectly predicted that 20% of the members would be in cluster I, 10% would be in
cluster II, 7% would be in cluster IV, and 28% would be in cluster V based on their demographic
characteristics.
According to Table 15, the demographic variables that were significant (p<0.10) for cluster III
included cell phone, village location, and the cost of fungicide. Ownership of a cell phone by the
respondent decreased the likelihood of membership in cluster III by 12%. Similarly, respondents
in cluster III were 28% less likely to come from the village of Gonde Finchama than Boru
Lencha. The cost of fungicide was calculated based on each member’s response to the number of
liters of fungicide used multiplied by the cost of a liter of fungicide. Fungicide cost is a
continuous variable and the marginal effects tended to be small, with the probability of

83
membership increasing by 2.6% for every additional 500birr (roughly 1L) spent on fungicide.
This cluster placed 23% importance on rust resistance and spent the most on fungicide,
confirming this statistic.
Cluster IV prefers rust resistant wheat
Cluster IV has 45 members, comprising 15% of the total population. This cluster
overwhelmingly prefers rust resistance to all other traits, giving it a relative importance of 38%.
The preference coefficient for rust resistance is 1.24 which increases the average base rating by
56%. Conversely, this group’s rating would decrease by 56% for wheat that is susceptible to rust.
Fully 100% of members in cluster IV preferred rust resistant wheat varieties.
Cluster IV placed 18% relative importance on seed price, weighting the highest 1050birr price
with a preference coefficient of 0.34. A price of 1050birr would increase the average base rating
by 15% while the lowest price of 650birr decreased the base rating by 18%. Sixty four percent of
respondents preferred the highest price, while 29% preferred the middle price and 7% preferred
the lowest price of 650birr.
In comparison to all the other clusters, this cluster placed the lowest relative importance on
number of tillers (17%) and seed color (8%). Members had a stronger disliking for wheat with
two tillers, giving it a preference coefficient of -0.45, while five tillers and eight tillers received
0.07 and 0.38 preference coefficients respectively. This means that wheat with two tillers
decreases the average base rating by 20% while wheat with five tillers increases the rating by
only 3% and eight tillers increases the rating by 17%. Grain color had a 9.5% effect on the base
rating with white being the preferred color for 73% of the respondents. Members of cluster IV
gave grain size the lowest relative importance of 6% with a preference coefficient of 0.02 which
changes the base rating by 0.9%. Large grain was the preferred level for 62% of the respondents.

84
The demographics, management, and perceptions of the members of cluster IV differed from
other clusters and the overall sample based on perception that white grain is more nutritious, and
the perception that resistance to sprouting is not the same for both red and white seed.
Cluster IV Multinomial Logit Model
The only two variables that were significant at p<0.10 were village location and number of hand
weedings. I extended the p-value to allow up to a 0.20 significance level and the variables for
fungicide cost, number of family members educated above grade 8, and preference for high
prices became significant. The marginal effects are interpreted such that members of cluster IV
were 25% more likely to come from Gonde Finchama than Boru Lencha. Hand weeding is a
continuous variable and is thus interpreted as, for every additional hand weeding, respondents
are 5% more likely to be assigned to cluster IV. Unlike cluster III that also valued rust resistance
relatively strongly, the marginal effects for cluster IV showed that members were 3.7% less
likely to be assigned to this cluster for every unit increase in fungicide cost. Furthermore, for
every additional family member that is educated above grade 8, the probability of being in
cluster IV increases by 2.1%.
The multinomial logit model was a relatively good fit for cluster IV, correctly predicting
membership for 45% of the respondents in this group. The model predicted 22% of members to
be in cluster I, 7% to be in cluster II, 4% to be in cluster III, and 22% of members to be in cluster
V.
Cluster V prefers high seed price
Cluster V was the largest segment containing 92 members or 30% of the sample population. This
cluster placed 24% relative importance on seed price with a strong preference coefficient of 0.81

85
on the highest price of 1050birr. Wheat seed at this price would increase the average base rating
by 28% and was the preferred level for 98% of the members.
Cluster V seriously dislikes low tillering wheat varieties, giving tillering a relative importance of
32%. The preference coefficient for two tillers was -1.13, which would decrease the average base
rating by 39%. Members preferred eight tillers (22% increase in base rating) to five tillers (16%
increase in base rating) which follows the trend that with every additional tiller, the base rating
increases. None of the members preferred two tillers, while 36% preferred five tillers and 64%
preferred eight tillers.
The relative importance for rust resistance (14%), grain color (8%), and grain size (7%) were all
significantly less than the relative importance given to these traits by the overall sample. The
preference coefficient for small size (-0.14) decreases the rating by 5%, red color (-0.22)
decreases the base rating by 7.5%, and rust susceptibility (-0.40) decreases the rating by 14%.
There is a significant difference between the number of male head of households and female not
head of households between Cluster V and Sub-cluster I. The demographic statistics also show
that cluster IV has a significantly different preference for high prices when compared to the other
clusters.
Cluster V Multinomial Logit Model
The multinomial logit model for cluster V picked up several variables that were not recognized
as significant by the comparison of means tests in Table 13. All of the villages had negative
marginal effects, which is interpreted in relation to the left out variable, Boru Lencha.
Respondents in cluster V were 26% less likely to come from Hatee Handodee, 56% less likely to
come from Odaa Jila, and 20% less likely to come from Gonde Finchama than from Boru
Lencha.

86
For every additional hand weeding, respondents were 6% less likely to be assigned to cluster V
and for every additional spray weeding they were 7% more likely to fall into this cluster. In
addition, people that responded that they had a rust problem more than once in 10 years were
22% less likely to be in this group.
Given that this cluster preferred high prices in the variety rating exercise, logically, members
also chose high priced wheat over low priced wheat when given the choice between two
examples of the same variety with only a difference in price. The multinomial logit model
confirms this showing that members are 36% more likely to be in cluster V if they would prefer a
higher priced seed to a lower priced seed when all other traits were the same.
Based only on the demographic, management, and perception responses as explanatory variables,
the multinomial logit model correctly predicted 59 out of the 92 members for cluster V, for an
outstanding accuracy of 64%. The model incorrectly assigned 15% of the members to cluster I,
while 2% were assigned to cluster II, 11% were assigned to cluster III, and 8% to cluster IV.
Since this technique is adapted from consumer research where lower prices are generally
preferred, it came as some initial surprise that most clusters had an overwhelming preference for
high seed price. But, wheat farmers in Ethiopia produce the food they consume and sell any
excess to the market so it makes sense that they would prefer higher wheat prices that would
provide a high return on investment. This trend has also been observed in other studies (Kole et
al., 2009; Cox et al., 2011; Tempesta et al., 2010; Campbell et al., 2004) but there the preference
for high price may indicate an association between higher prices and better quality products.
Indeed, this phenomenon was confirmed by many of my respondents who claimed the reasons
they prefer higher seed prices is because they can sell wheat for seed at a higher price; or they
believe that a high seed price is an indication of superior quality. Respondents who claimed to
87
prefer the lower priced wheat seed as long as everything else was the same, said if they paid less
for wheat seed, they would have more money for other inputs, like fertilizer and fungicide.
4. Conclusion
Understanding consumer preferences is an important factor in predicting the uptake or adoption
of new products. This is a well known concept in the private industry but studies on consumer
preference are relatively less common in the public sector that produces wheat varieties in
developing countries. The majority of wheat breeding programs focus more on increasing yields
and less on consumer demand research. It is important to understand the needs of consumers and
how products can fill gaps in the existing market or how products can create demand for new
markets.
Wheat is an important staple crop in Ethiopia and many farmers depend on wheat as a
sustainable source of food and income. Ethiopia is a major producer of wheat although yields
remain well below the global and African average. Many constraints contribute to low yields
including the infestation of wheat rust diseases, a lack of sufficient seed production and
improved seed sources, inefficient management practices, and low adoption rates of improved
varieties. Although Ethiopia releases more varieties of wheat each year than most other African
nations, few of these varieties are widely adopted. Farmers in Ethiopia use wheat for many
purposes, and, therefore, they value high-yield attributes as well as baking quality, grain
marketability, and plant dry matter (used for animal fodder, fuel, roofing material, etc.). Limited
information is available on the degree to which different wheat traits influence farmers’
willingness to adopt a new variety. Given that gender and other demographic factors are thought
to influence variety perception, I chose the conjoint analysis method as an ideal technique to use

88
to define consumer preferences. Conjoint analysis is a statistical technique that is often used in
market research to determine how people value different traits that make up a whole product.
The technique is based on the premise that a farmer’s valuation of a product is a result of the
utility or satisfaction derived from the many traits that make up the product as a whole (Baker,
1998).
I first conducted focus group discussions and surveys with men and women farmers to determine
the traits that are most influential in their decision to grow a new variety. Four independent
categories were identified as important to farmers: 1) Quality traits, 2) Agronomic yield traits, 3)
Disease resistance, and 4) Harvest/storage traits. The six individual traits derived from the factor
analysis procedure that were used in the conjoint analysis survey represented 85 percent of the
variation and had the most influence in their category. These traits were:
1) Number of productive tillers per plant
2) Density of kernels per spike
3) Size of grain
4) Disease resistance
5) Grain color
6) Price of seed
Based on my pilot tests, the limits of the study were defined by the number of varieties farmers
could evaluate without becoming fatigued. The maximum number of varieties a farmer was able
to evaluate was 20 so I had to limit the number of traits to six so there could be several
combinations of these traits. For this reason, I did not examine harvest/storage traits in the
conjoint analysis study, but these traits clearly have an influence on farmer perception and would
be worth studying further.
The focus group discussion revealed many interesting quality traits including flour/dough
texture, water absorption, elasticity, stickiness, perceived protein content, color, smell, and

89
leavening time. The intention was to identify positive and negative baking quality traits related to
the final bread product by connecting objective traits associated with the grain, flour, and dough
to the subjective traits (taste/smell) of the end product. However, quality itself is a subjective
trait and a product that is ‘good’ for one person may be ‘poor’ for another person. In addition,
‘good’ quality traits of grain, flour, or dough did not necessarily equate to ‘good’ quality bread
even for the same respondents.
Some interesting traits were revealed from these discussions, including a perception of protein
content based on grain color and milling method. The focus group discussions highlighted the
variability of traits related to the different stages of processing and preparation. These
discussions also emphasized the complexities involved in testing for quality preferences based on
the subjective nature of organoleptic testing. The focus on quality testing was identified as a
topic for further research which could be useful to reveal the relationship between end-use
quality and adoption of improved varieties, as well as, the difference in quality preference
between men and women based on their gender roles.
Interviews about gender roles revealed many interesting insights into the perception of women as
farmers in Ethiopia. It is generally thought that a ‘farmer’ is the person who plows the land with
oxen. Women are not considered farmers because traditionally they are not allowed to plow the
fields. However, discussions with men and women farmers showed that women take part in
almost all farming activities in some role. For example, although women do not typically plow
the field with oxen, they are following behind the oxen and breaking up the large clods with hand
tools. In addition, women were previously thought to have no role in the application of chemicals
on farm but it became evident that women have a prominent role in this activity. It is women’s
responsibility to fetch the water that will be mixed with the chemicals and bring it to the field.
According to the manufacturer’s labels for the chemicals commonly used to combat rust disease,

90
fungicide tank mixes require from 200 liters to 1000 liters of water per hectare (Syngenta Tilt
250E Approved Instruction Pamphlet, 2010; Syngenta Mancozeb instruction label, 2007) and
may need to be applied several times throughout the growing season. The water source in a
village can be anywhere from several meters to several kilometers away from a farmer’s field or
house and this activity could be extremely physically demanding and time consuming for
women. An area for further research would be to examine more closely the roles of women in
chemical application and the amount of time spent delivering water to the field as this subject is
discussed relatively little in gender or wheat farming literature.
When asked to evaluate existing varieties, many women farmers showed a preference for older,
local, or obsolete varieties like Batu, Mada Walabu, Israel, Qamadii Guracha, Enkoy, Kei,
Romany BC, and Salmayo. There is a perception of better quality from local or older varieties in
preparing traditional dishes, home-made fermented beverages, ‘diffo dabo’, and as straw for
roofing material. The most preferred varieties for men were those with strong marketability and
high yield, such as, Kubsa, Digelu, Kakaba, Danda’a, Tusie, and Pavon 76. As a follow-up study,
it would be interesting to research the perceived quality versus the actual quality of familiar and
unfamiliar varieties. For instance, at the point when this research was conducted, very few
farmers that grow Kakaba and Danda’a have cooked these varieties because they are much more
valuable as seed based on the high demand for rust resistant varieties. Very little was known
about the product quality of these varieties and if they were likely to be widely accepted and
adopted based on their end-use quality. An analysis of their baking quality and acceptability may
provide valuable insight into the adoption of improved varieties.
For the conjoint analysis survey, 158 men and 147 women farmers were surveyed from four
villages in the Hetossa district to evaluate their preferences for six attributes of bread wheat:
number of productive tillers (2, 5, or 8); density of kernels per spike (lax or dense); resistance to

91
rust disease (resistant or susceptible); size of grain (large or small); color of grain (white or red);
and price in Ethiopian Birr per 100kg bag of seed (650, 850, or 1050). Male heads of household,
female heads of household and female non-heads of household were interviewed using gender-
responsive methods. A conjoint analysis of their responses to 18 trait combinations revealed that
the number of tillers was the most important attribute in the overall sample. However, cluster
analysis revealed seven distinct respondent segments characterized by primary preferences for
large grain, high yield/low-priced seed, white grain, small/red/lax grain, rust resistant seed, high-
priced seed, and a ‘typical’ segment that did not have primary preferences for any one trait but
had balanced preferences for the expected trait levels. Segment membership was weakly
correlated with gender, socio-economic status, usage factors, and constraints to production (e.g.
prevalence of rust disease and drought).

92
REFERENCES
Asrat S., Yesuf M., Carlsson F., Wale E (2009). Farmers’ Preferences for Crop Variety Traits:
Lessons for On-farm Conservation and Technology Adoption. Environment for
Development Discussion Papers. July 2009.
Agidie, A., D.G. Tanner, M. Liben, T. Dessalegne and B. Kebede (2000). Farmer
participatory evaluation of promising bread wheat production technologies in
northwestern Ethiopia, 380-390. In Eleventh regional wheat workshop for Eastern, Central
and Southern Africa, 18-22 Sep 2000, Addis Ababa, Ethiopia. CIMMYT, Addis Ababa,
Ethiopia.
Alemayehu, Z., R. Ensermu, B. Yaie., B. Girma, G. Taye and M. Hassena (1999). Farmers’
feedback on the status of released bread wheat varieties in Chilalo awaraja, Arsi Zone,
Ethiopia, 106-113. In Tenth regional wheat workshop for Eastern, Central and Southern
Africa, 14-18 Sep 1998, University of Stellenbosch, South Africa. CIMMYT, Addis
Ababa, Ethiopia.
Araus, J.L., G.A. Slafer, C. Royo, and M.D. Serret (2008). Breeding for Yield Potential and
Stress Adaptation in Cereals. Critical Reviews in Plant Science, 27: 377-412.
Baidu-Forson, J., B. R. Ntare, and F. Waliyar (1997). Utilizing conjoint analysis to design
modern crop varieties: empirical example for groundnut in Niger. Journal of Agricultural
Economics. 16(3):219-226.
Baker, G. A. (1998). Strategic implications of consumer food safety preferences – Consumer
concerns and willingness-to-pay. International Food Agribusiness. Mgt. Rev. 1 (4):451-
463.
Bakken, D. and Curtis L. Frazier (2006). Conjoint Analysis: Understanding Consumer Decision
Making. The Handbook of Marketing Research. Chapter 15. Pp 607-670.
Bandalos, D.L., and M.R. Boehm-Kaufman (2009). Four common misconceptions in exploratory
factor analysis in statistical and methodological myths and urban legends: Doctrine, verity
and fable in the organizational and social sciences. Lance, Charles E. (Ed.); Vandenberg,
Robert J. (Ed.). New York: Routledge. pp. 61–87.
Bayeh, B. (2010). Assessment of bread wheat production, marketing and selection of N-efficient
bread wheat (Tritium aestivum L.) varieties for higher grain yield and quality in North
Western Ethiopia. MSc thesis in Agriculture (Plant Breeding). Bahir Dar, Ethiopia: Bahir
Dar University.

93
Bayene, H., S. Franzeiz, and W. Mwangi (1989). Constraints to increasing wheat production in
Ethiopia’s small-holder sector. In D.G. Tanner, M. van Ginkel, and W.M. Mwangi (Eds.),
The Sixth Regional Wheat Workshop for Eastern, Central, and Southern Africa. Addis
Ababa, Ethiopia, October 2-6, 1989. Pp 284-293: International Maize and Wheat
Improvement Center (CIMMYT).
Bech, M., and D. Gyrd-Hansen (2005). Effects coding in discrete choice experiments. Health
Economics, 14:1079-1083.
Biffen R.H. (1931). The cereal rusts and their control. Trans British Mycol Soc, 16:19-37.
Bill and Melinda Gates Foundation (2008). Gender Impact Strategy for Agricultural
Development. Bill and Melinda Gates Foundation. June 2008.
Bishaw, Zewdie (2004). Wheat and Barley Seed Systems in Ethiopia and Syria. PhD thesis.
Wageningen University, Netherlands. 383pp.
Bishaw, Z., P.C. Struik, and A.J.G. Van Gastel (2010). Wheat Seed System in Ethiopia: Farmers’
Varietal Perception, Seed Sources, and Seed Management. Journal of New Seeds, 11:281-
327.
Bound J., C. Brown, and N. Mathiowetz (2001). Measurement error in survey data, in: Leamer
EE and Heckman JJ, eds., Handbook of Econometrics, Vol. 5, New York: North-Holland,
pp. 3705–3843.
Borlaug, N. E. (2008). Stem rust never sleeps. The New York Times, April 26, 2008
http://www.nytimes.com/2008/04/26/opinion/26borlaug.html [Accessed June 8, 2012].
Briggle, L.W. 1980. Origin and botany of wheat. In E. Häfliger, ed. Wheat documenta cibageigy,
p. 6-13. Basle, Switzerland.
Bushuk W. (1998). Wheat breeding for end-product use. Euphytica 100:137-145.
Catholic Relief Services (CRS). (2010). CRS Southern Africa: Guidelines for Gender-
Responsive Programming.
http://www.crsprogramquality.org/storage/pubs/general/SARO_Gender.pdf [Accessed June
28, 2012].
Cattell, R.B. (1966). The scree test for the number of factors. Multivariate Behavioral
Research, 1, 245-76.

94
Ceccarelli, S. (2012). Plant Breeding with Farmers: A technical manual. ICARDA, PO Box
5466, Aleppo, Syria. pp xi-126.
Central Statistical Authority (CSA). (2008). Agricultural Sample Survey 1998/99. Report
on Area and Production of Major Crops Volume 1. Statistical Bulletin 200. CSA,
Addis Ababa, Ethiopia. 111 pp.
Central Statistical Authority (CSA). (2011). Agricultural Sample Survey 2001/2002. Report
on Area and Production of Major Crops Volume 1. CSA, Addis Ababa, Ethiopia. 134
pp.
Chen, X.M. (2005). Epidemiology and control of stripe rust (Puccinia striiformis f. sp. tritici) on
wheat. Canadian Journal of Plant Pathology, 27: 314-337.
CIA World Factbook (2012). https://www.cia.gov/library/publications/the-world-
factbook/fields/2002.html [Accessed June 5, 2012].
CIMMYT (2011). Wheat – Global alliance for improving food security and the livelihoods of the
resource-poor in the developing world. Proposal submitted by CIMMYT and ICARDA to
the CGIAR Consortium Board. August 30, 2011.
Creswell, J. (2009). Research Design: Qualitative, quantitative, and mixed methods approaches.
Sage Publications.
Curtis, B. C. (2002). Wheat in the World. FAO: Plant Production and Protection. Pp. 567.
Curtis, B.C., S. Rajaram, and H. Gomez Macpherson (2002). Bread wheat: Improvement and
Production. FAO Plant Production and Protection Series No. 30.
Dahl B.L., W.W. Wilson, D.D. Johnson, and W. Nganje (2001). Valuation of New Spring Wheat
Varieties: Tradeoffs for Growers and End-users. Agribusiness and Applied Economics.
Report No. 473.
Di Falco, S., J. Chavas, and M. Smale (2006). Farmer Management of Production Risk on
Degraded Lands: The Role of Wheat Genetic Diversity in Tigray Region, Ethiopia. IFPRI,
Environment and Production Technology Division, Discussion Paper 153.
Doss, C.R. (1999). Twenty-Five Years of Research on Women Farmers in Africa: Lessons and
Implications for Agricultural Research Institutions; with an Annotated Bibliography.
CIMMYT Economics Program Paper No. 99-02. Mexico D.F.: CIMMYT

95
Doss, C., and M. Morris (2000). How does gender affect the adoption of agricultural
innovations? The case of improved maize technology in Ghana. Agricultural Economics,
25: 27-39.
Dubin, H.J., and J.P. Brennan (2009). Combating Stem and Leaf Rust of Wheat: Historical
Perspective, Impacts, and Lessons Learned. IFPRI Discussion Paper 00910.
Durable Rust Resistance in Wheat (DRRW) Phase II (2010). Proposal for Bill and Melinda
Gates Foundation. Cornell University Office of International Programs.
Ensermu, R., W. Mwangi, H. Verkuijl, M. Hassena and Z. Alemayehu (1998). Farmers’ wheat
seed sources and seed management in Chilalo awraja, Ethiopia. CIMMYT, Mexico and
IAR, Ethiopia. 36 pp.
Ethiopian Livestock Market Information System. Texas A&M University
http://www.lmiset.net/Pages/Public/Home.aspx [Accessed January 3, 2012].
FAO (1995). Women, agriculture and rural development, a synthesis report of the Africa region.
Rome.
FAO/SDWW (1998). Fact Sheet: Women - Users, Preservers and managers of agro-biodiversity.
First Version.
FAO (1999). Participation and Information: The key to gender-responsive agricultural policy.
http://www.fao.org/docrep/X2950E/X2950e02.htm [Accessed June 28, 2012.]
FAO (2002). World agriculture: towards 2015/2030. An FAO perspective, Rome
FAOSTAT (2009). Food and Agriculture Organization of the United Nations online database
http://faostat.fao.org
The Federation of Medical Women in Canada (FMWC) (2002). Gender and Health Glossary.
http://www.genderandhealth.ca/en/modules/introduction/introduction-glossary.jsp
[Accessed May 28, 2012].
Feldstein, H.S. and J. Jiggins (1994). Tools for the Field: Methodologies Handbook for Gender
Analysis in Agriculture. Kumarian Press: West Hartford, Connecticut.
Ferede, S., D.G. Tanner, H. Verkuijl and T. Gebre (2000). A study of the adoption of bread
wheat production technologies in Arsi zone, 411-426. In Eleventh regional wheat
workshop for Eastern, Central and Southern Africa, 18-22 Sep 2000, Addis Ababa,
Ethiopia. CIMMYT, Addis Ababa, Ethiopia.

96
Frank, E (1999). Gender, agricultural development and food security in Amhara, Ethiopia: The
contested identity of women farmers in Ethiopia. U.S. Agency for International
Development Ethiopia. http://pdf.usaid.gov/pdf_docs/PNACG552.pdf [Accessed June 2,
2012].
Gallo, A.E., S.W. Martinez, P.R. Kaufman, C. Price, C.R. Handy, A. Manchester, and M.
Denbaly (1996). Food Marketing Review, 1994-95. U.S. Dept. Agr., Econ. Res. Serv.,
AER-743, Sept. 1996.
Gavian, S. and Gemechu Degefa (1996). The profitability of wheat production in Ethiopia: The
case of Tiyo Woreda in Arsi Region. Ethiopian Journal of Agricultural Economics, 1
(1):38-62.
Glaser, Barney and Strauss, Anselm (1967). The discovery of grounded theory: Strategies for
qualitative research. New York: Aldine Publishing Company.
Grains Research and Development Corporation (2005). Cereal Growth Stages Guide. Australia.
http://www.grdc.com.au/uploads/documents/GRDC%20Cereal%20Growth%20Stages%20
Guide1.pdf [Accessed June 14, 2012].
Green, P. and V. Srinivasan (1978). Conjoint analysis in consumer research: Issues and outlook,
Journal of Consumer Research, vol 5, September 1978, pp 103-123.
Greene, W.H. (1995) LIMDEP version 7.9 User’s Manual. Plainview, NY: Econometric
Software.
Hair, J.F., W.C. Black, B.J. Babin, and R.E. Anderson (2010). Multivariate Data Analysis. New
Jersey: Prentice Hall.
ICARDA (2011). Strategies to reduce the emerging wheat stripe rust disease. International
Wheat Strip Rust Symposium, Aleppo, Syria, April, 2011.
http://icardablog.files.wordpress.com/2011/06/icarda-stripe-rust-research-to-action-
report_low-res1.pdf [Accessed May5, 2012].
Kennedy, E. and T. Reardon (1994). Shift to non-traditional grains in the diets of East and West
Africa: Role of women’s opportunity cost of time. Food Policy, 19(1):45-46.
Klawitter, M., J.H. Cagley, G. Yorgey, M.K. Gugerty, and L. Anderson (2009). Gender and
Cropping: Wheat in Sub-Saharan Africa. Technical document prepared for the Science and
Technology Team, of the Bill & Melinda Gates Foundation. University of Washington,
Evans School of Public Affairs. Pp. 1-5.

97
Kotu, B., H. Verkuijl, W. Mwangi, and D. Tanner (2000). Adoption of Improved Wheat
Technologies in Adaba and Dodola Woredas of the Bale Highlands, Ethiopia. Mexico,
D.F.: CIMMYT and the Ethiopian Agricultural Research Organization (EARO).
Kumar K. (1987). Conducting group interviews in developing countries. A.I.D. Program Design
and Evaluation Methodology Report No. 8. Washington, DC: U.S. Agency for
International Development.
Leonard, W.H. & Martin, J.H. (1963). Cereal crops. New York, NY, USA, MacMillan
Publishing.
Likert, R. (1932). A Technique for the Measurement of Attitudes. Archives of Psychology 140:
1–55.
Lilja, N., and J. Dixon (2008). Responding to the challenges of impact assessment of
participatory research and gender analysis. Experimental Agriculture, 44(1):3-20.
Masefield, A. (1998). Gender assessment of food security issues in Ethiopia. Contributions to
World Bank Food Security Study, November 1998.
Mason, Mark (2010). Sample Size and Saturation in PhD Studies Using Qualitative Interviews
[63 paragraphs]. Forum Qualitative Sozialforschung / Forum: Qualitative Social Research,
11(3), Art. 8, http://nbn-resolving.de/urn:nbn:de:0114-fqs100387.
McCarney, Roesmary A. (1991). "Household Food Security and the Role of Women in Africa,"
Third World Legal Studies: Vol. 10, Article 8.
McIntosh, R.A., Z.A. Pretorius (2011). Borlaug Global Rust Initiative provides momentum for
wheat rust research. Euphytica, 179: 1-2.
Mekbib, F. (1997). Farmer participation in common bean genotype evaluation: The case of
eastern Ethiopia. Experimental Agriculture, 33: 399–408.
Negatu, W., W. Mwangi, and T. Tesemma (1992). Farmers’ varietal preferences for durum
wheat in Ada, Lume, and Gimbichu woredas. Ethiopian Journal of Agricultural Science,
13: 88-100.
Negatu W., and A. Parikh (1999). The impact of perception and other factors on the adoption of
agricultural technology in the Moret and Jiru woreda (district) of Ethiopia. Agricultural
Economics, 21: 205:216.

98
Nuttonson, M.Y. (1955). Wheat-climatic relationships and the use of phenology in ascertaining
the thermal and photothermal requirements of wheat. Washington, DC, American Institute
of Crop Ecology.
Park, R. F., H. S. Bariana, and C. S. Wellings (2007). Preface. Australian Journal of Agricultural
Research, 58: 469.
Pedhazur, E.J. (1982). Multiple Regression in Behavioral Research: Explanation and Prediction,
second ed. Holt, Rinehart and Winston, New York.
Pena R.J., R. Trethowan, W.H. Pfeiffer, and M. Van Ginkel (2002). Quality (End-use)
Improvement in Wheat: Compositional, Genetic, and Environmental Factors. Journal of
Crop Production. Volume 5:1-37.
Pretorius Z.A., R.P. Singh, W.W. Wagoire, and T.S. Payne (2000). Detection of virulence to
wheat stem rust resistance gene Sr31 in Puccinia graminis f. sp. tritici in Uganda. Plant
Diseases, 84:203.
Pretorius, Z.A., C.M. Bender, B. Visser (2010). First Report of a Puccinia graminis f. sp. Tritici
Race Virulent to the Sr24 and Sr31 Wheat Stem Rust Resistance Genes in South Africa.
Plant Disease, 94: 784
SAS Institute Inc. (2009). JMP® 9 User Guide, Second Edition. Cary, NC: SAS Institute Inc.
Singh, R.P., H.M. William, J. Huerta-Espino, G. Rosewarne (2004). Wheat Rust in Asia:
Meeting the Challenges with Old and New Technologies. “New Directions for a Diverse
Planet.” Proceedings of the 4th
International Crop Sciences Congress, 26 Sept-1 Oct, 2004,
Brisbane, Australia.
Singh R., D. Hodson , Y. Jin, J. Huerta-Espino, M. Kinyua, R. Wanyera, P. Njau, R. Ward
(2006). Current status, likely migration and strategies to mitigate the threat to wheat
production from race Ug99 (TTKS) of stem rust pathogen. CAB Reviews: Perspectives in
Agriculture, Veterinary Science, Nutrition and Natural Resources 2006 1, No. 054.
Singh R.P., and R. Trethowan (2007). Breeding spring bread wheat for irrigated and rainfed
production systems of the developing world. In: Kang M, Priyadarshan PM (eds) Breeding
major food staples. Blackwell, Iowa, pp 109–140
Singh RP, Hodson DP, Huerta-Espino J, Jin Y, and Njau P (2008). Will stem rust destroy the
world’s wheat crop? Adv. Agron. 98:271–309.

99
Singh RP, Hodson DP, Huerta-Espino J, Jin Y, Bhavani S, Njau P, Herrera-Foessel S, Singh PK,
Singh S, and Govindan V (2011). The Emergence of Ug99 Races of the Stem Rust Fungus
is a threat to World Wheat Production. Annual Review of Phytopathology, 49:465–81.
Smale, M., Reynolds, M.P., Warburton, M., Skovmand, B., Trethowan, R.M., Singh, R.P., Ortiz-
Monasterio, I. & Crossa, J. (2002). Dimensions of diversity in modern spring bread wheat
in developing countries from 1965. Crop Science, 42: 1766–1779.
Sperling L., P. Cox, and A. Christinck (2010). Participatory Plant Breedeing and Gender
Reflections on the Period 2000-2010. Centro Internacional de Agricultura Tropical (CIAT).
Stakman, E. C., and J. G. Harrar (1957). Principles of plant pathology. New York: Ronald Press.
StataCorp (2009). Stata: Release 11. Statistical Software. College Station, TX: StataCorp LP.
Tano, K., M.D. Faminow, M. Kamuanga, and B. Swallow (2002). Using Conjoint Analysis to
Estimate Farmers Preferences for Cattle Traits in West Africa. Fondazione Eni Enrico
Mattei, Milano, Italy.
Tiruneh A, T. Tesfaye, W. Mwangi, H Verkuijl (1999). Gender Differentials in Agricultural
Production and Decision-Making Among Smallholders in Ada, Lume, and Gimbichu
Woredas of the Central Highlands of Ethiopia. Mexico, DF.: International Maize and
Wheat Improvement Center (CIMMYT) and Ethiopian Agricultural Research Organization
(EARO).
Tiruneh, A., T. Tesfaye, W. Mwangi, and H. Verkuijl (2001). Gender differentials in agricultural
production and decision-making among small-holders in Ada, Lume, and Gimbichu
woredas of the central highlands of Ethiopia. Mexico D.F.: International Maize and Wheat
Improvement Center (CIMMYT) and Ethiopian Agricultural Research Organization
(EARO).
White, J.W., D.G. Tanner, and J.D. Corbett (2001). An Agro-Climatological Characterization of
Bread Wheat Production Areas in Ethiopia. NRG-GIS Series 01-01. Mexico,D.F.:
CIMMYT.
World Bank (2012). World Development Indicators database, World Bank. [Accessed on 26
May 2012]. http://databank.worldbank.org/ddp/home.do?Step=12&id=4&CNO=2
Yesuf, M., M. Kassie, and G. Kohlin (2009). Risk Implications of Farm Technology Adoption in
the Ethiopian Highlands. Environment for Development

100
APPENDICES
Appendix 1 Positioning study survey
Positioning Study
Objective of study:
• Determine farmers’ familiarity with various wheat varieties
• Identify which varieties of wheat were grown in 2010 meher season (Sep. – Feb.)
• Document the planting intentions (likelihood of using certain varieties of wheat seed) for the
2011 meher season
• Construct a perceptual map of available wheat varieties
• Determine the position/image/niche of three new varieties (Danda’a, Kakaba, and Digelu)
• Compare the position of new varieties to existing varieties
The primary focus of the interview is to evaluate wheat varieties on the basis of perceptions about their
performance and image. Each respondent will be asked to compare two varieties according to how well
a list of about 35 descriptions fits each one. They will rate the descriptions of each variety on a 5-point
scale where 1 means the description “Does not describe the variety at all” and 5 means the attribute
“Describes the variety extremely well”.
The varieties evaluate by a respondent will be selected based on his/her self-stated familiarity with each
one. Farmers will classify them as being “very familiar”, “somewhat familiar”, “not very familiar”, and
“not familiar at all”. Varieties evaluated will be only those for which a respondent is “very familiar” or
“somewhat familiar”.
Informed Consent Introduction: Hello, I am Katie Nelson from Cornell University in New York. I am conducting research on
farmers’ perceptions of wheat varieties to better understand farmer needs. The results of this study will
be provided to the Ethiopian Institute of Agricultural Research and the Kulumsa Agricultural Research
Center to guide selection criteria for new varieties that will be suitable to farmers. Your participation is
completely voluntary, and at any time you can stop participation in any or all parts of the project.
What the study is about: This study seeks to better understand farmer preferences for wheat variety characteristics and the roles of women and men in wheat production so that this information can be used to influence breeder selection criteria and inform variety release procedures. What I will ask you to do: Should you agree to participate, you will be asked about your familiarity with wheat varieties and your intentions to grow different wheat varieties, then you will be asked to rank familiar varieties on their performance for important traits, and finally you will be asked about your role responsibilities in wheat production. The interview will take place in person with the researcher, subject (you) and a translator. Interviews typically last 1 hour. Risks and benefits: Participation in this study poses no risks to you beyond those faced in everyday life. A possible benefit is that this study may provide plant breeders important information to guide their selection criteria so that appropriate and farmer accepted wheat varieties are developed.
101
Compensation: There is no pay or other compensation for participation in this study. Confidentiality: Any personal information that could link you with the research data will remain confidential. If you have questions: The researcher conducting this study is Katherine Nelson. Please ask any questions you have now. If you have questions later, please contact Katherine Nelson at 0923 210933 or [email protected]. If you have any questions or concerns regarding your rights as a subject in this study, you may contact the Institutional Review Board for Human Participants (IRB) at www.irb.cornell.edu/[email protected]/ 607--‐255--‐5138. Voluntary Participation: Your participation in this study is completely voluntary. If you do decide to participate now, you can withdraw later at any time. Just contact Katherine Nelson and she will destroy records related to your participation. Statement of Consent: I acknowledge that I understand the above information, and have received answers to any questions I asked. I consent to take part in the study. The study has been described to me. I understand that my participation is voluntary and that I am free to withdraw my consent and discontinue my participation in the project at anytime without penalty. Your Signature ___________________________________ Date _______________________ Your name (please print): ________________________________________

102
Wheat Variety Positioning Study
Respondent name ____________________________________
Respondent # _______________________________________
Woreda____________________________________________
Kabele _____________________________________________
Age ____________
Size of land holding __________________________________
Male Female
Wheat varieties rated: Kubsa, Galema, Danda’a, Hawi, Simba, Kakaba, Pavon, Tusi, Israel, Digelu Districts (Woredas): Dodota (lowland), Hetossa (mid-altitude), Digelu Tijo (highland), Munessa (high altitude?)
Q1 How many hectares of wheat did you grow last year? ______________________________________
Q2 What variety or varieties of wheat did you grow? __________________________________________
Q3 How many quintiles of wheat were harvested last year (2002)? Gross __________________________
Q4 Was this an increase or a decrease from the previous year (2001)? _______ How much?___________
Q5 How much of your crop did you lose to yellow rust? ________________________________________
Q6 Did you apply fungicide? YES _______ NO _______
How many days after planting did you apply? _________________________________________
What type/s of fungicide did you use? _______________________________________________
How many times did you spray? ____________________________________________________
What was the total cost you spend on fungicide? Birr___________________________________
Q7 How many hectares of wheat will you grow this meher season? ______________________________

103
Q8 Please answer the following question with ‘very familiar’, somewhat familiar’, ‘not very familiar’, ‘not
familiar at all’:
Varieties: Very familiar Somewhat familiar
Not very familiar
Not familiar at all
Don’t know
Kubsa 1 2 3 4 5
Galema 1 2 3 4 5
Danda’a 1 2 3 4 5
Hawi 1 2 3 4 5
Simba 1 2 3 4 5
Kakaba 1 2 3 4 5
Pavon 1 2 3 4 5
Tusi 1 2 3 4 5
Israel 1 2 3 4 5
Digelu 1 2 3 4 5
Other (specify) 1 2 3 4 5
Q9 Now I would like for you to tell me how likely you are to use these different varieties of wheat this
year. Please rate how likely you are to use this variety on a scale of one to five where one means you are
not likely to use the variety at all and five means you are very likely to use the variety. You may use any
number between one and five, the higher the number, the more likely you are to use the variety. You
may rate several varieties highly if you are likely to grow more than one variety.
Variety Grew last year (from Q2) Likelihood to grow this year
Kubsa
Galema
Danda’a
Hawi
Simba
Kakaba
Pavon
Tusi
Israel
Digelu
Other (specify)

104
Wheat Variety Attribute Rating
(Ask ratings for up to three varieties of wheat based on respondents familiarity with wheat brands from
Q8)
Now I would like you to think about different kinds of wheat varieties. I’m going to read some
statements and would like you to rate up to three varieties of wheat on each statement. The varieties of
wheat are (insert varieties from Q8). As I read each statement, please tell me how well the statement
describes the variety using a scale from one to five.
A one means the statement “does not describe the variety at all” and a five means the statement
“describes the variety extremely well”. You may use any number between one and five, the more the
statement describes the variety, the higher the number you should give it.
The first statement is (insert statement). How well does this statement describe (insert first variety)?
How well does it describe (insert second variety)? (Repeat for each statement.)
Randomize statements Variety 1 Variety 2 Variety 3
• Has excellent early vigor
• Is competitive against weeds
• Is drought tolerant
• Is tolerant to wheat rusts
• Is tolerant to water-logging
• Is resistant to lodging / The stalk is strong
• Matures at the right time for my region and my needs
• Is the appropriate height for my needs (I am satisfied with the amount of straw residue)
• Is easy to harvest and bundle
• Does not shatter easily
• Is easy to thresh
• Stores well over time
• Has high yields
• Has long spikes
• Has a high density of kernels per head
• Responds well with low fertilizer rates
• Has consistent yields year after year
• Is trusted by other farmers in my area
• Presents a low amount of risk to me
• Seed is readily available when I need it
• Price of seed is a good value
• Has large grain size (TKW – Thousand Kernel Weight)
• Grain color is excellent for market sale
• Has a high flour volume per unit of grain (test weight)
• Has excellent baking quality for dabo
• Excellent water absorption of flour
• Dough has excellent elasticity
• Has a good ‘eye’ size for preparing injera
• Excellent malting quality

105
• Color is good for making tala
• Makes soft dabo
• The color of dabo is excellent
• The color of injera is excellent
• Has good quality straw for animal feed
1. Roles in Wheat Production
Tasks in Wheat Production Men Women Other (ie. children)
Land preparation
Planting wheat
Weeding
Applying fertilizers
Applying chemicals (fungicides, insecticides, herbicides, etc.)
Protecting crop from birds
Harvesting
Preparing the threshing site
Threshing
Winnowing
Preparing the gotera or degogo
Maintaining the gotera or degogo
Seed selection
Seed cleaning
Transporting grain to market
Selling grain (direct to buyers or to millers)
Milling grain for home consumption
Preparing and Cooking - Dabo - Injera - Nefro - Kinche - Kolo - Dabo kolo - Areke - Tala
Storing prepared products
Deciding which crops and varieties to grow
Purchasing or trading new varieties
Thank you very much for participating!

106
Appendix 2 Conjoint survey
Conjoint Survey
Objectives of study:
• We want to know how important certain traits are to farmers so we can provide wheat breeders with information on the tradeoffs farmers make among traits
• Farmer’s will evaluate 18 pictures of wheat (here called “varieties”) that vary in 6 traits or characteristics (here called “levels of attributes”)
• We will assess the strength of preference for the levels of each attribute and the relative importance of each attribute in farmer’s decision to grow a variety
• Farmers with similar preferences will be grouped into segments to help identify groups with specific likes and dislikes • Demographic and usage information will be collected to help explain membership in each segment
The primary focus of the interview is to evaluate farmers’ perceptions of the performance and desirability of bundles of wheat attributes. Each respondent will be shown 18 pictures described as potential “varieties” and asked to rate them based on their likelihood to buy them for planting, using a scale from ‘Definitely would NOT buy’ to ‘Definitely would buy’.
Informed Consent The researcher conducting this study is Katie Nelson from Cornell University in New York. If you have questions, please contact Katherine Nelson at 0924 548 555 or [email protected]. If you have any questions or concerns regarding your rights as a subject in this study, you may contact the Institutional Review Board for Human Participants (IRB) at www.irb.cornell.edu/[email protected]/ 607--‐255--‐5138.
What the study is about: This study seeks to better understand farmer preferences for wheat variety characteristics. The results of this study will be provided to the Ethiopian Institute of Agricultural Research and the Kulumsa Agricultural Research Center to help guide selection criteria for new varieties. Your participation is completely voluntary, and at any time you may stop participation in any or all parts of the project. Should you agree to participate, you will be asked to rate your preference for different wheat varieties on how likely you would be to buy this seed to grow. The interview will take place in person with the researcher, subject (you) and a translator. Interviews typically last 1 hour. Risks and benefits: Participation in this study poses no risks to you beyond those faced in everyday life. A possible benefit is that this study may provide plant breeders important information to guide their selection criteria in developing more and better wheat varieties for you and other farmers in your region. Confidentiality: Any personal information that could link you with the research data will remain confidential. Voluntary Participation: Your participation in this study is completely voluntary. If you do decide to participate now, you can withdraw later at any time. Just contact Katherine Nelson and she will destroy records related to your participation. Statement of Consent: I acknowledge that I understand the above information, and have received answers to any questions I asked. I consent to take part in the study. The study has been described to me. I understand that my participation is voluntary and that I am free to withdraw my consent and discontinue my participation in the project at anytime without penalty.
Name _____________________________ Date___________________________________

107
Survey on Wheat Attribute Preferences
Name__________________________________
Mobile number__________________________
Kebele _________________________________
Age _______ Respondent # ________________
Total hectare_____ Own______ Rented______
Hectare of wheat ________________________
Male Head of household (HH) Female HH Female not HH
Part I: We will show you 18 cards describing different wheat “varieties”. Please mark the line
based on how likely you are to purchase seed for each variety at the price listed.
Card 1
Definitely would NOT buy Maybe buy Definitely would buy
0………………..…….1………………..…….2………………..…….3………………..…….4………………..…….5………………..…….6
Card 2
Definitely would NOT buy Maybe buy Definitely would buy
0………………..…….1………………..…….2………………..…….3………………..…….4………………..…….5………………..…….6
Card 3
Definitely would NOT buy Maybe buy Definitely would buy
0………………..…….1………………..…….2………………..…….3………………..…….4………………..…….5………………..…….6
Card 4
Definitely would NOT buy Maybe buy Definitely would buy
0………………..…….1………………..…….2………………..…….3………………..…….4………………..…….5………………..…….6
Card 5
Definitely would NOT buy Maybe buy Definitely would buy
0………………..…….1………………..…….2………………..…….3………………..…….4………………..…….5………………..…….6
Card 6
Definitely would NOT buy Maybe buy Definitely would buy
0………………..…….1………………..…….2………………..…….3………………..…….4………………..…….5………………..…….6

108
Card 7
Definitely would NOT buy Maybe buy Definitely would buy
0………………..…….1………………..…….2………………..…….3………………..…….4………………..…….5………………..…….6
Card 8
Definitely would NOT buy Maybe buy Definitely would buy
0………………..…….1………………..…….2………………..…….3………………..…….4………………..…….5………………..…….6
Card 9
Definitely would NOT buy Maybe buy Definitely would buy
0………………..…….1………………..…….2………………..…….3………………..…….4………………..…….5………………..…….6
Card 10
Definitely would NOT buy Maybe buy Definitely would buy
0………………..…….1………………..…….2………………..…….3………………..…….4………………..…….5………………..…….6
Card 11
Definitely would NOT buy Maybe buy Definitely would buy
0………………..…….1………………..…….2………………..…….3………………..…….4………………..…….5………………..…….6
Card 12
Definitely would NOT buy Maybe buy Definitely would buy
0………………..…….1………………..…….2………………..…….3………………..…….4………………..…….5………………..…….6
Card 13
Definitely would NOT buy Maybe buy Definitely would buy
0………………..…….1………………..…….2………………..…….3………………..…….4………………..…….5………………..…….6
Card 14
Definitely would NOT buy Maybe buy Definitely would buy
0………………..…….1………………..…….2………………..…….3………………..…….4………………..…….5………………..…….6
Card 15
Definitely would NOT buy Maybe buy Definitely would buy
0………………..…….1………………..…….2………………..…….3………………..…….4………………..…….5………………..…….6

109
Card 16
Definitely would NOT buy Maybe buy Definitely would buy
0………………..…….1………………..…….2………………..…….3………………..…….4………………..…….5………………..…….6
Card 17
Definitely would NOT buy Maybe buy Definitely would buy
0………………..…….1………………..…….2………………..…….3………………..…….4………………..…….5………………..…….6
Card 18
Definitely would NOT buy Maybe buy Definitely would buy
0………………..…….1………………..…….2………………..…….3………………..…….4………………..…….5………………..…….6

110
Part II: Demographic and Wheat Usage questionnaire
Q1 What variety or varieties of wheat did you grow meher season 2004 (hectares of each variety)?_____
_____________________________________________________________________________________
Q2 How many quintals of wheat were harvested this year from each variety? ______________________
_____________________________________________________________________________________
Q3 How many quintals will you keep for home consumption? ___________________________________
Q4 How many quintals will you keep for seed for next planting season?___________________________
Q5 How many quintals will do you sell immediately after harvest?______ # of Quintals sell later?______
**(Note: Number of quintals from Q3, Q4, Q5 should add up to the # of quintals in Q2.)
Q6 Do you suffer storage losses? Yes No How much?_______________________________
Q6.1 Yes: What are the causes? Moisture______ Rodents_____ Weevils_____ Other______
Q7 How often do you renew seed? Every year 2 years 3 years 5 years
Q8 Where do you get seed (mark all that apply)? Other farmers______ Farmer union_______
Ethiopian Seed Enterprise______ Market _______ Other __________________________________
Q9 List the traits that determine your decision of what variety to grow from most important (1) to least important (6):
____Baking quality
____ Price of seed (to buy)
____Market price (for sale)
____ Yield potential
____Disease resistance
____Seed color
111
Q10 Do you think the color of wheat grain (red or white) effects protein/vitamin content? No, they are
the same Yes, Red grain has more Yes, White grain has more
Q11 How many times do you weed your wheat field? _______________By hand ______ Herbicide_____
Q12 How much fertilizer do you use (kg/ha)? DAP___________ Urea __________ Compost __________
Q13 In the last 10 years, late rains causing pre-harvest sprouting is a problem: never___ once___ 2-3
times___ 4-8 times___ every year___
Q13a Do you think red or white grain is more resistant to sprouting? No, they are the same
Red grain is more resistant White grain is more resistant
Q14 In the last 10 years, waterlogging is a problem: never___ once___ 2-3 times___ 4-8 times___
every year___
Q15 In 10 years, drought is a problem: never___ once___ 2-3 times___ 4-8 times___ every year___
Q16 In 10 years, lodging is a problem: never___ once___ 2-3 times___ 4-8 times___ every year___
Q17 In 10 years, rust is a serious problem: never___ once___ 2-3 times___ 4-8 times___ every year___
Q17a Do you apply fungicide (Tilt or other)? YES NO If yes, liters/ha _____ Birr/liter_____
Q17b Where do you get fungicide? Farmers union ____ Market____ Government loan_____
Q18 How many of each livestock animal do you own: Oxen______ Donkeys______ Goats______
Sheep_____ Horses______ Chickens______ Male beef cow______ Female cow______ Other____
Q19 Do you use wheat straw for: Roofing____ Bed stuffing ____ Animal feed ____ Fuel ____

112
Q20 Do you prefer red or white wheat for making tala? I don’t make tala ____ White ____ Red_____
Q21 What is your income from selling other crops? ___________________________________________
Q22 Number of people living in your house including you and your spouse/spouses: Males ___________
Ages ________________________ Females ________________ Ages ________________________
Q23 How many people in your family have education level above grade 8?________________________
Q24 Do you hire labor or use family labor only? Family labor only ___ Hire for: Plowing___ Planting ___
Weeding ___ Harvesting ___ Other _________________
Q25 Do any family members have other sources of income (off-farm labor)? YES NO
Q25a If yes, what kind of work? _______________________________________________________
Q26 Suppose there are equal seeds except one is low in price (650birr) and one is high in price
(1050birr), which do you prefer? Low High Explain why (ex. I can sell as seed to other
farmers; I assume price is an indication of high or low quality; if it costs more, I can sell it for more and
make more money)? ____________________________________________________________________
_____________________________________________________________________________________
Thank you very much for participating!

113
Appendix 3 Examples of conjoint survey cards showing the visual representation of
number of tillers and density of kernels per spike
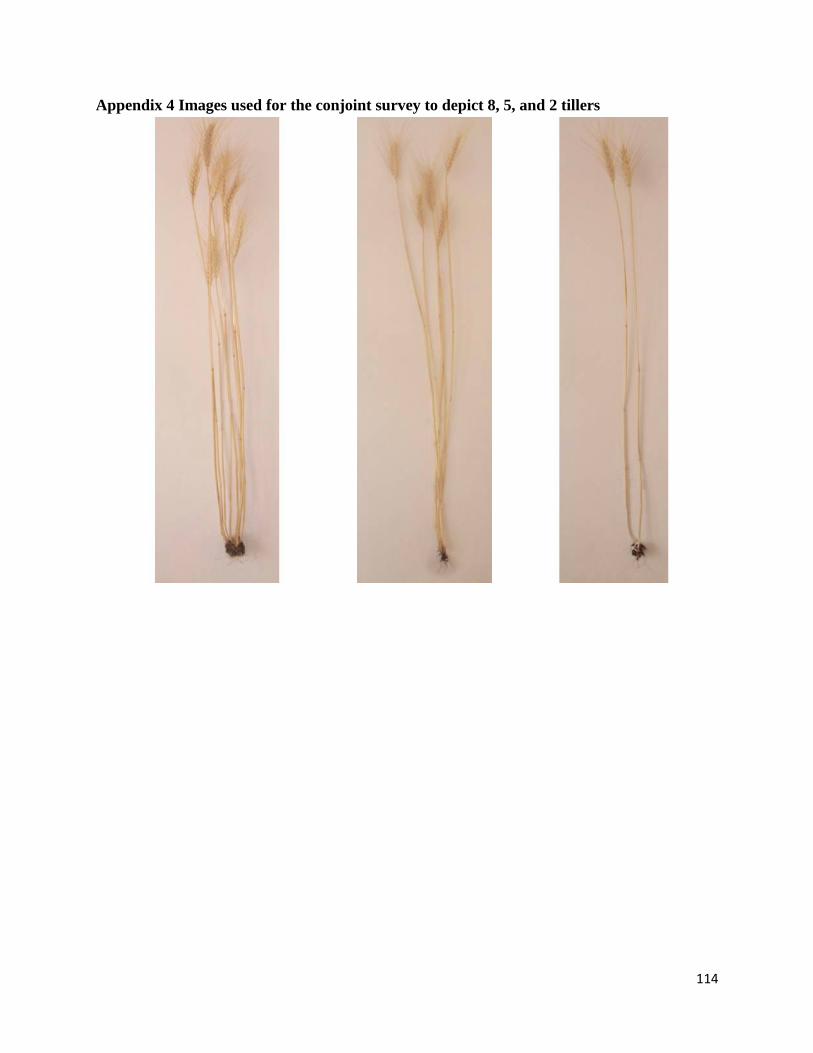
114
Appendix 4 Images used for the conjoint survey to depict 8, 5, and 2 tillers

115
Appendix 5 Images used for the conjoint survey to depict lax and dense kernels

116
Appendix 6 Picture of the seed samples shown to respondents during the conjoint survey to
depict seed size and color

117
Appendix 7 Division of four clusters to nine showing where each cluster splits to form a
new cluster. This can be interpreted as Cluster II (green) that has a strong preference for
white grain and Cluster V (blue) preferring high seed price are comprised of members that
have the strongest similarity in preferences.
4 clusters averagesCluster 1 Cluster 2 Cluster 3 Cluster 4
Attributes and levels Attributes and levels Attributes and levels Attributes and levels
N 72 N 36 N 105 N 92
Intercept 2.14 Intercept 2.23 Intercept 2.70 Intercept 2.93
till8 1.02 till8 0.62 till8 0.51 till8 0.65
till5 0.12 till5 -0.06 till5 0.07 till5 0.48
till2 -1.15 till2 -0.56 till2 -0.57 till2 -1.13
dense 0.65 dense 0.64 dense 0.20 dense 0.44
lax -0.65 lax -0.64 lax -0.20 lax -0.44
large 0.59 large 0.04 large 0.12 large 0.14
small -0.59 small -0.04 small -0.12 small -0.14
white 0.46 white 0.82 white 0.14 white 0.22
red -0.46 red -0.82 red -0.14 red -0.22
rustres 0.46 rustres 0.59 rustres 0.87 rustres 0.40
rustsus -0.46 rustsus -0.59 rustsus -0.87 rustsus -0.40
650 -0.13 650 -0.29 650 -0.41 650 -0.47
850 0.32 850 -0.01 850 0.02 850 -0.33
1050 -0.19 1050 0.30 1050 0.39 1050 0.81
AdjR2 0.57 AdjR2 0.54 AdjR2 0.52 AdjR2 0.58
RI till 28% RI till 21% RI till 23% RI till 32%
RI dense 17% RI dense 18% RI dense 12% RI dense 15%
RI size 16% RI size 5% RI size 9% RI size 7%
RI color 12% RI color 24% RI color 9% RI color 8%
RI rust 13% RI rust 17% RI rust 29% RI rust 14%
RI price 14% RI price 16% RI price 18% RI price 24%
5 clusters averagesCluster 1 Cluster 2 Cluster 3 Cluster 4 Cluster 5
Attributes and levels Attributes and levels Attributes and levels Attributes and levels Attributes and levels
N 72 N 36 N 60 N 45 N 92
Intercept Intercept Intercept Intercept Intercept
till8 1.02 till8 0.62 till8 0.60 till8 0.38 till8 0.65
till5 0.12 till5 -0.06 till5 0.07 till5 0.07 till5 0.48
till2 -1.15 till2 -0.56 till2 -0.67 till2 -0.45 till2 -1.13
dense 0.65 dense 0.64 dense 0.05 dense 0.41 dense 0.44
lax -0.65 lax -0.64 lax -0.05 lax -0.41 lax -0.44
large 0.59 large 0.04 large 0.20 large 0.02 large 0.14
small -0.59 small -0.04 small -0.20 small -0.02 small -0.14
white 0.46 white 0.82 white 0.09 white 0.21 white 0.22
red -0.46 red -0.82 red -0.09 red -0.21 red -0.22
rustres 0.46 rustres 0.59 rustres 0.59 rustres 1.24 rustres 0.40
rustsus -0.46 rustsus -0.59 rustsus -0.59 rustsus -1.24 rustsus 0.77
650 -0.13 650 -0.29 650 -0.42 650 -0.40 650 -0.47
850 0.32 850 -0.01 850 -0.01 850 0.06 850 -0.33
1050 -0.19 1050 0.30 1050 0.42 1050 0.34 1050 0.81
AdjR2 0.57 AdjR2 0.54 AdjR2 0.46 AdjR2 0.59 AdjR2 0.58
RI till 28% RI till 21% RI till 28% RI till 17% RI till 32%
RI dense 17% RI dense 18% RI dense 10% RI dense 13% RI dense 15%
RI size 16% RI size 5% RI size 11% RI size 6% RI size 7%
RI color 12% RI color 24% RI color 9% RI color 8% RI color 8%
RI rust 13% RI rust 17% RI rust 23% RI rust 38% RI rust 14%
RI price 14% RI price 16% RI price 19% RI price 18% RI price 24%
6 clusters averagesCluster 1 Cluster 2 Cluster 3 Cluster 4 Cluster 5 Cluster 6
Attributes and levels Attributes and levels Attributes and levels Attributes and levels Attributes and levels Attributes and levels
N 56 N 16 N 36 N 60 N 45 N 92
Intercept Intercept Intercept Intercept Intercept Intercept
till8 0.86 till8 1.58 till8 0.62 till8 0.60 till8 0.38 till8 0.65
till5 0.10 till5 0.20 till5 -0.06 till5 0.07 till5 0.07 till5 0.48
till2 -0.96 till2 -1.78 till2 -0.56 till2 -0.67 till2 -0.45 till2 -1.13
dense 0.61 dense 0.79 dense 0.64 dense 0.05 dense 0.41 dense 0.44
lax -0.61 lax -0.79 lax -0.64 lax -0.05 lax -0.41 lax -0.44
large 0.64 large 0.41 large 0.04 large 0.20 large 0.02 large 0.14
small -0.64 small -0.41 small -0.04 small -0.20 small -0.02 small -0.14
white 0.47 white 0.44 white 0.82 white 0.09 white 0.21 white 0.22
red -0.47 red -0.44 red -0.82 red -0.09 red -0.21 red -0.22
rustres 0.35 rustres 0.84 rustres 0.59 rustres 0.59 rustres 1.24 rustres 0.40
rustsus -0.35 rustsus -0.84 rustsus -0.59 rustsus -0.59 rustsus -1.24 rustsus -0.40
650 -0.30 650 0.45 650 -0.29 650 -0.42 650 -0.40 650 -0.47
850 0.36 850 0.21 850 -0.01 850 -0.01 850 0.06 850 -0.33
1050 -0.06 1050 -0.65 1050 0.30 1050 0.42 1050 0.34 1050 0.81
AdjR2 0.56 AdjR2 0.60 AdjR2 0.54 AdjR2 0.46 AdjR2 0.59 AdjR2 0.58
RI till 26% RI till 35% RI till 21% RI till 28% RI till 17% RI till 32%
RI dense 17% RI dense 17% RI dense 18% RI dense 10% RI dense 13% RI dense 15%
RI size 18% RI size 9% RI size 5% RI size 11% RI size 6% RI size 7%
RI color 13% RI color 9% RI color 24% RI color 9% RI color 8% RI color 8%
RI rust 11% RI rust 18% RI rust 17% RI rust 23% RI rust 38% RI rust 14%
RI price 14% RI price 13% RI price 16% RI price 19% RI price 18% RI price 24%
7 clusters averagesCluster 1 Cluster 2 Cluster 3 Cluster 4 Cluster 5 Cluster 6 Cluster 7
Attributes and levels Attributes and levels Attributes and levels Attributes and levels Attributes and levels Attributes and levels Attributes and levels
N 56 N 16 N 36 N 9 N 51 N 45 N 92
Intercept Intercept Intercept Intercept Intercept Intercept Intercept
till8 0.86 till8 1.58 till8 0.62 till8 0.32 till8 0.65 till8 0.38 till8 0.65
till5 0.10 till5 0.20 till5 -0.06 till5 0.31 till5 0.02 till5 0.07 till5 0.48
till2 -0.96 till2 -1.78 till2 -0.56 till2 -0.63 till2 -0.68 till2 -0.45 till2 -1.13
dense 0.61 dense 0.79 dense 0.64 dense -0.37 dense 0.13 dense 0.41 dense 0.44
lax -0.61 lax -0.79 lax -0.64 lax 0.37 lax -0.13 lax -0.41 lax -0.44
large 0.64 large 0.41 large 0.04 large -0.15 large 0.26 large 0.02 large 0.14
small -0.64 small -0.41 small -0.04 small 0.15 small -0.26 small -0.02 small -0.14
white 0.47 white 0.44 white 0.82 white -0.46 white 0.19 white 0.21 white 0.22
red -0.47 red -0.44 red -0.82 red 0.46 red -0.19 red -0.21 red -0.22
rustres 0.35 rustres 0.84 rustres 0.59 rustres 0.75 rustres 0.56 rustres 1.24 rustres 0.40
rustsus -0.35 rustsus -0.84 rustsus -0.59 rustsus -0.75 rustsus -0.56 rustsus -1.24 rustsus -0.40
650 -0.30 650 0.45 650 -0.29 650 -0.96 650 -0.32 650 -0.40 650 -0.47
850 0.36 850 0.21 850 -0.01 850 0.26 850 -0.05 850 0.06 850 -0.33
1050 -0.06 1050 -0.65 1050 0.30 1050 0.69 1050 0.38 1050 0.34 1050 0.81
AdjR2 0.56 AdjR2 0.60 AdjR2 0.54 AdjR2 0.41 AdjR2 0.47 AdjR2 0.59 AdjR2 0.58
RI till 26% RI till 35% RI till 21% RI till 21% RI till 29% RI till 17% RI till 32%
RI dense 17% RI dense 17% RI dense 18% RI dense 11% RI dense 10% RI dense 13% RI dense 15%
RI size 18% RI size 9% RI size 5% RI size 7% RI size 12% RI size 6% RI size 7%
RI color 13% RI color 9% RI color 24% RI color 13% RI color 9% RI color 8% RI color 8%
RI rust 11% RI rust 18% RI rust 17% RI rust 23% RI rust 23% RI rust 38% RI rust 14%
RI price 14% RI price 13% RI price 16% RI price 26% RI price 17% RI price 18% RI price 24%
8 clusters averagesCluster 1 Cluster 2 Cluster 3 Cluster 4 Cluster 5 Cluster 6 Cluster 7 Cluster 8
Attributes and levels Attributes and levels Attributes and levels Attributes and levels Attributes and levels Attributes and levels Attributes and levels Attributes and levels
N 34 N 22 N 16 N 36 N 9 N 51 N 45 N 92
Intercept Intercept Intercept Intercept Intercept Intercept Intercept Intercept
till8 0.85 till8 0.88 till8 1.58 till8 0.62 till8 0.32 till8 0.65 till8 0.38 till8 0.65
till5 -0.09 till5 0.39 till5 0.20 till5 -0.06 till5 0.31 till5 0.02 till5 0.07 till5 0.48
till2 -0.77 till2 -1.27 till2 -1.78 till2 -0.56 till2 -0.63 till2 -0.68 till2 -0.45 till2 -1.13
dense 0.53 dense 0.74 dense 0.79 dense 0.64 dense -0.37 dense 0.13 dense 0.41 dense 0.44
lax -0.53 lax -0.74 lax -0.79 lax -0.64 lax 0.37 lax -0.13 lax -0.41 lax -0.44
large 0.67 large 0.60 large 0.41 large 0.04 large -0.15 large 0.26 large 0.02 large 0.14
small -0.67 small -0.60 small -0.41 small -0.04 small 0.15 small -0.26 small -0.02 small -0.14
white 0.27 white 0.78 white 0.44 white 0.82 white -0.46 white 0.19 white 0.21 white 0.22
red -0.27 red -0.78 red -0.44 red -0.82 red 0.46 red -0.19 red -0.21 red -0.22
rustres 0.51 rustres 0.10 rustres 0.84 rustres 0.59 rustres 0.75 rustres 0.56 rustres 1.24 rustres 0.40
rustsus -0.51 rustsus -0.10 rustsus -0.84 rustsus -0.59 rustsus -0.75 rustsus -0.56 rustsus -1.24 rustsus -0.40
650 -0.24 650 -0.39 650 0.45 650 -0.29 650 -0.96 650 -0.32 650 -0.40 650 -0.47
850 0.40 850 0.29 850 0.21 850 -0.01 850 0.26 850 -0.05 850 0.06 850 -0.33
1050 -0.16 1050 0.10 1050 -0.65 1050 0.30 1050 0.69 1050 0.38 1050 0.34 1050 0.81
AdjR2 0.58 AdjR2 0.54 AdjR2 0.60 AdjR2 0.54 AdjR2 0.41 AdjR2 0.47 AdjR2 0.59 AdjR2 0.58
RI till 25% RI till 28% RI till 35% RI till 21% RI till 21% RI till 29% RI till 17% RI till 32%
RI dense 17% RI dense 18% RI dense 17% RI dense 18% RI dense 11% RI dense 10% RI dense 13% RI dense 15%
RI size 19% RI size 16% RI size 9% RI size 5% RI size 7% RI size 12% RI size 6% RI size 7%
RI color 9% RI color 20% RI color 9% RI color 24% RI color 13% RI color 9% RI color 8% RI color 8%
RI rust 15% RI rust 6% RI rust 18% RI rust 17% RI rust 23% RI rust 23% RI rust 38% RI rust 14%
RI price 15% RI price 12% RI price 13% RI price 16% RI price 26% RI price 17% RI price 18% RI price 24%
9 clusters averagesCluster 1 Cluster 2 Cluster 3 Cluster 4 Cluster 5 Cluster 6 Cluster 7 Cluster 8 Cluster 9
Attributes and levels Attributes and levels Attributes and levels Attributes and levels Attributes and levels Attributes and levels Attributes and levels Attributes and levels Attributes and levels
N 34 N 22 N 16 N 36 N 9 N 51 N 45 N 69 N 23
Intercept Intercept Intercept Intercept Intercept Intercept Intercept Intercept Intercept
till8 0.85 till8 0.88 till8 1.58 till8 0.62 till8 0.32 till8 0.65 till8 0.38 till8 0.59 till8 0.83
till5 -0.09 till5 0.39 till5 0.20 till5 -0.06 till5 0.31 till5 0.02 till5 0.07 till5 0.55 till5 0.27
till2 -0.77 till2 -1.27 till2 -1.78 till2 -0.56 till2 -0.63 till2 -0.68 till2 -0.45 till2 -1.13 till2 -1.10
dense 0.53 dense 0.74 dense 0.79 dense 0.64 dense -0.37 dense 0.13 dense 0.41 dense 0.35 dense 0.71
lax -0.53 lax -0.74 lax -0.79 lax -0.64 lax 0.37 lax -0.13 lax -0.41 lax -0.35 lax -0.71
large 0.67 large 0.60 large 0.41 large 0.04 large -0.15 large 0.26 large 0.02 large 0.20 large -0.05
small -0.67 small -0.60 small -0.41 small -0.04 small 0.15 small -0.26 small -0.02 small -0.20 small 0.05
white 0.27 white 0.78 white 0.44 white 0.82 white -0.46 white 0.19 white 0.21 white 0.15 white 0.42
red -0.27 red -0.78 red -0.44 red -0.82 red 0.46 red -0.19 red -0.21 red -0.15 red -0.42
rustres 0.51 rustres 0.10 rustres 0.84 rustres 0.59 rustres 0.75 rustres 0.56 rustres 1.24 rustres 0.42 rustres 0.31
rustsus -0.51 rustsus -0.10 rustsus -0.84 rustsus -0.59 rustsus -0.75 rustsus -0.56 rustsus -1.24 rustsus -0.42 rustsus -0.31
650 -0.24 650 -0.39 650 0.45 650 -0.29 650 -0.96 650 -0.32 650 -0.40 650 -0.54 650 -0.26
850 0.40 850 0.29 850 0.21 850 -0.01 850 0.26 850 -0.05 850 0.06 850 -0.29 850 -0.46
1050 -0.16 1050 0.10 1050 -0.65 1050 0.30 1050 0.69 1050 0.38 1050 0.34 1050 0.84 1050 0.72
AdjR2 0.58 AdjR2 0.54 AdjR2 0.60 AdjR2 0.54 AdjR2 0.41 AdjR2 0.47 AdjR2 0.59 AdjR2 0.59 AdjR2 0.57
RI till 25% RI till 28% RI till 35% RI till 21% RI till 21% RI till 29% RI till 17% RI till 32% RI till 30%
RI dense 17% RI dense 18% RI dense 17% RI dense 18% RI dense 11% RI dense 10% RI dense 13% RI dense 12% RI dense 21%
RI size 19% RI size 16% RI size 9% RI size 5% RI size 7% RI size 12% RI size 6% RI size 8% RI size 5%
RI color 9% RI color 20% RI color 9% RI color 24% RI color 13% RI color 9% RI color 8% RI color 7% RI color 13%
RI rust 15% RI rust 6% RI rust 18% RI rust 17% RI rust 23% RI rust 23% RI rust 38% RI rust 15% RI rust 11%
RI price 15% RI price 12% RI price 13% RI price 16% RI price 26% RI price 17% RI price 18% RI price 26% RI price 20%