analysis of financial accounting procedures and applications
TRANSCRIPT

University of Mississippi University of Mississippi
eGrove eGrove
Honors Theses Honors College (Sally McDonnell Barksdale Honors College)
2017
Analysis of Financial Accounting Procedures and Applications Analysis of Financial Accounting Procedures and Applications
Mary Stewart Hurst University of Mississippi. Sally McDonnell Barksdale Honors College
Follow this and additional works at: https://egrove.olemiss.edu/hon_thesis
Part of the Accounting Commons
Recommended Citation Recommended Citation Hurst, Mary Stewart, "Analysis of Financial Accounting Procedures and Applications" (2017). Honors Theses. 651. https://egrove.olemiss.edu/hon_thesis/651
This Undergraduate Thesis is brought to you for free and open access by the Honors College (Sally McDonnell Barksdale Honors College) at eGrove. It has been accepted for inclusion in Honors Theses by an authorized administrator of eGrove. For more information, please contact [email protected].

ANALYSIS OF FINANCIAL ACCOUNTING PROCEDURES AND APPLICATIONS
byMary Stewart Hurst
A thesis submitted to the faculty of The University of Mississippi in partial fulfillment of the requirements of the Sally McDonnell Barksdale Honors College
OxfordMay 2017
Approved by
_________________________________Advisor: Professor Victoria Dickinson
_________________________________Reader: Dean Mark Wilder

ABSTRACTMARY STEWART HURST: Analysis of Financial Accounting Procedures and
Applications(Under the direction of Victoria Dickinson)
This thesis is a compilation of accounting problems in an exploration of core accounting
principles. Each case is a unique illustration of one of these financial accounting concepts
and is an application of the principles and procedures associated with it. Within each case
there is an executive summary describing the situation outlined in the case, the most
important procedures used to solve the problem, and the ultimate outcome of the case.
Following the executive summary is an appendix in which many specific questions were
addressed. Additionally, within the appendices are included many figures, including
journal entries, calculations, comparisons, and financial statements that were used to
enhance the understanding of the subject and to draw a conclusion about the company or
companies being examined.

TABLE OF CONTENTS
List of Tables .............................................................................................................iv
Case 1: Management Decisions in Reporting............................................................1
Case 2: Relevant Income in Assets............................................................................21
Case 3: Statement of Cash Flows...............................................................................32
Case 4: Accounts Receivable and Estimations ..........................................................44
Case 5: Inventory and Revenue Recognition.............................................................54
Case 6: Manipulation in Financial Statements...........................................................64
Case 7: Differences Between IFRS and GAAP Regulation ......................................68
Case 8: Long-Term Debt ...........................................................................................74
Case 9: Stockholders’ Equity.....................................................................................83
Case 10: Marketable Securities..................................................................................90
Case 11: Revenue Recognition ..................................................................................96
Case 12: Deferred Income Taxes...............................................................................104
Case 13: Retirement Obligations ...............................................................................109

iv
LIST OF FIGURES
Management Decisions in Reporting 1
Figure 1-1 Eads Chart of Accounts 5-8Figure 1-2 Eads Income Statement 9Figure 1-3 Eads Statement of Retained Earnings 9Figure 1-4 Eads Classified Balance Sheet 10Figure 1-5 Eads Statement of Cash Flows 11Figure 1-6 Eads Table of Financial Ratios 12Figure 1-7 Glenwood Chart of Accounts 13-16Figure 1-8 Glenwood Income Statement 17Figure 1-9 Glenwood Statement of Retained Earnings 17Figure 1-10 Glenwood Classified Balance Sheet 18Figure 1-11 Glenwood Statement of Cash Flows 19Figure 1-12 Glenwood Table of Financial Ratios 20
Relevant Income in Assets 21
Figure 2-1 Operating vs. Non-Operating Income Statement Items 29Figure 2-2 Operating vs. Non-Operating Balance Sheet Items 29Figure 2-3 Comparative Yearly Calculations 30Figure 2-4 Comparative Table of Operating Assets and Liabilities 30Figure 2-5 Persistent Income Statement 31
Statement of Cash Flows 32
Figure 3-1 Statement of Cash Flows 41
Accounts Receivable and Estimations 44
Figure 4-1 Estimated Uncollectible Amounts Using the Aging Method 52Figure 4-2 Average Collection Period Calculation 52
Manipulation in Financial Statements 64
Figure 6-1 Comparison of Depreciation Calculations 66
Differences Between IFRS and GAAP Regulation 68
Figure 7-1 Comparison of GAAP Reporting and IFRS Reporting 69-71

v
Long-Term Debt 74
Figure 8-1 Bond Amortization Table Using Effective Interest 78Figure 8-2 Bond Amortization Table Using Straight-Line Interest 79Figure 8-3 Comparison of Interest Methods 80Figure 8-4 Rite Aid Ratios Compared to Industry Average 81
Stockholders’ Equity 83
Figure 9-1 Comparison of Equity Items 88
Revenue Recognition 96
Figure 11-1 Direct Effect of Stock Price on Revenue 100Figure 11-2 2009 and 2010 Common Size Income Statements 100Figure 11-3 Computation of Asset Turnover Ratio 101

Case 1: Management Decisions in Reporting
Executive Summary
Eads Heaters, Inc. and Glenwood Heating, Inc. operated under similar economic
conditions and had identical operations, but an analysis of their separate financial
statements shows that each manager made different accounting choices when preparing
the financial statements. After careful examination, I would choose to invest in Glenwood
Heating, Inc. An analysis of the financial statements of each company reveals that
Glenwood Heating, Inc. has more liquid assets, better debt management, and greater
benefits for stockholders. Even though Eads Heaters, Inc. has a higher gross profit
margin, a higher return on assets, and uses its assets to generate sales and collects its
receivables more efficiently, I believe that as after evaluating every aspect of the financial
statements, Glenwood is the better investment opportunity.
Glenwood Heating, Inc. did not choose to capitalize the lease agreement, so it has
more money available to make other investments. Its financial position is better, and it
has a greater ability to meet its current liabilities with its current assets. In addition,
Glenwood Heating, Inc. has a higher net income and also a higher balance in retained
earnings, so it has more money available to grow than Eads Heaters, Inc does. Glenwood
Heating, Inc. also has a much higher earnings per share ratio and times interest earned
ratio, so investors are getting a much higher return on their investments.

Management Decisions in Reporting - 2
Liquidity
Indicated by the current ratios and acid-test ratios, the financial position of
Glenwood Heating, Inc. is better than that of Eads Heaters, Inc. Glenwood Heating, Inc.
has a higher current ratio and a higher acid-test ratio than Eads Heaters, Inc. Glenwood
Heating, Inc. is the more liquid of the two, because its current assets have a greater ability
to meet its current liabilities than those of Eads Heaters, Inc. Glenwood Heating, Inc. has
a stronger liquidity and ability to meet current obligations.
Eads Heaters, Inc. uses its assets more efficiently and collects cash more
efficiently than Glenwood Heating, Inc. does. Several of the ratios of Eads Heaters, Inc.
indicate that its efficiency is greater than that of Glenwood Heating, Inc., including
accounts receivable turnover, days to collect receivables, inventory turnover, days to sell
inventory, and operating cycle. The accounts receivable turnover and inventory turnover
ratios of Eads Heaters, Inc. are higher than those of Glenwood Heating, Inc., indicating
that the accounts receivable and inventory accounts of Eads Heaters, Inc. are more liquid
than those of Glenwood Heating, Inc. Eads Heaters, Inc. requires fewer days both to
collect its receivables and to sell its inventory, another sign that its efficiency is greater
than Glenwood Heating, Inc. Finally, the operating cycle of Eads Heaters, Inc. is lower
than that of Glenwood Heating, Inc., indicating that the average number of days between
the purchase of inventory and the collection of cash from the sale of inventory is lower
for Eads Heaters, Inc. than for Glenwood Heating, Inc.

Management Decisions in Reporting - 3
Profitability
The profitability ratios favor Eads in some ways, but also in other ways favor
Glenwood Heating, Inc. Eads Heaters, Inc.’s gross profit margin is greater than that of
Glenwood Heating, Inc. This indicates that Eads Heaters, Inc. has more money left over
from sales after accounting for the cost of goods sold. Therefore, Eads Heaters, Inc. has
more money available to pay additional expenses and future savings. Eads Heaters, Inc.
also has a higher return on assets. The management of Eads Heaters, Inc. is more efficient
at using its assets to generate earnings than the management of Glenwood Heating, Inc.
However, Glenwood Heating, Inc. has a higher profit margin, indicating that Glenwood
Heating, Inc. keeps more of every dollar of sales in earnings than Eads Heaters, Inc. does.
Glenwood Heating, Inc. keeps $.23 for every dollar earned, whereas Eads Heaters, Inc.
only keeps $.18.
Glenwood Heating, Inc. has a higher return on owners’ equity and a higher
earnings per share ratio than Eads Heaters, Inc. does. The higher return on equity ratio
indicates that Glenwood Heating, Inc.’s return on stockholder’s investment after interest
is paid to creditors is greater than that of Eads Heaters, Inc. Glenwood Heating, Inc. is
better at using investments to generate earnings growth. The higher earnings per share
ratio indicates that the return to common stockholders for each share owned is greater for
Glenwood Heating, Inc. than for Eads Heaters, Inc. Investors in Glenwood Heating, Inc.
are likely to be paid more in dividends than investors in Eads Heaters, Inc.
Finally, based on the debt ratio and times interest ratio, Glenwood Heating, Inc.
manages its debts better than Eads Heaters, Inc. does. Glenwood Heating, Inc. has a
lower debt ratio and a higher times interest earned ratio than Eads Heaters, Inc. does. The

Management Decisions in Reporting - 4
lower debt ratio indicates a lower portion of Glenwood Heating, Inc.’s investments is
from debt than the portion of Eads Heaters Inc.’s investments. This lower percentage
proves that Glenwood Heating, Inc. is using less leverage and has a stronger equity
position than does Eads Heaters, Inc. The higher times interest earned ratio indicates that
Glenwood Heating, Inc. has a greater ability to meet its interest requirements from
earnings. Both of these ratios demonstrate that an investment in Glenwood Heating, Inc.
is less risky than one in Eads Heaters, Inc.

5
Chart of Accounts – EadsAppendix
PART ACash Accounts
ReceivableAllowance
for Bad Debts
Inventory Land Building Accumulated Depreciation,
BuildingA1 160,000A2 400,000A3 (420,000) 70,000 350,000A4 (80,000)A5 239,800A6 398,500A7 299,100 (299,100)A8 (213,360)A9 (41,000)A10 (34,200)A11 (23,200)A12TOTALS $47,340 $99,400 $0 $239,800 $70,000 $350,000 $0PART B
Cash Accounts Receivable
Allowance for Bad Debts
Inventory Land Building Accumulated Depreciation,
BuildingB1 4,970B2 (188,800)B3 10,000B4 (16,000)B5 (23,505)TOTALS $7,835 $99,400 $4,970 $51,000 $70,000 $350,000 $10,000
Figure 1-1: Eads Chart of Accounts
Managem
ent Decisions in R
eporting -

6
Chart of Accounts – Eads (continued)PART A
Equipment Accumulated Depreciation,
Equipment
Leased Equipment
Accumulated Depreciation,
Leased Equipment
Accounts Payable
Interest Payable
Note Payable
A1A2 400,000A3A4 80,000A5 239,800A6A7A8 (213,360)A9 (20,000)A10A11A12 6,650TOTALS $80,000 $0 $0 $0 $26,440 $6,650 $380,000
PART BEquipment Accumulated
Depreciation, Equipment
Leased Equipment
Accumulated Depreciation,
Leased Equipment
Accounts Payable
Interest Payable
Note Payable
B1B2B3 20,000B4 92,000 11,500B5TOTALS $80,000 $20,000 $92,000 $11,500 $26,440 $6,650 $380,000
Figure 1-1: Eads Chart of Accounts (continued)
Managem
ent Decisions in R
eporting -

7
Chart of Accounts – Eads (continued)PART A
Lease Payable
Common Stock
Retained Earnings Dividends Sales
Cost of Goods Sold
Bad Debt Expense
A1 160,000A2A3A4A5A6 398,500A7A8A9A10A11 23,200A12TOTALS $0 $160,000 $0 $23,200 $398,500 $0 $0
PART BLease
PayableCommon
StockRetained Earnings
Dividends Sales Cost of Goods Sold
Bad Debt Expense
B1 4,970B2 188,800B3B4 83,360B5TOTALS $83,360 $160,000 $0 $23,200 $398,500 $188,800 $4,970
Figure 1-1: Eads Chart of Accounts (continued)
Managem
ent Decisions in R
eporting -

8
Chart of Accounts – Eads (continued)
PART ADepreciation
ExpenseInterest Expense
Other Operating Expenses
Rent Expense
Provision for Income Taxes
A1A2A3A4A5A6A7A8A9 21,000A10 34,200A11A12 6,650TOTALS $0 $27,650 $34,200 $0 $0
PART BDepreciation
ExpenseInterest Expense
Other Operating Expenses
Rent Expense
Provision for Income Taxes
B1B2B3 30,000B4 11,500 7,360B5 23,505TOTALS $41,500 $35,010 $34,200 $0 $23,505
Figure 1-1: Eads Chart of Accounts (continued)
Managem
ent Decisions in R
eporting -

Management Decisions in Reporting - 9
Figure 1-2: Eads Income Statement
Sales Revenue $398,500Less: Cost of Goods Sold (188,800)Gross Profit 209,700Less: Selling and Admin Expense (80,670)Income from Operations 129,030Less: Interest Expense (35,010)Income before Taxes 94,020Less: Income Tax (23,505)Net Income $70,515
Retained Earnings, January 1 $0Add: Net Income 70,515
70,515Less: Dividends (23,200)
Retained Earnings, December 31 $47,315
Eads Heaters, Inc.Statement of Retained Earnings
For the Year Ended Dec. 31, 20X1
Eads Heaters, Inc.Multistep Income Statement
For the Year Ended Dec. 31, 20X1
Figure 1-3: Eads Statement of Retained Earnings

Management Decisions in Reporting - 10
Eads Heaters, Inc.Statement of Cash FlowsFor the Year Ended Dec. 31, 20X1
AssetsCurrent AssetsCash $7,835Accounts Receivable 99,400
Less: Allowance for Doubtful Accounts (4,970) 94,430Inventory 51,000Total Current Assets $153,265
Property, Plant, and EquipmentLand $70,000Building 350,000
Less: Accumulated Depreciation (10,000) 340,000Equipment 80,000
Less: Accumulated Depreciation (20,000) 60,000Leased Equipment 92,000
Less: Accumulated Depreciation (11,500) 80,500Total Property, Plant, and Equipment $550,500
Total Assets $703,765
Liabilities and Stockholders’ EquityCurrent LiabilitiesLease Payable $83,360Accounts Payable 26,440Interest Payable 6,650Total Current Liabilities $116,450
Long-Term DebtTwenty-year 7% debentures due Sept. 30, 20X1
$380,000
Total Liabilities $496,450
Stockholders’ EquityCommon Stock $160,000Retained Earnings 47,315Total Stockholders’ Equity $207,315
Total Liabilities and Equity $703,765
Eads Heaters, Inc.Classified Balance Sheet
As of Dec. 31, 20X1
Figure 1-4: Eads Classified Balance Sheet

Management Decisions in Reporting - 11
Cash Flows from Operating ActivitiesNet Income $70,515
Add: Depreciation Expense 41,500Adjust for Changes to Current Assets
Increase in Accounts Receivable (94,430)Increase in Inventory (51,000) (145,430)
Adjust for Changes to Current LiabilitiesIncrease in Accounts Payable 26,440Increase in Interest Payable 6,650 33,090
Net Cash from Operating Activities ($325)
Cash Flows from Investing ActivitiesPurchase of Land ($70,000)Purchase of Equipment (80,000)Purchase of Building (350,000)Net Cash from Investing Activities ($500,000)
Cash Flows from Financing Activities Lease Payable $83,360Payment of Cash Dividend (23,200)Issuance of Common Stock 160,000Redemption of Bonds (380,000)Net Cash from Financing Activities ($159,840)
Net Decrease in Cash ($660,165)Figure 1-5: Eads Statement of Cash Flows
Eads Heaters, Inc.Statement of Cash Flows
For the Year Ended Dec. 31, 20X1

Management Decisions in Reporting - 12
Liquidity RatiosCurrent Ratio 2.46Acid-test Ratio 1.64Accounts Receivable Turnover 4.22Days to Collect Receivables 86.49 daysInventory Turnover 3.70Days to Sell Inventory 98.60 daysOperating Cycle 185.09 days
Profitability RatiosGross Profit Margin 52.62%Profit Margin 17.70%Return on Assets (ROA) 10.02%Return on Owners' Equity (ROE) 34.01%Earnings per Share (EPS) $22.04 per share
Long-Term Solvency RatiosDebt Ratio 70.54%Times Interest Earned 3.69x
Figure 1-6: Eads Table of Financial Ratios
Eads Heaters, Inc.Financial Ratios

13
Chart of Accounts – GlenwoodPART A
Cash Accounts Receivable
Allowance for Doubtful Accounts
Inventory Land Building Accumulated Depreciation,
BuildingA1 160,000A2 400,000A3 (420,000) 70,000 350,000A4 (80,000)A5 239,800A6 398,500A7 299,100 (299,100)A8 (213,360)A9 (41,000)A10 (34,200)A11 (23,200)A12TOTALS $47,340 $99,400 $0 $239,800 $70,000 $350,000 $0
PART BCash Accounts
ReceivableAllowance for
Doubtful Accounts
Inventory Land Building Accumulated Depreciation,
BuildingB1 994B2 (177,000)B3 10,000B4 (16,000)B5 (30,914)TOTALS $426 $99,400 $994 $62,800 $70,000 $350,000 $10,000
Figure 1-7: Glenwood Chart of Accounts
Managem
ent Decisions in R
eporting -

14
Chart of Accounts – Glenwood (continued)
PART AEquipment Accumulated
Depreciation, Equipment
Leased Equipment
Accumulated Depreciation,
Leased Equipment
Accounts Payable
Interest Payable
Note Payable
A1A2 400,000A3A4 80,000A5 239,800A6A7A8 (213,360)A9 (20,000)A10A11A12 6,650TOTALS $80,000 $0 $0 $0 $26,440 $6,650 $380,000
PART BEquipment Accumulated
Depreciation, Equipment
Leased Equipment
Accumulated Depreciation,
Leased Equipment
Accounts Payable
Interest Payable
Note Payable
B1B2B3 9,000B4B5TOTALS $80,000 $9,000 $0 $0 $26,440 $6,650 $380,000
Figure 1-7: Glenwood Chart of Accounts (continued)
Managem
ent Decisions in R
eporting -

15
Chart of Accounts – Glenwood (continued)
PART ALease Payable Common
StockRetained Earnings
Dividends Sales Cost of Goods Sold
Bad Debt Expense
A1 160,000A2A3A4A5A6 398,500A7A8A9A10A11 23,200A12TOTALS $0 $160,000 $0 $23,200 $398,500 $0 $0
PART BLease Payable Common
StockRetained Earnings
Dividends Sales Cost of Goods Sold
Bad Debt Expense
B1 994B2 177,000B3B4B5TOTALS $0 $160,000 $0 $23,200 $398,500 $177,000 $994
Figure 1-7: Glenwood Chart of Accounts (continued)
Managem
ent Decisions in R
eporting -

16
Chart of Accounts – Glenwood (continued)
PART ADepreciation
ExpenseInterest Expense
Other Operating Expenses
Rent Expense
Provision for Income Taxes
A1A2A3A4A5A6A7A8A9 21,000A10 34,200A11A12 6,650TOTALS $0 $27,650 $34,200 $0 $0
PART BDepreciation
ExpenseInterest Expense
Other Operating Expenses
Rent Expense
Provision for Income Taxes
B1B2B3 19,000B4 16,000B5 34,914TOTALS $19,000 $27,650 $34,200 $16,000 $34,914
Figure 1-7: Glenwood Chart of Accounts (continued)
Managem
ent Decisions in R
eporting -

Management Decisions in Reporting - 17
Sales Revenue $398,500Less: Cost of Goods Sold (177,000)Gross Profit 221,500Less: Selling and Admin Expenses (70,194)Income from Operations 151,306Less: Interest Expense (27,650)Income before Taxes 123,656Less: Income Tax (30,914)Net Income $92,742
Retained Earnings, January 1 $0Add: Net Income 92,742
92,742Less: Dividends 23,200
Retained Earnings, December 31 $69,542
Glenwood Heating, Inc.Statement of Retained Earnings
For the Year Ended Dec. 31, 20X1
Glenwood Heating, Inc.Multistep Income Statement
For the Year Ended Dec. 31, 20X1
Figure 1-8: Glenwood Income Statement
Figure 1-9: Glenwood Statement of Retained Earnings
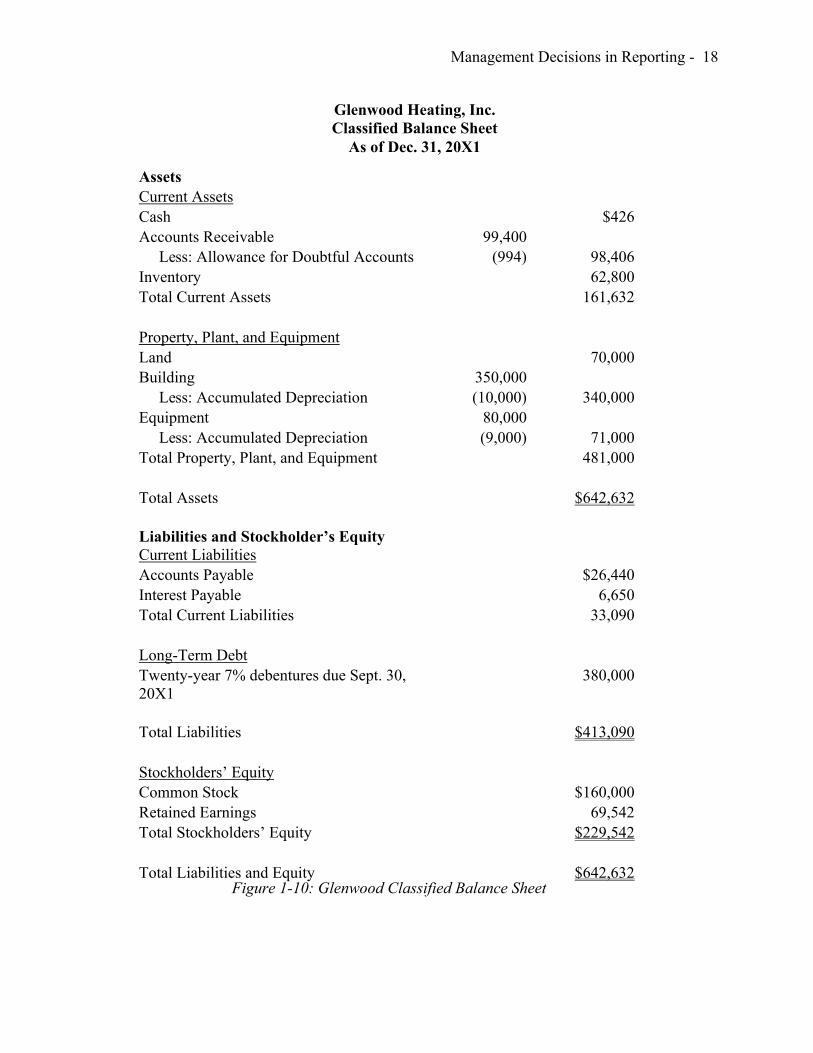
Management Decisions in Reporting - 18
AssetsCurrent AssetsCash $426Accounts Receivable 99,400
Less: Allowance for Doubtful Accounts (994) 98,406Inventory 62,800Total Current Assets 161,632
Property, Plant, and EquipmentLand 70,000Building 350,000
Less: Accumulated Depreciation (10,000) 340,000Equipment 80,000
Less: Accumulated Depreciation (9,000) 71,000Total Property, Plant, and Equipment 481,000
Total Assets $642,632
Liabilities and Stockholder’s EquityCurrent LiabilitiesAccounts Payable $26,440Interest Payable 6,650Total Current Liabilities 33,090
Long-Term DebtTwenty-year 7% debentures due Sept. 30, 20X1
380,000
Total Liabilities $413,090
Stockholders’ EquityCommon Stock $160,000Retained Earnings 69,542Total Stockholders’ Equity $229,542
Total Liabilities and Equity $642,632
Glenwood Heating, Inc.Classified Balance Sheet
As of Dec. 31, 20X1
Figure 1-10: Glenwood Classified Balance Sheet
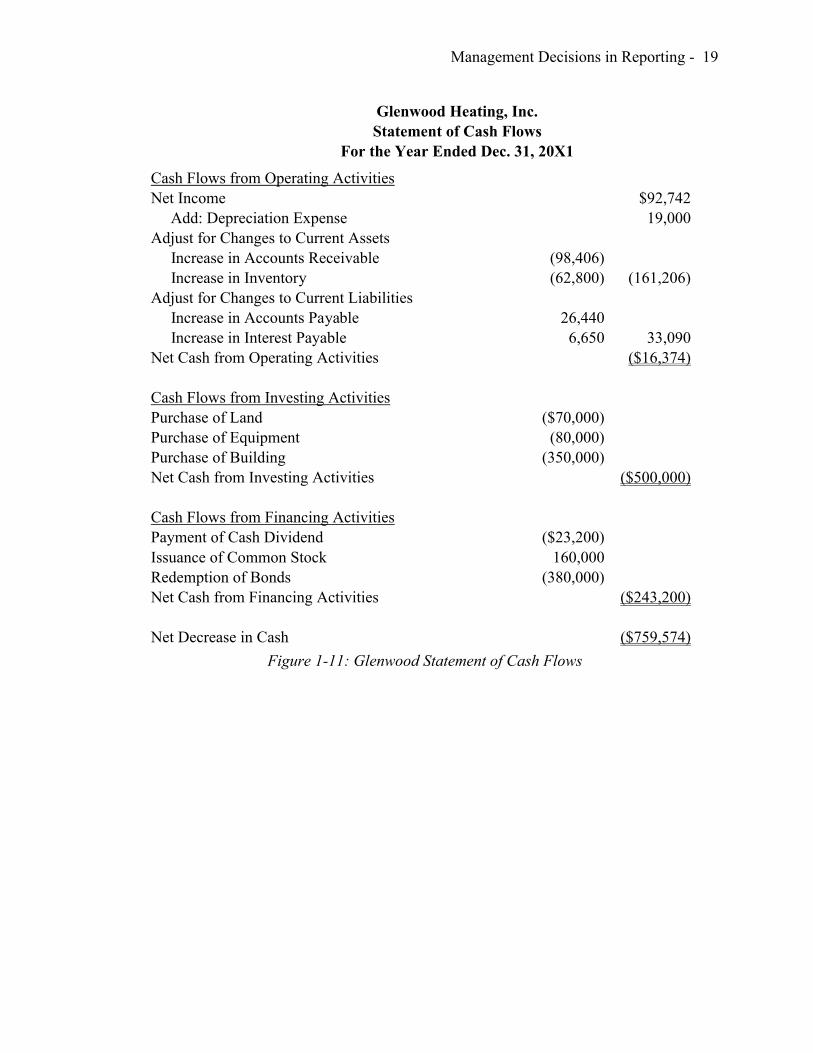
Management Decisions in Reporting - 19
Cash Flows from Operating ActivitiesNet Income $92,742
Add: Depreciation Expense 19,000Adjust for Changes to Current Assets
Increase in Accounts Receivable (98,406)Increase in Inventory (62,800) (161,206)
Adjust for Changes to Current LiabilitiesIncrease in Accounts Payable 26,440Increase in Interest Payable 6,650 33,090
Net Cash from Operating Activities ($16,374)
Cash Flows from Investing ActivitiesPurchase of Land ($70,000)Purchase of Equipment (80,000)Purchase of Building (350,000)Net Cash from Investing Activities ($500,000)
Cash Flows from Financing Activities Payment of Cash Dividend ($23,200)Issuance of Common Stock 160,000Redemption of Bonds (380,000)Net Cash from Financing Activities ($243,200)
Net Decrease in Cash ($759,574)
Glenwood Heating, Inc.Statement of Cash Flows
For the Year Ended Dec. 31, 20X1
Figure 1-11: Glenwood Statement of Cash Flows

Management Decisions in Reporting - 20
Glenwood Heating, Inc.Financial Ratios
Figure 1-12: Glenwood Table of Financial Ratios
Liquidity RatiosCurrent Ratio 3.04Acid-test Ratio 1.86Accounts Receivable Turnover 4.05Days to Collect Receivables 90.13Inventory Turnover 2.82Days to Sell Inventory 129.50 daysOperating Cycle 219.64 days
Profitability RatiosGross Profit Margin 55.58%Profit Margin 23.27%Return on Assets (ROA) 14.43%Return on Owners’ Equity (ROE) 40.40%Earnings per Share (EPS) $28.98 per share
Long-Term Solvency RatiosDebt Ratio 64.28%Times Interest Earned 5.47x

Case 2: Relevant Income and Assets
Executive Summary
Before investing in a company, potential investors want to know if the company
will be profitable in the future. Therefore, it is very beneficial to see an estimated
persistent income and estimated earnings per share using that persistent income to
determine whether or not investing in the company would be advantageous. In addition, it
is significant to calculate several ratios, including the net profit margin, net asset turnover
ratio, and the return on net operating assets. Analysis of these ratios will help the
potential investor determine the predicted profitability of the company, and therefore give
them a reasonable expectation for the future earnings of the company. It is crucial when
predicting the future earnings of a company to classify the items on its income statement
and balance sheet as operating or nonoperating and recurring or nonrecurring. Items that
are considered both operating and recurring are the most significant when attempting to
predict a company’s future profitability.
Upon analysis of these statements and the calculated ratios, I would invest in
Molson Coors for several reasons. First of all, they have a positive persistent net income,
suggesting that they will be profitable in the future if no incredibly abnormal events
occur. In addition, the net operating profit margin, the net operating asset turnover, and
the return on net assets suggest that the company will be profitable and that they are
doing well in their operations. Also, I calculated the earnings per share for both diluted

Relevant Income and Assets - 22
shares and basic shares. For the diluted shares, the earnings per share is $5.46 and for
basic shares $5.50. These are both fairly high, further supporting that the profit for
coming periods would be beneficial for investors.
For my first step of analysis, I calculated a persistent net income. Persistent
income only includes those items that are recurring; those that can be expected to appear
on a future income statement. There are several items that are nonrecurring, or transitory,
which means that they may not occur every period and are the result of atypical events.
These nonrecurring items include special items, other income, and discontinued
operations. To calculate a persistent operating income, one does not include these
nonrecurring items, so the total net income can be assumed to come close to a future net
income. I estimate that future income will be around $728.64 million. Because this total
is not only positive, but also high, it shows that the company will continue to be
profitable in the future, and it will be able to afford to pay their expenses with sufficient
funds to invest and expand the business.
Next I recognized the importance of only considering operating items on the
income statement and balance sheet when considering future profitability. Operating
items are those that are related to the core operations of the business. For Molson Coors,
operating items are related to the brewing and selling of beer. Stock price increases come,
not from financing and investing decisions, but from operations. There are six income
statement items that are nonoperating, including interest expense, interest income,
income tax, loss attributable to noncontrolling interests, other income, and income from
discontinued operations. For explanations of why these items are considered
nonoperating, see appendix l. However, there were a few significant items classified as

Relevant Income and Assets - 23
nonoperating. The company was selling some outside investments, including a limited
partnership in the Colorado Rockies Baseball Club, Ltd., an investment in the Montreal
Canadians, the ownership of water rights, and a non-core real estate in Colorado. None of
these investments were involved in the core operations, so although the investment may
have been producing money for the income, they were not involved in the core relations
of the company.
I calculated a net operating profit after tax of $885.016 million in 2013 and
$702.112 million in 2012. I predict that the net operating profit after tax will continue to
increase in the future, which will therefore increase the future stock price. This shows
that the company is becoming more and more profitable, and is a safer investment.
In addition, one must also look only at operating assets to determine profitability.
Nonoperating assets are assets that are not essential to the ongoing operations of a
business, but may still generate income or provide a return on investment. For Molson
Coors, these include other current assets, deferred tax assets, goodwill, investment in
MillerCoors, deferred tax assets, and other assets. For explanations of why these are not
included as operating assets, see appendix m. In addition, when calculating the net
operating assets, one must subtract the operating liabilities. In 2013, the net operating
assets were worth $8887.6 million, and in 2012, they were 9689.7. The average net
operating assets of these two years are $9288.65 million, which will be used to calculate
both net operating asset turnover and return on net operating assets.
The return on net operating assets is a very significant measure of the firm’s
profitability that takes into account both operating profit margin and net operating asset
turnover. In 2013, the return on net operating assets was 9.96 percent, and in 2012, 7.25

Relevant Income and Assets - 24
percent. This increase, as well as the increases in operating profit margin and net
operating asset turnover, suggests that the company is going to continue increasing in
profitability. Another calculation that supports this prediction is the return on net assets
using persistent income numbers. Using the persistent income numbers I calculated
previously, I calculated a persistent return on net operating assets of 9.53 percent, an even
better predictor of future profitability. Because of all of this careful analysis of the
operating income statement and balance sheet items and the recurring income statement
items, I would suggest investing in Molson Coors. I believe it will be profitable in the
future, and it will produce good returns for investors.

Relevant Income and Assets - 25
Appendix
a) The major classifications on an income statement are revenues, expenses, gains, and losses.
b) Creating a classified income statements means arranging the material so that important relationships are shown. Classified income statements are required under U.S. GAAP because the FASB has often noted that the parts and subsections of financial statements can be more informative than the whole. Companies should report and classify individual items in sufficient detail to permit users to assess the amounts, timing, and uncertainty of future cash flows.
c) Financial statement users are interested in a measure of persistent income because they want to know how much income the company can make in the future. Irregular items and nonrecurring items do not reflect a company’s future earning power.
d) Comprehensive income includes all changes in equity during a period except those resulting from investments by owners and distributions to owners. Like net income, it includes all revenues, gains, expenses, and losses. However, it also includes all gains and losses that bypass net income but affect stockholders’ equity, and it does not include investments by owners or distributions from owners.
e) Net sales subtracts excise taxes from sales. Excise taxes collected from customers and remitted to tax authorities are government-imposed excise taxes on beer shipments.
f)i. Special items include infrequent or unusual items, impairment or asset
abandonment-related losses, restructuring charges and other atypical employee-related costs, or fees on termination of significant operating agreements and gains/losses on disposal of investments.
ii. Special items are separate from other line items because they cannot be placed into any other category. Special items are charges or gains that are not believed to be indicative of core operations. Operating expenses include those expenses that are part of the company’s principal operations. They are included as operating expenses because they are related to brewing and selling beer, and are not necessarily nonrecurring. They are in some way related to the core operations – some are related to employees, some to restructuring to make a more efficient business, one to discontinuation of a part of the beer packaging, and others to administrative expenses. I agree with this classification to some extent, although I think you could also rightfully consider them an “other expense.”
g) There seems to be a lot of overlap between the two. In the notes of the financial statements, it says that special items represent charges incurred or benefits realized that are not believed to be indicative of the core operations, but other income/expenses are distinctly associated with activities not directly related to brewing and selling beer. Other income/expense items are more directly related to foreign expenses. I recognize that there was a foreign item listed under special

Relevant Income and Assets - 26
items, the sale of the interest in the MC Si’hai joint venture. This is connected to their operations, while perhaps not being a core operation, because it represents an attempt to expand into China. Other income also includes the sale of the investment in the Colorado Rockies Baseball Club, the gain for proceeds received related to the former investment in the Montreal Canadians, and a gain related to the sale of water rights. None of these are in any way related to the core operations of the business.
h)i. In 2013, comprehensive income is $760.2 million, and net income is
$567.3 million. The difference is $192.9 million.ii. Comprehensive income does not include investments by owners or
distributions to owners. Therefore it starts with the net income including noncontrolling interests line item. From there, it adds several items that are not really tied to a particular product. Some of the items in the comprehensive income seem to be administrative expenses, including pensions, amortization, unrealized holding gains and losses, and reclassification of derivative gains and losses to income.
i) I expect that income from discontinued operations, some items in other income, and perhaps some items contained in special items will not necessarily recur. There are specific items in both other income and special items that will most likely not recur at all. I expect that both of these line items will recur, as they have occurred on the income statements of the past 3 years, but I expect they will be at very different amounts. I doubt income from discontinued operations will recur at all.
j)i. The effective tax rate is 12.83 percent in 2013.ii. I expect an effective tax rate around 12.8 percent to persist. In 2011 and
2013, the effective tax rate was 12.8 percent. In 2012, there was an increased statutory corporate income statement in Serbia, which will likely not cause a spike in effective tax rate again. The Acquisition also drove the change in the effect of foreign tax rates in 2012 and 2013 because of the statutory tax rates in the Central European countries.
k) I estimate a persistent income of $728.64 million. I found this number by adding back to the net income the expense from special items and the other expenses. I also subtracted the gain from discontinued operations. In addition, I used the 12.8percent tax rate to determine net income after tax.
l)i. Six things included on the income statement are nonoperating. These
include interest expense, interest income, income tax, loss attributable to noncontrolling interests, other income, and income from discontinued operations. First, interest expense and interest income are nonoperating because the company does not have the borrowing and lending of money as a main operation. Next, income tax is subtracted from net income, but has nothing to do with the operations of the corporation. Income or loss attributable to noncontrolling interests is nonoperating because that is from investments in other companies in which their ownership is not

Relevant Income and Assets - 27
enough that they have any say in how the business is run. Other income includes items such as gain on sale of non-operating assets, bridge facility fees, and other items that are related to foreign affairs. Therefore, none of these are related to the core operations of the business. Finally, discontinued operations include segments of a company’s business that have been sold, disposed of, or abandoned. It is no longer related to the core operations of the business.
ii. Total after-tax amount of nonoperating items, 2013: $-172.93 millioni. (-183.8 +13.7 + 18.9 + 2 – 5.2) + 154.4(.12) = -172.93
Total after-tax amount of nonoperating items, 2012: $-302.29 millioni. (-196.3 + 11.3 – 90.3 + 1.5 + 3.9) + 269.9(.12) = -302.29
iii. Net operating profit after tax, 2013: $885.016 millionNet operating profit after tax, 2012: $702.112 million
m)i. Nonoperating assets are assets that are not essential to the ongoing
operations of a business, but may still generate income or provide a return on investment. For Molson Coors, these include other current assets, deferred tax assets, goodwill, investment in MillerCoors, deferred tax assets, and other assets. Other current assets and other assets are not explained in the notes, so we can assume that they are not currently essential to the core business. Deferred tax assets, both current and noncurrent, are created due to taxes already paid but not yet reported on the income statement. They help reduce the company’s future tax liability. Goodwill is the record of intangible assets obtained upon purchase of another company that are not typically included on a balance sheet. Finally, an investment in MillerCoors may generate revenue, but it is not a part of the main operations of Molson Coors.
ii. Net operating assets, 2013: $8,887.6 millionNet operating assets, 2012: $9,689.6 million
n)i. RNOA, 2013: 9.96%
i. 885.016/8887.6 RNOA, 2012: 7.25%
ii. 702.112/9689.7 ii. In 2013, the return on net operating assets increased. By analyzing this
ratio alone, one could incur that the company got more productive. In 2013, the net operating profit after tax went up, and the net operating assets went down. As a whole, the increase in this ratio from 2012 to 2013 means the company increased in profitability.
o)i. Operating profit margin, 2013: 14.75%
i. 885.016/5999.6 Operating profit margin, 2012: 12.50%
ii. 702.112/5615ii. Net operating asset turnover, 2013: 67.51%

Relevant Income and Assets - 28
i. 5999.6/8887.6Net operating asset turnover, 2012: 57.95%
ii. 5615/9689.7iii. For every dollar of sales revenue, Molson Coors is earning $.1475 in 2013
and $.125 in 2012 of after tax operating profit. For every dollar of operating assets, the company is earning $.6751 in 2013 and $.5795 in 2012 of sales revenue. Net operating profit margin and net operating asset turnover increased from 2012 to 2013. They have become more efficient in using their assets to generate sales, and they are generating more profit from sales and operating expenses in 2013 than in 2012.
p) RNOA, 2013: 9.53%i. Using the persistent income is a better predictor of future profitability.
This income has been calculated without including nonrecurring items. Therefore, it is more likely to predict what will actually happen, as it has already taken out the income items that are unlikely to affect the income in the future.

Relevant Income and Assets - 29
Operating Non-OperatingRecurring (persistent) (permanent)
∑ Sales ∑ Excise Taxes ∑ Cost of Goods Sold∑ Marketing, General,
Administrative Expenses
∑ Equity Income
∑ Interest Expense ∑ Interest Income ∑ Income Tax ∑ Loss Attributable to
Noncontrolling Interests
Non recurring (transitory)
∑ Special Items ∑ Other Income ∑ Income from
discontinued operations
Operating Non-Operating∑ Cash ∑ Accounts and Notes
Receivable (current)∑ Inventories∑ Maintenance and
Operating Supplies∑ Properties∑ Other Tangibles∑ Longterm Notes
Receivable
∑ Other Assets (current and longterm)
∑ Deferred Tax Assets (current and longterm)
∑ Goodwill∑ Investment in
MillerCoors
Figure 2-1: Operating vs. Non-Operating Income Statement Items
Figure 2-2: Operating vs. Non-Operating Balance Sheet Items
Operating vs. Non-Operating Income Statement Items
Operating vs. Non-Operating Balance Sheet Items

Relevant Income and Assets - 30
2013 2012Cash and Cash Equivalents 442.3 624Accounts and Notes Receivable, Total 728 753.4Total Inventories 205.3 213.9Maintenance and Operating Supplies 29.6 28.3Properties 1970.1 1995.9Other Intangibles 6825.1 7234.8Notes Receivable 23.6 26.3Total Operating Assets 10224 10876.6Average Total Assets 10550.3
Operating LiabilitiesAccounts Payable and other Current Liabilities 1336.4 1186.9Net Operating Assets 8887.6 9689.7Average Net Operating Assets 9288.65
2013 2012Operating Income 1005.7 948.80Operating Income - Income tax -120.68 -246.69Net Operating Profit after Tax 885.02 702.11Net Operating Assets 8887.60 9689.70RNOA by year 9.96% 7.25%Operating Profit Margin by Year 14.75% 12.50%Net Operating Asset Turnover 67.51% 57.95%
Figure 2-3: Comparative Yearly Calculations
Figure 2-4: Comparative Table of Operating Assets and Liabilities
Comparative Yearly Calculations
Comparative Table of Operating Assets and Liabilities

Relevant Income and Assets - 31
RNOA 9.53%Operating Profit Margin, 2013 14.75%Average Net Operating Asset Turnover 64.59%
Other calculations:
Earnings per Share: Basic: 1005.7/183 = $5.50Diluted: 1005.7/184.2 = $5.46
2013 2012Sales 5999.6 5615Excise Taxes -1793.5 -1698.5Net Sales 4206.1 3916.5Cost of Goods Sold -2545.6 2352.5
Gross Profit 1660.5 1564Marketing, General, and Administrative Expenses -1193.8 -1126.1Equity Income in MillerCoors 539 510.9
Operating Income 1005.7 948.8Other Income (expense)
Interest Expense -183.8 -196.3Interest Income 13.7 11.3
Total other Income -170.1 -185Income from Continuing Operations before Tax 835.6 763.8Income Tax -106.96 -199.35Net Income from Continuing operations after Tax 728.64 564.45
Figure 2-5: Persistent Income Statement
Persistent Income Statement

Case 3: Statement of Cash Flows
Executive Summary
A statement of cash flows is used to provide information about the relevant cash
payments and receipts during a period. It allows a user to easily see a company’s inflows
and outflows of cash and to quickly recognize whether a company has a net increase or a
net decrease in cash. This is important because it is more favorable for a company to have
a net increase in cash, thus to be earning more cash than it is paying. Analysis of the
statement of cash flows also allows the user to perceive the source of the cash and the
purpose of the cash for the period. It is required by the FASB in addition to the balance
sheet, the statement of stockholders’ equity, and the income statement, but information
given in these other statements is used to prepare the statement of cash flows.
The statement of cash flows is divided into three sections: the operating section,
the investing section, and the financing section. The operating section contains the cash
effects of transactions that enter into the determination of net income. This section may
be prepared using either the direct or the indirect method. The direct method documents
the receipt and payment of cash for various activities, whereas the indirect method starts
with net income from the income statement and adjusts it to convert it from the accrual
basis to the cash basis. The investing section includes changes in noncurrent assets,
specifically the purchase of or the proceeds from property, plant, and equipment. The
financing section includes contributions from owners and distributions to owners as well
as the receipt or payment of cash in exchange for loans from creditors.

Statement of Cash Flows - 33
In our preparation of the statement of cash flows, we will begin with the operating
section. Golden Enterprises, Inc. uses the indirect method to construct its operating
section, so the first line item will be the net income listed on the income statement. From
there, we will make the adjustments necessary to convert net income, which was
determined on an accrual basis, to the net cash flow from operating activities. The first
adjustment necessary is the depreciation expense. Depreciation expense is designed to
gradually reduce the recorded cost of an asset over its useful life. Every period, the
company records depreciation expense to allocate a portion of the cost of the asset to the
current period. It is included as an expense and subtracted from revenues on the income
statement, but it is not an expenditure of cash. It is included on the income statement
because it decreases taxable income, and companies want their taxes to be as low as
possible. However, because it does not actually involve an exchange of cash, we will add
it back to net income.
Next, we add back the gain on the sale of property and equipment. To determine
the amount necessary to be added, we must create two T-accounts, one for total property
and equipment at cost and another for accumulated depreciation. These T-accounts can
be found in Appendix G part 1. For the property and equipment T-account, we are given
that Golden Enterprises, Inc. purchased $4,149,678 of new property, plant, and
equipment for cash. We are also given that the initial balance on June 1, 2012, in property
and equipment was $89,285,723, and the ending balance on May 31, 2013, was
$93,022,443. The initial and ending balances are both debits, as is the purchase of new
property, plant, and equipment. Therefore, we are looking for the credit amount necessary
to balance the debits and credits, and we find that to be $412,958. This is the cost of the

Statement of Cash Flows - 34
disposed property. Next, we must determine the related accumulated depreciation on the
disposed property. For the accumulated depreciation T-account, we are given that the
depreciation expense for 2013 was $3,538,740. We also know by looking at the income
statement that the beginning accumulated depreciation balance was $62,788,133, and the
ending balance was $65,927,389. All three of these amounts are credits, since the normal
balance for accumulated depreciation is a credit balance. Therefore, to have the account
balance, there must be a credit of $399,484, the related accumulated depreciation on the
disposed property. The difference between the cost of the property and the related
accumulated depreciation, $13,474, is the net book value. This value is much less than
the proceeds from the sale of the property, $74,514, so $61,040 is the net gain on the sale
of property and equipment. This value is subtracted from net income to prevent double
counting the sale, which will later be presented in the investing section.
Now we want to make the adjustments for changes in current assets and current
liabilities. The T- account balances may be found in Appendix G part 2. We will subtract
increases in assets and add decreases in assets, and we will add increases in liabilities and
subtract decreases. An increase in accounts receivable means less cash is coming to the
company, and more cash will be received in the future. Therefore, for right now, we need
to subtract the change in accounts receivable from net income to account for the cash that
will be received later. A decrease in inventory means that less cash was spent on
inventory, which translates to an increase in cash to the net income. A decrease in
prepaids means the cash will be spent later, but for now, it is being saved. We must add
that cash back to the net income since prepaids were initially subtracted. Although this
goes against the rule of subtracting increases, an increase in the cash surrender value of

Statement of Cash Flows - 35
insurance is added to net income. Our next step is to adjust current liabilities. A decrease
in accounts payable must be subtracted from net income, because accounts payable were
paid back with cash over the course of the period. An increase in accrued expenses will
be added to net income because cash will be paid for expenses in the future, but for now
cash has not yet been disbursed for the expenses listed on the income statement. This
finishes up our operating section. We will now take net income and add or subtract the
adjustments, leaving us with net cash provided by operating activities of $4,729,373.
Having finished the operating section, we will now move to the investing section.
This section generally includes cash flows related to noncurrent assets. For Golden
Enterprises, Inc., only the purchase of property, plant, and equipment and the proceeds
from the sale of property and equipment are listed. We are given that the company spent
$4,149,678 on capital expenditures, and we are also given that the company received
$74,514 in the sale of property and equipment. The expenditures are subtracted, as there
is an outflow of cash, and the proceeds are added, as there is an inflow of cash. There is a
net outflow of cash of $4,075,164, the net cash used in investing activities.
The final section on the statement of cash flows is the financing section. This
section generally includes cash flows related to noncurrent liabilities and equity, but
short-term notes payable and dividends payable are also listed as financing activities. The
first line item is long-term debt. We combined the “current portion of long-term debt,”
“line of credit outstanding,” and “notes payable – bank” from the income statement on
our statement of cash flows. This amount was credited on our notes payable and long-
term debt T-account, so it is a cash inflow. In addition, we are told that the company
issued $38,361,200 of new debt and spent $38,287,529 to repay debt. This cash payment

Statement of Cash Flows - 36
is listed as an outflow and the receipt as an inflow on the statement of cash flows. The
change in checks outstanding in excess of bank balances was debited, so we subtracted it
from the statement of cash flows as a net outflow of cash. Accrued taxes are the taxes that
a company already owes but has not yet paid. Therefore, since the taxes were counted on
the income statement as expenditures but not yet paid, we added the accrued taxes back
to the statement of cash flows. Deferred taxes are taxes that the company paid before they
were due, and thus have not yet been charged as income tax expenses. Although they
have not yet been counted as expenses on the income statement, these taxes have already
been paid. Therefore, we subtracted the change in deferred taxes as an outflow of cash.
The change in salary continuation plan was also debited, so we subtracted it as an outflow
of cash. Finally, from the equity section, we had cash dividends paid and treasury stock
purchased, both of which are obviously a net outflow of cash. There is a net outflow of
$1,790,914 used in the financing section.
Having completed all the sections of the statement of cash flow, we can calculate
our net decrease or increase in cash and cash equivalents. To do so, we simply take the
sum of the ending inflows or outflows of the operating, investing, and financing sections.
Golden Enterprises, Inc. has a net decrease in cash and cash equivalents of $1,136,705.
This tells us that the company spent more cash than it received. We can also check this
number because the balance sheet gives us the original cash balance and the ending cash
balance. The beginning balance minus the decrease in cash should equal the ending
balance. It does on our statement of cash flows, so we prepared the statement correctly.
Since we successfully completed the statement of cash flows, we can now analyze
it to learn more about the company’s profitability and ability to generate cash. At first

Statement of Cash Flows - 37
glance, this company does not seem to have an ability to generate cash, because it has a
net decrease in cash. However, when we examine the cash inflows and outflows, we see
that the company spent a lot of cash on capital expenditures. While this significantly
decreases the amount of cash the company has in the current period, the company will
hopefully increase its sales revenue in the future as a result of the increase in productive
capacity. The net cash flow from operations is positive, which means the company is
profitable and generating revenue. Although the profit margin is fairly low, the company
is generating a source of cash, and it seems to be fairly consistent with the profit margins
of Golden Enterprises, Inc.’s competitors. We can also see by calculating the company’s
return on assets and return on equity, calculated in Appendix I, that the company is both
using its assets efficiently to generate income and using its earnings effectively to
generate earnings growth. In the management discussion and analysis section of the 2013
Form 10-K, the company indicates that it expects for its capital expenditures to increase
and be approximately $5,000,000. This will again cause a significant outflow in the
investing section. Although the company does not have the free cash available for this
expenditure, we can assume that it is hoping to use the cash that will soon be generated
by the expansion to produce an increase in net cash in the future. As a whole, Golden
Enterprises, Inc. is profitable and is working to become even more profitable.

Statement of Cash Flows - 38
Appendix
a) The primary objective of a statement of cash flows is to provide relevant information about the cash payments and cash receipts of a company during a period. To do so, the statement of cash flows reports the following: the cash effects of operations during a period, investing activities, financing activities, and the net increase or decrease in cash during the period. The statement of cash flows therefore provides information documenting the change in the cash balance during the period, the source of the cash, and the purpose of the cash for the period. The statement’s value is that it helps users evaluate liquidity, solvency, and financial flexibility. In contrast, the income statement provides information about resources provided by operations, but does not specifically demonstrate the inflows and outflows of cash. The income statement focuses instead on calculating a net income, while the statement of cash flows focuses on calculating a net inflow or outflow of cash.
b) The two different methods for preparing the statement of cash flows include the direct method and the indirect method. These differ in the manner in which the operating section is prepared. Using the direct method, cash flows due to operating activities arise from the collection of cash from customers and the payment of cash to suppliers, employees, and others. The income statement is reconstructed and put on a cash basis. Under the indirect method, net income is adjusted from the accrual basis, which is most often used on the income statement, to the cash basis. Non-cash accounts such as depreciation, amortization, accounts receivable, accounts payable, and others are added or subtracted from the net income. Golden Enterprises, Inc. uses the indirect method to prepare its statements of cash flows. This is evident because rather than recording the receipt or payment of cash, the statement shows the adjustments to net income. Most companies construct their statements of cash flows using the indirect method because it is easier to prepare. The direct method requires a reconciliation, which is essentially the same as the operating section prepared using the indirect method, so only using the indirect method saves time. The indirect method also provides a more direct link between the statement of cash flows, the balance sheet, and the income statement. Companies already have the transactions necessary for the statement of cash flows recorded in these other two statements, so they do not have to maintain separate accounting for cash transactions.
c) The three sections of the statement of cash flows are the operating section, the investing section, and the financing section.
d) The operating section contains the cash effects of transactions that enter into the determination of net income. Changes in the balances of accounts receivable, inventory, prepaid expenses, and accounts payable are all found on the balance sheet and are used to adjust net income on the statement of cash flows. The investing section includes making and collecting loans and acquiring and disposing of investments and property, plant, and equipment. Long-term investments like bonds payable and intangible assets such as patents are found on the balance sheet, and the purchase or sale of these are recorded on the statement

Statement of Cash Flows - 39
Accounts receivable, net Inventories10,566,073 5,156,798
106,367 200,98510,459,706 4,955,813
Prepaid expensesAccrued income taxes, net (combined)
1,754,874 59,894200,137 113,369
1,554,737 53,475
Cash surrender value of life insurance Other assets
758,667 1,450,73262,906 191,298
695,761 1,642,030
2)
of cash flows. Financing activities involve liability and owners’ equity items. Contributions from owners and distributions to owners are included in this section, as is the receipt or payment of cash in exchange for loans from creditors. These are found in the equity section of the balance sheet in the retained earnings and common stock accounts.
e) Cash equivalents are short-term highly liquid investments that will mature within three months or less. These include T-bills, commercial paper, and money-market funds.
f) Net income is determined on an accrual basis, but the function of the statement of cash flows operating section is to adjust net income to the cash basis. Therefore, the operating section begins with net income under the accrual basis and adjusts it in accordance with the non-cash transactions from the period.
g)1)Total property and equipment at
cost Accumulated depreciation89,285,723 399,484 62,788,1334,149,678 412,958 3,538,740
93,022,443 65,927,389
Net Book Value=412,958-399,484=13,474Gain on sale from property and equipment = 74,514-13,474=61,040

Statement of Cash Flows - 40
Checks outstanding in excess of bank balances Accounts payable
1,710,417 6,025,465267,502 1,216,399
1,442,915 4,809,066
Other accrued expensesSalary continuation plan
(combined)4,472,079 1,279,233954,938 49,7745,427,017 1,229,459
Notes payable and long-term debt Deferred income taxes, net7,358,681 2,894,12373,671 185,9397,432,352 2,708,184
Common stock Additional paid-in capital9,219,195 6,497,954
0 0 0 09,219,195 6,497,954
Retained earnings Treasury shares19,607,056 10,925,759
333,842 6,86019,273,214 10,932,619

Statement of Cash Flows - 41
Golden Enterprises, Inc.Statement of Cash Flows
For Year Ended 12/31/2013Cash Flows from Operating ActivitiesNet Income $1,134,037Adjustments to reconcile net income to net cash
Depreciation expense 3,538,740Gain on sale of property and equipment (61,040)
Decrease in receivables – net 106,367Decrease in inventory 200,985Decrease in prepaids 200,137Increase in cash surrender value of insurance 62,906Increase in other assets (191,298)Decrease in accounts payable (1,216,399)Increase in accrued expenses 954,938Net cash provided by operating activities $4,729,373
Cash Flows from Investing ActivitiesPurchase of property, plant, and equipment ($4,149,678)Proceeds from sale of property, plant, and equipment 74,514Net cash used in investing activities ($4,075,164)
Cash Flows from Financing ActivitiesLong-term debt
Issuance of long-term debt $38,361,200Reduction in long-term debt (38,287,529)Total long-term debt 73,671
Change in checks outstanding in excess of bank balances (267,502)Accrued income tax 113,369Deferred income tax (185,939)Salary continuation plan (49,774)Cash dividends paid (1,467,879)Purchase of treasury shares (6,860)Net cash used in financing activities ($1,790,914)
Net Decrease in Cash and Cash Equivalents ($1,136,705)
Cash and Cash Equivalents at Beginning of Year $1,893,816Net Decrease in Cash and Cash Equivalents (1,136,705)Cash and Cash Equivalents at End of Year $757,111
Figure 3-1: Statement of Cash Flows

Statement of Cash Flows - 42
h) Depreciation expense and amortization expense do not actually generate cash for the company. However, on the income statement, depreciation increases expenses and reduces taxable income. This, therefore, decreases the total cash that a company must pay in income taxes. Depreciation expense gets added back in the statement of cash flows because it was not an expense of cash when the income statement was prepared.
i) The gross profit margin for the company is .4846. This means that after accounting for the cost of goods sold, Golden Enterprises, Inc. has $0.49 for every dollar of sales revenue available to pay additional expenses and to save for future investments. The profit margin is .826 percent. For every dollar of sales revenue, the company is earning less than $0.01 of after tax profit. This is not a very good ratio, but as compared to other companies in the processed and packaged goods industry, it is fairly average. The company has a 2.350 percent return on assets. For every dollar invested in assets, the company earns $0.02 in net income. The company has a 4.681 percent return on equity, which demonstrates its ability to use investments to generate earnings growth. Having analyzed the company’s profitability, it is not incredibly profitable, but its profitability ratios are fairly consistent with, albeit slightly lower than, the industry averages. The company’s ability to generate cash is not strong. The company currently has a net decrease in cash, indicating that it is spending more cash than it is earning. However, the investments section is a pretty significant source of the loss. Therefore, although there is a net decrease in cash now, one can hope that those investments will bring in cash in the future and help maintain a net increase in cash. Net income in 2013 is $1,134,037.00, and the net cash from operations is $4,729,373.00. This is partly a result of the significant depreciation expense, which greatly decreased net income. In addition, the decrease in accounts payable and the increase in accrued expenses considerably affected net income. In 2012, net income was $2,207,623, and the net cash from operations was $5,747,290. Again, the great depreciation expense was a major factor in this difference. The decrease in accounts payable was not as sizable in 2012, but the great balance of accrued income taxes was a big increase in the adjustment to net operating cash flows.
j) The company seems to be expanding its productive capacity. By analyzing the cash flows from investing activities, one can see that in 2012, the company paid $5,214,408 for the purchase of property, plant, and equipment, and in 2013, the company paid $4,149,678 for capital expenditures. Therefore, it can be assumed that the company is making significant investments in property, plant, and equipment to create future growth for the company.
k) In 2012, Golden Enterprises, Inc. spent $5,214,408 on capital expenditures, and it spent $4,149,678 in 2013. However, in both years, there was a net decrease in cash and cash equivalents. If the company plans to spend $5,000,000 again in 2014, one can expect that unless something changes significantly, there will once again be a net decrease in cash. The company does not have enough free cash flow to fund these expenditures. The net sales did increase from 2012 to 2013, so hopefully the company plans to further increase sales in the coming year. In

Statement of Cash Flows - 43
addition, these investments are assumed to pay off in the future, so the current net decrease in cash flow may be reversed as net sales increase. Although the number of authorized shares did not change between 2012 and 2013, the company may also plan to increase the number of shares of common stock authorized, therefore increasing the cash flows from financing activities.

Case 4: Accounts Receivable and Estimations
Executive Summary
Pearson is an international company that is known for providing learning
materials, technologies, assessments, and services to educational institutions,
corporations, and professional organizations, as well as to teachers and students. As a
merchandising company, Pearson sells inventory to customers all over the world, and it
needs to keep track of these transactions. Most companies do not expect all purchases to
be made with cash, and in fact, anticipate that most sales will be paid in the future.
Therefore, these companies extend credit to their customers. Unfortunately, companies
are aware that not all of the sales they make on credit will be collected. Some individual
customers may simply never pay, or a business may go bankrupt without having enough
money to pay its debt. In addition, not all customers will be satisfied with their purchases.
Some customers may wish to return the products they purchased, and some customers
may ask for an allowance to decrease the price of the unsatisfactory product that they
choose to keep. With this in mind, companies must keep an account of the amount that is
estimated to be uncollectible or returned, as well as the amount that has already been
returned or is proven to be uncollectible.
Accounts receivable may never be paid because of two occurrences that were
discussed in the previous paragraph. The first event that would cause a decrease in
receivables is if a customer never pays his debt to the company. A customer may

Accounts Receivable and Estimations - 45
alternatively return the inventory he purchased or ask for a discount. We will first address
the customers forfeiting on debt. There are two accounts that are used to keep track of
these uncollectible receivables. The first is the provision for bad and doubtful accounts.
This is a balance sheet account, and it is a contra receivable. This means that it decreases
the balance of accounts receivable. The second is the bad and doubtful debt expense
account, which is on the income statement. It is found as an operating expense, and it
reduces net income. There are also two accounts that are updated as sales are returned
and discounted. The first of these accounts is the sales returns and allowances account.
This is an income statement account, found as a reduction to sales right below the sales
line item. The other account is the provision for sales returns. Like the provision for bad
and doubtful debts, this is a balance sheet account, and is found as a decrease from
accounts receivable.
There are several things that affected Pearson’s provision for bad and doubtful
accounts in the most recent period, for which the t-account may be found in Appendix f.
The first account on the table is the exchange differences. Although Pearson is
headquartered in London, England, it does business all over the world. As a result,
differences in currency affect the amount of credit that Pearson does not expect to collect.
We next need to account for income statement movements. Because the bad and doubtful
expense account is the only account that affects the income statement, we can assume
that this £26,000,000 is the estimated amount that is not expected to be collected based
on prior experiences. Pearson’s next line item is the utilized account, which is another
way of saying the amount written off over the year. When an account is definitely
decided to be uncollectible, the amount is debited from the provision for bad and doubtful
Accounts Receivable and Estimations - 46
debts. The amount is also credited to accounts receivable, removing it from the owed
payments. Finally, Pearson has received £3,000,000 of uncollectible debts from business
combinations that also need to be recorded. Having analyzed these transactions, both the
provision for bad and doubtful debts and the bad and doubtful debts expense account
express the proper amount at the end of the year.
The provision for sales returns and allowances is an account created for sales that
are either returned for full credit or are kept by the customer at a discounted price.
Throughout the year, customers will without a doubt make returns for unsatisfactory or
no longer desired inventory. They also might agree to keep damaged merchandise instead
of returning it in exchange for an allowance. Each of these processes will affect the sales
balance, and it must be updated for the current period. Pearson’s t-account for the 2009
provision for sales returns may be found in Appendix g. Pearson must first estimate the
amount of returns and allowances it expects for the year. It will calculate this estimate
based on prior years. When journal entries for this estimate are recorded, the sales returns
and allowances account will be debited, and the provision for sales returns and
allowances will be credited. As inventory is returned or allowances are granted, the
provision for sales returns and allowances will be debited, and accounts receivable will
be credited. At the end of the period, Pearson had more returns and allowances than it
estimated, so the provision for sales returns increased. Having recorded all of these bad
and doubtful debts transactions as well as the returns and allowances transactions, the
amount left in the balance of accounts receivable is expected to be collectible.
It is necessary to next analyze the gross trade receivables balance. For this t-
account, see Appendix h. The ending balance in the gross trade receivables includes the

Accounts Receivable and Estimations - 47
beginning balance along with several additional amounts debited and credited. Having
entered the beginning balance, it is necessary to debit only the sales amount. The sales
debit is calculated by first using the sales given on the income statement then adding the
provision for sales returns. The sales amount recorded in this t-account is therefore the
amount of gross sales and does not include the contra account that would decrease the
amount. There are also three credits to this t-account. The first is the amount of
receivables that were utilized, or written off, throughout the year. The next is the actual
amount of returns that were made over the course of the year. Finally, the amount of cash
collected must be credited to the t-account. This amount is found by making the t-account
balance. In 2009, we found in our analysis of the gross trade receivables that Pearson
collected £5,641,000,000. Having analyzed the gross trade receivables account, we now
know what changed throughout the year, and we know how much we can expect to
receive from customers based on the actual returns and write-offs.
Finally, we can calculate and analyze Pearson’s accounts receivable turnover and
average collection period. After calculating these ratios, it is apparent that both of them
had improved from the prior year. This is beneficial because it means that Pearson is
collecting its receivables in a timelier manner. It is to a company’s great advantage to
collect receivables quickly because it allows the company to use that cash at an earlier
time. Companies need the cash they are owed from a sale, and a sale does them no good
if they never collect the cash. Therefore, it is a worthwhile endeavor for a company to
attempt to raise its accounts receivable turnover and lower its average collection period.
A company can do so by implementing stricter credit standards, so customers may only
buy if they have the ability to pay the debt in a certain number of days. The company

Accounts Receivable and Estimations - 48
may also decrease its average collection period by ensuring that the invoice is mailed to
the customer more quickly and by mailing a simpler and less time-consuming invoice to
the customer. Receivables are an important area of analysis for a company because a
company that collects cash in a very timely manner is more stable and can be more
profitable than a company with a longer average collection period.

Accounts Receivable and Estimations - 49
AppendixNote: journal entries given in millions
a) An account receivable is a claim held against a customer or another entity for money, goods, or services. In other words, a receivable is money owed by a customer to a company in exchange for goods or services that have been delivered or used, but not yet paid for. Accounts receivable may also go by the name of receivables or open accounts. There are several types of receivables, including accounts receivables, trade receivables, and notes receivables.
b) Notes receivable are written promises to pay a certain sum of money on a specified future date. Accounts receivable are oral promises of the purchaser to pay for goods and services sold. They represent open accounts resulting from short-term extensions of credit. Notes have a contract while accounts receivable do not.
c) A contra account is an account that has a normal balance that is the opposite of the normal balance of its related account. It is used to reduce the value of the related account. Pearson uses two contra asset accounts to reduce trade receivables, including the provision for bad and doubtful debts and the provision for sales returns. The provision for bad and doubtful debts account contains receivables that are not expected to be collected. In addition, some of the goods Pearson sells will be returned, and the customer will not be charged for the sale. Pearson estimates the amount that will be returned from customers, and adds it to the provision for sales returns account.
d) In the percentage-of-sales approach, the company estimates a percentage of net sales that it does not expect to collect based on past experience and the current credit policy. Managers must calculate net sales for this approach by subtracting sales discounts and sales returns and allowances from sales. This percentage multiplied by net sales for the current period represents the year’s bad debt expense. This amount is then added to the beginning balance of the provision for bad and doubtful accounts to calculate the ending balance of the provision for bad and doubtful accounts. Alternatively, the aging-of-accounts procedure uses an aging schedule to apply a different percentage based on past experience to the various age categories. For this method, the company must have information about when the balance is due so thatthe correct percentages can be applied. The percentage for each age of collectibles is multiplied by the associated accounts receivable account instead of sales. This method helps to identify which accounts require special attention by indicating the extent to which certain accounts are past due. Under both methods, the company must have some knowledge of the past uncollectibles in order to estimate a percentage that can be used to forecast the uncollectibles for the current period. The aging of accounts method is generally more precise because it takes into account the length of time the credit has been past due instead of applying the same percentage to all sales. Most companies therefore prefer to use the aging method because receivables are reported at net realizable value.
e) A company expects that some customers will be unable to pay the funds that it owes. Although Pearson is aware of the likelihood of this happening, it still extends credit to the risky customer because it wants its sales to increase. Regardless of whether a customer pays its credit balance or defaults on its credit, Pearson’s sales will not

Accounts Receivable and Estimations - 50
change. In addition, the company does not know which of its customers will be unable to pay its debts. Every time a company lends to a customer, it runs some risk of the customer not paying off the credit. An individual may never respond to the request for funds, or a company may go bankrupt before it is able to pay.
f)i.
There were multiple accounts that affected the balance in the provision for bad and doubtful debts account over the period. The first of these accounts was the exchange differences account. This account represents a gain or loss from the year’s bad debt as a result of currency differences. The £5,000,000 in this account reduces the estimated amount of bad debts. The income statement movement account captures the bad and doubtful debts expense for 2009. The utilized account includes the write offs of the year. The £20,000,000 in this account reduces the provision for doubtful accounts because these bad debts have actually been written off and are no longer expected to be paid by customers. The last change in the provision for bad doubtful debts comes from acquisitions through business combination. This account represents a change in bad debts brought about through mergers with other businesses. This year it increased the provision for bad and doubtful debts by £3,000,000.
ii.1) Income Statement Movements:
Bad and Doubtful Debts Expense 26Provision for Bad and Doubtful Debts 26
Bad and doubtful debts expense is an income statement account. Provision for bad and doubtful debts is a balance sheet account.
2) Utilized Accounts Receivable:
Provision for Bad and Doubtful Debts 20Accounts Receivable 20
Both of these accounts are balance sheet accounts
iii. The provision for bad and doubtful debts expense is listed as an operating expense on the income statement.
Provision for bad and doubtful accounts(in millions)
£72£5
£26£20
£3£76

Accounts Receivable and Estimations - 51
g)i.
ii.1) Estimated Sales Returns:
Sales Returns and Allowances 425Provision for Sales Returns 425
Sales returns and allowances is an income statement account. Provision for sales returns is a balance sheet account.
2) Amount of Actual Book Returns:
Provision for Sales Returns 443Accounts Receivable 443
Both accounts are balance sheet accounts.iii. As a contra revenue account, sales returns appear in the income statement
right below sales. Typically sales are presented less sales returns and sales discounts prior to subtracting the cost of goods sold.
h)
1) Sales on Account:
Accounts Receivable 6,049Sales 6,049
2) Accounts Receivable Collection Activity:
Provision for Bad and Doubtful Debts 20Accounts Receivable 20
Provision for sales returns(in millions)
372425
443354
Gross trade receivables(in millions)
1,47420
6,049443
5,6411,419
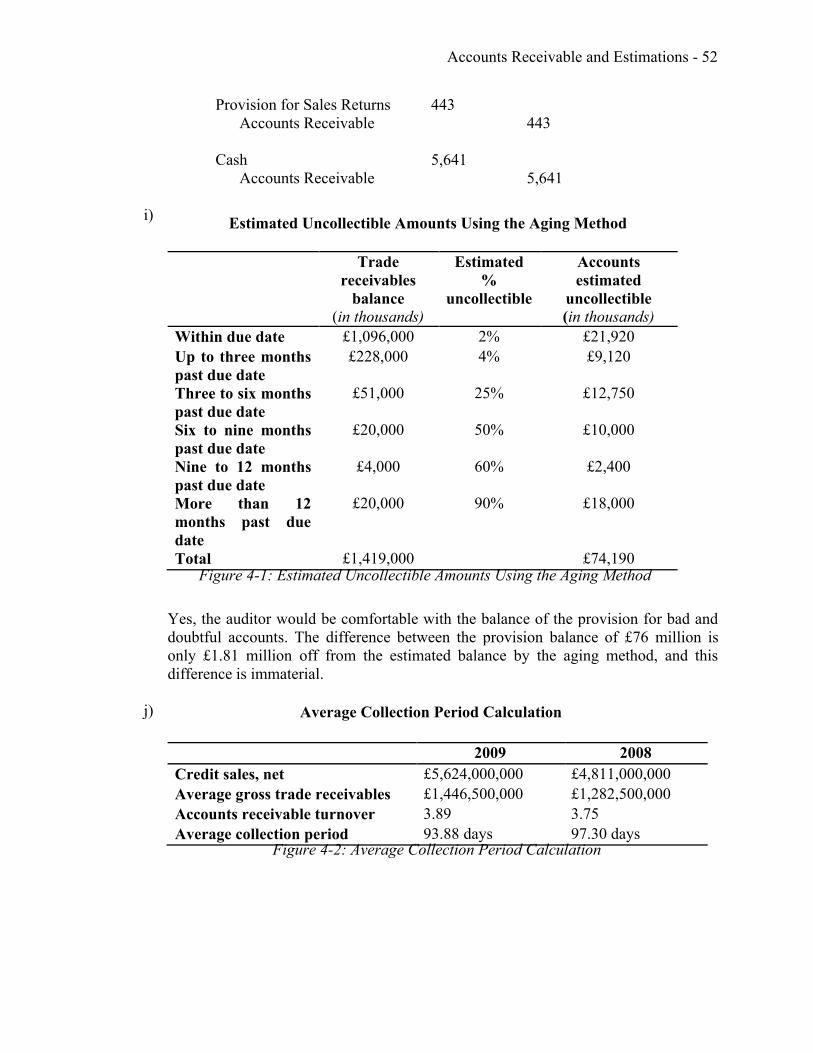
Accounts Receivable and Estimations - 52
Provision for Sales Returns 443Accounts Receivable 443
Cash 5,641Accounts Receivable 5,641
i)
Yes, the auditor would be comfortable with the balance of the provision for bad and doubtful accounts. The difference between the provision balance of £76 million is only £1.81 million off from the estimated balance by the aging method, and this difference is immaterial.
j)
Trade receivables
balance(in thousands)
Estimated %
uncollectible
Accounts estimated
uncollectible(in thousands)
Within due date £1,096,000 2% £21,920Up to three months past due date
£228,000 4% £9,120
Three to six months past due date
£51,000 25% £12,750
Six to nine months past due date
£20,000 50% £10,000
Nine to 12 months past due date
£4,000 60% £2,400
More than 12 months past due date
£20,000 90% £18,000
Total £1,419,000 £74,190
2009 2008Credit sales, net £5,624,000,000 £4,811,000,000Average gross trade receivables £1,446,500,000 £1,282,500,000Accounts receivable turnover 3.89 3.75Average collection period 93.88 days 97.30 days
Figure 4-1: Estimated Uncollectible Amounts Using the Aging Method
Estimated Uncollectible Amounts Using the Aging Method
Average Collection Period Calculation
Figure 4-2: Average Collection Period Calculation

Accounts Receivable and Estimations - 53
The accounts receivable turnover increased from 2008 to 2009, and therefore the average collection period decreased. Analysis of sales and gross trade receivables shows that in 2009, Pearson took more days to collect its credit sales than it did in 2008. This may be a result of several factors, but it is beneficial. Pearson may have adopted stricter credit regulations in an attempt to exclude some customers who were unable to pay in a timely manner in the past. It may have also made simpler invoices or required that employees input the credit sales data earlier so that invoices can be mailed to customers and returned more quickly.
k) There are several ways Pearson can improve its average collection period to align it more with the competition. The first way is to require employees to enter data daily so that invoices can be mailed to customers on a much more timely basis. If invoices are issued earlier, there will be fewer days between the sale and the cash collection. Also, to assist the customers paying the invoice, Pearson should produce clear and simple invoices. Therefore, customers will be able to quickly read the invoice and pay the amount due. In these ways, the average collection time can hopefully be reduced.

Case 5: Inventory and Revenue Recognition
Executive Summary
Graphic Apparel Corporation is a small T-shirt screening business, owned and
operated by Nicki. She inherited the company with very limited business experience.
Although she has an eye for fashion and is a popular fashion blogger, she does not know
how to run her newly acquired business efficiently or effectively. In the past, the
company was fairly stable, selling to consistent retailers, successfully selling the majority
of its inventory, and holding virtually no debt on the balance sheet. When Nicki took over
GAC, though, she made some changes that significantly affected the profitability and
decreased the stability of the company.
For example, when Nicki took over, she changed some of the designs to be much
edgier and more fashion-forward. This enticed many fashion bloggers and critics, but
drove away some of the conservative retailers that had done business with GAC in the
past. Therefore, Nicki sought out new customers that were excited to sell her new
designs. Unfortunately, these retailers are not as well managed as the older customers.
Some of the retailers are unable to pay off their credit to GAC within the required thirty
days. The days to collect receivables increased significantly from 2013 to 2014 as a result
of these unreliable new retailers. Because the prior customers had paid their debts in a
timely manner, GAC was using a direct write-off method. Now, however, I would

Inventory and Revenue Recognition - 55
suggest that the company use the allowance method, estimating the amount of
uncollectible receivables at the end of the period. This estimate should be credited into
the allowance for doubtful accounts, a contra receivable account. This will result in a
more accurate balance in the accounts receivable, and it will portray the receivables at
their net realizable value. Because she estimated $3,000 would be uncollectible for
August, the accounts receivable balance should be decreased by that amount, and the bad
debts expense on the income statement should also be increased by the same amount.
In addition, in an effort to sell more custom shirts, Nicki worked hard to establish
connections with local teams and organizations, which later purchased shirts from the
company. 75 percent of these orders were paid in cash, but people with whom Nicki had
close connections promised to pay the remaining 25 percent at a later date. Company
policy dictates recording a custom order when the sales order has been signed and the
payment has been received. Because Nicki was confident that these balances would be
paid, she made an exception to this rule and recorded $2,500 of receivables from the
custom orders. Not only is this a violation of company policy requiring prepayments, but
in addition, the policy itself is not valid under GAAP. Recording revenue before the
goods have been delivered violates the revenue recognition principle, which states that
revenue should not be recorded until the performance obligation has been satisfied.
Therefore, the policy should be changed so that sales from custom orders are not
recorded until the shirts have been delivered to the customer. Nicki should record this
$7,500 of prepaid sales as unearned revenue, a liability account, and should not yet
record it as sales revenue. In addition, she should not put the $2,500 expected payment on

Inventory and Revenue Recognition - 56
the books at all until the payment is received. Making both of these adjustments will
correct the policy so that it abides by the revenue recognition principle.
Nearly half of the shirts purchased for this period were damaged by a roof leak.
Nicki decided to sell these shirts anyway, choosing to think the destruction was in style.
These shirts are not selling well in the stores, and Nicki is worried about the quantity of
the merchandise that the retailers will return. GAC policy states that the company will
refund a retailer for any returned merchandise, but these returns had been immaterial in
value in the past. This year, however, the returns are expected to be substantial. In prior
years, the company only recorded returns when they were physically returned to GAC.
Because of the significant value of potential returns, I think the company needs to use an
allowance for sales returns, a contra receivable account, to decrease the accounts
receivable balance. Nicki expects $15,000 worth of merchandise to be returned. This
estimated amount should be debited to the sales returns and allowances account and
credited to the new allowance for sales returns. The estimated $15,000 of sales returns
that is already in the accounts should instead be credited to the allowance for sales
returns. This adjustment will thus decrease the receivables account. When the inventory
is physically returned, the allowance for sales returns should be debited and the accounts
receivable balance credited.
The last significant aspect of the 2014 business operations accompanies the
inventory damage. GAC’s policy is to resell the returned inventory at half price to
discount stores. In the past, this was not a significant detail because the amount of returns
was immaterial, but this year the company will lose a lot of money in the unsold
merchandise. The cost is significant, and the company’s profit margin is low. I believe

Inventory and Revenue Recognition - 57
GAC needs to begin using an allowance to reduce inventory to the lower of cost or
market. This way, the difference between the cost and market can be estimated at the end
of the period. The journal entry to record this markdown would be a debit to impairment
loss and a credit to inventory. The impairment loss balance would increase by $7,500 and
the inventory balance would likewise decrease by $7,500. This would bring the inventory
balance to a more accurate portrayal of its ending balance after reducing the selling price
to sell to the discount retailers.
All of these changes would improve GAC’s relationship with the bank in the long
run. Currently, the lender does not require an external audit of the financial statements,
but it is always important to abide by GAAP standards. Before this analysis, GAC was
not abiding by many of these standards, but after these adjustments are made, the
company will be back in alignment with regulations. All of these adjustments
significantly decrease the current ratio. The bank requires GAC to maintain a 1.0 current
ratio, which it does not hold once these changes are made. Therefore, the company needs
to obtain additional equity in order to have the required ratio of current assets over
current liabilities. In order for the company to obtain this equity, Nicki needs to
contribute $19,680 in capital. When the payment comes in for the shirts for which
payment has not yet been received, cash will increase by $2,500. In the future, she can
hope that sales go significantly up and that there are fewer returns of the merchandise to
ensure future profitability. To initiate this increase in profitability, she should reconsider
her designs and ensure that she can sell a greater percentage of her merchandise. In an
attempt to decrease the number of uncollectible accounts and also to decrease the bad
debts expense, she should also strive to find more reliable retailers who can abide by the

Inventory and Revenue Recognition - 58
payment terms. GAC is a successful business, but Nicki does not yet know about
efficient and effective operations. If she can keep increasing the company’s revenue and
cash balances while also decreasing the expense and loss balances, she can make the
company more profitable and increase its current ratio.

Inventory and Revenue Recognition - 59
Appendix
1. Several changes were made upon Nicki’s takeover of the company. Nicki created edgier t-shirt designs, which resulted in different customers. Some of the conservative retailers no longer desired to sell GAC t-shirts, and Nicki sought out many new retailers who sold to different customers. In addition, Nicki made an exception to GAC’s policy of requiring payment in advance and instead recorded them as accounts receivable. Finally, after Nicki took over, the company shifted from equity financing to debt financing. This switch brought with it a covenant that required a minimum current ratio of 1.0 and a requirement to submit annual financial statements to the lender.
a. Nicki currently owns GAC.b. In prior years, the only external financial statement user was the IRS, but
upon the switch to debt financing, the bank will now view the financial statements, as well.
c. Because the bank is loaning funds to GAC, it requires stricter standards to be met. For example, the bank requires GAC to have a minimum current ratio of 1.0. In addition, the bank requires GAC to submit its annual financial statements, prepared under GAAP, to the bank within 60 days of its year-end. If these conditions are not met, the bank will create stricter stipulations, and later may not lend to GAC at all if it violates the covenant.
2. GAC has gotten many new customers and has lost several, as well. The custom shirts business has improved tremendously, bringing in a lot of revenue. Some shirts are already at the retailers, but they do not seem to be selling very successfully. Finally, the water-damaged shirts are not selling well. These four problems contribute greatly to the revenues of the country, as well as to the risk of the company.
a. The custom shirt business is working out significantly better than it did in the past. Nicki is being very active in finding new customers, and the business has increased over the past year.
b. GAC’s customer base has changed in the past year. This is partially a result of the new designs that do not appeal as much to the conservative retailers. These conservative retailers had been reliable, longstanding customers, and new start-up clothing stores replaced them. Nicki is concerned that the new retailers do not seem to be as well managed as the customers they replaced.
c. Bloggers and fashion critics spotlighted GAC’s new designs, and called them “bold” and “inspiring.” However, the conservative retailers did not appreciate the new designs, afraid that their customers would not buy them.
d. In May of 2014, GAC’s warehouse roof was leaking. The roof was repaired at little cost, but some of the inventory was stained. Instead of disposing of these shirts, Nicki decided to sell them to retailers. She noticed they were being sold on the clearance rack, and perhaps ultimately did not sell at all at the end of the season.

Inventory and Revenue Recognition - 60
3. The revenue principle is a pivotal assumption under accrual accounting. It states that revenue should not be recognized until it has been earned. For GAC, this means that the company should not recognize sales revenue until the shirts have been delivered to the customers.
4. Before Nicki took over, GAC’s policy was to require payment in advance. Nicki decided to make an exception to this policy and instead record sales orders as accounts receivable. GAC reports its revenue from the sale of shirts when a signed order and payment is received from a customer. This would never be acceptable. In order for revenue to be recognized, the sales must be delivered. Instead of recording this transaction as a debit to accounts receivable and a credit to unearned revenue, she credits the sales revenue balance.
5. The alternative method of recognizing revenue would be to record it when the performance obligation has been satisfied, and the t-shirts have been delivered to the customer.
6. I undeniably think it is better to recognize revenue upon delivery of the shirts. Under the current recognition method, sales revenue is being reported even though the shirts have not yet been delivered to the customer. According to GAAP, this recommended method that abides by the revenue recognition principle is correct, and the method that GAC is currently using is not allowed.
7. Changing to the alternative method would decrease revenue by $10,000, because GAC would no longer be reporting sales that have not yet been delivered as revenue, but instead as unearned revenue. It would also increase liabilities by $7,500, because unearned revenues would increase. In addition, accounts receivable would decrease, because the $2500 already debited to accounts receivable would be subtracted. When the payment was received, GAC would debit cash and credit unearned revenue. This adjustment would also affect GAC’s current ratio, because liabilities would increase by $7,500. This would decrease the current ratio for the company.
8. GAAP requires accounts receivable to be reported at net realizable value.9. GAC accounts for bad debts using the direct write-off method, which means that
the company accounts for the bad debts when uncollectible accounts are written off. Under this method, the bad debt expense account will show only actual losses from uncollectibles. This method is typically used for tax purposes, and not for sales, because it records facts, not estimates. This method does not record expenses in the same period as associated revenues, nor does it result in receivables being stated at net realizable value.
10. In the past, the company typically had very few uncollectible accounts. Therefore, the amount uncollectible was immaterial, and the direct method was appropriate. Now, however, Nicki has estimated that $3,000 will be uncollectible. In addition, the number of days to collect receivables significantly increased from 2013 to 2014, showing that it took GAC many more days to collect revenue after a sale in 2014 than it did in 2013.
2013: ଵହ,ଵ, ݔ 365 = 32.2059 days
2014: ଷଶ,ହଵ଼, ݔ 365 = 65.9028 days

Inventory and Revenue Recognition - 61
11. The alternative method for reporting bad debts expense is the allowance method. This method involves estimating uncollectible amounts at the end of each period. The allowance method would ensure that GAC would state receivables on the balance sheet at net realizable value. Because it is probable that GAC will not collect all of its receivables, and because this uncollectible amount can be reasonably estimated, GAC should use this method instead.
12. GAC should instead use the allowance method to account for bad debts. The company should do so because a significant amount of its receivables will be uncollectible, and because using this method allows the company to estimate the accounts receivable balance at the end of the period.
13. Changing to this method would decrease the receivables listed on GAC’s balance sheet by an estimated $3,000. Because the allowance method uses an estimate of bad debt expense, rather than reporting only actual losses from uncollectibles, the net realizable value would be much more accurate. When GAC used the direct write-off method, it reported accounts receivable at the gross amount, and later wrote off the amount proved to be uncollectible. Therefore, making the adjustment to the allowance method would mean reporting the estimated amount of uncollectibles as the allowance for doubtful accounts. At the beginning of each period, the company would estimate the value of the uncollectible accounts, debit this amount to bad debts expense, and credit it to the allowance for doubtful accounts. This balance of $3,000 in the allowance for doubtful accounts would be subtracted from the gross accounts receivable, leaving GAC with the accounts receivable at the net realizable value of $29,500. In addition, operating expenses would increase by the same amount, decreasing net income by $3,000. This adjustment would also affect GAC’s current ratio, because the balance in the net accounts receivable would decrease by $3,000. This change would decrease the current ratio.
14. GAC reports sales returns in the month in which retail customers return goods. This method is acceptable when the amount of sales returns is immaterial.
15. In the past, retailers sold the vast majority of their inventory from GAC, but this year, the new designs are not selling as well. GAC policy allows a full refund to the retailer for any unsold merchandise. Nicki estimates that $15,000 of merchandise remains unsold at the end of August, and this amount needs to be recorded.
16. GAAP recommends that a company report an estimated value of returns. Therefore, an allowance for sales returns account, a contra receivable account, should be created and utilized. This account should be subtracted from the accounts receivable amount, resulting in a much more accurate amount in the accounts receivable balance.
17. Yes, GAC should consider this alternative. The company is expecting a substantial amount of sales returns, and therefore, these estimated returns need to be reported. The returns are definitely material, and the value of the returns is important to both the internal user and to the external user. Nicki needs to be aware that many of the receivables will be uncollectible as a result of returns, and this cash cannot be presumed to be collected. In addition, external users of the financial statements need to be aware of the significant uncollectibles.

Inventory and Revenue Recognition - 62
18. I believe that it is best to account for sales returns by creating an allowance for sales returns, because it shows both internal and external users the net realizable value of the accounts receivable. This portrays a more accurate balance in the accounts receivable.
19. Changing to this alternative method would decrease the balance of the accounts receivable listed on GAC’s balance sheet by $15,000. Reporting the estimated value of returns would allow the balance to be a more accurate representation of the sales, as it would account for the likely sales returns. When GAC does not have this account, returns are subtracted from the accounts receivable only when they are physically returned. This adjustment would also affect GAC’s current ratio, because the balance in the net accounts receivable would decrease. This change would decrease the current ratio.
20. GAAP requires companies to measure inventory at the lower of cost or market. Market could be net realizable value, replacement cost, or net realizable value minus a normal profit margin.
21. The company reports its inventories at the lower of cost and market. Cost is determined using the weighted average cost method. GAC reduces inventory for the cost of goods sold on delivery of the shirts. Market value is determined as net realizable value for finished goods and replacement cost for raw materials and shirts in production. The company is using the direct method to record markdowns. This method is acceptable when write-downs are not anticipated to be of material value, as when the majority of the shirts are expected to sell at the initial retail price.
22. Yes, over the year it has become evident that GAC should most likely change the way it records inventory. Because of the water damage to the shirts, a lot of the inventory is not selling. GAC’s policy states that it will sell these unsold shirts at half price to discount stores. Since a significant portion of the shirts will be sold at a discounted price, the direct method is no longer appropriate. In addition, the number of days that GAC took to sell inventory greatly increased from 2013 to 2014. This is most likely a result of the damaged inventory.
a. 2013: ଽ,଼ଵ, ݔ 365 = 40.5556 days
b. 2014: ଶସ,ହଽଷ, ݔ 365 = 96.1559 days
23. Because of the significant number of shirts not selling, GAC will have to resell a lot of the shirts at reduced prices to discount stores. This is an effect of the company policy, and it will result in a lot of markdowns to half price. By analyzing the gross profit percentage, we see that the gross profit accounts for less than half of the sales revenue. This shows that more than half of the revenue is going towards the cost of goods sold. The margin of difference between selling price and cost is fairly low, and cost is greater than market value.
a.଼,ଽହଵଽ,ଽହ = 48.32%
24. I think GAC should use an allowance to reduce inventory to the lower of cost or market account when reporting its inventory. It is currently using the direct method and subtracting the markdowns from inventory at the end of the period, but these amounts can be estimated by using the allowance method. The journal entry to record this markdown would be a debit to impairment loss and a credit to

Inventory and Revenue Recognition - 63
inventory. The impairment loss balance would increase by $7,500 and the inventory balance would likewise decrease by $7,500. Because cost is greater than the market value, this method will allow the inventory at the end of the period to reflect a more accurate value.
25. Changing to this alternative method would decrease the amount of inventory on the balance sheet, because the allowance to reduce inventory to lower of cost or market account would be subtracted from the inventory account. There is also a loss from reducing the inventory to the lower of cost or market, and this loss would go on the income statement as an unusual loss. This would decrease net income. In addition, because inventory decreased, the current ratio would also decrease.
26. GAC’s current ratio would definitely decrease. Accounts receivable would decrease by $2,500 as a result of the change in revenue recognition, by $3,000 as a result of the change in accounting for bad debts, and by $15,000 by changing the policy regarding sales returns. In addition, inventory would decrease by $7,500, because of the adjustment to using an allowance to reduce inventory to lower of cost or market account. However, unearned revenue, a liability, would increase by $7,500, since GAC would be reporting revenue when shirts were delivered rather than when the order was placed. All of these adjustments would cause the current ratio to decrease.
a. Adjusted accounts receivable balance: 32,5000-3,000-2,500-15,000 = 12,000
b. Adjusted inventory balance: 24,500-7,500 = 17,000c. Adjusted unearned revenue balance: 7500d. Net income: 1,650-7,500 (impairment loss) -10,000 (revenue) = -15,850
e. Unadjusted current ratio: ସ,ାଷଶ,ହାଶସ,ହ
ସହ,ଵ଼ = ଵ,ସହ,ଵ଼ = 1.3502
f. Adjusted current ratio: ସ,ାଵଶ,ାଵ,ସହ,ଵ଼ାହ = ଷଷ,
ହଶ,଼ = .626427. In order to increase the current ratio to 1.0, Nicki would need to contribute
$19,680 of additional equity.28. Once Nicki obtains this additional equity to stay in business, she needs to focus
on getting more consistent retailers who are able to abide by the payment terms. She also needs to reconsider her new designs and ensure that she can sell a much greater percentage of the merchandise in retailers in the future.

Case 6: Manipulation of Financial Statements
Executive Summary
The name Arthur Andersen, previously known as a Big Five firm, is now
associated with fraud and scandal. In 2001, the company was charged with neglecting to
disclose numerous material misstatements in the financial statements of Waste
Management, Inc. These financial statements falsely inflated earnings by $1.7 billion,
and Arthur Andersen was at fault, as the auditor of the company, for not reporting these
fraudulent statements. Waste Management, Inc. reported lower expenses than it actually
incurred in order to increase its pretax income. In addition, to cover up this omission or
reduction of expenses, the company resorted to netting, the illegal act of utilizing one-
time gains to eliminate other expenses. Although Arthur Andersen did disclose some of
these misstatements, it did not require the company to correct them immediately. Upon
the settlement’s finalization, Arthur Andersen agreed to the largest-ever civil penalty and
promised to abide by the SEC’s rules of practice.
Waste Management, Inc. used the manipulation of depreciation expense to a large
degree to increase its pretax income. By periodically increasing the length of a truck’s
useful life and by simultaneously increasing the truck’s salvage value, it avoided great
depreciation expenses. Therefore, as a truck was used for additional years, it was reported
as having a longer useful life and a greater salvage value. Because Arthur Andersen did

Manipulation of Financial Statements - 65
not stop this practice or the other acts being committed to manipulate pretax income,
investors in Waste Management, Inc. lost over $6 billion upon the release of the fraud.
Although Arthur Andersen was under strict stipulations, just a year later it was
associated with the Enron scandal. Accused of shredding documents related to its audit of
Enron and of extensive communications during the time of the criminal acts, Arthur
Andersen was once again charged with the obstruction of justice. The indictment proved
that the company had not abided by the terms of the 2001 settlement following the Waste
Management, Inc. case, and Arthur Andersen fell completely out of favor in the public
eye. Unable to recover from the charges, the company is nearly fifteen years later still
associated with fraud and with the Enron scandal.

Manipulation of Financial Statements - 66
Appendix
Part I: Planes
1.
2. These three companies use the same method of depreciation, but each company assigns to the equipment a different estimated useful life. This may represent each company’s attempt at manipulating net income. A shorter useful life of the equipment would result in a lower pretax income, thereby reducing tax expense. Another possible explanation for the difference in estimated useful lives is each company’s past experience with the planes. United may estimate a longer useful life, because it owned planes in the past that lasted for an average of 27.5 years, whereas Northwest’s previously owned planes may have only lasted an average of 14.5 years.
3. Sale price I is more realistic, because it should not be assumed that all three of the companies would be able to sell their planes for the same price. In addition, sale price I seems to be related to the book value at the time of the sale, which would affect the sale price.
Part II: Garbage Trucks
1. Waste Management allegedly overstated profits by $1.7 billion by illegally deferring or eliminating expenses to inflate earnings. To conceal the understatement of expenses, the company also recorded one-time gains on the sale or exchange of assets. This act eliminated unrelated current period operating expenses and accounting misstatements that had accumulated from prior periods. In addition, the company sold treasury stock while the price was inflated as a
($ in millions) Northwest Delta United
Book Value January 1, 2005 $75.00 $75.00 $75.00Residual $3.75 $3.75 $3.75Depreciable amount $71.25 $71.25 $71.25Useful life 14.5 years 20 years 27.5 yearsAnnual Depreciation $4.91 $3.56 $2.59Accumulated Depreciation at 12/31/08
$19.66 $14.25 $10.36
Book Value at 12/31/08 $55.34 $60.75 $64.64Sale Price I $55.00 $60.00 $65.00Gain (Loss) on Sale I ($0.34) ($0.75) $0.36Sale Price II $60.00 $60.00 $60.00Gain (Loss) on Sale II $5.00 $0.00 ($5.00)
Figure 6-1: Comparison of Depreciation Calculations
Comparison of Depreciation Calculations

Manipulation of Financial Statements - 67
result of the high net income. These sales raised millions of dollars, which was used to offset the millions in losses.
2. Management avoided depreciation expenses by extending the estimated useful lives of the garbage trucks while also making unsupported increases to the trucks’ salvage values. These actions manipulated income, and made earnings seem greater than the true value. Because the depreciation expense for each year was recorded as a lower amount than the actual amount, pretax income for the period was inflated. This gave investors and market analysts a falserepresentation of the success and profitability of the waste management company.
3. The managers may have wanted to increase earnings for two possible reasons. First, their compensation may have been directly linked to the financial performance of the company. They, therefore, may have acted in accordance with the promise that better earnings would result in a higher reward. They may have also desired more outside investment in the firm. Obviously, if the company looks like a more profitable company, investors will assume it would likewise be an advantageous investment. Therefore, managers assumed that the greater recorded earnings would bring in more investments, and increase the equity of the firm.
4. Arthur Andersen, the auditor for the waste management company, issued fraudulent opinions of the waste management company’s financial statements. It did quantify some of the misstatements, but others were left unidentified in the financial statements with no disclosure. In addition, Arthur Andersen did not require the company to immediately correct the identified misstatements, instead allotting a five to seven year period during which it needed to write off the improper expenses. Rather than pointing out the illegal manipulation of income, the auditors allowed the company to overstate its pretax income by over $1 billion. The audits declared that the financial statements were presented in accordance with GAAP. As a consequence of its negligence, Arthur Anderson agreed to a settlement charge of $7 million, and also agreed to be censured under the SEC’s rules of practice. Ultimately, Arthur Andersen did not abide by the terms of the settlement. In fact, not long after, the company was indicted for communications with Enron following the news of Enron’s fraudulent financial statements. The company was essentially on probation following the fraud associated with Waste Management, Inc., and, as shown through the Enron scandal, Arthur Andersen did not abide by the SEC rules of practice.

Case 7: Differences between IFRS and GAAP Regulation
Executive Summary:
When Construct purchased a tract of property from BigMix, Inc., the companies
developed a purchase and sale contract that officially transferred the ownership of the
land to Construct. Over the course of several years, different circumstances arose that
raised a question of whether or not Construct needed to record a liability for the loss or
gain. The key to determining whether or not it is necessary to record a liability is to look
to the Codification, which lists all the standards and requirements of financial reporting.
In addition, there is some discrepancy between IFRS and the FASB GAAP, as IFRS is
primarily more principles based and FASB more rules based. Ultimately, it depends on
which set of standards Construct is following in preparation of its financial statements, so
in the analysis, both alternatives are listed.

Differences between IFRS and GAAP Regulation - 69
Figure 7-1: Comparison of GAAP Reporting and IFRS Reporting
Number Subject GAAP IFRS
1 Recognition of liability
Record if:1. It is probable that
a liability has been incurred at the date of the financial statements
2. The amount of the loss can be reasonably estimated
Verdict: do not record
Record if:1. A present obligation
has arisen as a result of a past event (the obligating event)
2. Payment is probable 3. The amount can be
estimated reliably
Verdict: do not record
2 Recognition of remote likelihood of loss
The indemnity would not affect the lessee’s classification of the lease
Verdict: do not record
A possible oblig ation (a contingent liability ) is di sclo sed but not accrued. However, disclo sure is not requir ed if payment i s remot e
A possible oblig ation (a contingent liability ) is di sclo sed but not accrued. However, disclo sure is not requir ed if payment i s remot e
A contingent liability is disclosed but not accrued. However, disclosure is not required if payment is remote
Verdict: do not record
3 Measure of “probable”
Probable is defined as likely, and a customary estimate of over 70% is typically implemented
Verdict: do not record
Probable is defined as more likely than not, therefore, over 50%
Verdict: record
Comparison of GAAP Reporting and IFRS Reporting

Differences between IFRS and GAAP Regulation - 70
Figure 7-1: Comparison of GAAP Reporting and IFRS Reporting (continued)
Number Subject GAAP IFRS
4 Recognition of legal action and RI/FS
Record liability if:1. Litigation has
commenced or a claim or an assessment has been asserted, or commencement of litigation or assertion of a claim or assessment is probable
2. The reporting entity is associated with the site—that is, it in fact arranged for the disposal of hazardous substances found at a site or transported hazardous substances to the site or is the current or previous owner or operator of the site
Record the best estimate of the cost
Verdict: record
Record liability if a past event is deemed to give rise to a present obligation if, taking account of all available evidence, it is more likely than not that a present obligation exists at the balance sheet date
Verdict: record
5 Recognition of remedial action
Record a liability for the performance of remedial actions under Superfund, corrective actions under the Resource Conservation and Recovery Act of 1976, and analogous actions under state and non-U.S. laws
Verdict: record
A provision is recognized as contamination occurs forany legal obligations of clean up, or for constructive obligations if the company’s published policy is to clean up even if there is no legal requirement to do so (past event is the contamination and public expectation created by the company’s policy)
Verdict: record
Comparison of GAAP Reporting and IFRS Reporting (continued)

Differences between IFRS and GAAP Regulation - 71
Number Subject GAAP IFRS
6 Recognition of a gain contingency
A gain contingency usually should not be reflected in the financial statements because to do so might be to recognize revenue before its realization
Verdict: do not record
When the realization of income is virtually certain, then the related asset is not a contingent asset and its recognition is appropriate
Verdict: record
Figure 7-1: Comparison of GAAP Reporting and IFRS Reporting (continued)
Comparison of GAAP Reporting and IFRS Reporting (continued)

Differences between IFRS and GAAP Regulation - 72
Appendix
1. In regards to indemnification provisions, the Codification states in 805-20-25-27 that “the acquirer shall recognize an indemnification asset at the same time that it recognizes the indemnified item, measured on the same basis as the indemnified item, subject to the need for a valuation allowance for uncollectible amounts.” Likewise, the indemnification liability should not be recognized until an environmental cost has been incurred. In addition, in paragraph 450-20-25-2, the Codification requires the accrual of a liability if both of the following conditions are met: “it is probable that an asset has been impaired or a liability has been incurred at the date of the financial statements, and the amount of the loss can be reasonably estimated.” Therefore, in 2007, Construct should not record a liability for environmental liabilities, and there would be no difference under IFRS.
2. The Codification defines Chapter 11 bankruptcy in 852-10-5-3 as “a reorganization action, either voluntarily or involuntarily initiated under the provisions of the Bankruptcy Code, that provides for a reorganization of the debt and equity structure of the business and allows the business to continue operations.” BigMix is not going out of business, but rather it is restructuring in an attempt to continue operations. Filing under Chapter 11 focuses on preserving going concern value. In 840-10-25-13, the Codification states, “if the likelihood of loss is remote, then the indemnity would not affect the lessee’s classification of the lease.” Therefore, because Construct had no inclination that BigMix would file for bankruptcy, the indemnification clause does not cover the bankruptcy filing. Construct should not record any liability due to BigMix’s filing for Chapter 11, and there would be no difference under IFRS.
3. According to IAS 37-14, a liability may be recorded when it is probable that the costs will be incurred, and when the costs are estimable. IFRS defines “probable” payment as more likely than not. Therefore, because there is a 60 percentprobability that the penalties will be assessed, Construct should record a liability for the potential environmental liability of $250,000 on the 2009 financial statements.However, it is customary in the US that a liability should not be recognized if the probability is less than 70 percent. Therefore, because the likelihood of the EPA assessing penalties is less than “probable,” Construct should not record a liability for the potential environmental liability.
4. As paragraph 410-30-25-6 of the FASB Codification explains, there is a presumption of an unfavorable outcome for litigation if both of the following conditions exist: “litigation has commenced or a claim or an assessment has been asserted, or commencement of litigation or assertion of a claim or assessment is probable, and the reporting entity is associated with the site—that is, it in fact arranged for the disposal of hazardous substances found at a site or transported hazardous substances to the site or is the current or previous owner or operator of the site.” Therefore, in this circumstance, the liability should be recorded because litigation claims have been made against the environmental waste, and Construct

Differences between IFRS and GAAP Regulation - 73
is associated with the site of the environmental waste. Furthermore, addressing reporting costs of remedial investigation and feasibility study, the Codification in 410-30-25-11 asserts that “a liability for the best estimate (or, if no best estimate is available, the minimum amount in the range) of the cost of the remedial investigation and feasibility study and for any other component remediation costs that can be reasonably estimated shall be recognized in the entity’s financial statements.” Therefore, based on both of these paragraphs in the Codification, Construct should record a liability of $400,000 for the potential environmental remediation. Likewise, IFRS states a similar standard, and Construct should record a liability of $400,000.
5. In 410-30-30-11, the Codification states that the remediation effort includes “precleanup activities, such as the performance of a remedial investigation, risk assessment, or feasibility study and the preparation of a remedial action plan and remedial designs for a Superfund site, or the performance of a Resource Conservation and Recovery Act of 1976 facility assessment, facility investigation, or corrective measures studies.” In addition, it includes the “performance of remedial actions under Superfund, corrective actions under the Resource Conservation and Recovery Act of 1976, and analogous actions under state and non-U.S. laws.” Therefore, under both GAAP and IFRS, 1.5 million should be recorded as a liability because it represents a plan of remedial action to reduce the environmental contamination.
6. In 450-30-25-1, the Codification states that “a contingency that might result in a gain usually should not be reflected in the financial statements because to do so might be to recognize revenue before its realization.” Because of the principle of conservatism and so that revenue is not recognized prematurely, this $1 million should not be recorded as a liability. Instead, it should be recorded in the notes. On the other hand, in IAS 37.31, it states that “when the realization of income is virtually certain, then the related asset is not a contingent asset and its recognition is appropriate.” Therefore, in this case the $1 million liability should be recorded under IFRS.

Case 8: Long Term Debt
Executive Summary
The third largest retail pharmacy in the United States, Rite Aid is a well-known
company in households across America. Founded in the 1960’s, the company has
operated for several decades, but its profitability has recently been in a decline. In 2009,
Rite Aid’s financial statements reported a net loss, significant amounts of long-term debt,
and a net stockholder’s deficit. Nothing in the statements really presented a positive for
the company in terms of financial standing, and its credit rating slipped as a result. Based
upon its finances at the end of fiscal year 2009, the company does not have the resources
necessary to meet its current financial obligations. In addition, because the company is
continuing to acquire more debt in an attempt to pay off its currently maturing notes, its
long-term debt balance is immense. Rite Aid’s financial statements portray that unless its
profitability begins to steadily increase significantly, allowing it to pay off its deficit, the
company is a risky investment both now and in the near future.
Companies borrow from lenders because it is a relatively easy way to raise
significant amounts of capital in a short amount of time. Investors are sometimes more
likely to loan money when they are earning a fixed amount of interest on the loan, rather
than counting on the profitability of the company, as investors in the stock market must
do. However, unlike money raised through the sale of common stock, a company must

Long Term Debt - 75
both pay a periodic coupon rate on the loan and have the resources available to pay back
the loan at its maturity date. Some companies may have great amounts of debt if they are
expanding, but a massive debt balance is typically a bad signal of the financial standing
of a company.
All numbers in this report are given in thousands. Rite Aid is borrowing great
amounts of money, and the interest rates of the notes, as well as the number of years until
maturity, vary among the notes. Much of the debt is in the form of secured debt, which is
advantageous for the company, because it is more likely that the company will receive its
loan balance even if the lender must default on the loan. However, because Rite Aid is
borrowing so much money, its interest expense is incredibly high, and likewise
significantly higher than the industry average. In addition, Rite Aid’s revenues are low,
and its cost of goods sold is very high. As a result of this and of other significant
expenses, the company has a net loss. The balance sheet also reports a large accumulated
deficit, signifying that the company has been acquiring a net loss over several periods.
Because of Rite Aid’s lack of profitability in recent years, its common stock balance can
also be expected to decrease, as investors lose faith in the future profitability of the
company. As a whole, Rite Aid’s financial statements represent bleak financial
circumstances for the company.

Long Term Debt - 76
Appendix
a.i. Secured debt is backed by some type of collateral; for example, backed by
real estate. Unsecured debt does not have specific property serving as collateral for payment of the debt; for example, junk bonds and debenture bonds. Rite Aid distinguishes between these two types because if it fails to make payment on an unsecured debt, the lender cannot take any of its property without first suing Rite Aid and getting a court judgment. Therefore if Rite Aid defaults on its secured debt, it has more to lose. Secured loans have a lower interest rate, though, and are therefore sometimes preferable to the company.
ii. A third party backs a guaranteed debt. If Rite Aid defaults on its payment, a third party promises to pay the lender the balance due. In this case, the guarantor is Rite Aid; and it is guaranteeing unsecured debt for some of its subsidiaries.
iii. Senior notes are those that have priority. These creditors will be paid first. This is particularly important should Rite Aid be unable to fulfill all of its obligations, because the senior loan balances must be paid off before those of any other loans. Fixed-rate notes are those for which a borrower pays the same rate of interest every period. Finally, convertible notes are those that can be transferred to another type of equity, for example from a bond to common stock.
iv. It is beneficial for a company to have different types of debt with a range of interest rates, because some lenders may not be willing to offer financing at a lower coupon rate. Therefore, raising the interest rate may be a way for Rite Aid to ensure that it is able to borrow as much money as it needs.
b. At February 27, 2010, Rite Aid has $6,370,899 of total debt. Only $51,502 of this debt is due within the coming fiscal year. Therefore, the amount of long-term debtand lease financing obligations, less current maturities, is $6,319,397. On Rite Aid’s balance sheet, the currently maturing portion of the long-term debt, $51,502, is listed under current liabilities. The remaining $6,370,899 of long-term debt is split into long-term debt and lease financing obligations, both less current maturities.
c.i. The face value of this note is $500,000. This amount does not change from
year to year, and the statements do not mention a discount or premium. ii.
iii.
Cash 500,000Notes Payable 500,000
Interest Expense 37,500Cash 37,500

Long Term Debt - 77
iv.
d.i. The face value of these notes is $410,000. The carrying book value at
February 27, 2010, is $405,951. Therefore, it is evident that there is a discount. The values differ, because the carrying value is the face value less the $5,951 unamortized premium.
ii. During fiscal year 2009, Rite Aid paid $38,438 in interest. This amount was determined by multiplying the $410,000 face value by 9.375 percent.
iii. During 2010, Rite Aid recorded $39,143 in interest expense. This amount was found by adding the amortized discount over the year to the $38,438 cash interest.
iv.
v. The total rate of interest recorded was 9.66 percent, computed by dividing the 2010 interest expense by the beginning of the period carrying value of $405,246.
e.i.
This cash amount was determined by multiplying the $410,000 face amount by 98.2 percent. The difference between the bonds payable and the cash amount is the amount of discount on the sale of the bonds.
ii. Using the rate formula in Excel, the effective annual rate of interest was calculated as 10.1212 percent. There are seven periods; the cash interest payment is $39,975; the present value is $402,620; and the future value is $410,000.
Notes Payable 500,000Cash 500,000
Interest expense 39,143Discount on N/P 705Cash 38,438
Cash 402,620Discount on N/P 7,380
Notes Payable 410,000

Long Term Debt - 78
iii.
iv.
These amounts were determined by taking 8/12 of each value in the table above.
v. The net book value at February 27, 2010, is $403,137, computed by taking the 2009 book value and adding the discount amortized from June 30, 2009 to February 27, 2010.
Date Interest Payment
Interest Expense
BondDiscount
Amortization
Net Book Value of
Debt
EffectiveInterest
Rate
June 30,, 2009 -- -- --
$402,620 10.12%
June 30,, 2010
$39,975 $40,750 $775 $403,395 10.12%
June 30,, 2011
$39,975 $40,828 $853 $404,248 10.12%
June 30,, 2012
$39,975 $40,915 $940 $405,188 10.12%
June 30,, 2013
$39,975 $41,010 $1,035 $406,223 10.12%
June 30,, 2014
$39,975 $41,115 $1,140 $407,363 10.12%
June 30,, 2015
$39,975 $41,230 $1,255 $408,618 10.12%
June 30,, 2016
$39,975 $41,357 $1,382 $410,000 10.12%
Interest Expense 27,167Discount on N/P 517Interest Payable 26,650
Figure 8-1: Bond Amortization Table Using Effective Interest
Bond Amortization Table Using Effective Interest

Long Term Debt - 79
vi.
Date Interest Payment
Interest Expense
BondDiscount
Amortization
Net Book Value of
Debt
Straight-Line
Interest Rate
June 30, 2009
-- -- -- $402,620 --
June 30, 2010
$39,975 $41,029 $1,054 $403,674 10.19%
June 30, 2011
$39,975 $41,029 $1,054 $404,728 10.16%
June 30, 2012
$39,975 $41,029 $1,054 $405,782 10.14%
June 30, 2013
$39,975 $41,029 $1,054 $406,836 10.11%
June 30, 2014
$39,975 $41,029 $1,054 $407,890 10.08%
June 30, 2015
$39,975 $41,029 $1,054 $408,944 10.06%
June 30, 2016
$39,975 $41,029 $1,054 $410,000 10.03%
Figure 8-2: Bond Amortization Table Using Straight-Line Interest
Bond Amortization Table Using Straight-Line Interest

Long Term Debt - 80
vii.
There is no real pattern. Until June 30, 2014, reporting under the straight-line method would mean reporting a greater amount of interest. From June 30, 2014, to June 30, 2016, reporting under the effective interest method yields a greater amount of interest. The difference in interest expense using each method, though, is immaterial, so Rite Aid maintained that it is a valid reporting method to utilize the straight-line interest rate.
f.i.
The notes payable amount is the future value of the notes. The gain and the cash amounts were given in the notes. Therefore, the discount on notes payable is the plug, found by calculating the value needed to have this journal entry balance.
ii. Rite Aid did not have to pay the face value to repurchase the notes, because these notes are worth less than the amount for which they were initially purchased. This is because either interest rates have risen, or because Rite Aid’s credit rating has deteriorated, making the company more risky.
Date Effective Interest
Straight-Line
Interest
Difference
June 30, 2009
-- -- --
June 30, 2010
$40,750 $41,029 $279
June 30, 2011
$40,828 $41,029 $201
June 30, 2012
$40,915 $41,029 $114
June 30, 2013
$41,010 $41,029 $19
June 30, 2014
$41,115 $41,029 ($86)
June 30, 2015
$41,230 $41,029 ($201)
June 30, 2016
$41,357 $41,029 ($328)
Notes Payable 810,000Gain 3,750Discount on N/P 8,481Cash 797,769
Figure 8-3: Comparison of Interest Methods
Comparison of Interest Methods

Long Term Debt - 81
iii. The market rate of interest when these notes are repurchased is higher than the coupon rate. It is also higher than the effective rate. Because the company had to repurchase its notes both at a premium and at a higher price than the price for which it originally bought them, it is evident that the current market rate exceeds both the coupon rate and the effective rate.
g.i. Firms issue convertible notes, because investors will typically accept a
lower coupon rate if the bond is convertible. Because an investor in a convertible bond may benefit from the profitability of the company, convertible bonds are more attractive to investors. Rite Aid’s balance sheet would show an increase in the balance for common stock and a decrease in the notes payable if the notes were converted.
h.i.
Ratio Definition IndustryAverage
Rite Aid FY2009
Rite Aid FY2008
Common-size debt
Total liabilities / Total assets
43.83% 120.79% 114.41%
Common-size interest expense
Interest expense / Net sales
0.35% 2.01% 1.82%
Debt to assets Total long-term debt / Total assets
14.41% 79.14% 72.20%
Long-term debt to equity
Total long-term debt / Total shareholders’equity
0.26 -3.81 -5.33
Proportion of long-term debt due in one year
Long-term debt due in one year / Total long-term debt
6.11% 0.81% 0.68%
Times-interest-earned(interest coverage)
(Pretax income + interest expense) / Interest expense
33.44x .07x -4.41x
Figure 8-4: Rite Aid Ratios Compared to Industry Average
Rite Aid Ratios Compared to Industry Average

Long Term Debt - 82
ii. Rite Aid has significantly more long-term debt than does the industry as a whole. Accordingly, Rite Aid’s interest expense as a percentage of net sales is greater than the industry average, since it is responsible for paying the interest on such lofty loan amounts. Long-term debt as a percentage of both equity and assets is monumentally larger than the industry average. However, because total stockholder’s equity is currently negative, the long-term debt to equity ratio is negative for Rite Aid. In addition, since in fiscal year 2008 there was a net loss, the times-interest-earned ratio is actually negative. None of these ratios seem to bode well for the company. Should something happen to Rite Aid, it would owe huge amounts of money to its lenders, and it does not have adequate assets or equity to support the vastness of its borrowings.
iii. I do not think that Rite Aid is very capable of meeting its long-term commitments. It seems to be borrowing lofty amounts, perhaps simply to pay off its maturing debts. In addition, the company has a net loss, and therefore will have to borrow more money come the new fiscal year to pay off its deficit from fiscal year 2009.
i. I believe that Rite Aid should most likely be given a credit rating of a CCC. Based on its financial statements, the company seems likely to default on its loans. In fiscal year 2009, it does not have the ability to meet financial commitments, and it is not probable that it will have this capability in the near future. It is not currently profitable and is already in a deficit. Therefore, it is very vulnerable, but its financial standing could perhaps get better as the economy expands, or if business improves.

Case 9: Stockholders’ Equity
Executive Summary
Merck & Co., Inc. and GlaxoSmithKline plc are two large companies primarily
engaged in the research and distribution of pharmaceutical products. Both in the
healthcare industry, the two companies have very similar stockholders’ equity sections of
their financial statements. However, because Merck & Co., Inc. is based out of the United
States and GlaxoSmithKline is headquartered in London, their statements are prepared in
a comparable way, but the presentation of the equity section is not identical. The
stockholders’ equity section represents the capital received from investors in exchange
for stock, donated capital, and retained earnings. Included in the stockholders’ equity are
the common and preferred stock accounts, containing paid-in capital, the retained
earnings derived predominantly from net income and dividends, and the reduction of
treasury stock. When analyzing a company’s equity, it is important to note several things
associated with capital stock: dividends paid; shares authorized, issued, and outstanding;
and the values associated with the capital stock sold and purchased.
A company is authorized to issue a set number of shares at the beginning of each
year, but it often will choose to issue fewer than that given number. There are a couple of
reasons a company may leave some shares unissued. The company may want to distribute
some as stock options to employees or to hold them to maintain a controlling interest in
the company. From the issued shares, a portion is outstanding. These outstanding shares
are those sold to the public as free issue shares. Not included as outstanding shares are

Stockholders’ Equity - 84
those that are held for a short period of time by the issuing company. The company often
repurchases shares of its own stock and holds it in the form of treasury stock. This
repurchase allows the company to hold its stock until the stock price has increased.
Holding treasury shares also allows the company to decrease its number of shares
available to the public, raising its earnings per share and making it appear more profitable
to investors. Companies also pay dividends in order to increase the appeal of the
company to investors. A dividend is a regularly paid sum of money to investors from the
retained earnings of the company.
Having considered the issued and outstanding common and preferred shares, it is
possible to create ratios to better understand the profitability of the company. The
dividends per share, dividend yield, dividend payout, dividends to total assets, and
dividends to operating cash flows ratios are important when analyzing the equity of a
company. The dividends per share ratio quantifies how much each share earns in
dividends every payment period. The dividend yield indicates in a percentage how much
a company pays out in dividends each period relative to the share price of its stock. The
dividend payout ratio reveals how much money a company is returning to shareholders,
as opposed to how much it is keeping on hand as retained earnings.
GlaxoSmithKline’s equity section reveals that it is more financially sound than
Merck. Its stock price is much higher than Merck’s is, and it pays out less money in
dividends. Particularly indicative of a potential problem, Merck’s payout ratio in 2007 is
over 100 percent. This indicates that the company is paying out more in dividends than it
makes in net income. This is not advantageous to the company, because such great
dividend payout is not sustainable. Merck’s investors are certainly happy to be receiving

Stockholders’ Equity - 85
such dividends, but Glaxo’s payout ratio is much more advantageous for the company as
a whole. Having analyzed the financial statements of these two companies, I would prefer
to invest in GlaxoSmithKline plc, rather than in Merck & Co., Inc.

Stockholders’ Equity - 86
AppendixNote: journal entries given in millions.
a.i. Merck is authorized to issue 5.4 billion shares of common stock.ii. Merck has actually issued 2,983,508,675 shares of common stock at
December 31, 2007.iii. The par value of common stock is one cent. Therefore, 2,983,508,675
shares of common stock sold at one-cent par value yields the $29.8 million balance for common stock on the 2007 balance sheet.
iv. 811,005,791 common shares were held in treasury at December 31, 2007.v. Outstanding shares are equal to the issued shares less treasury stock.
Merck has 2,983,508,675 issued shares less 811,005,791 shares of treasury stock. Therefore, Merck has 2,172,502,884 shares of outstanding shock at December 31, 2007.
vi. Market Capitalization for a given day equals shares outstanding multiplied by the closing price per share. 2,172,502,884 outstanding shares times $57.61 yields $125,157,891,147.24, the market capitalization on December 31, 2007.
b.i. GlaxoSmithKline is authorized to issue 10 billion shares of common stock
every year.ii. GlaxoSmithKline actually issued 6,012,587,026 shares of common stock
at December 31, 2007.iii. Free issue, or outstanding, shares are those that are available to be bought
by the public. Therefore, outstanding shares equal shares issued less shares held as treasury. GlaxoSmithKline has 6,012,587,026 issued shares less 269,000,000 treasury shares. There are 5,743,587,026 shares of free issue shares at December 31, 2007.
iv. 269 million shares are held as treasury stock at December 31, 2007.v. Share capital on the balance sheet is the number of issued shares
multiplied by the par value. On Merck’s balance sheet, this account is called capital stock. GlaxoSmithKline also includes an account listed as share premium. This account contains the difference between the selling price and the par value multiplied by the number of issued shares. Therefore, when the stock sells for a value of greater than par value, the premium amount is recorded in the share premium account. On Merck’s balance sheet, the value over the par amount is recorded in the other paid-in capital account.
c. Typically, companies must decide if they want to invest their money in future growth or if they prefer to pass on some of their earnings to shareholders. A mature or stable company will typically pay dividends to shareholders, because its executives hope that offering dividends will encourage more people to invest in the company. Investors appreciate the steady income associated with dividends, and they also see dividends as a sign that management is forecasting positive future earnings. When more investors purchase the stock, the stock price

Stockholders’ Equity - 87
increases, another sign of the company’s profitability. A company’s share price decreases when dividends are paid.
d. When a company’s stock is undervalued, management may choose to repurchase shares of its stock and hold it as treasury stock. The issuing company may buy back its stock at its reduced price, hold it until the market has corrected itself, and resell it at the greater price. Another possible explanation for buybacks is associated with the earnings per share ratio. By reducing the number of outstanding shares, the denominator of the equation, the earnings per share ratio increases. Therefore, investors may see the stock as more desirable, even though all that has changed is the number of outstanding shares.
e.
f.i.
ii. To determine total dividends for the 2007 fiscal year, one must add the total dividends the third and fourth interims of 2006 and the first and second interims of 2007. This summation yields £2,793 million. The statement of cash flows records £2,793 million in total dividends. IFRS requires interim dividends to be recognized in the financial statements only once the dividends are paid. Accordingly, £2,905 million of dividends were declared, but only £2,793 million were paid out in dividends. The remaining £112 million in dividends declared will be paid in the future, and they will be recorded on the statement of cash flows following the payment.
g.i. Merck uses the cost method of accounting. This is evident because
treasury stock is subtracted from the stockholders’ equity following all capital stock and retained earnings.
ii. Merck repurchased 26.5 million shares of treasury stock from the open market during 2007.
iii. Merck paid £1,429.7 million total to repurchase its treasury stock. On average, this is £53.95. These purchases are recorded in the cash flows from financing activities section of the statement of cash flows.
iv. Treasury stock is a contra-equity account. Therefore, when the balance in the treasury stock account increases, total stockholders’ equity decreases. Purchasing treasury stock reduces cash, and reselling treasury stock increases the cash balance. However, even though the shares may be sold at any time to generate cash, the treasury stock account is not listed as an asset. All unissued stock may also be sold for cash, so treasury stock should be treated in the same way.
Dividends Declared 3,310.70Dividends Payable 3.40Cash 3,307.30
Dividends Declared 2,793Cash 2,793

Stockholders’ Equity - 88
h.i. GlaxoSmithKline repurchased 285,034,000 shares in 2007. However, it
held only 269 million shares and cancelled 16 million. These cancelled shares were not held as treasury.
ii. GlaxoSmithKline paid, on average, £13.09 for each repurchased share in 2007.
iii. The equivalent of the movements in equity is the statement of retained earnings under GAAP. Under IFRS one is unable to discern if it is the cost method or the par value method, so the following entry is always recorded. On the other hand, under the U.S. GAAP treatment, one can determine which method is being used by analyzing the treasury stock placement on the balance sheet. If treasury stock is listed at the bottom following retained earnings, the cost method is being used. If treasury stock is listed within the capital stock section of the equity, the par method is being used. Each method requires a different journal entry under U.S. GAAP, but the methods are indistinguishable under IFRS.
i.
Retained Earnings 3,750Cash 3,750
Merck ($)2007
Merck ($)2006
Glaxo (£)2007
Dividends Paid $3,307,300,000 $3,322,600,000 $2,793,000,000Shares Outstanding 2,172,502,884 2,167,785,445 5,743,587,026Net Income $3,275,400,000 $4,433,800,000 $6,134,000,000Total Assets $48,350,700,000 $44,569,800,000 $31,003,000,00
0Operating Cash Flows
$6,999,200,000 $6,765,200,000 $6,161,000,000
Year-end Stock Price $57.61 $41.94 $97.39Dividends per Share $1.52 $1.53 $0.49Dividend Yield 2.64% 3.65% 0.50%Dividend Payout 100.97% 74.94% 45.53%Dividends to Total Assets
.07x .075x .09x
Dividends to Operating Cash Flows
.47x .49x .40x
Figure 9-1: Comparison of Equity Items
Comparison of Equity Items

Stockholders’ Equity - 89
Between 2006 and 2007, there is not a significant difference in Merck’s dividend ratios. In 2007, Merck paid $15 million more in dividends, and had about five million more shares than in 2006. However, in 2006, Merck’s net income was more than $1 billion greater than in 2007. In addition, the stock price significantly increased from 2006 to 2007, affecting the dividend yield. Therefore, the 2007 dividend yield was lower in 2007 than in 2006. Because of the great decrease in net income between 2006 and 2007, there is a large difference in the dividend payout from 2006 to 2007. The 2007 payout is 25 percent greater than in 2006.
Glaxo’s year-end stock price is significantly greater than of Merck, and Glaxo has many more shares outstanding than Merck does. As a result, the dividends per share ratio is significantly greater for Merck than for Glaxo. In addition, Glaxo’s dividend yield is much lower than Merck’s dividend yield. Glaxo’s dividend payout is also considerably lower than that of Merck, because Glaxo’s net income is much greater than Merck’s net income. All in all, the companies do not differ significantly, but the distinctions are enough to cause an analyst to favor GlaxoSmithKline plc.

Case 10: Marketable Securities
Executive Summary:
State Street Corporation is a major financial holding company headquartered in
Boston. It focuses on serving institutional investors, and as such has significant holdings
in investment securities. There are three types of securities: trading securities, available-
for-sale securities, and held-to-maturity securities. State Street has holdings in all three
classifications as of its balance sheets in 2012 and 2013. The major differences in these
securities are the purposes of the purchase and the values at which the securities are
recorded on the balance sheet. Trading securities are purchased with the intent of holding
them for less than a year. Management purchases these securities to take advantage of
market fluctuations. They can resell the securities a few months from the purchase date
and make a profit. Therefore, the securities are recorded at fair market value. Also
recorded at fair market value are available-for-sale securities. These securities are
intended to be held for at least one year, and they are purchased in an effort to manage
interest rate, prepayment risk, and liquidation needs. The purpose of these securities is to
make investments more favorable for investors. The final classification is held-to-
maturity securities. These securities are those that the company has the positive intent and
ability to hold for several years. At maturity, the debtor will completely pay back the face
value of the security.

Marketable Securities - 91
State Street’s balance sheet, the consolidated statement of condition, was
interesting because it is not classified. The assets section was not separated into current
and noncurrent assets. There does seem to be a sequence of liquidation, but there is no
separation between current assets, investments, or property, plant, and equipment that is
normally found on a balance sheet. As a result, one must look to the descriptions of the
securities to determine whether or not they are current or noncurrent. Trading securities
are expected to be resold within a year, so these are current. Furthermore, available-for-
sale securities and held-to-maturity securities are intended to be held past one year, so it
can be gathered that they are noncurrent. These securities differ in the way in which they
are recorded on the balance sheet. As previously stated, trading securities and available-
for-sale securities are listed at fair market value. Therefore, when the market price of the
securities fluctuates, the securities must be restated to the current market value. A gain or
loss on the price of trading securities goes on the income statement, whereas a gain or
loss on available-for-sale securities goes on the statement of other comprehensive
income. The change in the price of available-for-sale securities is a separate component
of stockholders’ equity. On the other hand, because held-to-maturity securities are being
held for a definite period of time, they are recorded at their amortized cost. Held-to-
maturity securities are not subject to market fluctuations.
State Street holds securities of all three types, and it must account for each of
them in a different way. All of the journal entries found in the appendix are recorded in
millions. In g. ii, State Street sold some of its available-for-sale securities. To record this
sale, the company must first debit the remaining net unrealized gains. Next, one would
debit the cash proceeds from the sale and credit the net realized gains. Finally, the plug

Marketable Securities - 92
for the entry would be the original cost of the debt investments. After this entry, only the
securities on hand remain in the balance of both available for sale securities, and only the
gains and losses associated with these on hand securities remain in the unrealized holding
gain or loss account.

Marketable Securities - 93
Appendix:
a.i. Trading securities are those that are purchased with the intent of reselling
them in a short period of time, a year or less. By doing so, a company is able to profit from short-term price fluctuations.
ii. A company would record $1 of dividends or interest received from trading securities by debiting dividend receivable and crediting dividend income. Upon the date of the cash receipt, the company would debit cash and credit the dividend receivable.
iii.
b.i. Available-for-sale securities are similar to trading securities in that they
are both sold at fair market value. However, they differ in the purpose of the purchase. While trading securities are purchased with the intent of profit maximization, available-for-sale securities are held to manage the interest rate, prepayment risk, and liquidation needs. In addition, available-for-sale securities are held for longer than a year.
ii. A company would record $1 of dividends or interest received from trading securities by debiting cash and crediting debt investments and interest revenue. If cash was not received initially, interest receivable would be debited. At the receipt of cash, cash would be debited and interest receivable would be credited
iii.
c.i. A held-to-maturity security is one that is purchased and intended to be
held until its maturity date. It is recorded at amortized cost. Equity securities are never classified as held-to-maturity, because they do not have a definite maturity. Because held-to-maturity securities have a definite maturity, they may only be used to classify debt securities.
ii. The company would not record a journal entry if the fair value of the held-to-maturity security increased, because these securities are held at their amortized cost.
d.i. On December 31, 2012, the balance of the trading account assets is $637
million. The market value of the securities on this date is $637 million, since the securities are recorded at fair market value.
ii.
Fair value adjustment (trading) 1.00Unrealized holding gain 1.00
Fair value adjustment (AFS) 1.00Unrealized holding gain (equity) 1.00
Fair value adjustment (trading securities) 85.00Unrealized holding gain 85.00

Marketable Securities - 94
e.i. The 2012 year-end balance in the investment securities held to maturity
account is $11,379 million.ii. The market value of the company’s investment securities held to maturity
is $11,661 million.iii. The amortized cost of these securities is $11,379 million. The amortized
cost is the amount recorded on the balance sheet, and represents the purchase cost of the securities, less the unamortized discount. If these securities were held to security, the original cost would be amortized to maturity amount.
iv. The difference between market value and amortized cost represents the unamortized discount. However, the difference in the 2011 and 2012 balances recorded at fair value is not the same as the difference in the balances recorded at amortized cost. This shows that the average market rate decreased over the two years.
f.i. The 2012 year-end balance in the investment securities available for sale
is $109,682 million. This balance represents the fair market value of the investment securities at the end of 2012.
ii. The net unrealized gain on AFS securities is $2001 million less the $882 million loss. Therefore, there is a net unrealized gain of $1119 million.
iii. The amount of net realized gain from sales of AFS securities is a $101 million gain less the $46 million loss. There is a net realized gain of $55 million. This would be a gain on the statement of accumulated other comprehensive income, and it ultimately would increase comprehensive income and total stockholders’ equity. It would also generate positive cash flows.
g.i.
ii.
iii. The original cost of the available-for-sale securities sold during 2012 is $5411. This amount was found by adding cash proceeds and net unrealized gains and subtracting net realized gains. The original cost is the plug in the journal entry from part g. ii, since the amount of cash and the net unrealized and realized gains are determinable from the problem.
Debt investment 60,812Cash 60,812
Cash 5,399Net unrealized gains 67
Net realized gains 55Debt investments 5,411

Marketable Securities - 95
iv. The amount of net unrealized gains for AFS securities on hand is equal to the total unrealized gains of $1119 million less the $67 million gains associated with the sale of the AFS securities less the beginning balance of the net unrealized gain or loss account. Therefore, the unrealized gain for the AFS securities on hand is $1367 million.
This entry would have no effect on cash flows. It will increase State Street’s future cash flows when they sell them.
Fair value adjustment (AFS) 1,367Unrealized holding gain (equity) 1,367
Net unrealized gain (loss)on AFS securities
Beg. Bal. 181Remove recorded net
unrealized gain 67
1,367FV adj. for securities on hand
1,119 End Bal.

Case 11: Revenue Recognition
Executive Summary:
Groupon was created in an attempt to follow up on a proposal of group-buying, an
idea that would allow a group of people all seeking to buy the same product to receive a
group discount on the product or service. Greatly appealing to consumers, the company
grew extremely rapidly and ultimately went public just three years after its conception.
However, along with its entrance into the public market came stricter stipulations. When
Groupon became a publicly traded company, it fell under the control of the requirements
of the Security Exchange Commission. Therefore, it had to make some adjustments to its
financial statements. Much of these changes were related to its revenue recognition.
Because it ultimately affects the public portrayal of the company, revenue recognition is a
very important issue in the accounting world. One of the most prominent features of
financial statements is net income, which relates sales revenue and expenses. A company
that has a high net income is typically seen as more profitable and a better investment. In
addition, management has an incentive to recognize higher revenues, because their
compensation may be based on the revenue of the company. When Groupon released its
revised financial statements and reported a material weakness in its accounting, the
company’s stock fell, and the public opinion of its profitability decreased as well.
Groupon’s business plan is different from that of a typical retailer for two
significant reasons. First, it operates online and therefore does not have any face-to-face

Revenue Recognition - 97
contact between employees and customers. This affects its sales, because customers
purchase a product online instead of bringing it home from the store. Second, it is an
agent for another company, rather than the primary obligor. Therefore, when customers
purchase products online, they are not purchasing Groupon products. Rather, they are
purchasing a voucher that provides a discount on a product or a service from a separate
company with which Groupon has created an agreement to split the proceeds of the sale.
When a company is an agent, rather than the principal, it is required to report its revenues
on the net basis. Upon the adjustment from the gross method to the net method, revenues
decrease substantially, because the company is no longer allowed to record the total
amount of sales revenue. Much of that revenue is owed to the principal, and it is
misleading for the company to report as its own revenue what it must relinquish to the
primary obligor. The gross method was much more preferable to Groupon, and when the
company was required to switch to the net method, it had to greatly decrease its reported
revenues.
The other significant issue regarding Groupon’s revenue recognition was a
problem associated with sales returns. First of all, a company is required to have an
allowance for sales returns based on historical data of returns. In this way, the company
can record the revenue at the point of the sale. In the case of a return, revenues decrease,
because the sales return account would be debited. Therefore, there is proper matching of
expenses and revenues, and both are reported in the correct period in which they
occurred. Groupon attempted to follow this rule, but because of its new expansion and
uncertainties associated with its rapid growth, there was not sufficient data to accurately
forecast future returns. As a result, the revenue listed on the financial statements was not

Revenue Recognition - 98
an accurate representation of the profitability of the company. Because of the uncertainty
of frequency of returns, Groupon should have deferred its revenue until the return period
has expired. The deference of the revenue would ensure that the company was recording
an accurate balance in the revenue account, rather than an estimate of an amount that was
actually fairly unpredictable.
Following Groupon’s revisions of its financial statements, people became more
hesitant to invest in the company. Initially after the company went public, it closed at
$28, but after the revisions, it dropped to only around $4. One of the main reasons for this
decrease in demand for the stock was the substantial decrease in revenues as a result of
the revisions. Although the updates to the financial statements made the company less
attractive to investors, they also ensured that the financial statements were actually an
accurate representation of the business. The requirements of the SEC on a publicly traded
company are stricter than the stipulations for a private company, but that is necessary to
ensure that investors have full disclosure of every company. It is unethical to mislead
investors on the profitability of the company, so greater stipulations are required to
prevent a company from doing so.

Revenue Recognition - 99
Appendix:
1. Wal-Mart is a traditional retailer that has now very much expanded its sales to the online market. Groupon and Amazon both solely make their sales online, and as such are very nontraditional retailers. Much of Groupon’s risks are associated with an inability to effectively respond to growth or an inability to maintain the revenue growth that was recorded in the past. The company records risks associated with all of the factors associated with a newly formed, rapidly expanding company. Amazon is a relatively similar company to Groupon, as it was essentially the first of its kind. Like Groupon, Amazon sells products exclusively online, and expanded incredibly rapidly. Listed in its annual reports, Amazon’s risks include intense competition, expansion, an inability to completely accurately forecast sales, seasonality, inventory risk, changes in government regulation, and several other risks associated with the business. Some of these risks would affect revenues, while others would affect operating expenses, both ultimately affecting net income and stockholders’ equity. Wal-Mart’s risks are very similar, but because the company has a large presence offline, it is also affected by hiring associates, expanding the sites of the stores, and natural disasters. These risks would also affect both revenues and operating expenses.
2. I agree with the statement “revenue and revenue growth are more important than income and income growth for new businesses, especially in the new-age economy.” For a new company, it is impossible to look at operating history to evaluate if the net income is good or bad for the company. Because revenues will never be negative, it is possible to determine a stock price. Many new companies are e-commerce, so it is impossible to accurately estimate operating expenses. Ultimately, for a new company, it is a more accurate indicator of profitability to look at revenues and resulting stock price. By analyzing the relationship between Amazon’s revenue, income, and stock price over the course of thirteen years, it is apparent that the stock price is based on the revenue. Net income is negative when Amazon is a new company, so it is impossible to determine stock price based on the net income. Therefore, it is evident that stock price is generated from revenue.

Revenue Recognition - 100
3.
Year Revenue(in millions)
Net Income(in millions)
Stock Price
1997 $147,787 ($31,020) $5.021998 $609,996 ($124,546) $53.541999 $1,639,839 ($719,968) $76.132000 $2,761,983 ($1,411,273) $15.562001 $3,122,433 ($567,277) $10.822002 $3,932,936 ($149,132) $18.892003 $5,263,699 $35,282 $52.622004 $6,921,000 $588,000 $44.292005 $8,490,000 $359,000 $47.152006 $10,711,000 $190,000 $39.462007 $14,835,000 $476,000 $92.642008 $19,166,000 $645,000 $51.282009 $24,509,000 $902,000 $134.522010 $34,204,000 $1,152,000 $180.00
Income Statement Account Gross Net Gross NetRevenue 100.00% 100.00% 100.00% 100.00%Cost of Sales 64.14% 30.34% 60.75% 10.39%
Gross Margin 35.86% 69.66% 39.25% 89.61%Marketing Expense 15.13% 33.79% 36.89% 90.86%General and Admin. Expense 24.67% 44.14% 32.79% 68.17%Other Expenses 0.00% 0.00% 28.48% 64.94%
Net Loss -4.41% -7.52% -57.95% -134.26%
Figure 11-1: Direct Effect of Stock Price on Revenue
Figure 11-2: 2009 and 2010 Common Size Income Statements
2009 2010
Direct Effect of Stock Price on Revenue
2009 and 2010 Common Size Income Statements

Revenue Recognition - 101
Figure 11-3: Computation of Asset Turnover Ratio
Cost of sales as a percentage or revenue is much higher under the gross method than under the net method. There is a higher cost of sales under the gross method, but there are also much higher revenues. However, the other operating expenses as a percentage of revenues are greater under the net method. These expenses are not dramatically affected by the difference in accounting methods, but revenues change significantly as a result of the different methods. Therefore, since the revenue under the net method is so much greater than sales under the gross method, the expenses as a percentage of sales is much greater.
a. The gross margin percentage is significantly larger under the net method. It is important for gross margin to be high, because it represents the remaining revenues once they have been reduced by the amount of expenses. Gross margin percentage is the gross profit divided by the revenues. Therefore, a higher gross profit margin indicates a more stable company, because it shows that the company is able to pay its operating and other expenses and build for the future. In addition, the margin increased from 2009 to 2010, primarily because revenues increased so substantially.
b. The asset turnover ratio is much greater under the gross method. This ratio is the revenue divided by the average total assets of the company. Asset turnover ratio is an indicator of how efficiently the company can utilize its assets to generate revenue. A higher ratio is a representation of the company’s ability to generate more revenue per dollar of assets. From 2009 to 2010, that percentage increased substantially. Both revenues and total assets grew exponentially between the two years.
4.a. When Groupon started using the net method instead of the gross method in
2009, there was a reduction of $15.9 million in revenues. The SEC required this difference, because it established that Groupon was an agent rather than the primary obligor. Under the gross method, Groupon recorded the price of the voucher as revenue and accounted for the percentage that was payable to the primary company as cost of sales. Under the net method, Groupon recorded only the percentage of the sale that it was not required to pay to the primary company. Therefore, the amount of recorded revenues was significantly reduced under the net method.
b. Groupon undeniably preferred the gross method. Under this method, it was allowed to record much greater revenues and ultimately greater net
Gross Net Gross NetRevenues $30,400,000 $14,500,000 $713,400,000 $312,900,000Average Total Assets $14,962,000 $14,962,000 $198,266,000 $198,266,000Asset Turnover Ratio 203.18% 96.91% 359.82% 157.82%
2009 2010
Computation of Asset Turnover Ratio

Revenue Recognition - 102
income, which made the company appear better to investors. Under the net method, it was allowed only to record as revenue the percentage of sales that it was not contractually obligated to give to the other company. The total sales under the net method are split into revenue and accounts payable.
c. Groupon argued that it is the primary obligor. The primary obligor is the party responsible to the customer for providing the product or service that is the subject of the arrangement. Groupon asserted that it is actually selling a voucher to obtain discounted goods or services. The company stated that because of the credit risk it bears and because of the Groupon promise, it believed it was the primary obligor.
d. Groupon’s argument was weak, but it was arguing fiercely so they would be allowed to continue reporting their revenue using the gross method. Groupon’s argument that it is the primary obligor, and thus allowed to report its revenue under ASC 605-45-45, is not well founded. Groupon is selling vouchers for other companies’ goods and services, and it does not hold the responsibility of delivering the goods or services. The company is not actually selling any goods or services, and the primary company is completely responsible for ensuring that the customer receives its purchased goods or services in a favorable manner. Therefore, Groupon is an agent, or a guarantor, for the company that is actually providing the goods or services to the customer. Because Groupon is attracting more customers to the company by offering the product or service at a lower cost, it is working as an agent working for the company. Groupon also argues that in the Groupon Promise it undertakes responsibility to the customer, but in its terms and conditions, it contradicts that promise. The terms and conditions state, “The merchant is fully responsible for all goods and services it provides to you.” With this statement, it relinquishes its responsibility to the merchant, and becomes an agent for that merchant. Under Staff Accounting Bulletin No. 101, firms are required to report revenue on a net basis when it acts as an agent without assuming the risks of ownership of the goods or the risk of default on payment. The other company holds these risks, and Groupon does not. Therefore, it is not the primary obligor, and should be required to report its revenue using the net method.
5.a. When the right of return exists, the company is required to create a
separate account for returns. When the merchandiser provides the product to the customer, it can recognize revenue for the amount of the sale. In Groupon’s case, though, there is a strong probability of returns. In the “Groupon Promise,” the company guarantees the customer that there is a 100 percent return policy if the customer is not happy. Therefore, under ASC 605-15-25, an allowance for sales returns should be established based on historical data documenting returns in the past. However, because Groupon was relatively new and had significantly expanded its reach from its creation until 2010, it does not have accurate data to

Revenue Recognition - 103
forecast future returns. As a result, ASC 605-15-25 calls for the recognition of revenue to be deferred until the right of return has expired. Until that point, all payments should be accounted for as unearned revenue, a liability, instead of as revenue, an equity account.
b. I do not agree with Groupon’s accounting. It is in violation of ASC 605-15-25, and Groupon’s arguments are very weak. Because Groupon recognizes revenue in the period of the sale, by the time the product is returned, the return often must be accounted for in a different period. This affects the financial statements for both periods, and causes them to be inaccurate representations of the business for each period.
c. Instead of recognizing the revenue at the date of sale, Groupon should defer the revenue until the return policy has expired. At the date of the sale, the payment should be recorded as unearned revenue. Then, upon the expiration of the return policy, the payment may be recorded as revenue. At this time, the revenue will affect net income and consequently total stockholders’ equity. Liabilities will decrease after the return period elapses, and total stockholders’ equity will increase. Net income will not be affected by the sale until the period for returns has ended, at which point the unearned revenue will be recognized as revenue. In addition, the company should, and did, revise its refund reserve. This liability account holds the balance of the estimated returns for the period. The significant increase in the revised statements represented the substantial excess of accrued expenses over actual cash disbursements due to customer refunds.
6. When Groupon revised its financial statements, it changed the way that it reported revenue. Previously, revenue was recorded at the point of sale. However, because of the claims that the return policy significantly affected the actual revenue earned, the company increased its refund reserve. Therefore, at the point of the sale, the cash payments were debited to cash and credited to unearned revenue, a liability account. After the return period had expired, the company recorded a debit to unearned revenue and a credit to revenue. Therefore, revenues decreased, because the balance of sales that were returned was not recorded. In addition, when the company increased its refund reserve account, the operating expenses significantly increased. However, cash flows were not affected because of the refund reserve account. When an order was returned, cash was not credited. Instead, the reserve account was decreased, affecting the operating expenses.

Case 12: Deferred Income Taxes
Executive Summary
ZAGG, “Zealous about Great Gadgets,” is a company that has led the market in
sales and creation of mobile device accessories. It is a publicly traded company that is
continuing to grow and expand in the market. Companies must prepare both financial
statements in accordance with the Generally Accepted Accounting Principles and tax
returns that are regulated by the Internal Revenue Service. As a result, two different
income amounts are calculated, a taxable income used to prepare the tax return and a
pretax financial income used to prepare the financial statements. The book system uses
the accrual basis of accounting, and revenues and expenses are matched for the period.
On the other hand, the tax system uses the cash basis of accounting, and the amount
included in income is calculated by including only the amount of cash that the company
actually receives or spends. Both temporary differences, which cause the creation of a
deferred tax asset or liability, and permanent differences, such as a non-deductible
expense or a return to provision adjustment, are recorded. Permanent differences do not
result in the creation of a deferred tax asset, but they do cause the effective tax rate to
differ from the statutory tax rate.
Sometimes income before taxes exceeds taxable income, and in other periods this
may be reversed. If income before taxes is greater than taxable income, a deferred tax

Deferred Income Taxes - 105
liability is recorded, representing a future taxable amount. Alternatively, if income before
taxes is less than taxable income, a deferred tax asset is recorded, giving rise to a future
deductible amount. Several things may cause this difference between income before taxes
and taxable income, including the company’s use of different depreciation methods on
the tax return and on the financial statements and the different methods of recording bad
debt expense on the tax return and on the financial statements. As on ZAGG’s 2012
statements, when an accelerated method of depreciation is used on the tax return, the
depreciation expense is greater in the initial years of the asset’s life. Therefore, income
tax expense is greater than taxable income. In addition, the book system uses an
allowance account to record bad debt expense, whereas the tax system uses the direct
write-off method. On ZAGG’s 2012 financial statements, the bad debt expense is greater
under the book system than under the tax system, so income before taxes is less than
taxable income. Having calculated the balance of total deferred tax assets and total
deferred tax liabilities, there becomes a net balance for the greater of the two.

Deferred Income Taxes - 106
AppendixNote: journal entries given in millions
a. Book income is the income listed on the financial statements, and is also referred to as income before taxes. ZAGG’s book income for fiscal year 2012 is $23,898,000. A company’s book income is determined in accordance with GAAP, and uses the accrual method of accounting. It is used to determine income tax expense. Taxable income, listed on the tax return, is determined in accordance with the rules and regulations of the IRS. Taxable income is used to determine income taxes payable. Income tax expense and income taxes payable differ in each year based on the amount of deferred tax liability or deferred tax asset.
b.i. Permanent tax differences are items that enter into the determination of
financial income but will never enter into the determination of taxable income. They may also be items that enter into the determination of taxable income but will never enter into the determination of financial income. Examples of permanent differences include proceeds from life insurance policies, interest on municipal bonds, and fines and penalties.
ii. Temporary tax differences arise when the tax basis of an asset or liability differs from the reported amounts in the financial statements. In other words, a temporary difference arises when an income or expense item is recognized in one year on the income statement and another year on the tax return. There are several examples of temporary differences including warranty costs, installment sales, prepaid insurance, and unearned rent.
iii. The statutory tax rate is the rate actually written in the law.iv. The effective tax rate is the percentage of income actually paid in taxes.
Statutory tax rate differs from effective tax rate when a permanent tax difference exists.
c. Income tax payable is different than income tax expense for a given year in which a temporary or permanent tax difference exists. Companies do not report their current tax bill as their income tax expense, because they use the accrual system to prepare the books. Therefore, they want to match revenues and expenses for the period. On the other hand, the tax system used on the tax return calculates tax based only on the amount of cash that is actually earned throughout the period.
d. A deferred income tax asset represents the increase in taxes refundable in future years as a result of deductible temporary differences at the end of the current year. For example, unearned rent is a deferred tax asset. A deferred tax liability represents the increase in taxes payable in future years as a result of temporary differences existing at the end of the current year. For example, differences in depreciation methods on the tax return and the income statement create a deferred tax liability.
e. A deferred income tax valuation allowances is created if it is more likely than not that some portion or all of the deferred tax asset will not be realized. It is used to reduce the deferred tax asset account.

Deferred Income Taxes - 107
f.i.
ii. The increase in the balance of net deferred tax assets from 2011 to 2012 caused the entry in f) i). The balance of deferred tax assets exceeds the balance of deferred tax liabilities, so there is a net deferred tax asset balance to be recorded in the balance sheet. There is an $8,293,000 difference in net deferred tax assets between the two years, which is recorded in the entry.
iii. The effective tax rate is 39.3 percent, found by dividing the income tax expense of $9,393,000 by taxable income of $23,898,000. This difference between the statutory rate and the effective rate can be accounted for by analyzing the second table of note eight. Because of several permanent differences, the effective tax rate is different. These permanent differences include the non-deductible expense, a domestic production activities deduction, a return to provision adjustment, and a federal rate bracket surcharge.
iv. This net balance is the sum of the current and noncurrent deferred income tax assets. The current balance of $6,912,000 combined with the noncurrent balance of $6,596,000 represents the net balance of deferred income tax assets.
g.i. Typically, one of the accelerated depreciation methods is used for tax
purposes, and straight-line depreciation is used for the books. The accelerated method of reporting taxes involves recording a greater depreciation expense in early years, and a lower expense at the end of the asset’s life. Under the straight-line method, the depreciation expense recorded is the same for every year. At the end of the asset’s life, the total depreciation expense is the same under both methods, but the depreciation expenses of the years differ. For the first few years of the asset’s life, the income before taxes under the book method is greater than taxable income under the accelerated system. Because there is a deferred tax liability listed in note 8, it can be assumed that the accelerated method, the system used for tax reporting, reported a greater depreciation expense in 2011 and 2012 and that income before taxes exceeds taxable income.
ii. Because deferred income tax liability is the product of the statutory income tax rate and the cumulative difference in book and tax depreciation expense, the difference can be estimated. The deferred income tax liability relating to property and equipment at December 31, 2012, is $794,000. The statutory income tax rate is the sum of the federal statutory tax rate and the blended state statutory rate, and is 38 percent. Therefore, one can estimate that the cumulative difference in book and tax depreciation expense is $2,089,464.
Income Tax Provision 9,390Net Deferred Tax Asset 8,293
Income Taxes Payable 17,683

Deferred Income Taxes - 108
iii. If tax depreciation had been used throughout the assets’ lives instead of the reported straight-line method, the total depreciation expense for 2012 would have been greater than the recorded expense. Total depreciation expense under the accelerated system used for tax reporting in 2012 would have been $5,406,474. Therefore the balance for property, plant, and equipment would be $2,773,000.
h.i. The IRS requires companies to record bad debt expense using the direct
write-off method. This system does not use an allowance to estimate the amount of bad debt expense, but instead records what is uncollectible when that amount is clearly identified as a bad debt. At this point, bad debts expense is debited and accounts receivable is credited. This method is not allowed under GAAP for financial statement presentation. Instead, the book method involves an allowance for doubtful accounts. This is an estimate of the future bad debts and is reported by debiting bad debt expense and crediting the allowance for doubtful accounts for the estimated amount. Therefore, when the amount is deemed uncollectible, the allowance is debited and the accounts receivable account is credited. Because there is a deferred tax asset, income before taxes is less than taxable income. Therefore, the bad debt expense is greater under the book system than under the tax system.
ii. The change in the deferred income tax asset relating to the allowance for doubtful accounts is equal to the product of the current period difference in book and tax bad debt expense in 2012 and the statutory income tax rate. The change in the allowance for doubtful accounts deferred tax asset from 2011 to 2012 is the difference in the asset in the two years. This change is $229,000. This amount multiplied by the 38 percent statutory income tax rate yields an $602,632 current period difference in book and tax bad debt expense.
i. The balance of the deferred income tax asset valuation allowance at the end of 2012 is ($713,000). This amount would be determined based on the value of the deferred tax asset that was not expected to be realized. A valuation account is used to decrease the value of the deferred income tax asset balance, and would be used in circumstances in which the company anticipates that some of the deferred tax asset would not be realized.
j. When the federal statutory tax rate changes, the company must revalue the deferred income tax assets. First, the cumulative difference in book and tax expenses must be calculated. This is done by dividing the net deferred tax assets by the original statutory income tax rate of 38 percent. This yields a cumulative balance of $35,547,000. This balance is then multiplied by the new statutory rate of 33 percent, which yields a new balance in the deferred tax assets of $11,730,000.68.
Income Tax Provision 11,730Deferred Tax Asset 11,730

Case 13: Retirement Obligations
Executive Summary
Johnson & Johnson is a common household brand, engaged in the research and
development, manufacture, and sale of a broad range of healthcare products. It is a
publicly traded company, and it has approximately 119,200 employees. Federal law does
not require companies to offer retirement plans to their employees, but most companies,
particularly large companies, choose to do so. There are two types of pension plans,
defined contribution plans and defined benefit plans. These plans have advantages and
disadvantages, and much of the choice is dependent on how long one plans to work for
the company. Defined contribution plans specify how much money will go into the
retirement plan each year. A set percentage of the employee’s salary goes into the fund
each year, and the employee decides how he wants to invest the money. The
responsibility of the employer is only to continue to make the required contribution
payments each year. This plan is a better option for people who may not want to stay with
the company for an extended period of time, because the payment is not dependent on the
number of years with the company.
The alternative option is the defined benefit plan. This plan specifies that the
employer provides a certain benefit not every year, but at the time of retirement. The
benefit is based on a formula that takes into account the employee’s years of service and
the highest salary the employee earns throughout his employment. This plan relies on

Retirement Obligations - 110
uncertain future variables, and the pension obligation is an estimate. Whereas employees
receive a set amount each period under the defined contribution plan to invest on their
own, the employer holds all responsibility for the defined benefit plan. Employers are
required to use accrual accounting, and these plans are more expensive than defined
contribution plans. As a result, they are no longer the predominant form of pensions.
Because salaries have increased substantially and employees have begun to live and work
longer, the expenses associated with defined benefit plans far outweigh the expenses of
defined contribution plans. The values of both defined benefit assets and liabilities are
great.
Johnson & Johnson primarily uses the defined benefit plans, so they must
continue funding based on variable and therefore estimated rates. Therefore, pension
accounts are often overfunded or underfunded. In accounting for pensions, the pension
obligation, the amount the company expects it will owe to employees, includes service
cost, interest cost, actuarial gains or losses, and benefits paid to retirees. Pension plan
assets, on the other hand, is the amount that is actually set aside as a fund for the
upcoming retirees. This amount is influenced by actual return on pension investments,
company contributions to the plan, and benefits paid to retirees. Using a defined benefit
plan is both more complicated and more expensive for a company.

Retirement Obligations - 111
Appendix:Note: journal entries given in millions
a)i) A defined contribution plan represents an employer’s obligation is to contribute a
certain sum each period based on some formula. The employer’s annual cost is the amount it is obligated to contribute to the pension trust. In addition, the risk of performance of the fund lies with the employee, and the employer’s only responsibility is to make the required contributions each year. For example, a 401K is a defined contribution plan. On the other hand, under a defined benefit plan, the employer’s obligation is to provide a certain benefit at the time of retirement. In contrast to the defined contribution plan, the defined benefit is a function of the employee’s years of service and of the compensation level in the years approaching retirement. This accounting is more complex than that of the defined contribution plan, and the risk lies with the employer rather than with the employee. Johnson & Johnson primarily uses defined benefit plans, because it states in Note 13 “retirement plan benefits are primarily based on the employee’s compensation during the last three to five years before retirement and the number of years of service.”
ii) Pension plans are liabilities, because they bear a promise to pay retirees at the end of their service. This promise may not be broken, and is not contingent on any other factor. As a result, it is recorded as a liability, and most often as a long-term liability.
iii) Pension obligations are long-term liabilities, and therefore there is a degree of uncertainty associated with the ultimate amount owed. Therefore, assumptions are essential to ensure that the balance of the liability on the balance sheet is an accurate estimate. For example, the company must estimate the number of years that each employer will work at the time of his retirement. In addition, the company must estimate the discount rate, because the present value of the future stream of expected benefits determines the balance of the recorded liability. The expected long-term rate of return on plan assets and the rate of increase in compensation levels must also be estimated.
b) The service cost is the expense caused by the increase in pension benefits payable to employees due to services rendered during the current year. This is the present value of the new benefits earned by employees during the year. Interest cost is the amount that accrues each year on the projected benefit obligation based on the settlement rate. Actuarial gains or losses are determined by comparing the pension expense to the fair market value of the fund assets. If the actual return on the plan assets is positive during the period, it is subtracted in the computation of pension expense and recorded as a gain. If the actual return is negative during the period, it is added into the computation of pension expense and recorded as a loss. Benefits paid to retirees is a deduction from the pension expense, because it represents the amount that is actually paid to those who are retiring in the present year. It is no longer an obligation, and is recorded as an outflow of cash.
c) Actual return that affects pension plan assets is the same as the actual return that affects the pension expense. The company records the gain or loss as a debit to plan
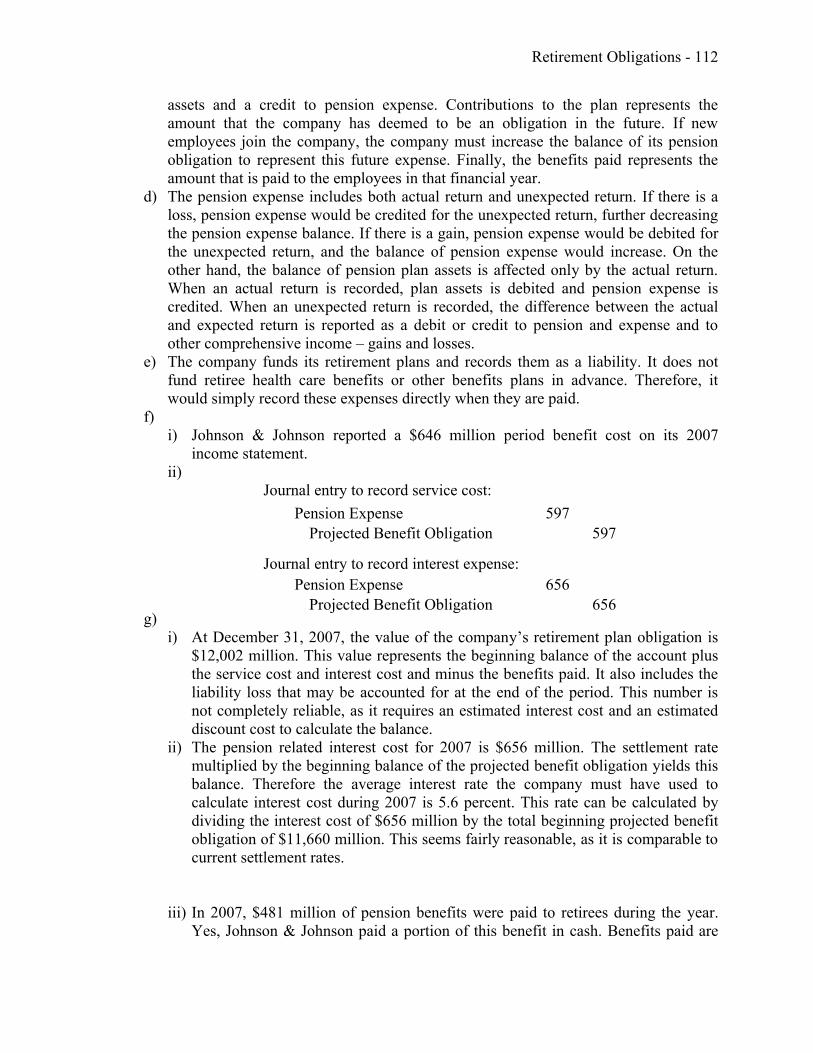
Retirement Obligations - 112
assets and a credit to pension expense. Contributions to the plan represents the amount that the company has deemed to be an obligation in the future. If new employees join the company, the company must increase the balance of its pension obligation to represent this future expense. Finally, the benefits paid represents the amount that is paid to the employees in that financial year.
d) The pension expense includes both actual return and unexpected return. If there is a loss, pension expense would be credited for the unexpected return, further decreasing the pension expense balance. If there is a gain, pension expense would be debited for the unexpected return, and the balance of pension expense would increase. On the other hand, the balance of pension plan assets is affected only by the actual return. When an actual return is recorded, plan assets is debited and pension expense is credited. When an unexpected return is recorded, the difference between the actual and expected return is reported as a debit or credit to pension and expense and to other comprehensive income – gains and losses.
e) The company funds its retirement plans and records them as a liability. It does not fund retiree health care benefits or other benefits plans in advance. Therefore, it would simply record these expenses directly when they are paid.
f)i) Johnson & Johnson reported a $646 million period benefit cost on its 2007
income statement.ii)
Journal entry to record service cost:
Journal entry to record interest expense:
g)i) At December 31, 2007, the value of the company’s retirement plan obligation is
$12,002 million. This value represents the beginning balance of the account plus the service cost and interest cost and minus the benefits paid. It also includes the liability loss that may be accounted for at the end of the period. This number is not completely reliable, as it requires an estimated interest cost and an estimated discount cost to calculate the balance.
ii) The pension related interest cost for 2007 is $656 million. The settlement rate multiplied by the beginning balance of the projected benefit obligation yields this balance. Therefore the average interest rate the company must have used to calculate interest cost during 2007 is 5.6 percent. This rate can be calculated by dividing the interest cost of $656 million by the total beginning projected benefit obligation of $11,660 million. This seems fairly reasonable, as it is comparable to current settlement rates.
iii) In 2007, $481 million of pension benefits were paid to retirees during the year. Yes, Johnson & Johnson paid a portion of this benefit in cash. Benefits paid are
Pension Expense 597Projected Benefit Obligation 597
Pension Expense 656Projected Benefit Obligation 656

Retirement Obligations - 113
recorded as a debit to project benefit obligation and a credit to plan assets. Therefore, both the projected benefit obligation and the plan assets account decrease.
h)i) At December 31, 2007, the value of the retirement plan assets is $10,469 million.
This value represents the beginning value plus the actual return plus the contributions to the fund less the benefits paid.
ii) The actual return reported in 2007 is $743 million and $966 million in 2006. The expected return in 2007 is $809 million and is $701 million in 2006. In 2006, the excess of actual return over expected return is recorded as a $265 million gain. The shortage of actual return under expected return is recorded as a $66 million loss in 2007. The loss and gain are reported in comprehensive income. This difference is significant, and is definitely material. In my opinion, the actual return better reflects the economics of the company’s pension expense, because it is no longer an estimate. The expected return is based only on estimated figures, and the actual return represents what really happened throughout the period.
iii) In 2007, Johnson & Johnson and its participants contributed $379 million to the plan. In 2006, together they contributed only $306 million. Both the company and the participants contributed $73 million more in 2007 than in 2006.
iv) Johnson & Johnson’s retirement plan assets are held as equity and debt securities, as well as real estate and other securities. In 2007, 79 percent of the United States plan assets were held as equity securities, and 21 percent were held as debt securities. In 2006, 78 percent of the plan assets were held as equity securities, and 22 percent were held as debt securities. In 2006, 67 percent of international retirement plans were held as equity securities, 32 percent were held as debt securities, and one percent was held as real estate and other securities. In 2007, these percentages remained constant for the international retirement plans
i) The retirement plan is underfunded in both 2006 and 2007. In 2006, the pension obligation is $11,660 million, but the fair value of the plan assets is only $9,538 million. Therefore, at the end of the year there is a funding deficit of $2,122 million. In 2007, the projected benefit obligation was $12,002 million, and the fair value of the plan assets was $10,469 million. As a result, the plan is underfunded by $1,533 million. This is reported in Note 13 under the change in plan assets.