analysis of flood risk zones (frzs) around asa river i n ... · this study focused on the analysis...
TRANSCRIPT

IJISET - International Journal of Innovative Science, Engineering & Technology, Vol. 1 Issue 9, November 2014.
www.ijiset.com
ISSN 2348 – 7968
Analysis of Flood Risk Zones (Frzs) Around Asa River in Ilorin Using Geographic Information System (GIS)
Abiodun Daniel Olabode1, Lanre Tajudeen Ajibade2, Olorukooba Yunisa3
1Department of Geography and Planning Science, Adekunle Ajasin University, Akungba-Akoko, Ondo State, Nigeria
2Department of Geography and Environmental Management
University of Ilorin, Ilorin, Nigeria
3Kwara State Ministry of Lands and Housing, Ilorin, Nigeria Abstract This study focused on the analysis of Flood Risk Zones (FRZs) of Asa River for sustainable environmental management using GIS technique in Ilorin, Kwara State, Nigeria. The specific objectives of the study are to; identify point location of buildings around Asa River, examine the vulnerability status of buildings induced by flooding activities, query and hotlink spatial features. Primary data were obtained through Global Positioning System (GPS) and direct observation. However, secondary data were collected from the existing books, journals, maps and internet. GIS technology involved Geo-referencing and digitizing Asa Map from the Kwara State map with Surfer and Arcview GIS software. The GPS points were generated to create geo-database of the existing buildings around the river bank. Analysis of spatial queries were as a result of the available database, such that each time the query is made the object concerned turns to yellow while others maintain normal state. FRZs were examined using buffer analysis to identify highly vulnerable, low vulnerable and non-vulnerable buildings around the river. The study revealed that the first set of buildings at the distance of 15 meters from the river are at the greatest risk, hence, they are referred to as being highly vulnerable. The study recommended regular up-date of the comprehensive database and adjusting buildings within the risk zone through demolishing and relocation processes. Keywords: GIS technology, buffer operation, vulnerable, hotlink analysis, database design, buildings Introduction In Nigeria, flooding is a common experience in all parts of the country. The causes are mainly from the three major factors namely: heavy downpour, overflow of drainage channels and emergency release of water from dams. Flooding is an important issue of global concern as a result of its effects on man and his environment. Heavy rainfall for considerably longer periods often builds up excess water beyond which percolation can accommodate. As a result, the water level begins to rise and flood flows in the direction of slopes and into neighboring depression. Floods are hazards that occur regularly in Nigeria. Flooding cannot be completely avoided, but damages from severe flooding can be reduced if effective flood prevention scheme is implemented. Mitigation is hence the cornerstone of emergency management. Geographic Information System (GIS) is widely used to analyze natural hazards such as landslides, flooding, among others. GIS is extremely useful for integrating various geographic data, and for numerical analysis of such data. In the past, the Asa River in Ilorin City in Kwara State has frequently overflowed its banks and the floodwaters flowed down to the downtown area of the city causing a wide variety of damages during the period of this disaster. The major part of Asa River in Ilorin is traditionally identified as a flood risk zone areas in Ilorin, Kwara State. Most of the flood management strategies in this region have been geared towards ‘preventing’ flood by an attempt to contain the river. Very little attention is paid on formulating rational land use planning to reduce flood induced disaster. Preparation of a comprehensive flood hazard map for this study area would be the one of most crucial steps for implementing remedial measures. This paper attempts to synthesize the relevant database in a spatial framework to evolve a flood hazard map for analyzing Asa River in Ilorin. Geographical Information System (GIS) is extensively used to assemble information using different maps and spatial analytical techniques.
621

IJISET - International Journal of Innovative Science, Engineering & Technology, Vol. 1 Issue 9, November 2014.
www.ijiset.com
ISSN 2348 – 7968
With continuous advancements in the field of computing, geographic analysis, map-making and visualization, it has become imperative for the hazard analysts to start utilizing the maximum benefits of geospatial technologies which has been subjected to tremendous scope of improvement. Technologies have brought changes in the living conditions of human beings as well as to internal security and threats to public life. The ability to locate building point around flood area, manage any potential damage to them, and propose quick remedial steps is now made possible using the computerized capabilities of today’s technologies. As a result of this, government agencies and citizens alike will be able to respond to damage on the environment as well as other emergencies that threaten public safety. Essentially, this study identified the present locations of existing flood hazard around Asa River in Ilorin with a view of drawing out GIS approach for planning future assets with safety in mind since variety of users could handle spatial data and attribute data in a wide range of application. Study area Ilorin is located on latitude 8°30N and Longitude 4010E with an area of about 100km (Kwara State Diary, 1997). The city (llorin) is situated in the transitional zone between the forest and savanna region of Nigeria between the very North and West coastal region. It is abundantly blessed with surface and underground waters. It is therefore appropriate to say that the city is a middle belt state serving as a gateway between the North and the South (Oyebanji, 1993) (see figure 1).
Figure 1: Kwara showing Ilorin West Figure 2: Asa River
622
IJISET - International Journal of Innovative Science, Engineering & Technology, Vol. 1 Issue 9, November 2014.
www.ijiset.com
ISSN 2348 – 7968
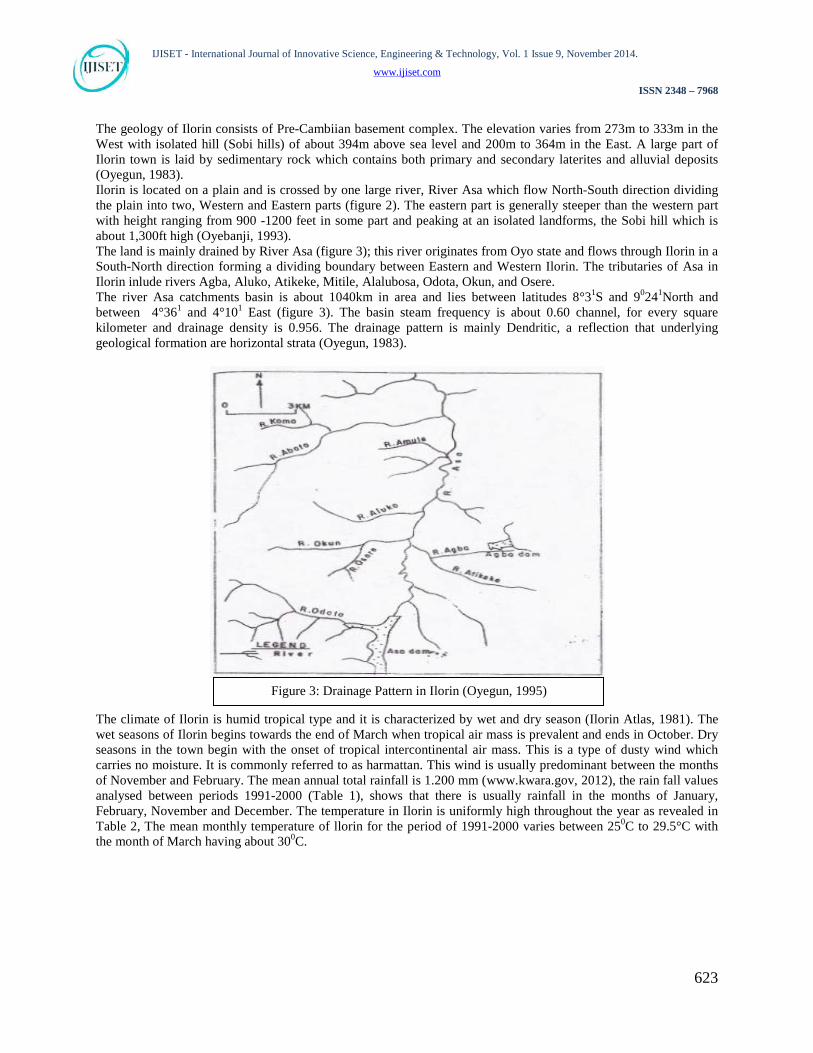
The geology of Ilorin consists of Pre-Cambiian basement complex. The elevation varies from 273m to 333m in the West with isolated hill (Sobi hills) of about 394m above sea level and 200m to 364m in the East. A large part of Ilorin town is laid by sedimentary rock which contains both primary and secondary laterites and alluvial deposits (Oyegun, 1983). Ilorin is located on a plain and is crossed by one large river, River Asa which flow North-South direction dividing the plain into two, Western and Eastern parts (figure 2). The eastern part is generally steeper than the western part with height ranging from 900 -1200 feet in some part and peaking at an isolated landforms, the Sobi hill which is about 1,300ft high (Oyebanji, 1993). The land is mainly drained by River Asa (figure 3); this river originates from Oyo state and flows through Ilorin in a South-North direction forming a dividing boundary between Eastern and Western Ilorin. The tributaries of Asa in Ilorin inlude rivers Agba, Aluko, Atikeke, Mitile, Alalubosa, Odota, Okun, and Osere. The river Asa catchments basin is about 1040km in area and lies between latitudes 8°31S and 90241North and between 4°361 and 4°101 East (figure 3). The basin steam frequency is about 0.60 channel, for every square kilometer and drainage density is 0.956. The drainage pattern is mainly Dendritic, a reflection that underlying geological formation are horizontal strata (Oyegun, 1983). The climate of Ilorin is humid tropical type and it is characterized by wet and dry season (Ilorin Atlas, 1981). The wet seasons of Ilorin begins towards the end of March when tropical air mass is prevalent and ends in October. Dry seasons in the town begin with the onset of tropical intercontinental air mass. This is a type of dusty wind which carries no moisture. It is commonly referred to as harmattan. This wind is usually predominant between the months of November and February. The mean annual total rainfall is 1.200 mm (www.kwara.gov, 2012), the rain fall values analysed between periods 1991-2000 (Table 1), shows that there is usually rainfall in the months of January, February, November and December. The temperature in Ilorin is uniformly high throughout the year as revealed in Table 2, The mean monthly temperature of llorin for the period of 1991-2000 varies between 250C to 29.5°C with the month of March having about 300C.
Figure 3: Drainage Pattern in Ilorin (Oyegun, 1995)
623

IJISET - International Journal of Innovative Science, Engineering & Technology, Vol. 1 Issue 9, November 2014.
www.ijiset.com
ISSN 2348 – 7968
Ilorin falls within the southern savannah zones. This zone is a transition between the high forests in the southern part of the country in the far North with woodland properties (NISER, 1980). The vegetation of Ilorin is characterized by scattered tall tress shrubs, of between the height of ten and twelve feet. Oyebanji (1993) described the vegetation of Ilorin to be predominantly covered by derived savannah found in Ilorin East and West of which are noted for their dry lowland rain forest vegetal cover. Some of the notable trees include butter trees, Acacia, Locust beans, Baobab among others. Ilorin is covered mainly by ferruginous soil on crystalline acidic rock (www.kwara.gov). This soil type has both sandy and clayey deposit lying on top of each other. The soil surface is made up of sandy deposit characterised by low water holding capacity, which encourages infiltration. The clayey deposit beneath results in water logging during rainy season; thus, facilitating the occurrence of surface water run-off in the city. llorin is one of the fastest growing urban centers in Nigeria. Its population growth rate is much higher than for other cities in the country (Oyegun, 1983). With a population of about 570,000 in 1991, Ilorin is a primate city in Kwara State where none of the other urban areas has a population of 100,000 (Oyebanji, 1993). Materials and Methods Residential buildings around the River Asa were identified using Global Positioning System (GPS). The coordinates of building locations in the study area were taken in degrees, minutes, and seconds and thereafter converted into
624

IJISET - International Journal of Innovative Science, Engineering & Technology, Vol. 1 Issue 9, November 2014.
www.ijiset.com
ISSN 2348 – 7968
Universal Traverse Mercator (UTM) for easy manipulations. Direct observation was used in order to elicit attributes of each of the building. To create database for Flood Risk Zones (FRZs), the map of Ilorin West Local Government Areas was acquired and map of river Asa was extracted, Geo-referenced and digitized from the 1:50,000 topographical map of Kwara State (Kwara State Ministry of Land and Housing, 1996). The process of digitizing involved electronic scanning of map to convert it into lines and points through on-screen digitization. Identities of the objects on the map as well as their spatial relationships were specified. The attributes of identified buildings around the river were linked to the spatial data using Arcview GIS software. The GPS data generated were then stored in a relational database, which consist of core dataset (building points and unique ID) to which the associated spatial data (X,Y coordinates) stored in tables prepared with Arcview GIS software were linked. Basically, all data collected through different methods and sources were subjected to Geographic Information System treatment. Spatial searches were carried out to verify and demonstrate the utility of the database created as decision making tool. RESULTS OF THE FINDINGS Point Map of Buildings around Asa River In figure 4, the outcome of the geo-referencing and digitizing exercise is presented and various building locations around River Asa within the study area are also identified. These observed locations were presented through point map. This further shows the extent by which various building structures are identified at the course of the river flow in the area under study.
In addition, point coordinates of major locations were imported into Arcview GIS through the Add Event Theme in the Theme Menu after saving the coordinate generated in Notepad (as delimited text file) and table data were later converted to dBASE (dbf) for further editing in Arcview GIS (see Table 3). This established that in GIS, database is the central part of its operation and data input must be vast and current because this is where the users’ requirement is satisfied (Burrough, 1989).
Figure 4: The study Area showing building points along River Asa
625
IJISET - International Journal of Innovative Science, Engineering & Technology, Vol. 1 Issue 9, November 2014.
www.ijiset.com
ISSN 2348 – 7968
Table 3: Database showing X and Y Coordinates
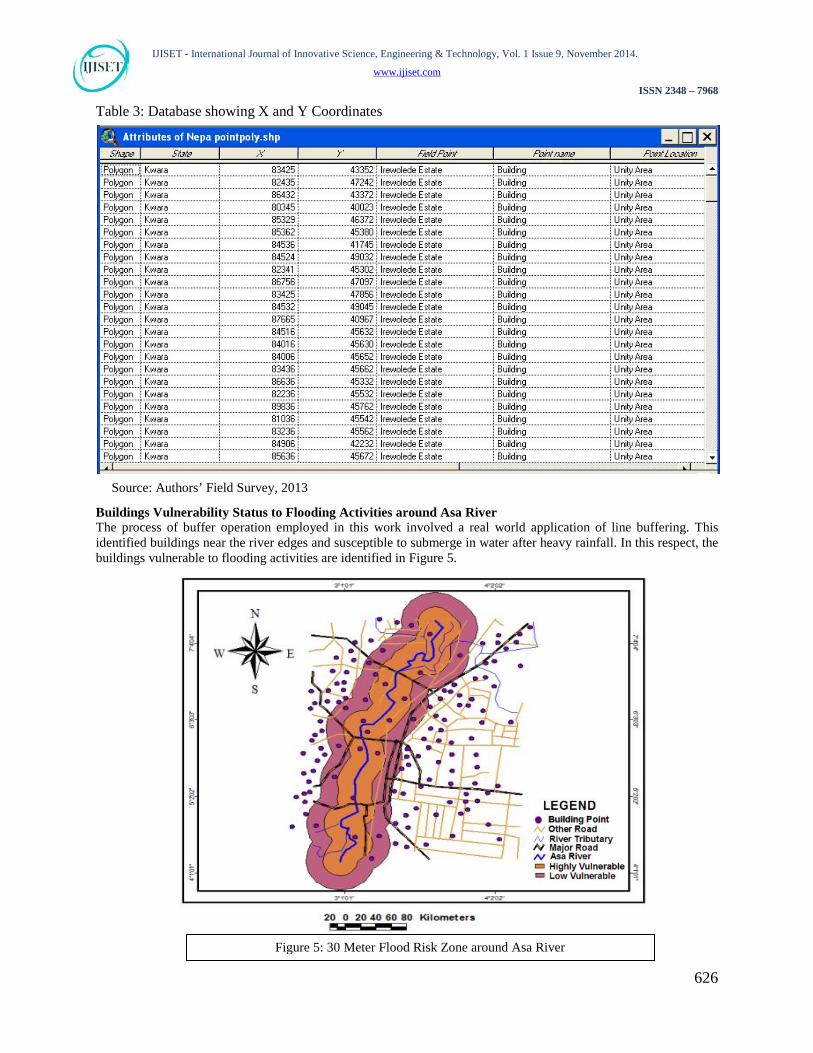
Buildings Vulnerability Status to Flooding Activities around Asa River The process of buffer operation employed in this work involved a real world application of line buffering. This identified buildings near the river edges and susceptible to submerge in water after heavy rainfall. In this respect, the buildings vulnerable to flooding activities are identified in Figure 5.
Source: Authors’ Field Survey, 2013
Figure 5: 30 Meter Flood Risk Zone around Asa River
626
IJISET - International Journal of Innovative Science, Engineering & Technology, Vol. 1 Issue 9, November 2014.
www.ijiset.com
ISSN 2348 – 7968
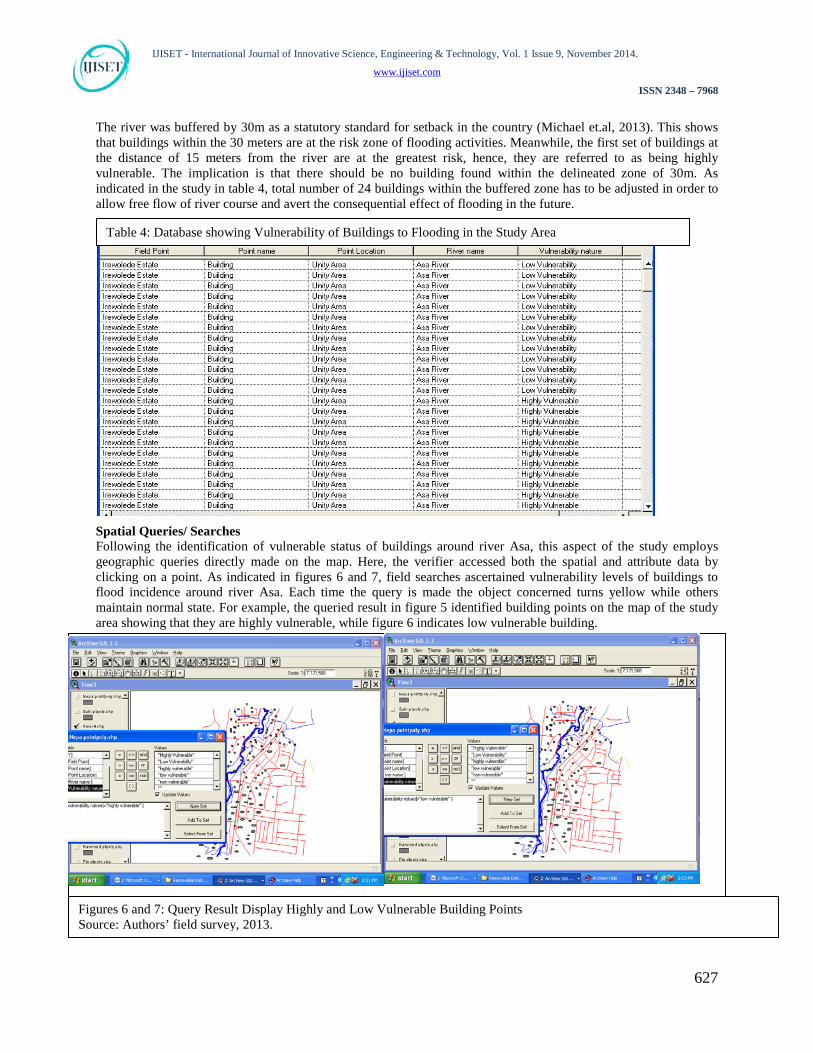
The river was buffered by 30m as a statutory standard for setback in the country (Michael et.al, 2013). This shows that buildings within the 30 meters are at the risk zone of flooding activities. Meanwhile, the first set of buildings at the distance of 15 meters from the river are at the greatest risk, hence, they are referred to as being highly vulnerable. The implication is that there should be no building found within the delineated zone of 30m. As indicated in the study in table 4, total number of 24 buildings within the buffered zone has to be adjusted in order to allow free flow of river course and avert the consequential effect of flooding in the future. Spatial Queries/ Searches Following the identification of vulnerable status of buildings around river Asa, this aspect of the study employs geographic queries directly made on the map. Here, the verifier accessed both the spatial and attribute data by clicking on a point. As indicated in figures 6 and 7, field searches ascertained vulnerability levels of buildings to flood incidence around river Asa. Each time the query is made the object concerned turns yellow while others maintain normal state. For example, the queried result in figure 5 identified building points on the map of the study area showing that they are highly vulnerable, while figure 6 indicates low vulnerable building.
Table 4: Database showing Vulnerability of Buildings to Flooding in the Study Area
Figures 6 and 7: Query Result Display Highly and Low Vulnerable Building Points Source: Authors’ field survey, 2013.
627
IJISET - International Journal of Innovative Science, Engineering & Technology, Vol. 1 Issue 9, November 2014.
www.ijiset.com
ISSN 2348 – 7968
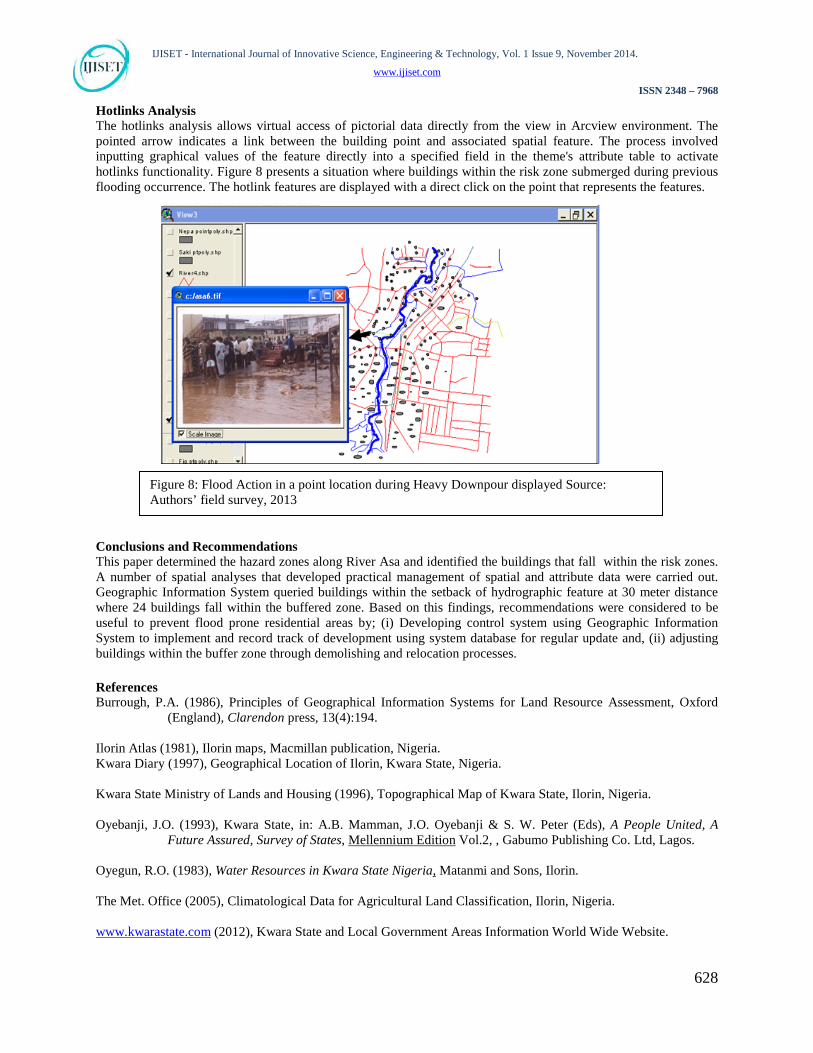
Hotlinks Analysis The hotlinks analysis allows virtual access of pictorial data directly from the view in Arcview environment. The pointed arrow indicates a link between the building point and associated spatial feature. The process involved inputting graphical values of the feature directly into a specified field in the theme's attribute table to activate hotlinks functionality. Figure 8 presents a situation where buildings within the risk zone submerged during previous flooding occurrence. The hotlink features are displayed with a direct click on the point that represents the features.
Conclusions and Recommendations This paper determined the hazard zones along River Asa and identified the buildings that fall within the risk zones. A number of spatial analyses that developed practical management of spatial and attribute data were carried out. Geographic Information System queried buildings within the setback of hydrographic feature at 30 meter distance where 24 buildings fall within the buffered zone. Based on this findings, recommendations were considered to be useful to prevent flood prone residential areas by; (i) Developing control system using Geographic Information System to implement and record track of development using system database for regular update and, (ii) adjusting buildings within the buffer zone through demolishing and relocation processes.
References Burrough, P.A. (1986), Principles of Geographical Information Systems for Land Resource Assessment, Oxford
(England), Clarendon press, 13(4):194. Ilorin Atlas (1981), Ilorin maps, Macmillan publication, Nigeria. Kwara Diary (1997), Geographical Location of Ilorin, Kwara State, Nigeria. Kwara State Ministry of Lands and Housing (1996), Topographical Map of Kwara State, Ilorin, Nigeria. Oyebanji, J.O. (1993), Kwara State, in: A.B. Mamman, J.O. Oyebanji & S. W. Peter (Eds), A People United, A
Future Assured, Survey of States, Mellennium Edition Vol.2, , Gabumo Publishing Co. Ltd, Lagos. Oyegun, R.O. (1983), Water Resources in Kwara State Nigeria, Matanmi and Sons, Ilorin. The Met. Office (2005), Climatological Data for Agricultural Land Classification, Ilorin, Nigeria. www.kwarastate.com (2012), Kwara State and Local Government Areas Information World Wide Website.
Figure 8: Flood Action in a point location during Heavy Downpour displayed Source: Authors’ field survey, 2013
628