analysis of food and beverage sector in different...
TRANSCRIPT
D4.2 - Picture of efficiency projects implemented by the
Industry sector-by-sector and process-by-process
Page 1
EU-MERCI
EU coordinated MEthods and procedures based on Real Cases for the effective
implementation of policies and measures supporting energy efficiency in the Industry
HORIZON 2020 Project Nr. 693845
Analysis of Food and Beverage sector
in different Countries
WP4: Picture of efficiency projects implemented by the Industry sector-by-sector and process-by-process
D4.2 - Picture of efficiency projects implemented by the
Industry sector-by-sector and process-by-process
Page 2
Table of Contents
1 Portugal ............................................................................................................................... 3
1.1 General overview of the sector ..................................................................................... 3
1.1.1 Companies .......................................................................................................................... 3
1.2 Energy Policies ............................................................................................................. 9
1.2.1 Energy Supply ..................................................................................................................... 9
1.2.2 Energy Demand ................................................................................................................. 10
1.2.3 Final Energy Consumption ................................................................................................ 10
1.2.4 Policies and measures in Energy Efficiency ...................................................................... 10
1.2.5 Funding mechanisms ........................................................................................................ 11
1.2.6 Energy use in industry ....................................................................................................... 11
2 Turkey................................................................................................................................ 13
2.1 Economic data............................................................................................................ 13
2.2 Energy statistics ......................................................................................................... 16
2.2.1 Energy consumption ......................................................................................................... 16
2.2.2 Energy consumption in Food and Beverage industry in Turkey ....................................... 20
2.2.3 Biomass ............................................................................................................................. 21
3 Czech Republic ................................................................................................................... 22
3.1 Sectoral organisation .................................................................................................. 22
3.2 Economic indicators ................................................................................................... 23
3.3 Energy statistics ......................................................................................................... 25
3.3.1 Food industry .................................................................................................................... 26
3.3.2 Energy prices ..................................................................................................................... 26
4 France ................................................................................................................................ 27
4.1 Global presentation and economic performances of the sector ................................... 27
4.2 Energy consumption in the French industry ................................................................. 28
4.3 Energy use in the French food industry ....................................................................... 28
5 Spain ................................................................................................................................. 31
5.1 Energy consumption ................................................................................................... 33
D4.2 - Picture of efficiency projects implemented by the
Industry sector-by-sector and process-by-process
Page 3
1 Portugal
1.1 General overview of the sector
The food and beverage industry (F&B) is the manufacturing industry that contributes most to the
national economy, both in terms of turnover and Gross Value Added (GVA). It is also the one that most
employs in Portugal, having been responsible for more than 108,000 jobs in 2016, according to FIPA's
estimate.
It has contributed to the balance of trade balance, with a growth rate of exports that is higher than
that of imports. Since 2010 it has maintained a performance above the average national economy.
Despite the crisis and in contrast to the national manufacturing industry, the national food and
beverage industry grew between 2013 and 2016 in terms of number of companies and Gross Value
Added.
Regarding the external competitiveness, exports of food and drink industry in 2016 increased by 2.0%
compared to 2015, reaching 4,550 million (8.95% of total exports of goods Portugal).
1.1.1 Companies
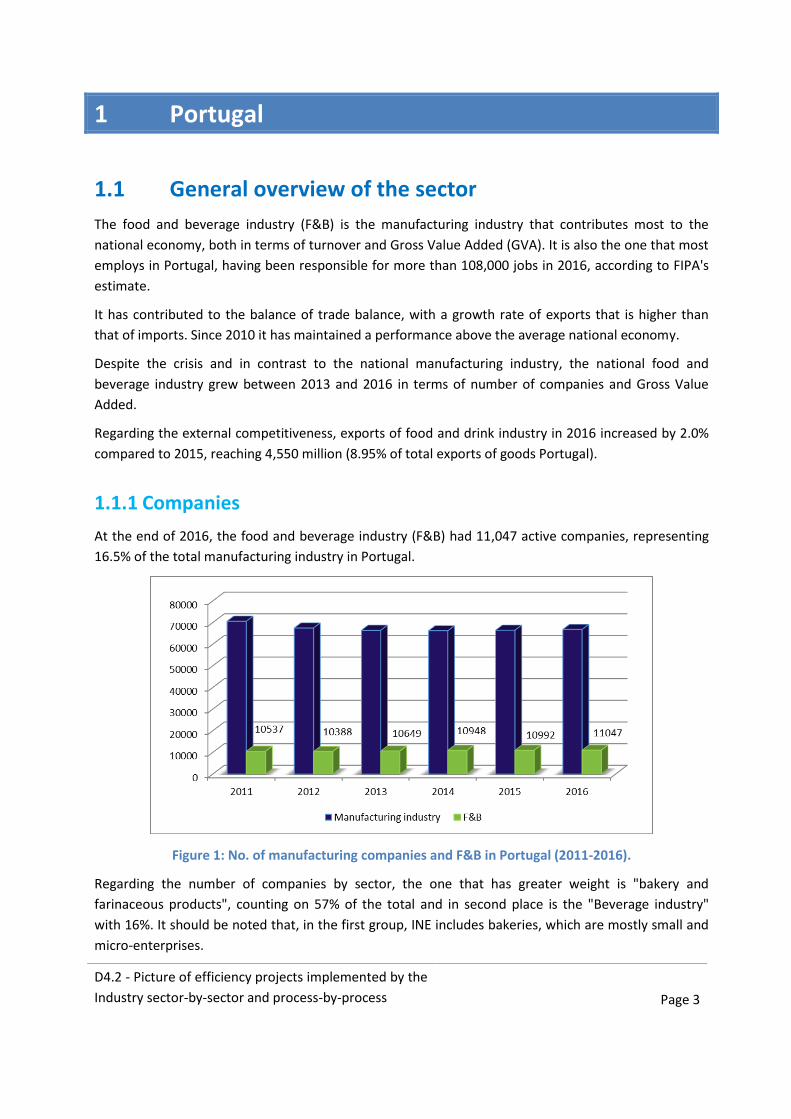
At the end of 2016, the food and beverage industry (F&B) had 11,047 active companies, representing
16.5% of the total manufacturing industry in Portugal.
Figure 1: No. of manufacturing companies and F&B in Portugal (2011-2016).
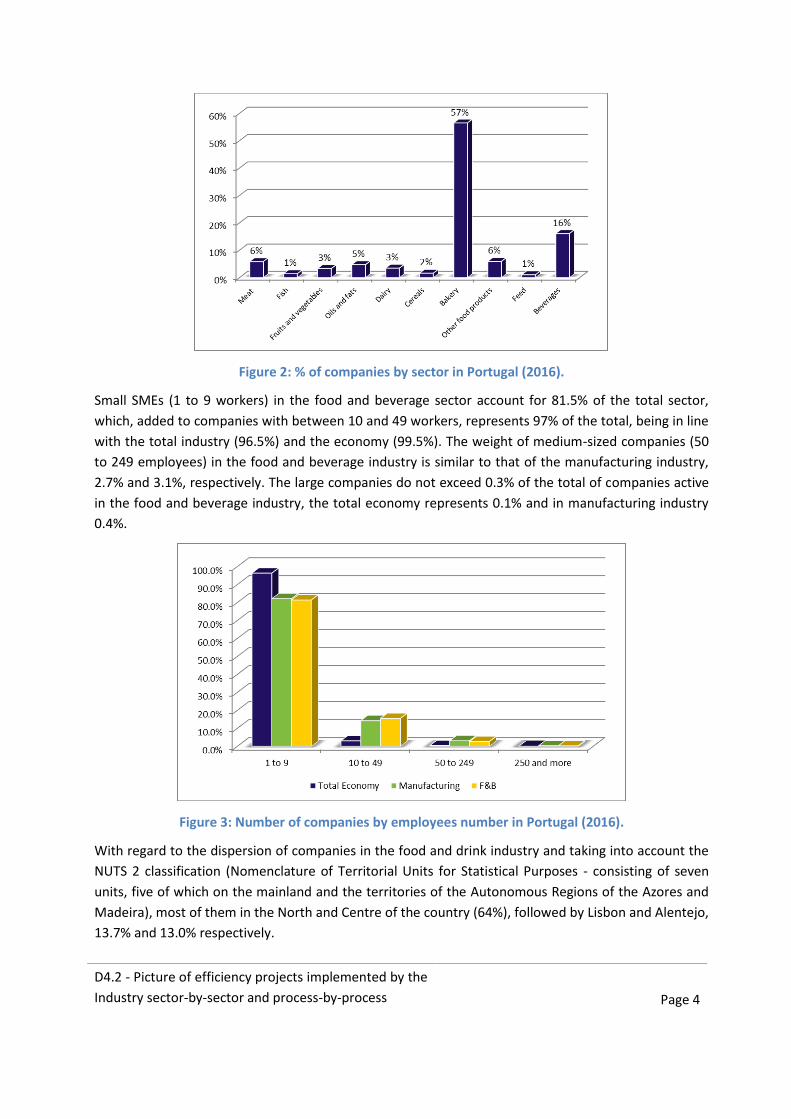
Regarding the number of companies by sector, the one that has greater weight is "bakery and
farinaceous products", counting on 57% of the total and in second place is the "Beverage industry"
with 16%. It should be noted that, in the first group, INE includes bakeries, which are mostly small and
micro-enterprises.
D4.2 - Picture of efficiency projects implemented by the
Industry sector-by-sector and process-by-process
Page 4
Figure 2: % of companies by sector in Portugal (2016).
Small SMEs (1 to 9 workers) in the food and beverage sector account for 81.5% of the total sector,
which, added to companies with between 10 and 49 workers, represents 97% of the total, being in line
with the total industry (96.5%) and the economy (99.5%). The weight of medium-sized companies (50
to 249 employees) in the food and beverage industry is similar to that of the manufacturing industry,
2.7% and 3.1%, respectively. The large companies do not exceed 0.3% of the total of companies active
in the food and beverage industry, the total economy represents 0.1% and in manufacturing industry
0.4%.
Figure 3: Number of companies by employees number in Portugal (2016).
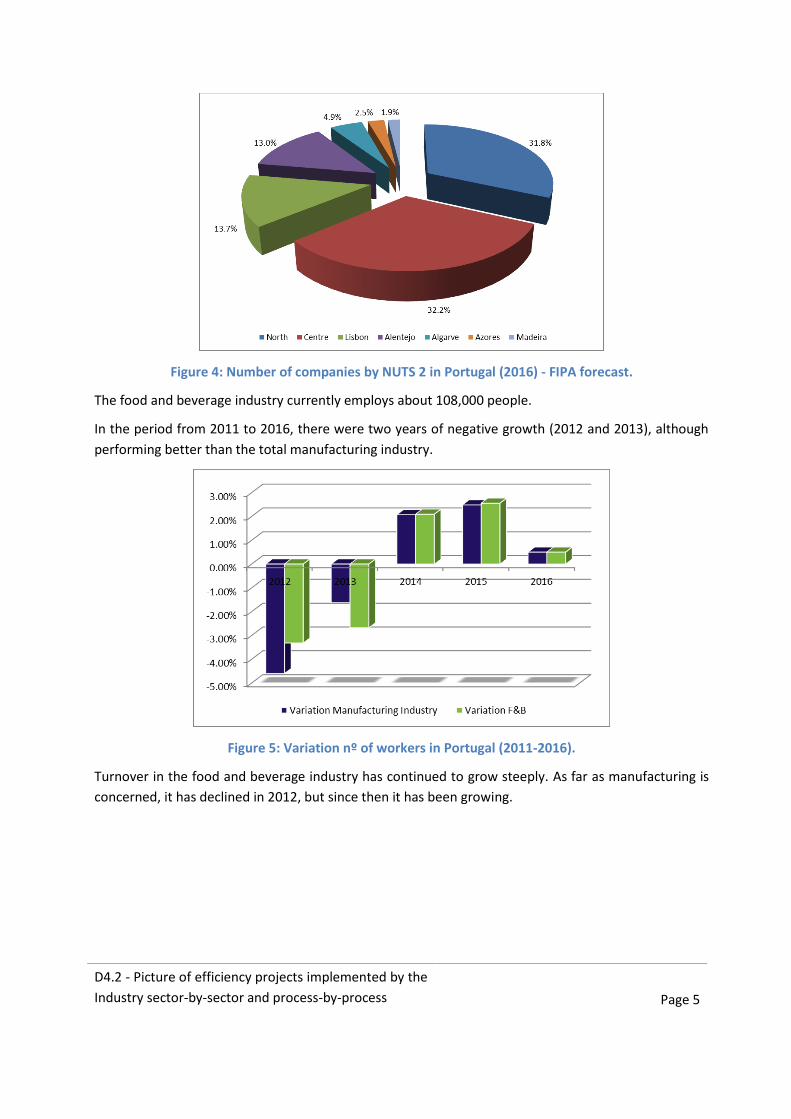
With regard to the dispersion of companies in the food and drink industry and taking into account the
NUTS 2 classification (Nomenclature of Territorial Units for Statistical Purposes - consisting of seven
units, five of which on the mainland and the territories of the Autonomous Regions of the Azores and
Madeira), most of them in the North and Centre of the country (64%), followed by Lisbon and Alentejo,
13.7% and 13.0% respectively.
D4.2 - Picture of efficiency projects implemented by the
Industry sector-by-sector and process-by-process
Page 5
Figure 4: Number of companies by NUTS 2 in Portugal (2016) - FIPA forecast.
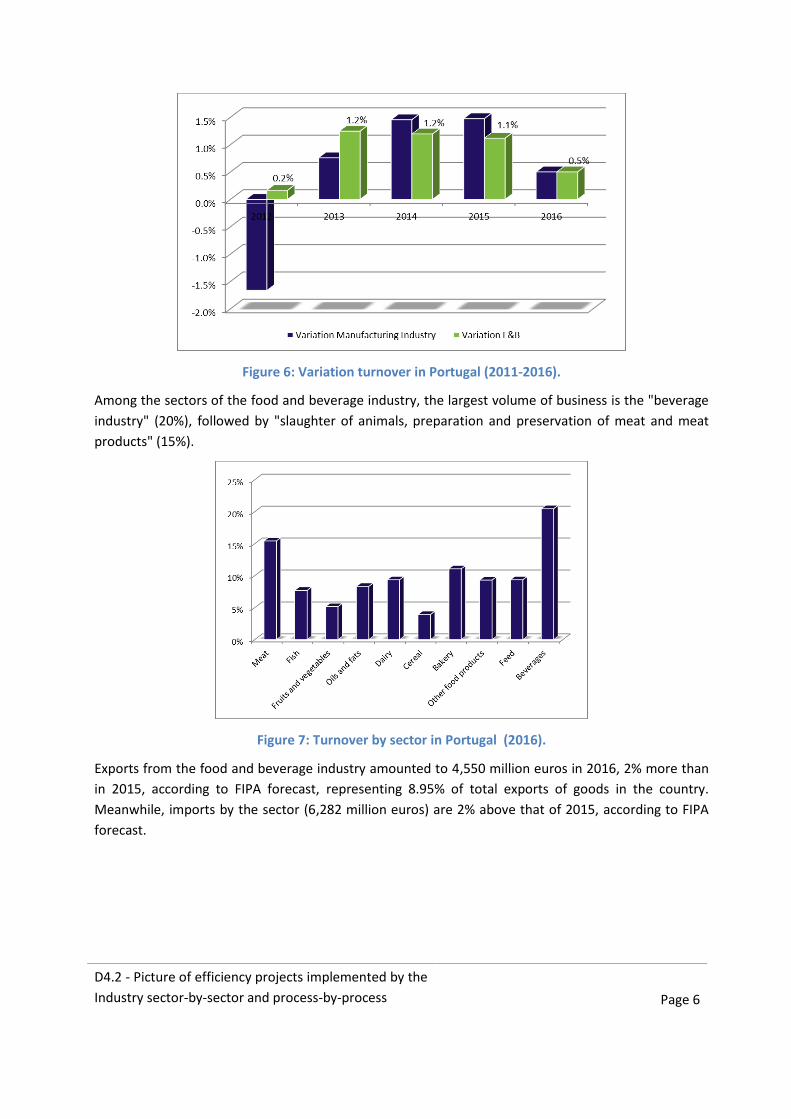
The food and beverage industry currently employs about 108,000 people.
In the period from 2011 to 2016, there were two years of negative growth (2012 and 2013), although
performing better than the total manufacturing industry.
Figure 5: Variation nº of workers in Portugal (2011-2016).
Turnover in the food and beverage industry has continued to grow steeply. As far as manufacturing is
concerned, it has declined in 2012, but since then it has been growing.
D4.2 - Picture of efficiency projects implemented by the
Industry sector-by-sector and process-by-process
Page 6
Figure 6: Variation turnover in Portugal (2011-2016).
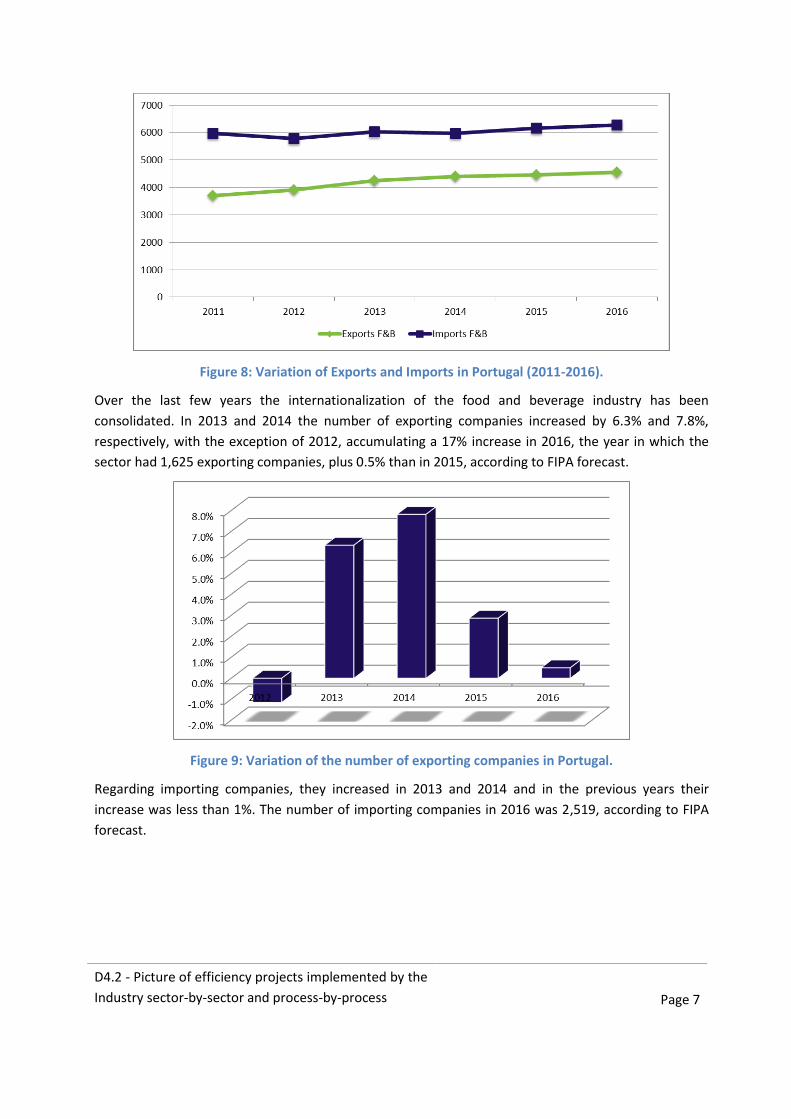
Among the sectors of the food and beverage industry, the largest volume of business is the "beverage
industry" (20%), followed by "slaughter of animals, preparation and preservation of meat and meat
products" (15%).
Figure 7: Turnover by sector in Portugal (2016).
Exports from the food and beverage industry amounted to 4,550 million euros in 2016, 2% more than
in 2015, according to FIPA forecast, representing 8.95% of total exports of goods in the country.
Meanwhile, imports by the sector (6,282 million euros) are 2% above that of 2015, according to FIPA
forecast.
D4.2 - Picture of efficiency projects implemented by the
Industry sector-by-sector and process-by-process
Page 7
Figure 8: Variation of Exports and Imports in Portugal (2011-2016).
Over the last few years the internationalization of the food and beverage industry has been
consolidated. In 2013 and 2014 the number of exporting companies increased by 6.3% and 7.8%,
respectively, with the exception of 2012, accumulating a 17% increase in 2016, the year in which the
sector had 1,625 exporting companies, plus 0.5% than in 2015, according to FIPA forecast.
Figure 9: Variation of the number of exporting companies in Portugal.
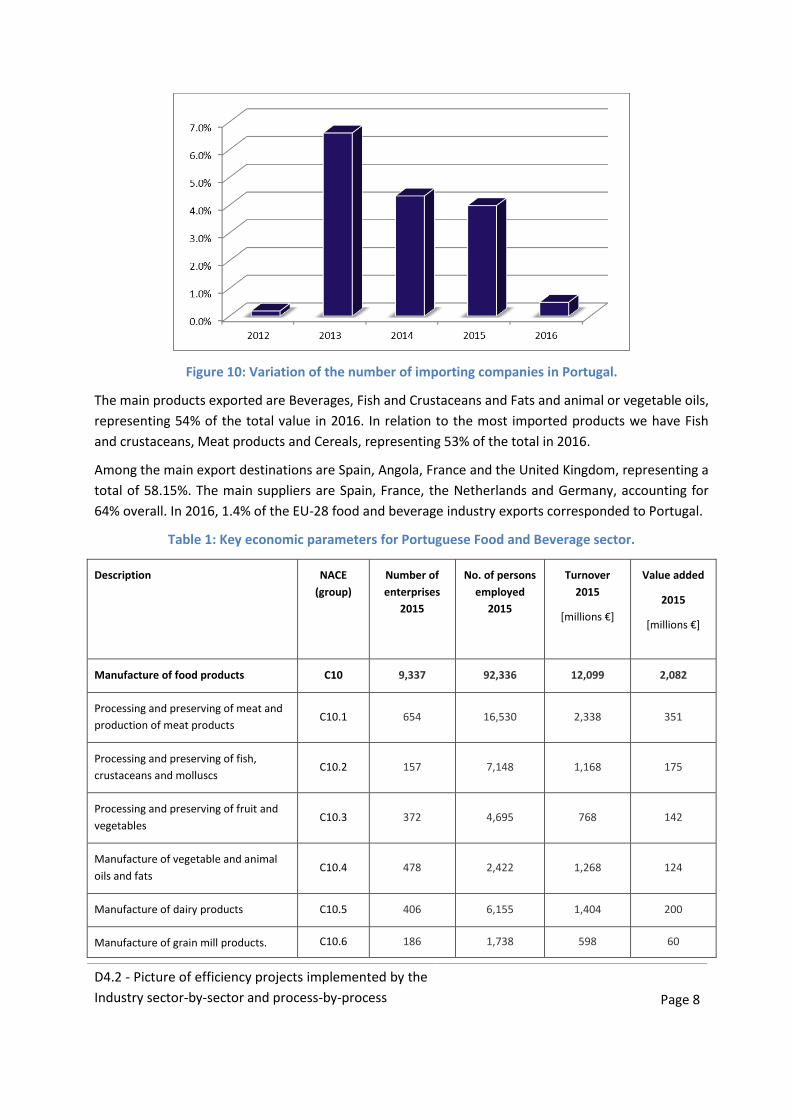
Regarding importing companies, they increased in 2013 and 2014 and in the previous years their
increase was less than 1%. The number of importing companies in 2016 was 2,519, according to FIPA
forecast.
D4.2 - Picture of efficiency projects implemented by the
Industry sector-by-sector and process-by-process
Page 8
Figure 10: Variation of the number of importing companies in Portugal.
The main products exported are Beverages, Fish and Crustaceans and Fats and animal or vegetable oils,
representing 54% of the total value in 2016. In relation to the most imported products we have Fish
and crustaceans, Meat products and Cereals, representing 53% of the total in 2016.
Among the main export destinations are Spain, Angola, France and the United Kingdom, representing a
total of 58.15%. The main suppliers are Spain, France, the Netherlands and Germany, accounting for
64% overall. In 2016, 1.4% of the EU-28 food and beverage industry exports corresponded to Portugal.
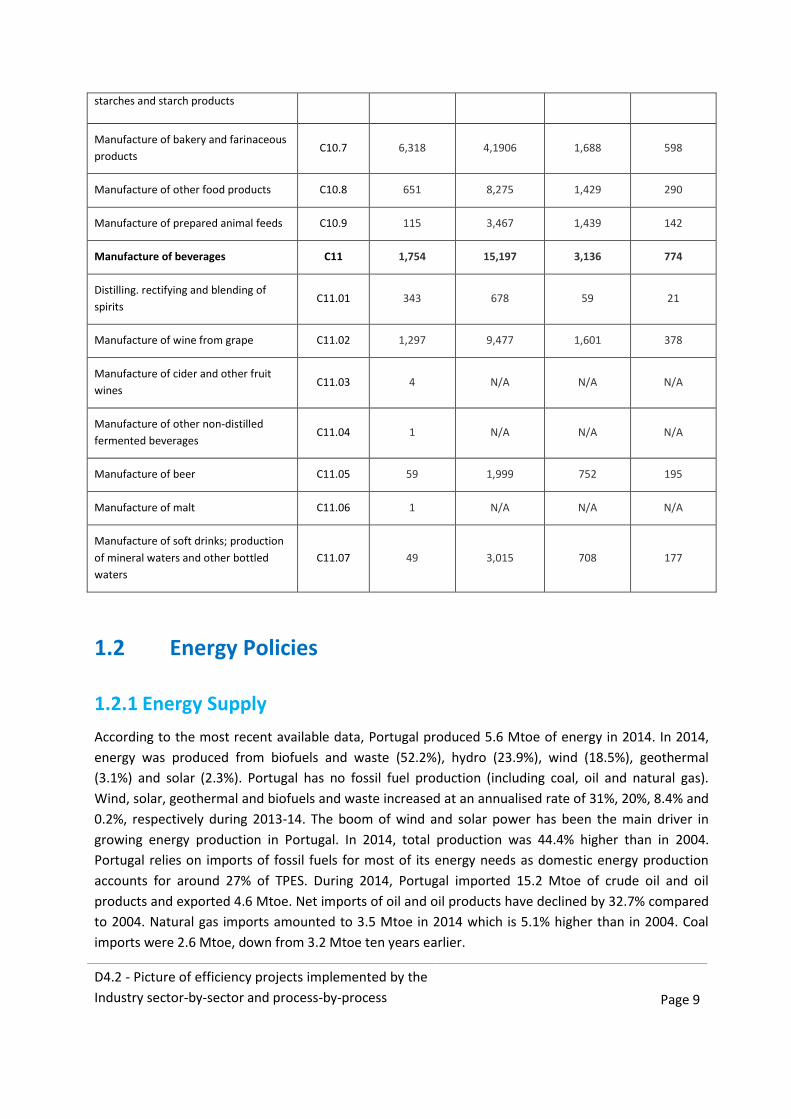
Table 1: Key economic parameters for Portuguese Food and Beverage sector.
Description NACE
(group)
Number of
enterprises
2015
No. of persons
employed
2015
Turnover
2015
[millions €]
Value added
2015
[millions €]
Manufacture of food products C10 9,337 92,336 12,099 2,082
Processing and preserving of meat and
production of meat products C10.1 654 16,530 2,338 351
Processing and preserving of fish,
crustaceans and molluscs C10.2 157 7,148 1,168 175
Processing and preserving of fruit and
vegetables C10.3 372 4,695 768 142
Manufacture of vegetable and animal
oils and fats C10.4 478 2,422 1,268 124
Manufacture of dairy products C10.5 406 6,155 1,404 200
Manufacture of grain mill products. C10.6 186 1,738 598 60
D4.2 - Picture of efficiency projects implemented by the
Industry sector-by-sector and process-by-process
Page 9
starches and starch products
Manufacture of bakery and farinaceous
products C10.7 6,318 4,1906 1,688 598
Manufacture of other food products C10.8 651 8,275 1,429 290
Manufacture of prepared animal feeds C10.9 115 3,467 1,439 142
Manufacture of beverages C11 1,754 15,197 3,136 774
Distilling. rectifying and blending of
spirits C11.01 343 678 59 21
Manufacture of wine from grape C11.02 1,297 9,477 1,601 378
Manufacture of cider and other fruit
wines C11.03 4 N/A N/A N/A
Manufacture of other non-distilled
fermented beverages C11.04 1 N/A N/A N/A
Manufacture of beer C11.05 59 1,999 752 195
Manufacture of malt C11.06 1 N/A N/A N/A
Manufacture of soft drinks; production
of mineral waters and other bottled
waters
C11.07 49 3,015 708 177
1.2 Energy Policies
1.2.1 Energy Supply
According to the most recent available data, Portugal produced 5.6 Mtoe of energy in 2014. In 2014,
energy was produced from biofuels and waste (52.2%), hydro (23.9%), wind (18.5%), geothermal
(3.1%) and solar (2.3%). Portugal has no fossil fuel production (including coal, oil and natural gas).
Wind, solar, geothermal and biofuels and waste increased at an annualised rate of 31%, 20%, 8.4% and
0.2%, respectively during 2013-14. The boom of wind and solar power has been the main driver in
growing energy production in Portugal. In 2014, total production was 44.4% higher than in 2004.
Portugal relies on imports of fossil fuels for most of its energy needs as domestic energy production
accounts for around 27% of TPES. During 2014, Portugal imported 15.2 Mtoe of crude oil and oil
products and exported 4.6 Mtoe. Net imports of oil and oil products have declined by 32.7% compared
to 2004. Natural gas imports amounted to 3.5 Mtoe in 2014 which is 5.1% higher than in 2004. Coal
imports were 2.6 Mtoe, down from 3.2 Mtoe ten years earlier.
D4.2 - Picture of efficiency projects implemented by the
Industry sector-by-sector and process-by-process
Page 10
1.2.2 Energy Demand
Industry and transport are the largest consuming sectors with 36.7% and 33.3% of TFC in 2013,
respectively. The residential sector represented 16.3% while the commercial and other services sector
(including agriculture and fisheries) had the smallest share of 13.7%. Over the decade to 2013, the
industry sector cut consumption by 26.7%, with its share in TFC falling from 40.6% in 2003.
1.2.3 Final Energy Consumption
Industry is the largest consuming sector in Portugal, with final consumption of 5.9 Mtoe in 2013 or
36.7% of TFC. It is also the sector with the fastest decline in energy demand, down by 26.7% compared
to 2003. Most of the decline, namely 21%, has come since 2008.
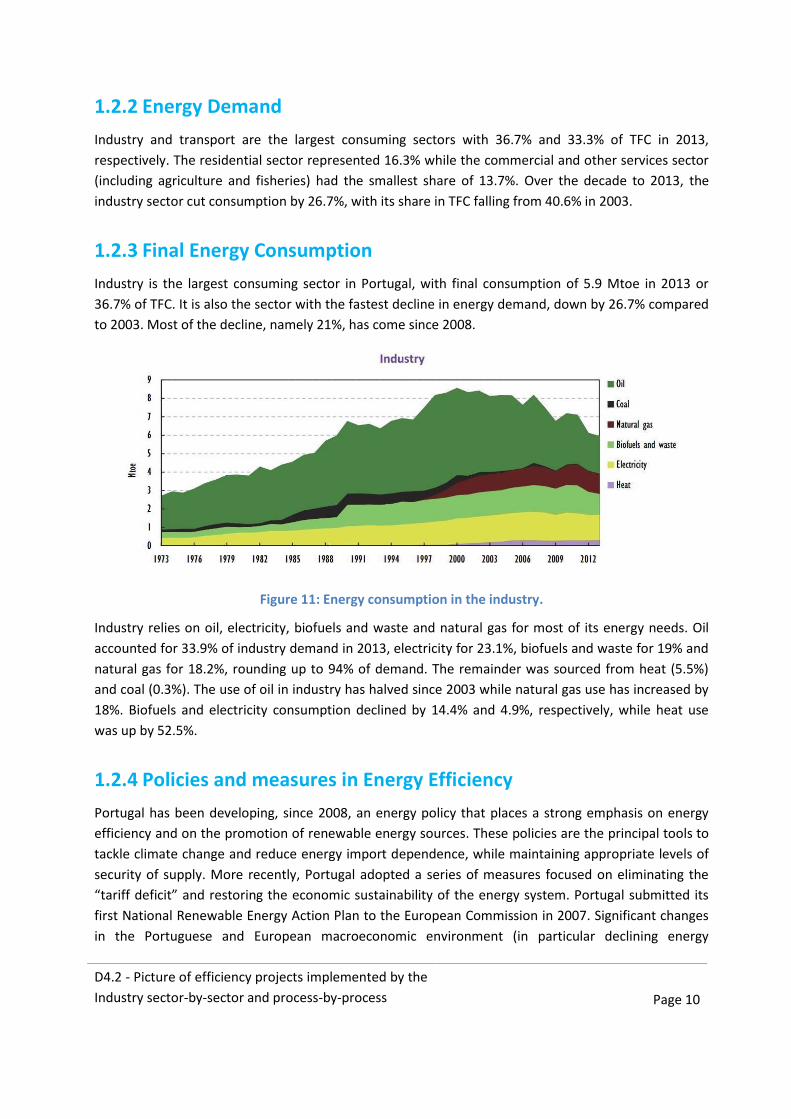
Figure 11: Energy consumption in the industry.
Industry relies on oil, electricity, biofuels and waste and natural gas for most of its energy needs. Oil
accounted for 33.9% of industry demand in 2013, electricity for 23.1%, biofuels and waste for 19% and
natural gas for 18.2%, rounding up to 94% of demand. The remainder was sourced from heat (5.5%)
and coal (0.3%). The use of oil in industry has halved since 2003 while natural gas use has increased by
18%. Biofuels and electricity consumption declined by 14.4% and 4.9%, respectively, while heat use
was up by 52.5%.
1.2.4 Policies and measures in Energy Efficiency
Portugal has been developing, since 2008, an energy policy that places a strong emphasis on energy
efficiency and on the promotion of renewable energy sources. These policies are the principal tools to
tackle climate change and reduce energy import dependence, while maintaining appropriate levels of
security of supply. More recently, Portugal adopted a series of measures focused on eliminating the
“tariff deficit” and restoring the economic sustainability of the energy system. Portugal submitted its
first National Renewable Energy Action Plan to the European Commission in 2007. Significant changes
in the Portuguese and European macroeconomic environment (in particular declining energy

D4.2 - Picture of efficiency projects implemented by the
Industry sector-by-sector and process-by-process
Page 11
consumption and funding constraints) and the need to review the National Energy Efficiency Action
Plan, imposed by the EU Energy Efficiency Directive, resulted in a review of energy efficiency and
renewable energy programmes.
The National Energy Strategy for 2020 (ENE 2020) established a goal of reducing final energy
consumption by 20% by 2020. Subsequently, the government defined a more ambitious goal,
corresponding to a 25% reduction in primary energy consumption (30% in the public sector) by 2020.
1.2.5 Funding mechanisms
The Energy Efficiency Fund (EEF) is a financial instrument with the following objectives: funding
programmes and measures identified in the NEEAP, encouraging energy efficiency on the part of
citizens and businesses, supporting energy efficiency projects and promoting behavioural change. The
EEF, by means of specific calls, supports energy efficiency projects in sectors such as transport,
buildings, services, industry and public services. The EEF also supports project not covered by the
NEEAP but which demonstrably contribute to energy efficiency.
1.2.6 Energy use in industry
A number of measures have been implemented to reduce consumption of energy in industry and
services. Among the most significant of these is the Intensive Energy Management Consumption
System (SGCIE). The SGCIE is one of the measures integrated in the NEEAP that aims to promote
energy efficiency and the monitoring of energy consumption in energy-intensive installations
consuming more than 500 toe per year. The SGCIE requires these energy-intensive installations to
periodically conduct energy audits in order to determine energy consumption and promote greater
energy efficiency, including the use of renewable energy sources.
Table 2: Energy use in industry in Portugal.
Year Manufacturing
consumption
[PJ]
Services
consumption
[PJ]
Other industries*
consumption [PJ]
GDP PPP**
[billion USD]
Manufacturing
VA**
[billion USD]
Services
VA**
[billion USD]
2000 245 54 49 222 27 130
2013 183 69 28 222 27 148
D4.2 - Picture of efficiency projects implemented by the
Industry sector-by-sector and process-by-process
Page 12
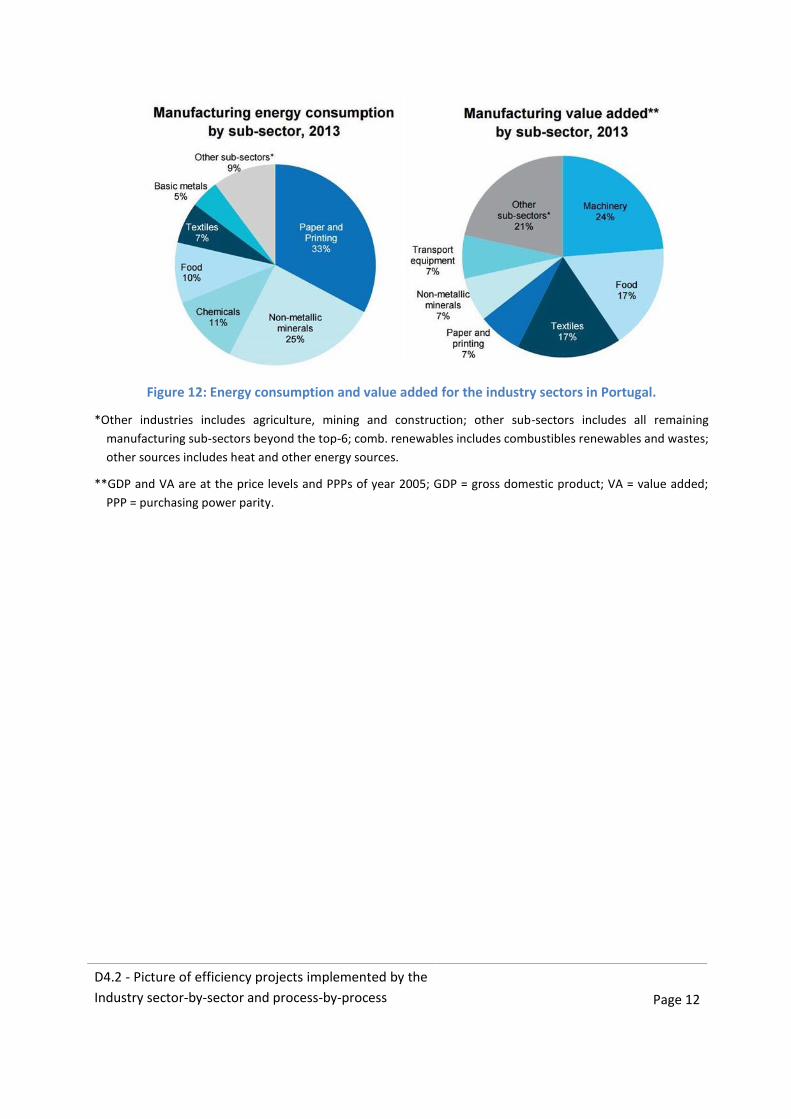
Figure 12: Energy consumption and value added for the industry sectors in Portugal.
*Other industries includes agriculture, mining and construction; other sub-sectors includes all remaining
manufacturing sub-sectors beyond the top-6; comb. renewables includes combustibles renewables and wastes;
other sources includes heat and other energy sources.
**GDP and VA are at the price levels and PPPs of year 2005; GDP = gross domestic product; VA = value added;
PPP = purchasing power parity.
D4.2 - Picture of efficiency projects implemented by the
Industry sector-by-sector and process-by-process
Page 13
2 Turkey
2.1 Economic data
Dairy sector is one of the most important sub-sector in Turkey with a 14% share in agriculture. It
consists of 1,500 enterprises, 34 thousand employees and sales turnover around 3.2 billion €.
Production of milk and milk products have 1,6 billion TL added-value. On the other hand, meat and
meat products sector is considered one of the fastest growing sub-sector in global agriculture and
food. In Turkey, the red meat sector has 13% share within the food industry.
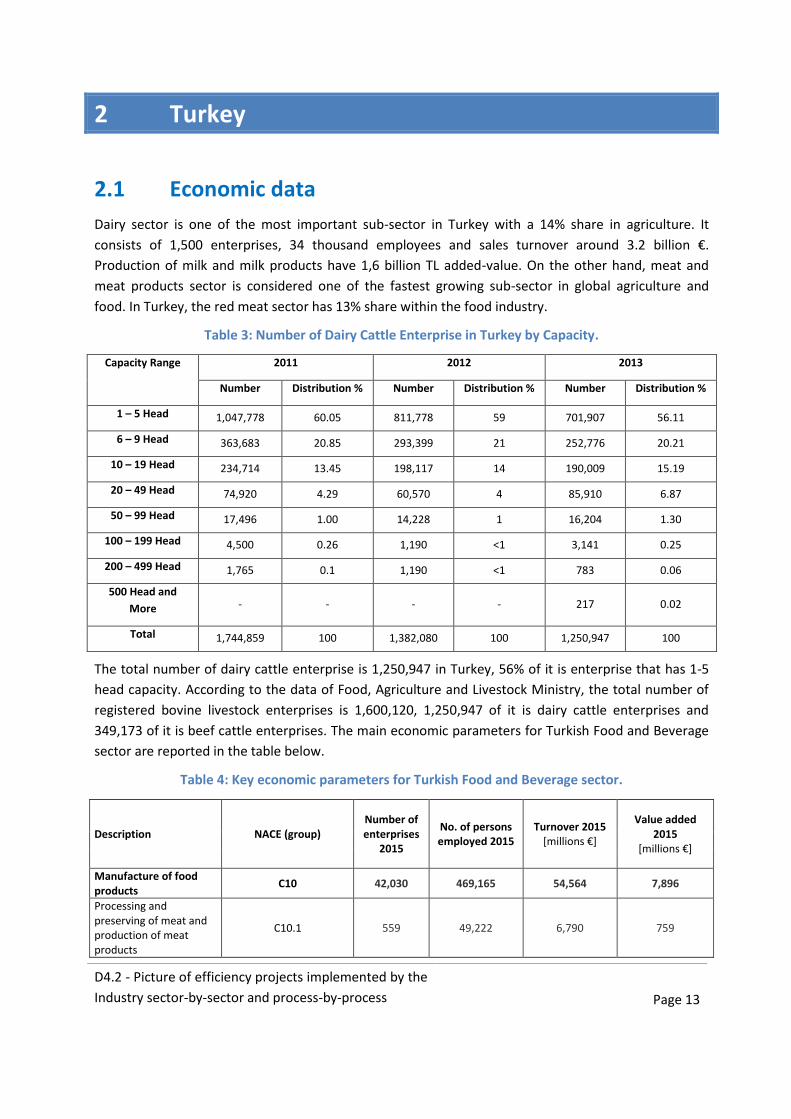
Table 3: Number of Dairy Cattle Enterprise in Turkey by Capacity.
Capacity Range 2011 2012 2013
Number Distribution % Number Distribution % Number Distribution %
1 – 5 Head 1,047,778 60.05 811,778 59 701,907 56.11
6 – 9 Head 363,683 20.85 293,399 21 252,776 20.21
10 – 19 Head 234,714 13.45 198,117 14 190,009 15.19
20 – 49 Head 74,920 4.29 60,570 4 85,910 6.87
50 – 99 Head 17,496 1.00 14,228 1 16,204 1.30
100 – 199 Head 4,500 0.26 1,190 <1 3,141 0.25
200 – 499 Head 1,765 0.1 1,190 <1 783 0.06
500 Head and
More - - - - 217 0.02
Total 1,744,859 100 1,382,080 100 1,250,947 100
The total number of dairy cattle enterprise is 1,250,947 in Turkey, 56% of it is enterprise that has 1-5
head capacity. According to the data of Food, Agriculture and Livestock Ministry, the total number of
registered bovine livestock enterprises is 1,600,120, 1,250,947 of it is dairy cattle enterprises and
349,173 of it is beef cattle enterprises. The main economic parameters for Turkish Food and Beverage
sector are reported in the table below.
Table 4: Key economic parameters for Turkish Food and Beverage sector.
Description NACE (group) Number of enterprises
2015
No. of persons employed 2015
Turnover 2015 [millions €]
Value added 2015
[millions €]
Manufacture of food products
C10 42,030 469,165 54,564 7,896
Processing and preserving of meat and production of meat products
C10.1 559 49,222 6,790 759
D4.2 - Picture of efficiency projects implemented by the
Industry sector-by-sector and process-by-process
Page 14
Processing and preserving of fish, crustaceans and molluscs
C10.2 117 7,299 828 188
Processing and preserving of fruit and vegetables
C10.3 1,730 59,412 10,259 1,158
Manufacture of vegetable and animal oils and fats
C10.4 1,140 15,633 5,652 486
Manufacture of dairy products
C10.5 1,533 41,040 6,330 754
Manufacture of grain mill products. starches and starch products
C10.6 3,143 24,466 5,890 499
Manufacture of bakery and farinaceous products
C10.7 31,406 186,101 6,811 1,611
Manufacture of other food products
C10.8 1,995 75,473 9,126 2,117
Manufacture of prepared animal feeds
C10.9 407 10,519 2,878 322
Manufacture of beverages
C11 499 16,214 2,911 634
Distilling. rectifying and blending of spirits
C11.01 11 N/A 150 34
Manufacture of wine from grape
C11.02 143 1,706 N/A N/A
Manufacture of cider and other fruit wines
C11.03 N/A N/A N/A N/A
Manufacture of other non-distilled fermented beverages
C11.04 N/A N/A N/A N/A
Manufacture of beer C11.05 5 N/A N/A N/A
Manufacture of malt C11.06 N/A N/A N/A N/A
Manufacture of soft drinks; production of mineral waters and other bottled waters
C11.07 340 12,458 2,201 418
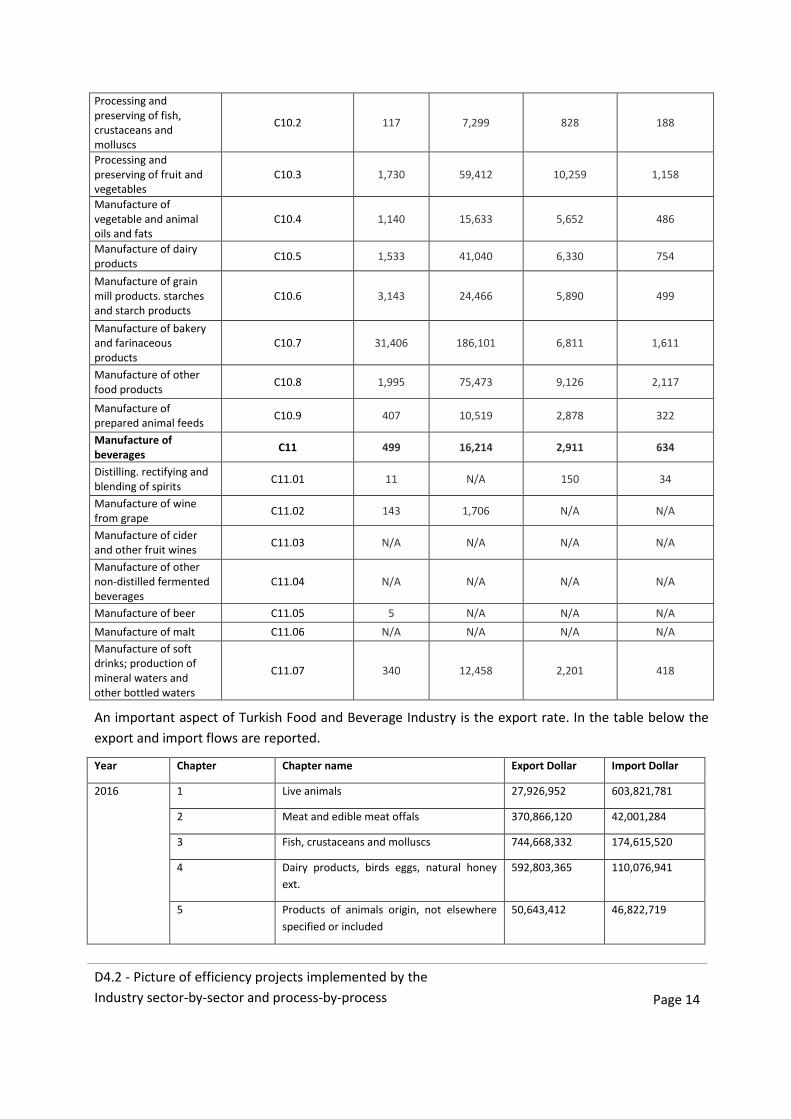
An important aspect of Turkish Food and Beverage Industry is the export rate. In the table below the
export and import flows are reported.
Year Chapter Chapter name Export Dollar Import Dollar
2016 1 Live animals 27,926,952 603,821,781
2 Meat and edible meat offals 370,866,120 42,001,284
3 Fish, crustaceans and molluscs 744,668,332 174,615,520
4 Dairy products, birds eggs, natural honey
ext.
592,803,365 110,076,941
5 Products of animals origin, not elsewhere
specified or included
50,643,412 46,822,719
D4.2 - Picture of efficiency projects implemented by the
Industry sector-by-sector and process-by-process
Page 15
7 Edible vegetables and certain roots and
tubers
942,174,735 456,732,961
8 Edible fruits and nuts, peel of melons or
citrus fruits
3,873,122,590 540,768,349
9 Coffee, tea, mate and spices 195,890,506 215,998,008
10 Cereals 102,769,585 1,150,612,113
12 Oil seeds and oleaginous fruit, industrial
plants, straw and fodder
372,814,046 1,819,616,989
14 Vegetables plaiting metarials, vegetable
products
17,742,247 10,909,835
15 Animals and vegetable fats and oils and
their cleavage products
1,045,239,934 1,753,046,898
17 Sugar and sugar confectionery 527,501,031 257,161,050
18 Cocoa and cocoa preparations 476,436,651 551,467,640
22 Beverages, spirits and vinegar 290,617,458 249,462,796
Total: 9,631,216,964 7,983,114,884
2017 1 Live animals 2,083,214 37,725,876
2 Meat and edible meat offals 32,524,466 336,852
3 Fish, crustaceans and molluscs 74,529,365 11,335,455
4 Dairy products, birds eggs, natural honey
ext.
56,369,094 7,465,836
5 Products of animals origin, not elsewhere
specified or included
2,922,637 5,133,729
7 Edible vegetables and certain roots and
tubers
98,210,078 39,865,219
8 Edible fruits and nuts, peel of melons or
citrus fruits
322,205,812 46,561,036
9 Coffee, tea, mate and spices 14,356,700 31,360,129
10 Cereals 10,278,064 75,348,072
12 Oil seeds and oleaginous fruit, industrial
plants, straw and fodder
24,429,327 118,592,164
14 Vegetables plaiting metarials, vegetable
products
2,625,506 442,431
15 Animals and vegetable fats and oils and
their cleavage products
97,236,815 150,083,102
17 Sugar and sugar confectionery 43,544,419 21,246,498
18 Cocoa and cocoa preparations 44,470,679 53,734,285
22 Beverages, spirits and vinegar 15,940,690 16,164,578
D4.2 - Picture of efficiency projects implemented by the
Industry sector-by-sector and process-by-process
Page 16
Total: 841,726,866 615,395,262
According to the available data, produced with the cooperation of the Turkish Statistical Institute and
the Ministry of Customs and Trade, in January 2017 exports were 11 billion 278 million dollars with a
18.1% increase and imports were 15 billion 586 million dollars with a 15.9% increase compared with
January 2016.
2.2 Energy statistics
With a rapidly growing economy, Turkey has become one of the fastest growing energy markets in the
world. Turkey has been experiencing rapid demand growth in all segments of the energy sector for
decades. Over the last decade, Turkey has been the second country, after China, in terms of natural gas
and electricity demand growth. Projections show that demand growth trend will continue.
The limits of Turkey’s domestic energy sources in light of its growing energy demand have resulted in
dependency on energy imports, primarily of oil and gas. At present, around 25% of the total energy
demand is being met by domestic resources, while the rest is being provided from a diversified
portfolio of imports.
The primary aim of Turkey is to realize its own energy security. To this end, Turkey aims to
diversify its energy supply routes and source countries,
increase the share of renewables and include the nuclear in its energy mix,
take significant steps to increase energy efficiency,
contribute to Europe’s energy security.
The total primary energy demand is estimated to reach 218 Mtoe by 2023 from the current level of 125
Mtoe. Currently, primary energy demand is met by natural gas (35%), coal (28.5%), oil (27%), hydro
(7%) and other renewables (2.5%).)
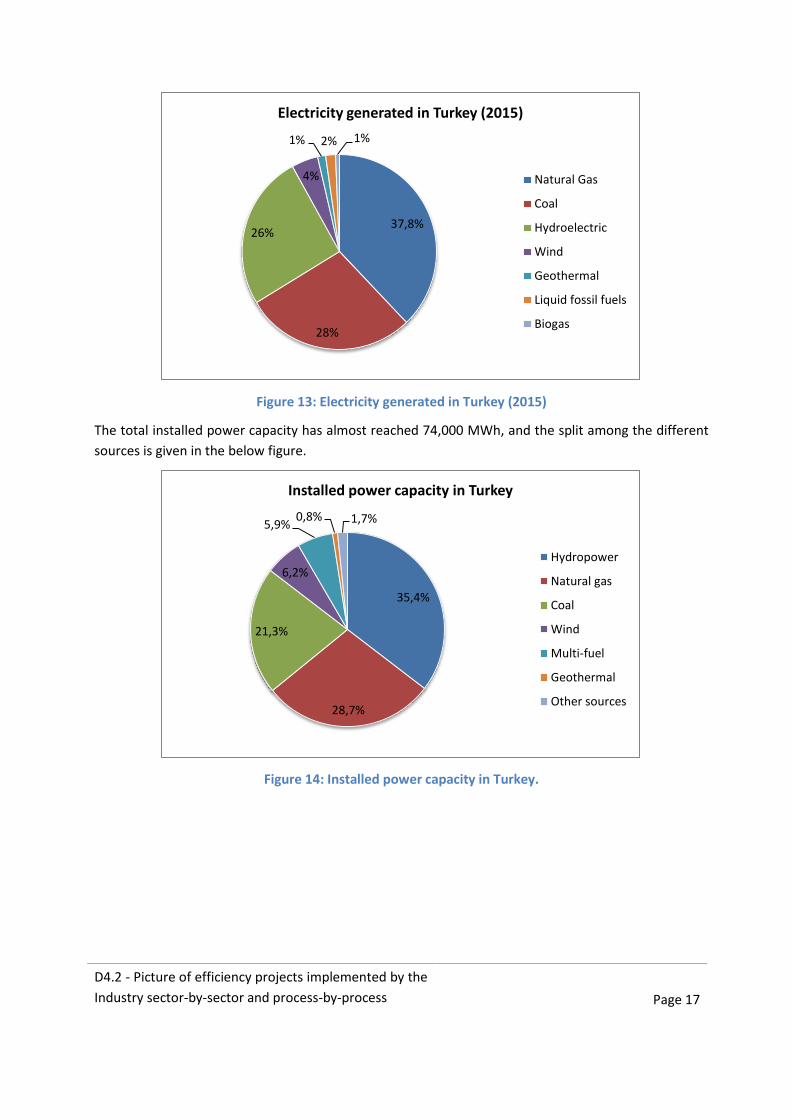
2.2.1 Energy consumption
Turkish electric energy gross consumption in Turkey increased by 3.6% to 257.2 billion kWh in 2014
(Turkish gross production + import + export). In 2015, it increased by 3.3% to 265.7 billion kWh in 2015.
The split among different sources is given below:
D4.2 - Picture of efficiency projects implemented by the
Industry sector-by-sector and process-by-process
Page 17
Figure 13: Electricity generated in Turkey (2015)
The total installed power capacity has almost reached 74,000 MWh, and the split among the different
sources is given in the below figure.
Figure 14: Installed power capacity in Turkey.
37,8%
28%
26%
4%
1% 2% 1%
Electricity generated in Turkey (2015)
Natural Gas
Coal
Hydroelectric
Wind
Geothermal
Liquid fossil fuels
Biogas
35,4%
28,7%
21,3%
6,2%
5,9% 0,8% 1,7%
Installed power capacity in Turkey
Hydropower
Natural gas
Coal
Wind
Multi-fuel
Geothermal
Other sources
D4.2 - Picture of efficiency projects implemented by the
Industry sector-by-sector and process-by-process
Page 18
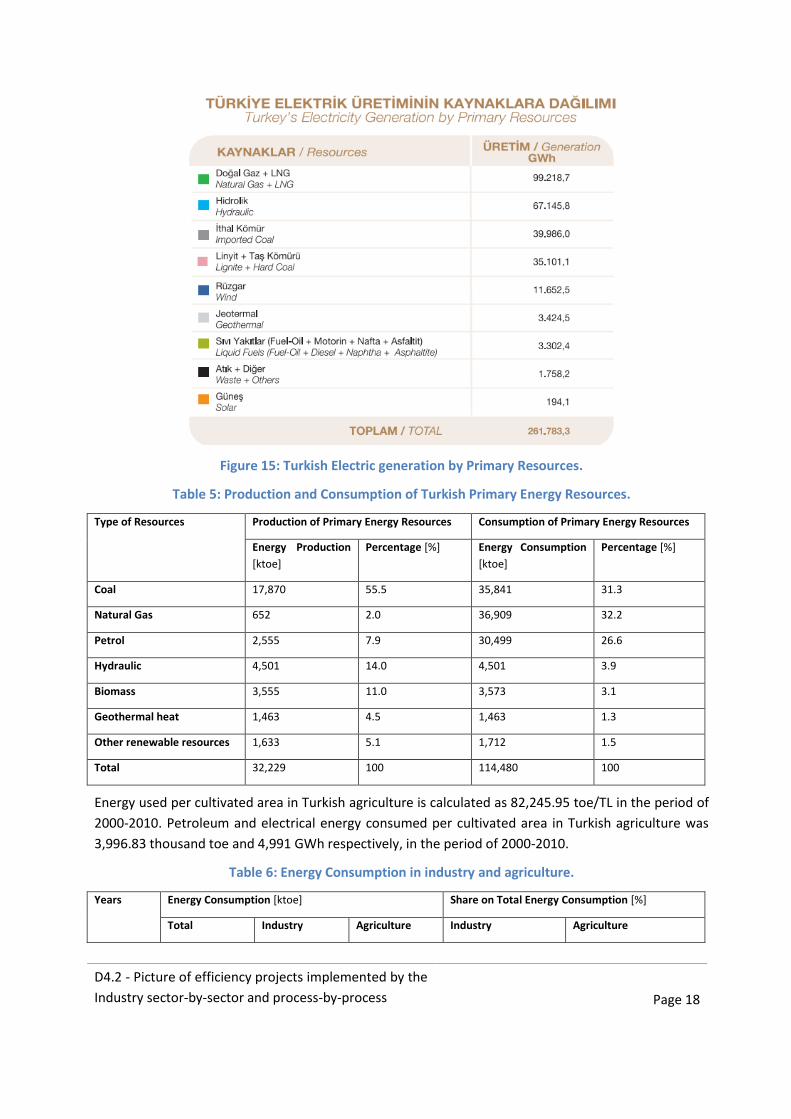
Figure 15: Turkish Electric generation by Primary Resources.
Table 5: Production and Consumption of Turkish Primary Energy Resources.
Type of Resources Production of Primary Energy Resources Consumption of Primary Energy Resources
Energy Production
[ktoe]
Percentage [%] Energy Consumption
[ktoe]
Percentage [%]
Coal 17,870 55.5 35,841 31.3
Natural Gas 652 2.0 36,909 32.2
Petrol 2,555 7.9 30,499 26.6
Hydraulic 4,501 14.0 4,501 3.9
Biomass 3,555 11.0 3,573 3.1
Geothermal heat 1,463 4.5 1,463 1.3
Other renewable resources 1,633 5.1 1,712 1.5
Total 32,229 100 114,480 100
Energy used per cultivated area in Turkish agriculture is calculated as 82,245.95 toe/TL in the period of
2000-2010. Petroleum and electrical energy consumed per cultivated area in Turkish agriculture was
3,996.83 thousand toe and 4,991 GWh respectively, in the period of 2000-2010.
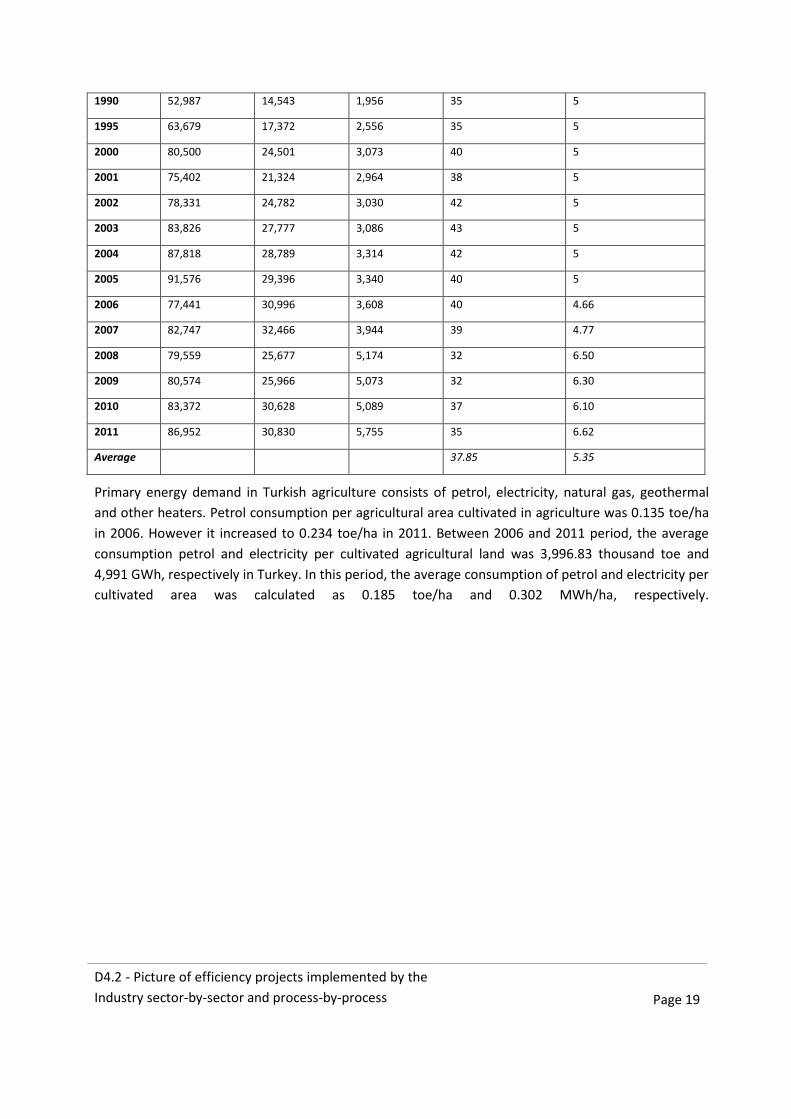
Table 6: Energy Consumption in industry and agriculture.
Years Energy Consumption [ktoe] Share on Total Energy Consumption [%]
Total Industry Agriculture Industry Agriculture
D4.2 - Picture of efficiency projects implemented by the
Industry sector-by-sector and process-by-process
Page 19
1990 52,987 14,543 1,956 35 5
1995 63,679 17,372 2,556 35 5
2000 80,500 24,501 3,073 40 5
2001 75,402 21,324 2,964 38 5
2002 78,331 24,782 3,030 42 5
2003 83,826 27,777 3,086 43 5
2004 87,818 28,789 3,314 42 5
2005 91,576 29,396 3,340 40 5
2006 77,441 30,996 3,608 40 4.66
2007 82,747 32,466 3,944 39 4.77
2008 79,559 25,677 5,174 32 6.50
2009 80,574 25,966 5,073 32 6.30
2010 83,372 30,628 5,089 37 6.10
2011 86,952 30,830 5,755 35 6.62
Average 37.85 5.35
Primary energy demand in Turkish agriculture consists of petrol, electricity, natural gas, geothermal
and other heaters. Petrol consumption per agricultural area cultivated in agriculture was 0.135 toe/ha
in 2006. However it increased to 0.234 toe/ha in 2011. Between 2006 and 2011 period, the average
consumption petrol and electricity per cultivated agricultural land was 3,996.83 thousand toe and
4,991 GWh, respectively in Turkey. In this period, the average consumption of petrol and electricity per
cultivated area was calculated as 0.185 toe/ha and 0.302 MWh/ha, respectively.
D4.2 - Picture of efficiency projects implemented by the
Industry sector-by-sector and process-by-process
Page 20
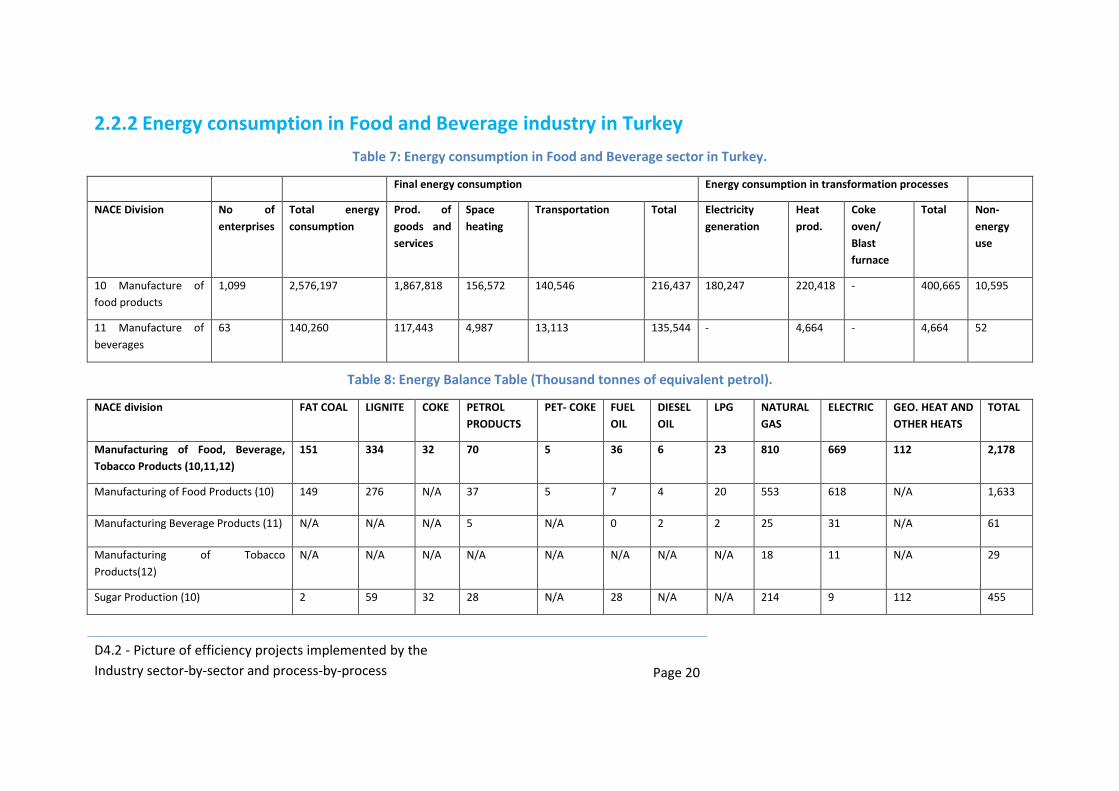
2.2.2 Energy consumption in Food and Beverage industry in Turkey
Table 7: Energy consumption in Food and Beverage sector in Turkey.
Final energy consumption Energy consumption in transformation processes
NACE Division No of
enterprises
Total energy
consumption
Prod. of
goods and
services
Space
heating
Transportation Total Electricity
generation
Heat
prod.
Coke
oven/
Blast
furnace
Total Non-
energy
use
10 Manufacture of
food products
1,099 2,576,197 1,867,818 156,572 140,546 216,437 180,247 220,418 - 400,665 10,595
11 Manufacture of
beverages
63 140,260 117,443 4,987 13,113 135,544 - 4,664 - 4,664 52
Table 8: Energy Balance Table (Thousand tonnes of equivalent petrol).
NACE division FAT COAL LIGNITE COKE PETROL
PRODUCTS
PET- COKE FUEL
OIL
DIESEL
OIL
LPG NATURAL
GAS
ELECTRIC GEO. HEAT AND
OTHER HEATS
TOTAL
Manufacturing of Food, Beverage,
Tobacco Products (10,11,12)
151 334 32 70 5 36 6 23 810 669 112 2,178
Manufacturing of Food Products (10) 149 276 N/A 37 5 7 4 20 553 618 N/A 1,633
Manufacturing Beverage Products (11) N/A N/A N/A 5 N/A 0 2 2 25 31 N/A 61
Manufacturing of Tobacco
Products(12)
N/A N/A N/A N/A N/A N/A N/A N/A 18 11 N/A 29
Sugar Production (10) 2 59 32 28 N/A 28 N/A N/A 214 9 112 455
D4.2 - Picture of efficiency projects implemented by the
Industry sector-by-sector and process-by-process
Page 21
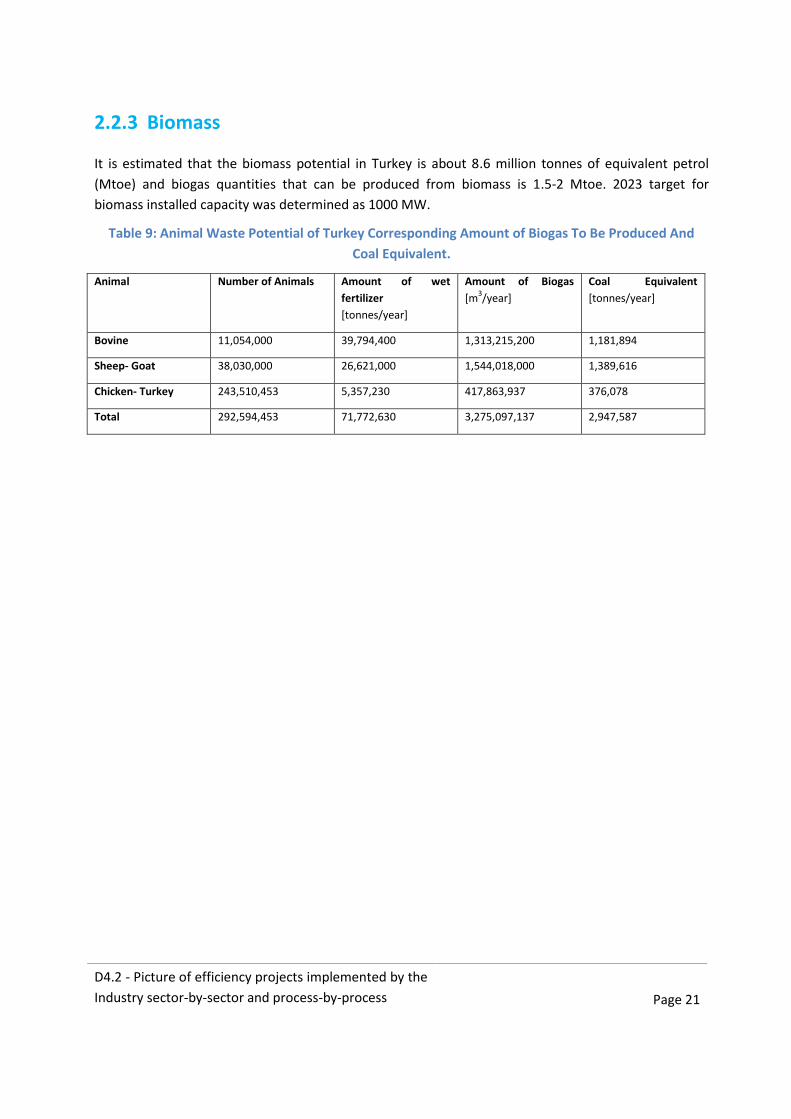
2.2.3 Biomass
It is estimated that the biomass potential in Turkey is about 8.6 million tonnes of equivalent petrol
(Mtoe) and biogas quantities that can be produced from biomass is 1.5-2 Mtoe. 2023 target for
biomass installed capacity was determined as 1000 MW.
Table 9: Animal Waste Potential of Turkey Corresponding Amount of Biogas To Be Produced And
Coal Equivalent.
Animal Number of Animals Amount of wet
fertilizer
[tonnes/year]
Amount of Biogas
[m3/year]
Coal Equivalent
[tonnes/year]
Bovine 11,054,000 39,794,400 1,313,215,200 1,181,894
Sheep- Goat 38,030,000 26,621,000 1,544,018,000 1,389,616
Chicken- Turkey 243,510,453 5,357,230 417,863,937 376,078
Total 292,594,453 71,772,630 3,275,097,137 2,947,587
D4.2 - Picture of efficiency projects implemented by the
Industry sector-by-sector and process-by-process
Page 22
3 Czech Republic
The food and beverage sector is characterised by NACE Codes 10 (Manufacture of food products) and
11 (Manufacture of beverages). In many official statistics, also NACE Code 12 (Manufacture of tobacco
products) is included in the same sector.
3.1 Sectoral organisation
The entire food and drink sector including feed manufactures is in the Czech Republic represented by
the Potravinářská komora České republiky (FFDI, Federation of the Food and Drink Industries of the
Czech Republic). About 100 companies are direct members of the federation. In addition, 22 subsector
organisations are members of the federation and also 44 partners from food connected branches.
Asociace výrobců lahůdek (AVL) – delicatessen
Česká asociace barelových watercoolerů (ČABW) – water barrels
Českomoravská drůbežářská unie (ČDU) – poultry breeders, eggs
Českomoravský cukrovarnický spolek (ČMCS) – sugar
Českomoravský svaz mlékárenský (ČMSM) – dairy
Český svaz pivovarů a sladoven, (ČSPS) – brewery, malting
Český svaz zpracovatelů masa (ČSZM) – meat, charcuterie
Český škrobárenský svaz (ČŠS) – starch
Rybářské sdružení České republiky (RS ČR) – fish, aquaculture
Sdružení drůbežářských podniků (SDP) – poultry
Společenstvo mlynářů a pekařů ČR (SMP ČR) – mill and bakery products
Spolek pro komodity a krmiva (SKK) – feed processing and commodity storage
Svaz lihovarů České republiky (SL ČR) – spirit and biofuels
Svaz minerálních vod (SMV) – spring and mineral waters
Svaz pekařů a cukrářů v České republice, (SPC ČR) – bakery products
Svaz průmyslových mlýnů České republiky (SPM ČR) – mill products and pasta
Svaz vinařů České republiky (SV ČR) – wine
Svaz výrobců nealkoholických nápojů (SVNN) – soft drinks
Unie destilatérů (UD) – distillates

D4.2 - Picture of efficiency projects implemented by the
Industry sector-by-sector and process-by-process
Page 23
Unie výrobců a dovozců lihovin České republiky (UVDL ČR) – spirit drinks
Vinařská unie (VU) – wine
Zájmové sdružení právnických osob konzervárensko - lihovarského průmyslu (KOLI) – canned
products
In addition to these subsector organisations that are members of FFDI, there are some less important
subsector organisations, including edible oils and fats, tea and roasted coffee and ice creams.
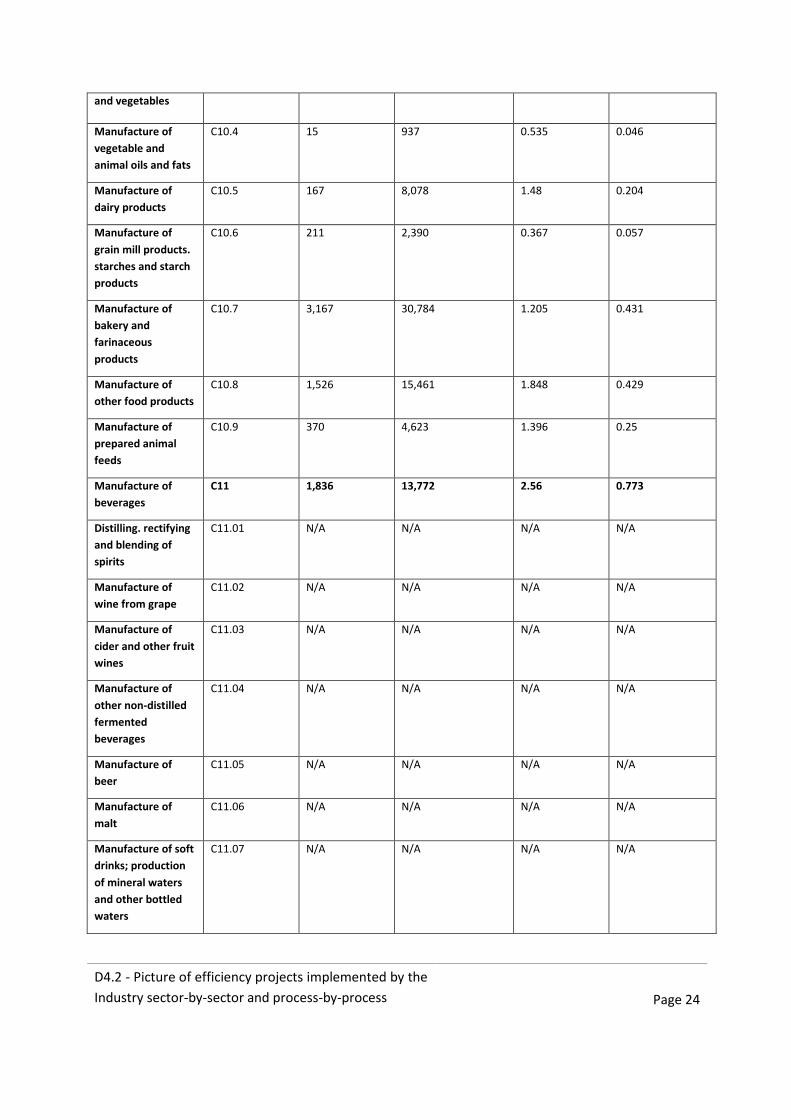
3.2 Economic indicators
In 2015, there were 9,286 companies in the Czech food and beverage industry, of which about 99%
companies are middle and small enterprises (less than 250 employees). A substantial part of these
small companies (42.5%) are active in the bread and bakery products subsector. Together these
companies employ about 99,896 persons directly. This is about 8.1% of the entire Czech industrial
sector. Indirectly, the food and beverage industry also results in hundreds thousand indirect jobs,
among others in commercial services, agriculture and the transport sector.
The total output of the sector was 14.07 billion € with a value added of 2.6 billion €. Compared to the
total output of all industrial sectors combined (143.88 billion €), the food and beverage sector makes
up 9.78% of the Czech industrial sector.
The companies in the sector imported for 5.6 billion € from abroad, while the total value of export was
4.44 billion €. Looking specifically at the agrifood sector, the most important products for the Czech
export are dairy (9.5%), tobacco (9.1%), cereals (8.3%) and drinks (8%). The four key countries for
exports (together 53.9% of total exports value) are Germany, the UK, France and Belgium.
Table 10: Key economic parameters for Czech Food and Beverage sector.
Description NACE (group) Number of
enterprises
2015
No. of persons
employed 2015
Turnover 2015
[mil €]
Value added
2015
[mil €]
Manufacture of
food products
C10 7,450 86,124 11.51 1.83
Processing and
preserving of meat
and production of
meat products
C10.1 1,829 20,416 2.12 0.347
Processing and
preserving of fish.
crustaceans and
molluscs
C10.2 20 756 0.074 0.014
Processing and
preserving of fruit
C10.3 145 2,679 0.229 0.053
D4.2 - Picture of efficiency projects implemented by the
Industry sector-by-sector and process-by-process
Page 24
and vegetables
Manufacture of
vegetable and
animal oils and fats
C10.4 15 937 0.535 0.046
Manufacture of
dairy products
C10.5 167 8,078 1.48 0.204
Manufacture of
grain mill products.
starches and starch
products
C10.6 211 2,390 0.367 0.057
Manufacture of
bakery and
farinaceous
products
C10.7 3,167 30,784 1.205 0.431
Manufacture of
other food products
C10.8 1,526 15,461 1.848 0.429
Manufacture of
prepared animal
feeds
C10.9 370 4,623 1.396 0.25
Manufacture of
beverages
C11 1,836 13,772 2.56 0.773
Distilling. rectifying
and blending of
spirits
C11.01 N/A N/A N/A N/A
Manufacture of
wine from grape
C11.02 N/A N/A N/A N/A
Manufacture of
cider and other fruit
wines
C11.03 N/A N/A N/A N/A
Manufacture of
other non-distilled
fermented
beverages
C11.04 N/A N/A N/A N/A
Manufacture of
beer
C11.05 N/A N/A N/A N/A
Manufacture of
malt
C11.06 N/A N/A N/A N/A
Manufacture of soft
drinks; production
of mineral waters
and other bottled
waters
C11.07 N/A N/A N/A N/A
D4.2 - Picture of efficiency projects implemented by the
Industry sector-by-sector and process-by-process
Page 25
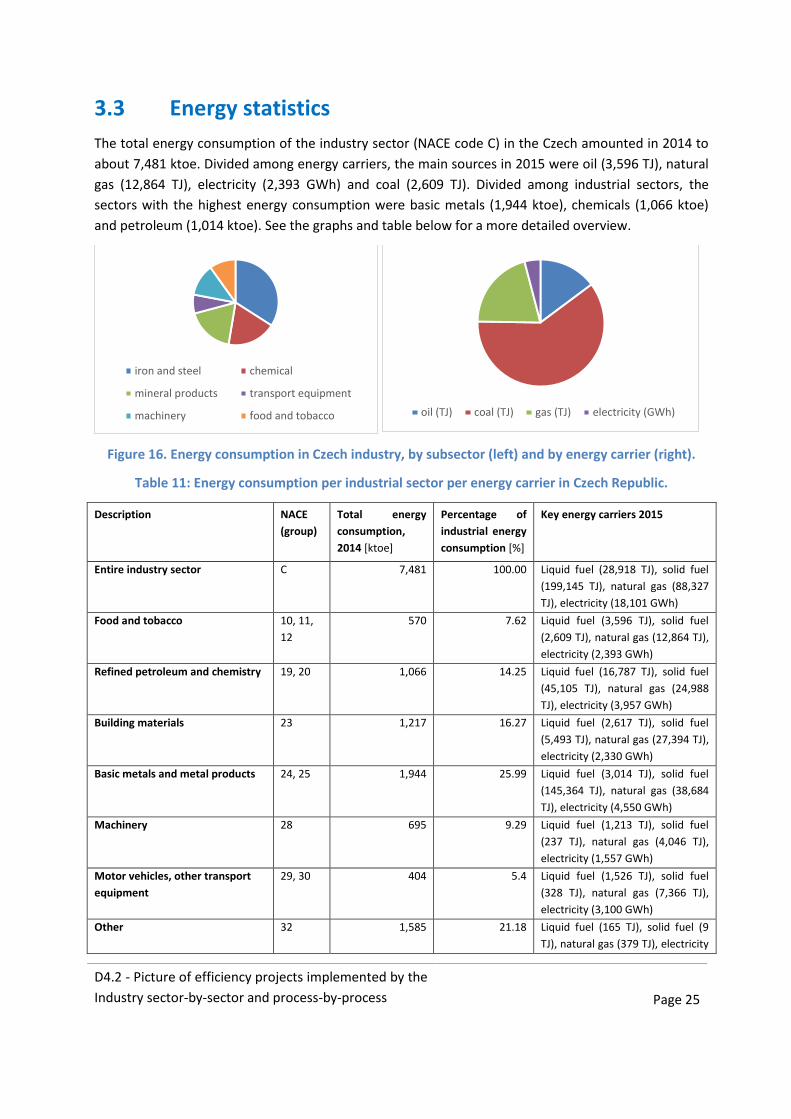
3.3 Energy statistics
The total energy consumption of the industry sector (NACE code C) in the Czech amounted in 2014 to
about 7,481 ktoe. Divided among energy carriers, the main sources in 2015 were oil (3,596 TJ), natural
gas (12,864 TJ), electricity (2,393 GWh) and coal (2,609 TJ). Divided among industrial sectors, the
sectors with the highest energy consumption were basic metals (1,944 ktoe), chemicals (1,066 ktoe)
and petroleum (1,014 ktoe). See the graphs and table below for a more detailed overview.
Figure 16. Energy consumption in Czech industry, by subsector (left) and by energy carrier (right).
Table 11: Energy consumption per industrial sector per energy carrier in Czech Republic.
Description NACE
(group)
Total energy
consumption,
2014 [ktoe]
Percentage of
industrial energy
consumption [%]
Key energy carriers 2015
Entire industry sector C 7,481 100.00 Liquid fuel (28,918 TJ), solid fuel
(199,145 TJ), natural gas (88,327
TJ), electricity (18,101 GWh)
Food and tobacco 10, 11,
12
570 7.62 Liquid fuel (3,596 TJ), solid fuel
(2,609 TJ), natural gas (12,864 TJ),
electricity (2,393 GWh)
Refined petroleum and chemistry 19, 20 1,066 14.25 Liquid fuel (16,787 TJ), solid fuel
(45,105 TJ), natural gas (24,988
TJ), electricity (3,957 GWh)
Building materials 23 1,217 16.27 Liquid fuel (2,617 TJ), solid fuel
(5,493 TJ), natural gas (27,394 TJ),
electricity (2,330 GWh)
Basic metals and metal products 24, 25 1,944 25.99 Liquid fuel (3,014 TJ), solid fuel
(145,364 TJ), natural gas (38,684
TJ), electricity (4,550 GWh)
Machinery 28 695 9.29 Liquid fuel (1,213 TJ), solid fuel
(237 TJ), natural gas (4,046 TJ),
electricity (1,557 GWh)
Motor vehicles, other transport
equipment
29, 30 404 5.4 Liquid fuel (1,526 TJ), solid fuel
(328 TJ), natural gas (7,366 TJ),
electricity (3,100 GWh)
Other 32 1,585 21.18 Liquid fuel (165 TJ), solid fuel (9
TJ), natural gas (379 TJ), electricity
iron and steel chemical
mineral products transport equipment
machinery food and tobacco oil (TJ) coal (TJ) gas (TJ) electricity (GWh)

D4.2 - Picture of efficiency projects implemented by the
Industry sector-by-sector and process-by-process
Page 26
(214 GWh)
3.3.1 Food industry
For 2015, the total energy use of the food manufacturing industry (NACE C10) and for the beverage
manufacturing industry (NACE C11) and tobacco (NACE C12) is estimated at 570 ktoe.
Based on 2014 data, the total energy use of the food and beverage industry (including tobacco
production) accounts for about 7.6% of the energy use by Czech industries.
3.3.2 Energy prices
For industrial consumers, the natural gas prices in 2016 in the Czech Republic were 29.555 €/MWh
(excluding VAT but including taxes and levies that are not recoverable).
The electricity price for industrial consumers in 2016 in the Czech Republic amounted to 87.925
€/MWh (excluding VAT but including taxes and levies that are not recoverable).
Looking at oil, there is specific information on the consumer prices of petroleum products by the end
of 2016. For petrol (Euro-super 95), the price wit taxes and duties was 1.11 € in the Czech Republic. For
automotive diesel, the price with taxes and duties was 1.08 €. For LPG motor fuel, the values for the
Czech were 0.49 €.

D4.2 - Picture of efficiency projects implemented by the
Industry sector-by-sector and process-by-process
Page 27
4 France
4.1 Global presentation and economic performances of
the sector
Exports are of major importance for the French food sector (especially for the beverages segment),
positively contributing to the French trade balance.
• Weaker bargaining power for food producers and processors
• Beverage subsector performs well due to exports
• The meat and dairy segments still face challenges
Turnover of the French agri-food industry amounted to 172 billion € in 2016. French food sector value
added growth is expected to increase 1.0% in 2017, followed by 1.6% in 2018. Growth has been steady
over the last couple of years, although at a lower pace than French GDP growth.
In the domestic market the margins of many food producers are negatively impacted by decreasing
producer prices (down 1.2% in 2016), the fierce price competition in the French retail segment and
contractual price-adjustment mechanisms. The on-going concentration process of retail chains has
further weakened the bargaining power of food producers and processors, who are at the same time in
competition with other European food businesses which in some cases have lower production costs.
Many French food manufacturers or processors try to increase their leverage through acquisitions or
by strengthening their brand image.
Exports are of major importance for the French food sector (especially for the wine, champagne and
spirits segment), positively contributing to the French trade balance. In 2016 the trade balance surplus
generated by beverage exports alone amounted to more than 11 billion €. While volumes of French
wine exports are decreasing since 2012 (down 2% in 2016), the value of exports continues to increase
since 2009 (up 7% in 2016). France remains the second-largest producer of wine worldwide behind
Italy.
Generally, French food businesses are highly dependent on bank finance and many companies have
high short-term debts to finance their working capital requirements. Banks are generally willing to lend
to food businesses. The profit outlook for most companies active in this industry remains stable.
The level of non-payment notifications and insolvencies in the food sector is rather low compared to
other industries and no substantial increase is expected in the coming months.
While our underwriting stance towards this sector remains generally relaxed, we are keeping a closer
eye on certain subsectors, especially meat and dairy, because of the challenging market conditions in
those segments. The French meat industry is composed mainly of small companies and even French
groups are quite small compared to their foreign competitors. Pressure on meat prices remains high,
D4.2 - Picture of efficiency projects implemented by the
Industry sector-by-sector and process-by-process
Page 28
affecting business margins. Exports of dairy products have been severely impacted by decreased global
demand.
Table 12: Key economic parameters for French Food and Beverage sector.
FRENCH FOOD PROCESSING INDUSTRY Year 2016
Number of companies 17,647
Number of employees 427,213
Turnover (billion €) 172
Export income (billion €) 44.2
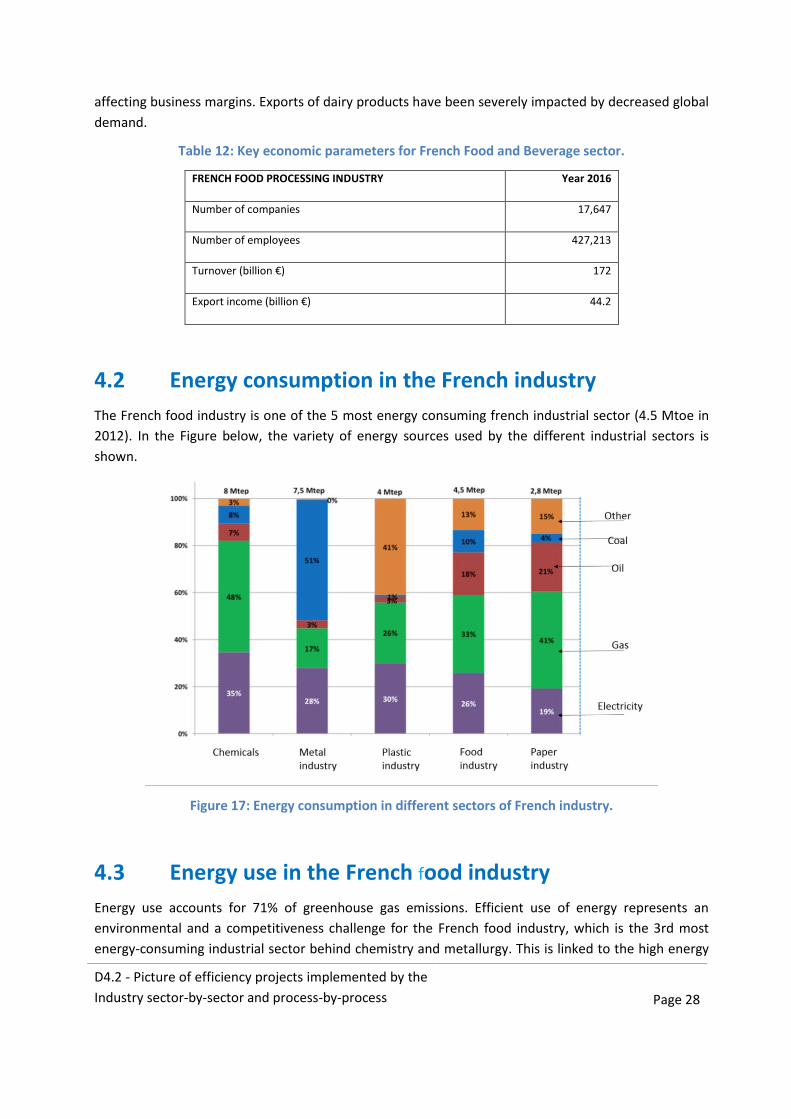
4.2 Energy consumption in the French industry
The French food industry is one of the 5 most energy consuming french industrial sector (4.5 Mtoe in
2012). In the Figure below, the variety of energy sources used by the different industrial sectors is
shown.
Figure 17: Energy consumption in different sectors of French industry.
4.3 Energy use in the French food industry
Energy use accounts for 71% of greenhouse gas emissions. Efficient use of energy represents an
environmental and a competitiveness challenge for the French food industry, which is the 3rd most
energy-consuming industrial sector behind chemistry and metallurgy. This is linked to the high energy
D4.2 - Picture of efficiency projects implemented by the
Industry sector-by-sector and process-by-process
Page 29
requirements of manufacturing processes and the safety requirements (wet processing, drying,
combustion, cold chain, etc.).
Energy represents on average the second item of cost of production behind the raw materials. Many
actions have been implemented by the food industries in order to efficiently use energy:
• Improve the energy efficiency of manufacturing processes,
• Recover energy and heat,
• Using less polluting fuels and renewable energy,
• Train and educate employees on energy savings.
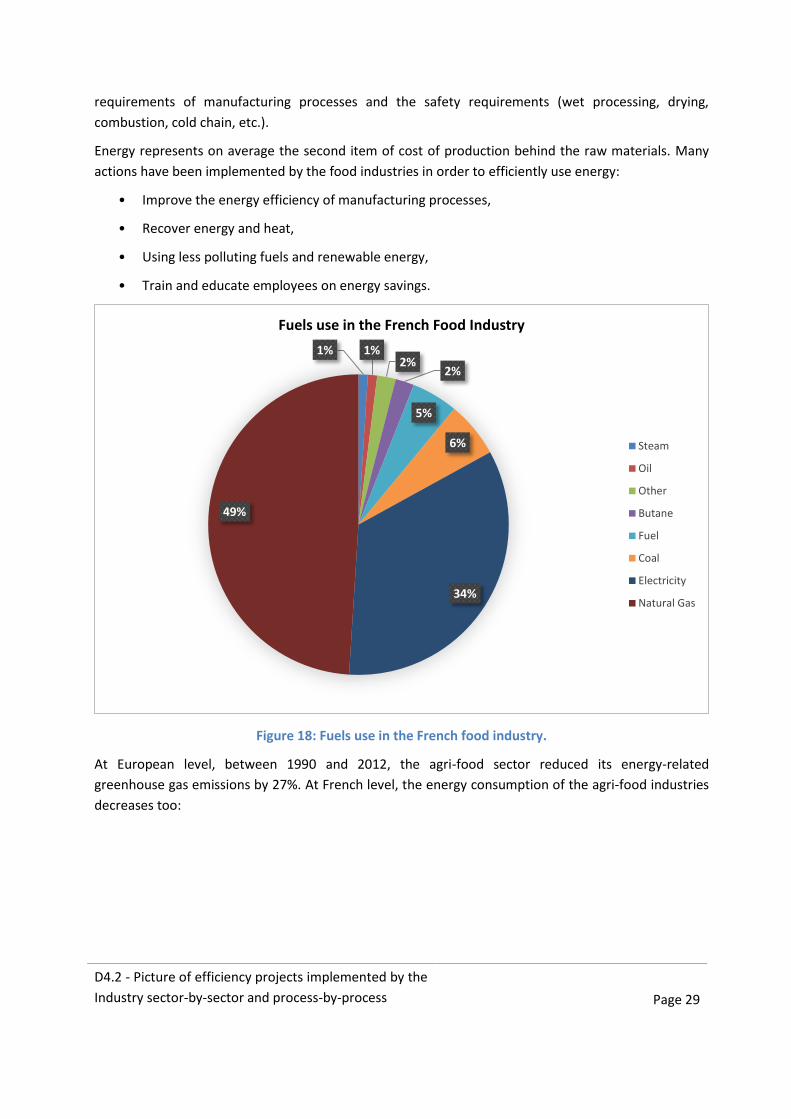
Figure 18: Fuels use in the French food industry.
At European level, between 1990 and 2012, the agri-food sector reduced its energy-related
greenhouse gas emissions by 27%. At French level, the energy consumption of the agri-food industries
decreases too:
1% 1% 2%
2%
5%
6%
34%
49%
Fuels use in the French Food Industry
Steam
Oil
Other
Butane
Fuel
Coal
Electricity
Natural Gas
D4.2 - Picture of efficiency projects implemented by the
Industry sector-by-sector and process-by-process
Page 30
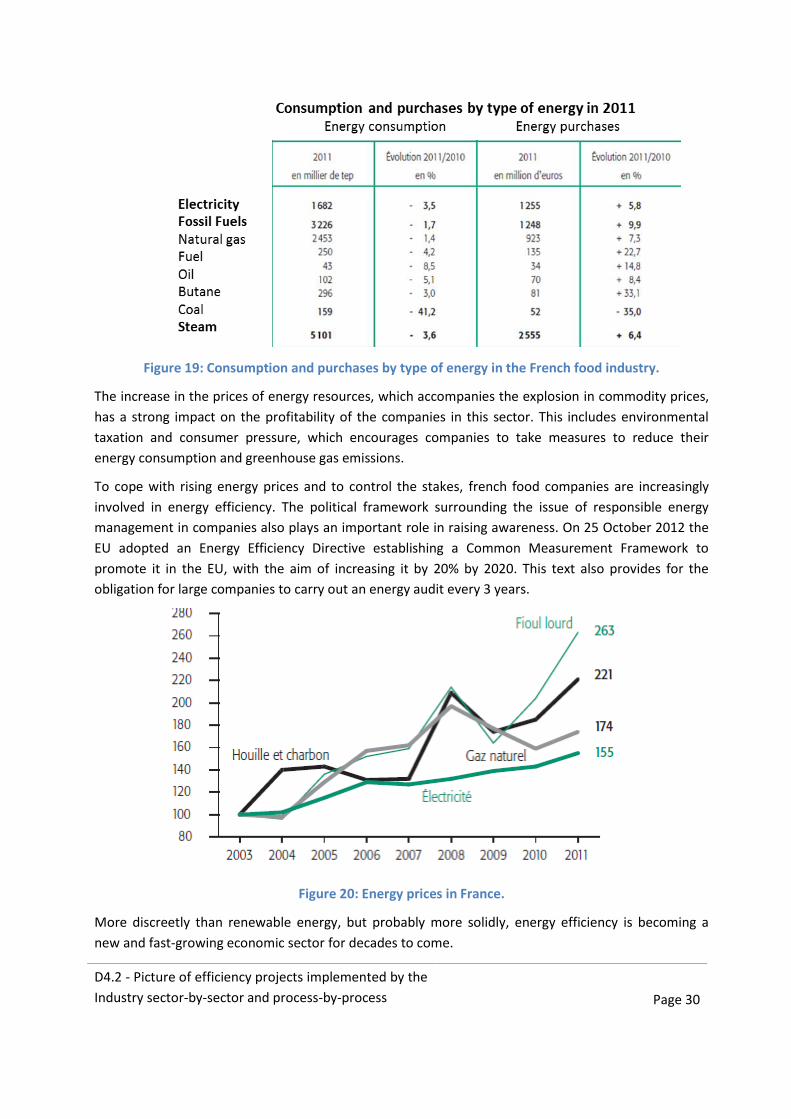
Figure 19: Consumption and purchases by type of energy in the French food industry.
The increase in the prices of energy resources, which accompanies the explosion in commodity prices,
has a strong impact on the profitability of the companies in this sector. This includes environmental
taxation and consumer pressure, which encourages companies to take measures to reduce their
energy consumption and greenhouse gas emissions.
To cope with rising energy prices and to control the stakes, french food companies are increasingly
involved in energy efficiency. The political framework surrounding the issue of responsible energy
management in companies also plays an important role in raising awareness. On 25 October 2012 the
EU adopted an Energy Efficiency Directive establishing a Common Measurement Framework to
promote it in the EU, with the aim of increasing it by 20% by 2020. This text also provides for the
obligation for large companies to carry out an energy audit every 3 years.
Figure 20: Energy prices in France.
More discreetly than renewable energy, but probably more solidly, energy efficiency is becoming a
new and fast-growing economic sector for decades to come.
D4.2 - Picture of efficiency projects implemented by the
Industry sector-by-sector and process-by-process
Page 31
5 Spain
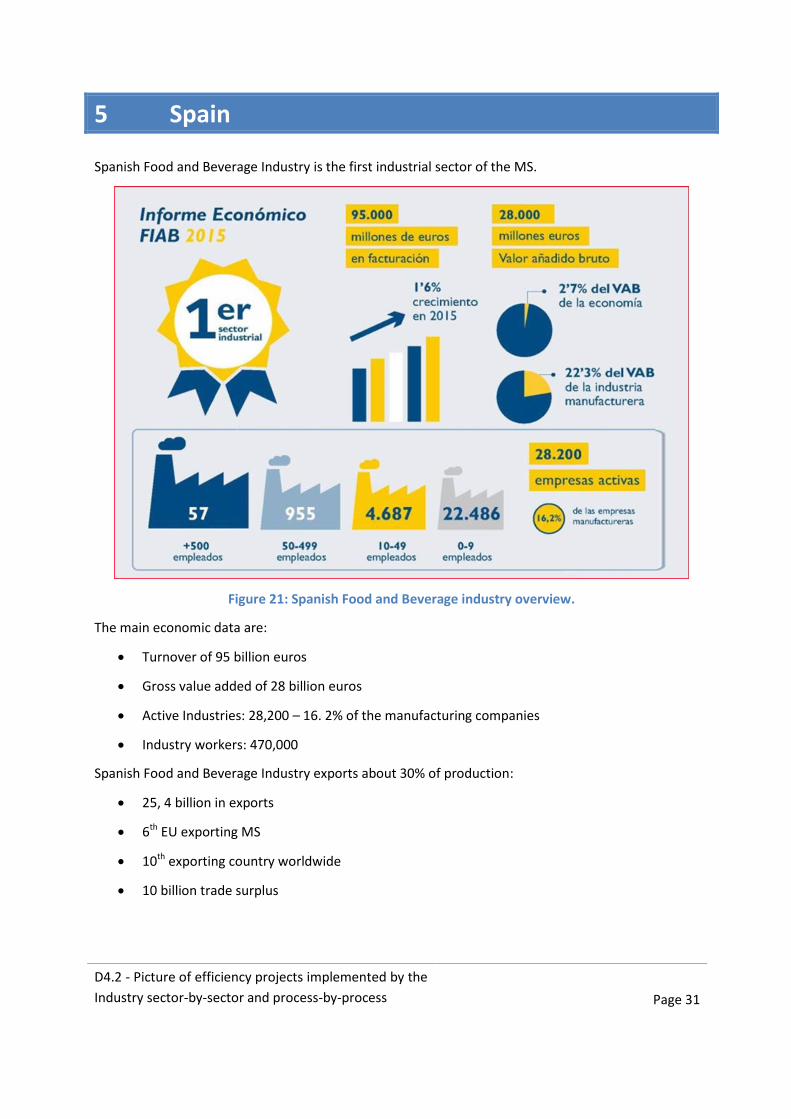
Spanish Food and Beverage Industry is the first industrial sector of the MS.
Figure 21: Spanish Food and Beverage industry overview.
The main economic data are:
Turnover of 95 billion euros
Gross value added of 28 billion euros
Active Industries: 28,200 – 16. 2% of the manufacturing companies
Industry workers: 470,000
Spanish Food and Beverage Industry exports about 30% of production:
25, 4 billion in exports
6th EU exporting MS
10th exporting country worldwide
10 billion trade surplus

D4.2 - Picture of efficiency projects implemented by the
Industry sector-by-sector and process-by-process
Page 32
Figure 22: Exports from Spanish Food and Beverage industry.
Spanish Food and Beverage Industry is spread all over the country, as shown in Figure 23.
Figure 23: Spanish food and beverage production.
D4.2 - Picture of efficiency projects implemented by the
Industry sector-by-sector and process-by-process
Page 33
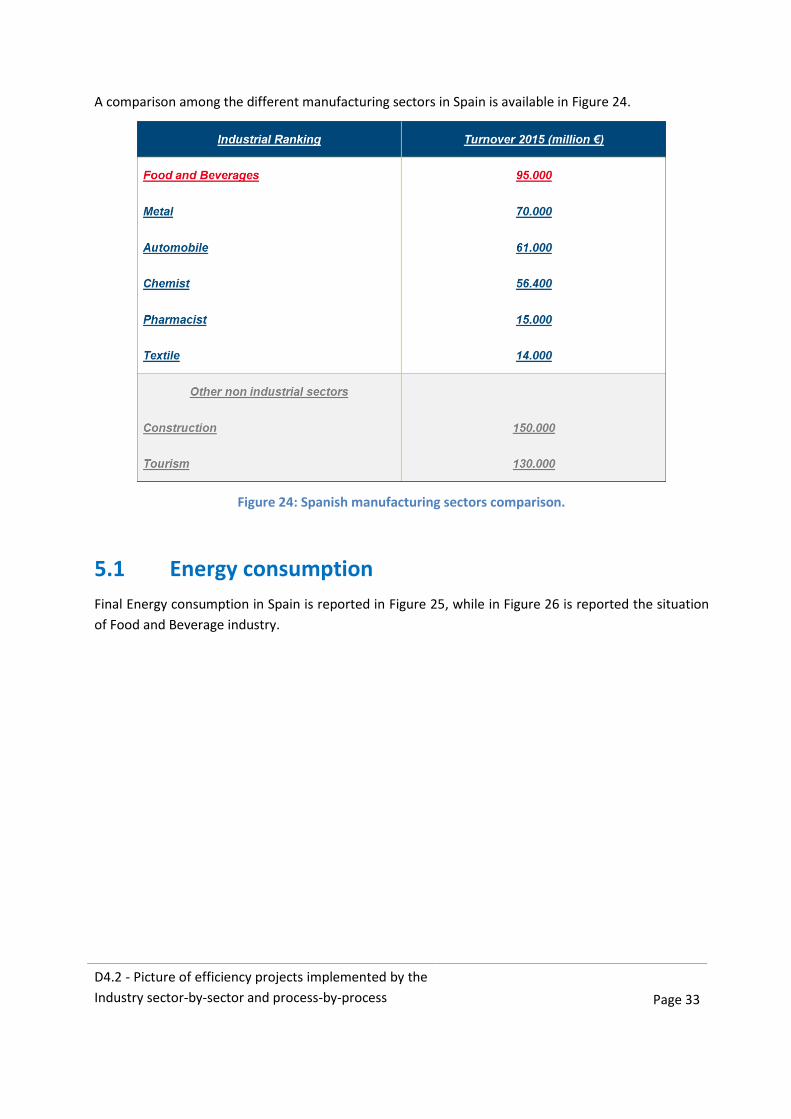
A comparison among the different manufacturing sectors in Spain is available in Figure 24.
Figure 24: Spanish manufacturing sectors comparison.
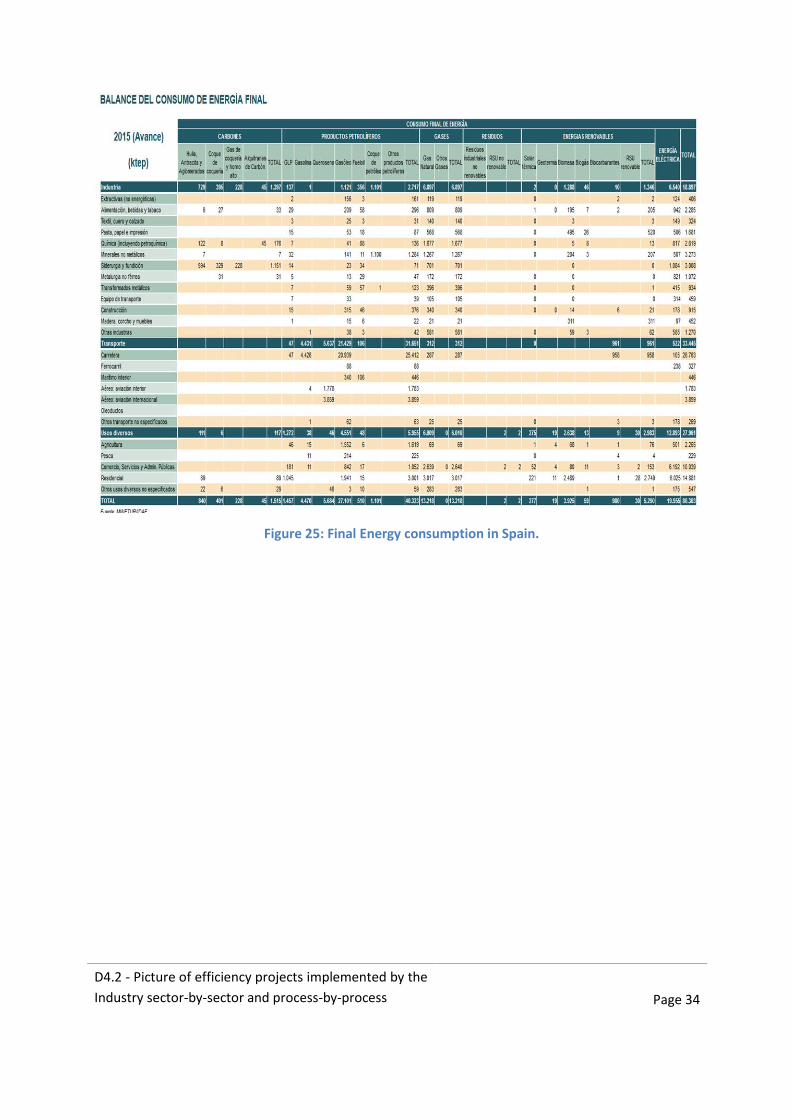
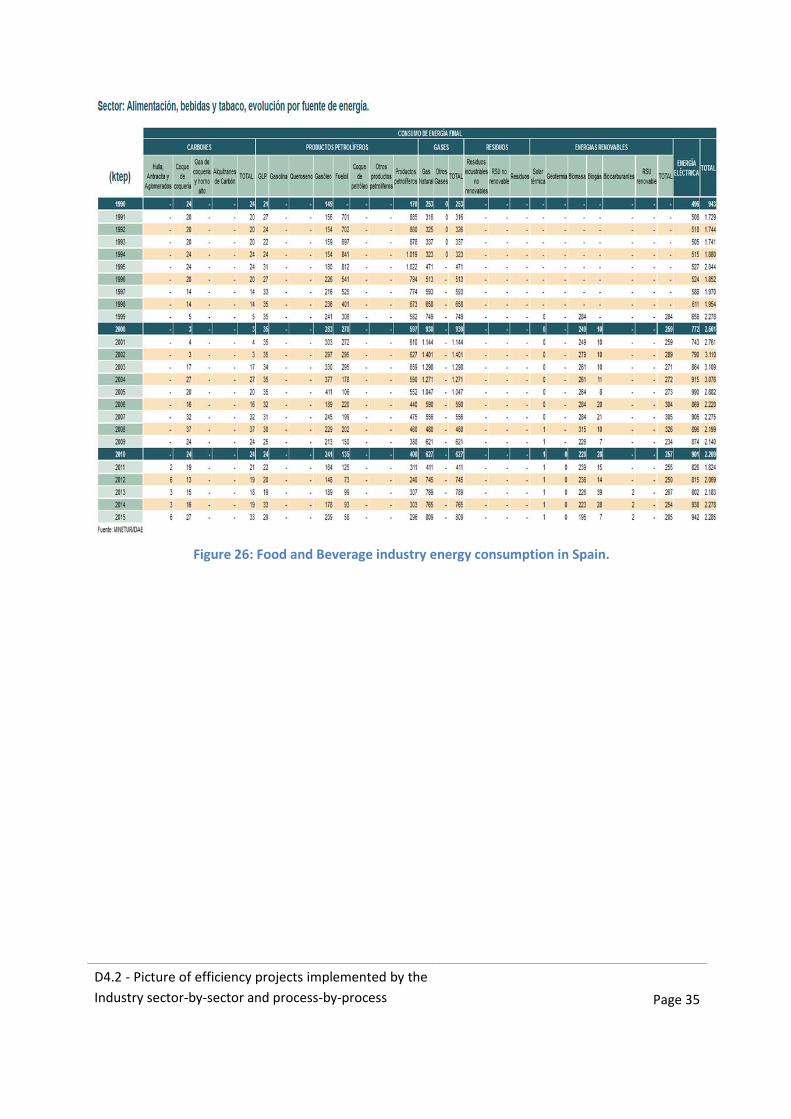
5.1 Energy consumption
Final Energy consumption in Spain is reported in Figure 25, while in Figure 26 is reported the situation
of Food and Beverage industry.
D4.2 - Picture of efficiency projects implemented by the
Industry sector-by-sector and process-by-process
Page 34
Figure 25: Final Energy consumption in Spain.
D4.2 - Picture of efficiency projects implemented by the
Industry sector-by-sector and process-by-process
Page 35
Figure 26: Food and Beverage industry energy consumption in Spain.