analysis of fundamental factors on stock...
TRANSCRIPT
49
International Journal of Academic Research in Accounting, Finance and Management Sciences Vol. 9, No.2, April 2019, pp. 49–64
E-ISSN: 2225-8329, P-ISSN: 2308-0337 © 2019 HRMARS
www.hrmars.com
To cite this article: Bintara, R., Tanjung P. R. S. (2019). Analysis of Fundamental Factors on Stock Return, International Journal of Academic Research in Accounting, Finance and Management Sciences 9 (2): 49-64.
http://dx.doi.org/10.6007/IJARAFMS/v9-i2/6029 (DOI: 10.6007/IJARAFMS/v9-i2/6029)
Analysis of Fundamental Factors on Stock Return
Rista Bintara¹, Putri Renalita Sutra Tanjung²
1,2Accounting Study Program, Faculty of Economics and Business, University of Mercu Buana Jl. Raya Meruya Selatan Kembangan West Jakarta,
¹E-mail: [email protected], ²E-mail: [email protected]
Abstract
The purpose of this study is as follows: 1) To examine the effect of ROA on Stock Returns; 2) To examine the effect of CR on Stock Returns; 3) To assess the effect of DER on Stock Returns; 4) To examine the effect of PER on Stock Returns; and 5) To examine the effect of PBV on Stock Returns. The type of research used in this study is casual associative research. The population in this study is Banking companies included in the Kompas 100 index listed on the Indonesia Stock Exchange (IDX) during the period 2012-2016. Sample selection using purposive sampling method. The analytical method used to test the hypothesis is a multiple regression test. The results of the study show that: 1) Return On Assets has a positive effect on Stock Return; 2) Current Ratio has a positive effect on Stock Return; 3) Debt to Equity Ratio negatively affects Stock Return; 4) Price Earnings Ratio has a positive effect on Stock Return; and 5) Price to Book Value does not affect Stock Return.
Key words Stock Return, Return On Asset, Current Ratio, Debt to Equity Ratio, Price Earnings Ratio, Price to Book Value
Received: 25 May 2019 © The Authors 2019
Revised: 10 Jun 2019 Published by Human Resource Management Academic Research Society (www.hrmars.com)
This article is published under the Creative Commons Attribution (CC BY 4.0) license. Anyone may reproduce, distribute, translate and create derivative works of this article (for both commercial and non-commercial purposes), subject to full attribution to the original publication and authors. The full terms of this license may be seen at: http://creativecommons.org/licences/by/4.0/legalcode
Accepted: 12 Jun 2019
Published Online: 17 Jun 2019
1. Introduction
One of the things that become a benchmark for a country's economic development is the level of development of the world capital market and securities industries in the country. The capital market acts as a means for mobilizing funds from parties who have excess funds to those who need funds. The presence of capital markets increases the choice of funding sources and investment choices for investors, so the opportunity to obtain returns is greater in accordance with the characteristics of the chosen investment. According to Jogiyanto (2015) investment activity itself is an activity of placing funds on one or more assets over a certain period in the hope of obtaining income or increasing the value of the initial investment (capital) which aims to maximize expected returns within the risk limits acceptable to each investor.
The main requirement that investors want to be willing to channel funds through the capital market is the feeling of security of the investment invested and the level of return that will be obtained from the investment. These security feelings are obtained because investors obtain clear, reasonable, and timely information as a basis for making investment decisions. Return is also a reward obtained by investors for their decision to bear the risk of the investment made, because the capital market cannot provide guarantees to investors to obtain stock returns with certainty.
Trisnawati (2009) states that the capital market has a number of distinctive characteristics when compared to other markets. One such characteristic is uncertainty about the quality of the products offered. This uncertainty situation encourages rational investors to always consider the risk and the

International Journal of Academic Research in Accounting, Finance and Management Sciences Vol. 9 (2), pp. 49–64 © 2019 HRMARS (www.hrmars.com)
50
expected return of each security that is theoretically proportional. The greater the expected return, the greater the level of inherent risks, and vice versa. To achieve an optimal level of return, investors also need to carry out various considerations and accurate analysis before buying, selling, or holding stocks.
The shares of companies that go public as an investment commodity are classified as having a high level of risk because they are very sensitive to changes in political and economic conditions and changes that occur within the internal company itself. These changes can have a positive or negative impact on the company's stock price. This shows that investors need to take a cautious attitude in investing in stocks to prevent possible losses. One effort to prevent such losses is to predict stock returns that investors might receive in the future.
In investing in the capital market, analysts and investors can approach investment, which can be broadly divided into two approaches, namely technical analysis and fundamental analysis. Technical analysis is an analysis of instruments that use historical trading data on stock prices, volume and several other market indicators to predict stock price expenditures and determine investment decision recommendations (Widyani, 2010). While fundamental analysis tries to estimate stock prices in the future by estimating the value of fundamental factors that influence stock prices in the future and apply the relationship of these variables so that the estimated stock price is obtained.
The object of this research was conducted on companies listing on the Indonesia Stock Exchange by using a sample of banking companies incorporated in the Kompas 100 Index. The compass index 100 was chosen as a research object, because it is a collection of 100 active companies on the Indonesia Stock Exchange. Because one of the criteria for selecting companies that enter the Kompas 100 Index is a company that has strong fundamentals, which are seen from the high market capacity and the greatest value and frequency of transactions. Besides that, in the compass index 100 consists of various industrial sectors that have long-term prospects so that investors can see the trend of the direction of stock movements by observing the movement of the compass index 100. Therefore, based on the fundamental factors of the company can provide a description of the strength of a company to survive, especially when hit by the economic crisis.
Various studies (Arista and Astohar, 2012; Farkhan and Ika, 2012; Tyas, 2010) show that stock returns are influenced by several factors, namely return on assets (ROA), current ratio (CR), debt to equity ratio (DER), price earnings ratio (PER) and price to book value (PBV). Whereas in the Nesa study (2015), it was shown that only ROA and DER had a significant effect on stock returns. Based on the description above, the authors are interested in conducting a study entitled "Analysis of Fundamental Factors against Stock Returns (Empirical Study on the Banking Sector that Go Public in the Kompas Index 100 Year 2012-2016)".
From the description of the background of the research above, the main problems that will be discussed in this study can be formulated, namely: 1) Does ROA have a significant effect on Stock Returns?; 2) Does CR significantly influence Stock Return?; 3) Does the DER significantly influence Stock Return?; 4) Does PER have a significant effect on Stock Return?; and 5) Does PBV significantly influence Stock Return?
2. Literature review
2.1. Legitimacy Theory
According to Ahmad et al. (2004) in Hasian (2017), legitimacy theory is based on the notion of social contracts that are implied between social institutions and society. Shocker and Sethi (1973) provide an explanation of the concept of social contracts as follows: All social institutions are no exception for companies operating in society through either explicit or implicit social contracts where survival and growth are based on: 1) Final results (output) which can be socially provided to the wider community; 2) Distribution of economic, social or political benefits to groups in accordance with the power they have.
Legitimacy theory also explains that the practice of disclosing corporate responsibility must be carried out in such a way that the activities and performance of the company can be accepted by the community. Ghozali and Chariri (2007) explain that in order to legitimize company activities in the eyes of the public, companies tend to use environment-based performance and disclosure of environmental information.
Legitimacy theory is the theory most often used especially when it is related to social territory and environmental accounting. Although there is still a strong pessimism put forward by many researchers, this
International Journal of Academic Research in Accounting, Finance and Management Sciences Vol. 9 (2), pp. 49–64 © 2019 HRMARS (www.hrmars.com)
51
theory has been able to offer a real perspective on the recognition of a company voluntarily by the community.
2.2. Stakeholders Theory
According to Clarkson (1995), stakeholders are divided into two groups namely primary and secondary. Primary stakeholders are groups of stakeholders who do not take part or participate in the operations of a company. Secondary stakeholders are groups of stakeholders that influence and are influenced by the company, but are not involved and are not so important for the survival of the company.
Stakeholder theory is a theory that states that a company is an entity that not only operates for its own sake, but must provide benefits to all its stakeholders, because the survival of a company is supported by stakeholders (Ghazali and Chariri, 2007). Shareholders, creditors, consumers, suppliers, governments, communities, analysts, and other parties are stakeholder groups that are considered by companies to disclose or not information that is in the company's financial statements. All stakeholders have the right to obtain information about company activities.
2.3. Fundamental Analysis
According to Ramlawati (2011), fundamental analysis is an attempt to estimate the health and profit prospects of a company, namely the ability of a company to grow and generate profits in the future. One important aspect of fundamental analysis is the analysis of financial statements, because from there it can be estimated the circumstances or position and direction of the company. To conduct analysis and stock selection there are two basic approaches, namely fundamental analysis and technical analysis. Fundamental analysis seeks to estimate stock prices in the future through estimation of fundamental factors such as sales, growth, costs, and dividend policies that affect stock prices, as well as applying the relationship of these variables to obtain stock price estimates. While technical analysis seeks to estimate stock prices based on changes in stock prices in the past.
Every stock investment has a strong reason called intrinsic value (real value) which can be determined through a very careful analysis of the current condition of the company and its future prospects. Intrinsic value is a function of company factors combined to produce an expected return with a risk inherent in the stock. This value is estimated by investors or analysts, and the results of these estimates are compared with the current market price, so that stocks can be known that are overpriced or those that underprice. In other circumstances, where the intrinsic value of shares is equal to the current stock market price, it is said that shares have a corrected value and tend to have no transactions. Fundamental analysis is basically doing a historical analysis of the financial strength of a company so that this process is also called Company Analysis. In company analysis, investors will study the company's financial statements with the aim of knowing the strengths and weaknesses of the company, identifying trends or growth that may exist, evaluating operational efficiency and understanding the nature and operational characteristics of the company.
According to Robert Ang (1997), analysis of fundamental factors based on financial analysis is reflected in financial ratios consisting of five ratios, namely: a) Leverage Ratio; b) Market Ratio; c) Profitability Ratio (Rentability); d) Liquidity Ratio; e) Activity Ratio
In this study, fundamental analysis will be reflected by financial ratios proxied by:
a. Return On Asset (ROA)
ROA is one ratio that measures the level of profitability of a company. ROA is used to determine the amount of net income that can be obtained from the company's operations by using all of its wealth. The high and low ROA depends on the management of company assets by management that describes the efficiency of the company's operations. The higher the ROA the more efficient the operational of the company and vice versa, the low ROA can be caused by the number of idle company assets, too much investment in inventory, excess paper money, fixed assets operating below normal and others happening on the stock exchange (Teguh, 2014). ROA is obtained from the comparison of net income with the total assets of the company.
Based on Bank Indonesia Circular Letter No.13/24/DPNP dated October 25, 2011 (Hafidz and Safira,

International Journal of Academic Research in Accounting, Finance and Management Sciences Vol. 9 (2), pp. 49–64 © 2019 HRMARS (www.hrmars.com)
52
2018). Return on assets can be calculated using the formula:
(1)
b. Current Ratio (CR)
The most common ratio used to analyze the position of a company's working capital is the current ratio, which is a comparison between the amount of current assets and current debt (Munawir, 2005). A high CR gives an indication of good guarantees for short-term creditors in the sense that every time the company has the ability to pay off its short-term financial obligations. However, a high CR also indicates that some working capital is not spinning or experiencing unemployment and will negatively affect the ability to obtain profit/profitability (Nesa, 2015). The reduction in the company's ability to earn profits will also cause a decline in the returns that investors will get.
Research conducted by Ulupui (2005) and Tyas (2010) shows that CR has a positive and significant influence on stock returns in the future. This indicates that investors will get a higher return if the company's ability to meet its short-term obligations is higher, because after the economic crisis investors begin to pay attention to cash management, accounts receivable, and inventory of the company before making a decision to invest in the capital market.
Unlike the research obtained by Farkhan and Ika (2012), Thrisye and Simu (2013), and Antara. et al., (2014) which showed that CR did not have a significant effect on stock returns.
The formula for calculating CR according to Gitman and Zutter (2012) is:
(2)
c. Debt to Equity Ratio (DER)
DER is a ratio that describes the ratio of debt and equity in corporate funding and shows the ability of the company's own capital to fulfill all its obligations (Sawir, 2000). According to Susilowati and Turyanto (2011) the increasing use of debt, which is reflected by the greater debt ratio (ratio of debt to total assets), the same earnings before interest and tax (EBIT) will generate profits divided by larger shares. If the profit divided by shares increases, then the interest of investors will increase. This will have an impact on increasing stock prices and causing an increase in stock returns.
This theory is supported by research conducted by Susilowati and Turyanto (2011) and Tyas (2010) which shows that DER has a positive and significant influence on stock returns. But this is contrary to what was stated by Ang (1997) which states that the higher the DER reflects the higher risk of the company, as a result investors tend to avoid stocks that have a high DER. So that investors' interest in investing their funds will have an impact on the decline in the company's stock price, so that stock returns also decline. Arista and Astohar (2012) and Thrisye and Simu (2013) prove that DER has a negative and significant influence on stock returns. Different results were obtained by Ulupui (2005) and Farkhan and Ika (2012) which showed that DER did not have a significant effect on stock returns.
The formula for Debt to Equity Ratio (DER) according to Husnan (2015) is:
(3)
d. Price Earnings Ratio (PER)
PER is a ratio that compares the stock price obtained from the capital market and earnings per share obtained by the company owner presented in the financial statements (Wahyudiono, 2014). According to Sugiono (2009) the higher the PER ratio will indicate that the company's performance is also getting better. However, on the contrary, if the PER is too high, it can also indicate that the stock price offered is very high or irrational. Care is needed in analyzing PER because the analysis can be misleading.
Farkhan and Ika (2012) prove that PER has a positive and significant effect on stock returns which means that the higher the PER of a company's stock, the price of a share will tend to increase. So if the price of a share and the rate of profit growth of a company increase, then PER also increases and stock returns will also increase. Conversely, if the price of a share and the rate of profit growth of a company
International Journal of Academic Research in Accounting, Finance and Management Sciences Vol. 9 (2), pp. 49–64 © 2019 HRMARS (www.hrmars.com)
53
decreases, then PER will also decrease and stock returns will also decline. Different results were obtained by Mathilda (2012) which showed that PER had a negative and
significant effect on stock returns. While Lestari (2012) found that PER does not have a significant effect on stock returns.
The formula used to calculate the amount of PER according to Husnan (2015) is:
(4)
e. Price to Book Value (PBV)
According to Darmadji and Fakhruddin (2001) PBV describes how much the market values the book value of a company's stock. If the PBV is high, the market confidence in the future prospects of the company is also high. PBV ratio is usually used for investors in making investment decisions. The higher the PBV, the higher the stock price. The higher the stock price, the higher the stock returns.
Research on this subject was carried out by Arista and Astohar (2012) which shows that PBV has a positive and significant influence on stock returns. Companies that can operate well, generally have PBV ratios above 1, which shows the stock market value is higher than the book value. The higher the PBV ratio, the higher the company is valued by investors. If a company is valued more highly by investors, then the stock price will increase further in the market, which in turn will increase stock returns.
These results are different from the research conducted by Mathilda (2012) which shows that PBV does not significantly influence stock returns.
This ratio is calculated by the following formula (Robert, 1997):
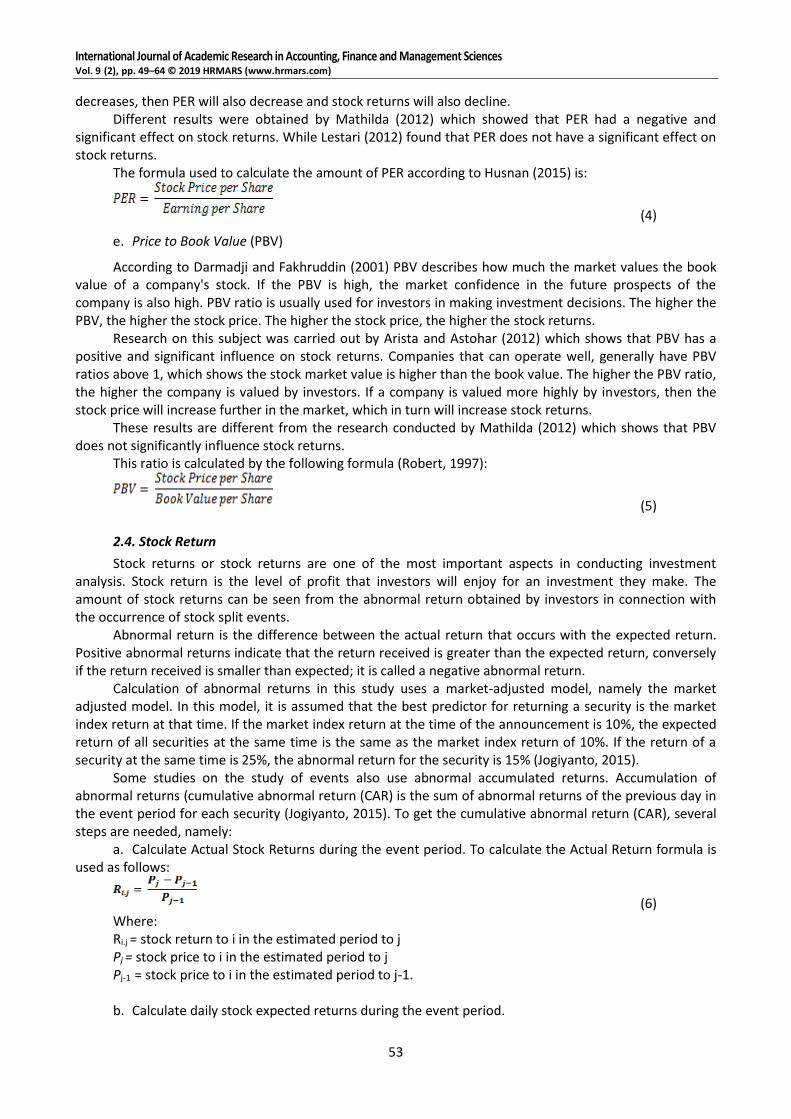
(5) 2.4. Stock Return
Stock returns or stock returns are one of the most important aspects in conducting investment analysis. Stock return is the level of profit that investors will enjoy for an investment they make. The amount of stock returns can be seen from the abnormal return obtained by investors in connection with the occurrence of stock split events.
Abnormal return is the difference between the actual return that occurs with the expected return. Positive abnormal returns indicate that the return received is greater than the expected return, conversely if the return received is smaller than expected; it is called a negative abnormal return.
Calculation of abnormal returns in this study uses a market-adjusted model, namely the market adjusted model. In this model, it is assumed that the best predictor for returning a security is the market index return at that time. If the market index return at the time of the announcement is 10%, the expected return of all securities at the same time is the same as the market index return of 10%. If the return of a security at the same time is 25%, the abnormal return for the security is 15% (Jogiyanto, 2015).
Some studies on the study of events also use abnormal accumulated returns. Accumulation of abnormal returns (cumulative abnormal return (CAR) is the sum of abnormal returns of the previous day in the event period for each security (Jogiyanto, 2015). To get the cumulative abnormal return (CAR), several steps are needed, namely:
a. Calculate Actual Stock Returns during the event period. To calculate the Actual Return formula is used as follows:
(6) Where: Ri.j = stock return to i in the estimated period to j Pj = stock price to i in the estimated period to j Pj-1 = stock price to i in the estimated period to j-1. b. Calculate daily stock expected returns during the event period.

International Journal of Academic Research in Accounting, Finance and Management Sciences Vol. 9 (2), pp. 49–64 © 2019 HRMARS (www.hrmars.com)
54
Expected Return is to calculate the expected return on securities by finding a weighted average value of all possible returns. Brown & Warner (1980) states that the expected return can be calculated using three models in order to test market efficiency, namely:
1) Mean-adjusted Returns The mean-adjusted return model assumes that the expected return is constant which is equal to the
previous average return realization during the estimation period. The formula is as follows:
(7)
Where:
= Expected return on security i at time t
Ri.j = Return on securities realization i in the estimated period j T = The duration of the estimation period, namely from t1 to t2. 2) Market Model Returns The expected return calculation with the market model is done in two stages, namely: (1) forming
the expectation model using realization data during the estimation period, and (2) using this expectation model to estimate the expected return in the window period. Expectation models can be formed using OLS (Ordinary Least Square) regression techniques with the equation:
Ri.j = αi + βi . RMj + Ɛi (8)
Where Ri.j = Return on securities realization i in the estimated period j αi = Intercept in regression for securities i. βi = Regression coefficients which state the regression line slope. RMj=Market index return in the estimated period j which can be calculated by the formula:
(9) Ɛi = Error in securities residue i in the estimated period j. 3) Market-Adjusted Model Market-adjusted model assumes that the best estimator for estimating a security's return is the
market index return at that time. By using this model, it is not necessary to use the estimation period to form the estimation model, because the estimated return of securities is the same as the market index return.
c. Menghitung Abnormal Return saham selama event period. With the formula:
ARit = Rit - E(Rit) (10)
Where: ARi.j = abnormal return securities i in the estimated period j Ri.j = Return on securities realization i in the estimated period j E(Rit)= Expected stock return i on day t Because this study uses Market Adjusted Model which has the assumption that the expected return
of all shares or issuers is the same (close to equivalent) with the expected market return, the following formula will be obtained:
ARit = Ri.j - RM.j (11)
Where: ARi.j = abnormal return securities i in the estimated period j Ri.j = Return on securities realization i in the estimated period j RM.j = Market index return in the estimated period j

International Journal of Academic Research in Accounting, Finance and Management Sciences Vol. 9 (2), pp. 49–64 © 2019 HRMARS (www.hrmars.com)
55
d. Calculate the Abnormal average Stock return on day t with the following formula:
AARnt = n
ARit
1t
=
n
(12) AARnt is the average stock abnormal return on day t, N is the number of companies studied. e. Calculating Cumulative Abnormal Daily return of each share during the observation period with
the following formula:
CARNn = +=
−=
10
10
AARntt
t (13) CARNn is the daily accumulation of abnormal returns per share. The event period is determined by the
researcher, which is 21 days, which is 10 days before and 10 days after the Internet Financial Reporting. 2.5. Previous research
Previous researches that can support this research are as follows: Bramantyo and Daljono (2013) in their research entitled "The Influence of Financial Performance on Stock Returns (Empirical Study of Automotive and Component Companies Listed in the Indonesia Stock Exchange Period 2005-2011)". The results of this study concluded that CR, DER, TATO did not affect Stock Return, while ROA has an effect on and significant to Stock Return. Teguh (2014) in his research entitled "Analysis of Fundamental Factors against Prices of Banking Sector Stocks that Go Public in the Kompas 100 Index". The results of this study prove that EPS, ROA, ROE, ROI, AG and CAR variables simultaneously have a significant effect on the stock price of banking companies, but only partially EPS and ROA variables that have a significant share price of banking companies in the Kompas 100 Index. Nesa (2015) in her research entitled "Analysis of Factors Affecting Stock Returns (A Case Study of Automotive and Components Sub Sector Companies Listed on the Indonesia Stock Exchange Period 2010-2014)". The results showed that only the ROA and DER variables had a significant effect on stock returns. While the current ratio (CR), price earnings ratio (PER) and price to book value (PBV) do not affect stock returns. Heryanto (2016) in his research entitled "Effect of Liquidity and Profitability to Bank Stock Return in Indonesia Stock Exchange (IDX)". The results of this study indicate that liquidity and profitability have a significant influence on stock returns. Vitri and Indra (2018) in his research entitled "Effect of Debt to Equity Ratio, Total Asset Turnover, Inflation and BI Rate on Stock Returns". The results showed that inflation and the BI rate had a significant effect on stock returns. While Debt to Equity Ratio (DER) and Total Asset Turn Over (TATO) do not affect Stock Return.
3. Framework
Based on the theoretical foundation and previous studies, the researchers developed a research framework that was tested as shown in the following figure 1:
Figure 1. Framework for Thinking
Stock Return
Return On Asset
Current Ratio
Debt to Equity Ratio
Price Earning Ratio
Price to Book Value
International Journal of Academic Research in Accounting, Finance and Management Sciences Vol. 9 (2), pp. 49–64 © 2019 HRMARS (www.hrmars.com)
56
4. Hypothesis
The research hypothesis proposed is as follows: Ha1 : Return On Asset has an effect on Stock Return Ha2:Current Ratio has an effect on Stock Return Ha3:Debt to Equity Ratio has an effect on Stock Return Ha4:Price Earning Ratio has an effect on Stock Return Ha5:Price to Book Value has an effect on Stock Return
5. Methodology of research
5.1. Types of research
The research used in this research is casual associative research. According to Sanusi (2011), associative-causal research is the search for the relationship between two or more variables. The purpose of associative research is to find relationships between one variable and another variable.
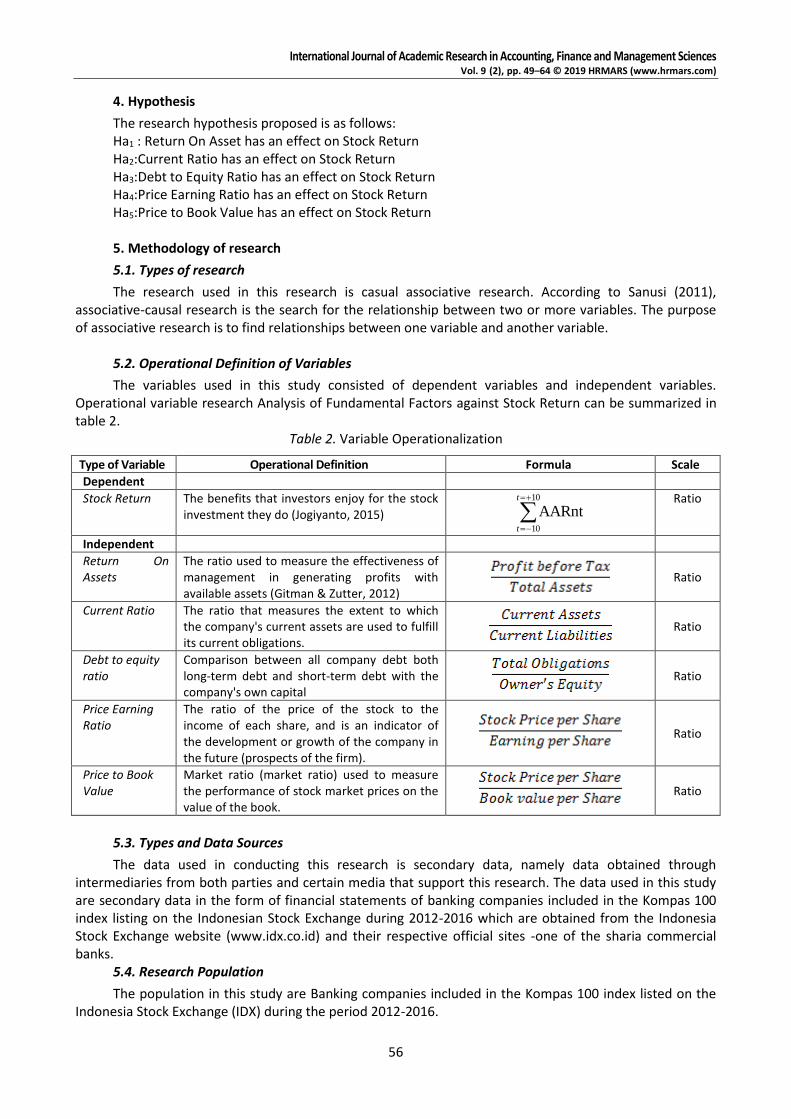
5.2. Operational Definition of Variables
The variables used in this study consisted of dependent variables and independent variables. Operational variable research Analysis of Fundamental Factors against Stock Return can be summarized in table 2.
Table 2. Variable Operationalization
Type of Variable Operational Definition Formula Scale
Dependent
Stock Return The benefits that investors enjoy for the stock investment they do (Jogiyanto, 2015)
+=
−=
10
10
AARntt
t
Ratio
Independent
Return On Assets
The ratio used to measure the effectiveness of management in generating profits with available assets (Gitman & Zutter, 2012)
Ratio
Current Ratio The ratio that measures the extent to which the company's current assets are used to fulfill its current obligations.
Ratio
Debt to equity ratio
Comparison between all company debt both long-term debt and short-term debt with the company's own capital
Ratio
Price Earning Ratio
The ratio of the price of the stock to the income of each share, and is an indicator of the development or growth of the company in the future (prospects of the firm).
Ratio
Price to Book Value
Market ratio (market ratio) used to measure the performance of stock market prices on the value of the book.
Ratio
5.3. Types and Data Sources
The data used in conducting this research is secondary data, namely data obtained through intermediaries from both parties and certain media that support this research. The data used in this study are secondary data in the form of financial statements of banking companies included in the Kompas 100 index listing on the Indonesian Stock Exchange during 2012-2016 which are obtained from the Indonesia Stock Exchange website (www.idx.co.id) and their respective official sites -one of the sharia commercial banks.
5.4. Research Population
The population in this study are Banking companies included in the Kompas 100 index listed on the Indonesia Stock Exchange (IDX) during the period 2012-2016.
International Journal of Academic Research in Accounting, Finance and Management Sciences Vol. 9 (2), pp. 49–64 © 2019 HRMARS (www.hrmars.com)
57
5.5. Research Samples
Samples are part of the population used to estimate population characteristics. The sampling technique is using purposive sampling techniques. According to Widyani (2010) the purosive sampling method is the selection of samples based on the suitability of the characteristics of the sample with the predetermined sample selection criteria. The sample criteria used in this study are:
1 Banking company included in the Kompas 100 index and listed on the Indonesia Stock Exchange (IDX) during the period 2012-2016.
2 Issue audited financial statements for the period 2012-2016. 3 The company did not experience losses during the study year. 4 Data owned by the company is complete and in accordance with the variables under study. According to the above criteria, the number of samples used was 8 banks for 5 periods, namely 2012,
2013, 2014, 2015 and 2016. Then the number of samples obtained was 8 bank x 5 periods = 40 data to be used in this study.
5.6. Data collection technique
The method of data collection in this study is the literature study method and documentation method. Library study method by conducting literature review and reviewing various literature such as various journals, articles and other literature books that support this research process. While the documentation method is the process of collecting data by recording documents related to this research.
5.7. Analysis Method
Descriptive statistics Descriptive statistics in this study are used to provide a description of the character of the research
variable by using a frequency distribution table that shows the mode number, range of scores and standard divisions.
5.8. Classic assumption test
This research was conducted with a simple regression analysis. The use of simple regression analysis must be free from testing classical assumptions. For this reason, before a simple regression analysis is carried out, classical assumptions must be tested first. Classical assumption testing is done using normality test, multicollinearity test, heterocedasticity test and autocorrelation test.
5.9. Hypothesis testing
In this study the authors used five independent variables and one dependent variable. The analytical method used to test hypotheses is multiple regression methods, namely regression which is used to determine how much influence the independent variables have on the dependent variable, with simple linear regression analysis that aims to meet the expectations of researchers regarding Analysis of Fundamental Factors against Stock Returns. Regression analysis using SPSS version 22 software, the regression equation is as follows: Y = α + β1X1 +β2X2 + β3X3 + β4X4 + β5X5 + Ɛ1.
Dimana: Y = Stock Return α = constant or price Y if X = 0 β =number or direction of the regression coefficient, which shows the number of increases or
decreases in the dependent variable based on the independent variable: X1 = ROA; X2 = CR; X3 = DER; X4 = PER; X5 = PBV; Ɛ = level of error. In this study used a significance level (α) of 0.05 or 5%. To test whether the proposed hypothesis is
accepted or rejected, then testing the research variables by testing simultaneously through a simultaneous significance test (F test statistic), which intends to be able to explain the effect of independent variables on the dependent variable. Whereas to test each variable partially, it is done by testing the significance of
International Journal of Academic Research in Accounting, Finance and Management Sciences Vol. 9 (2), pp. 49–64 © 2019 HRMARS (www.hrmars.com)
58
individual parameters (statistical t test) which aims to determine whether the independent variable has an effect on the dependent variable, and which variables predominantly affect the dependent variable.
6. Results and discussions
6.1. Description of Research Data
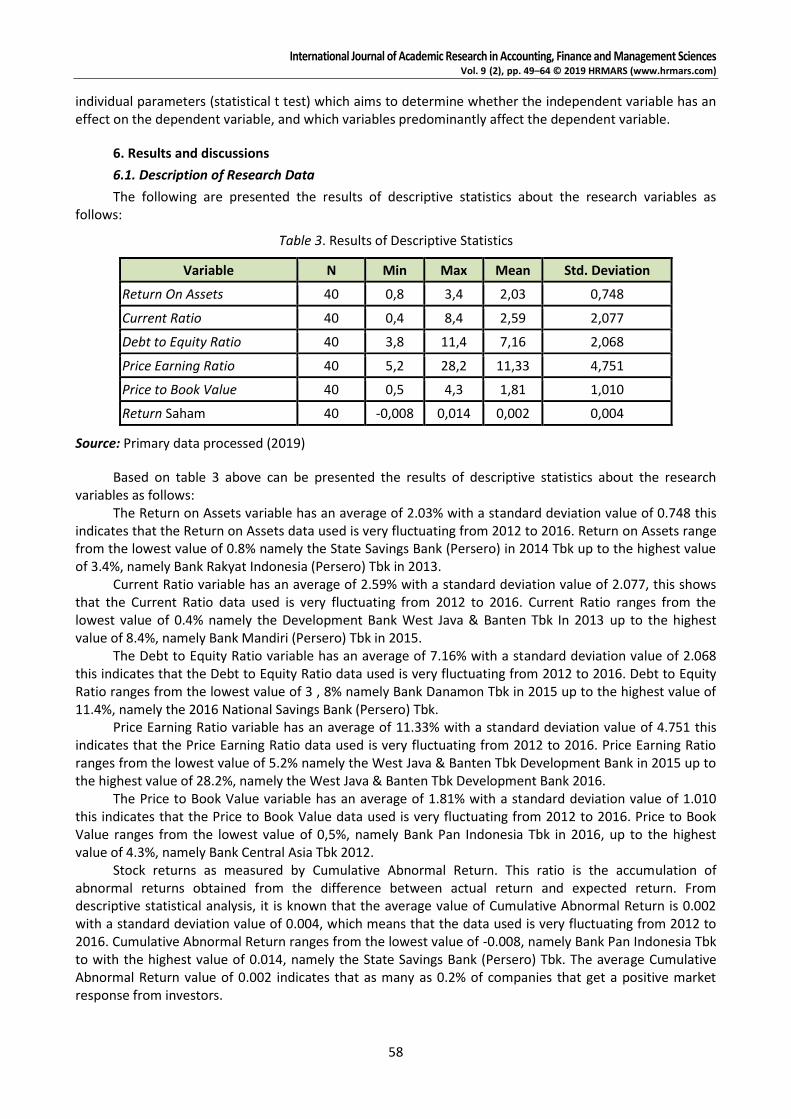
The following are presented the results of descriptive statistics about the research variables as follows:
Table 3. Results of Descriptive Statistics
Variable N Min Max Mean Std. Deviation
Return On Assets 40 0,8 3,4 2,03 0,748
Current Ratio 40 0,4 8,4 2,59 2,077
Debt to Equity Ratio 40 3,8 11,4 7,16 2,068
Price Earning Ratio 40 5,2 28,2 11,33 4,751
Price to Book Value 40 0,5 4,3 1,81 1,010
Return Saham 40 -0,008 0,014 0,002 0,004
Source: Primary data processed (2019)
Based on table 3 above can be presented the results of descriptive statistics about the research variables as follows:
The Return on Assets variable has an average of 2.03% with a standard deviation value of 0.748 this indicates that the Return on Assets data used is very fluctuating from 2012 to 2016. Return on Assets range from the lowest value of 0.8% namely the State Savings Bank (Persero) in 2014 Tbk up to the highest value of 3.4%, namely Bank Rakyat Indonesia (Persero) Tbk in 2013.
Current Ratio variable has an average of 2.59% with a standard deviation value of 2.077, this shows that the Current Ratio data used is very fluctuating from 2012 to 2016. Current Ratio ranges from the lowest value of 0.4% namely the Development Bank West Java & Banten Tbk In 2013 up to the highest value of 8.4%, namely Bank Mandiri (Persero) Tbk in 2015.
The Debt to Equity Ratio variable has an average of 7.16% with a standard deviation value of 2.068 this indicates that the Debt to Equity Ratio data used is very fluctuating from 2012 to 2016. Debt to Equity Ratio ranges from the lowest value of 3 , 8% namely Bank Danamon Tbk in 2015 up to the highest value of 11.4%, namely the 2016 National Savings Bank (Persero) Tbk.
Price Earning Ratio variable has an average of 11.33% with a standard deviation value of 4.751 this indicates that the Price Earning Ratio data used is very fluctuating from 2012 to 2016. Price Earning Ratio ranges from the lowest value of 5.2% namely the West Java & Banten Tbk Development Bank in 2015 up to the highest value of 28.2%, namely the West Java & Banten Tbk Development Bank 2016.
The Price to Book Value variable has an average of 1.81% with a standard deviation value of 1.010 this indicates that the Price to Book Value data used is very fluctuating from 2012 to 2016. Price to Book Value ranges from the lowest value of 0,5%, namely Bank Pan Indonesia Tbk in 2016, up to the highest value of 4.3%, namely Bank Central Asia Tbk 2012.
Stock returns as measured by Cumulative Abnormal Return. This ratio is the accumulation of abnormal returns obtained from the difference between actual return and expected return. From descriptive statistical analysis, it is known that the average value of Cumulative Abnormal Return is 0.002 with a standard deviation value of 0.004, which means that the data used is very fluctuating from 2012 to 2016. Cumulative Abnormal Return ranges from the lowest value of -0.008, namely Bank Pan Indonesia Tbk to with the highest value of 0.014, namely the State Savings Bank (Persero) Tbk. The average Cumulative Abnormal Return value of 0.002 indicates that as many as 0.2% of companies that get a positive market response from investors.
International Journal of Academic Research in Accounting, Finance and Management Sciences Vol. 9 (2), pp. 49–64 © 2019 HRMARS (www.hrmars.com)
59
6.2. Classic assumption test
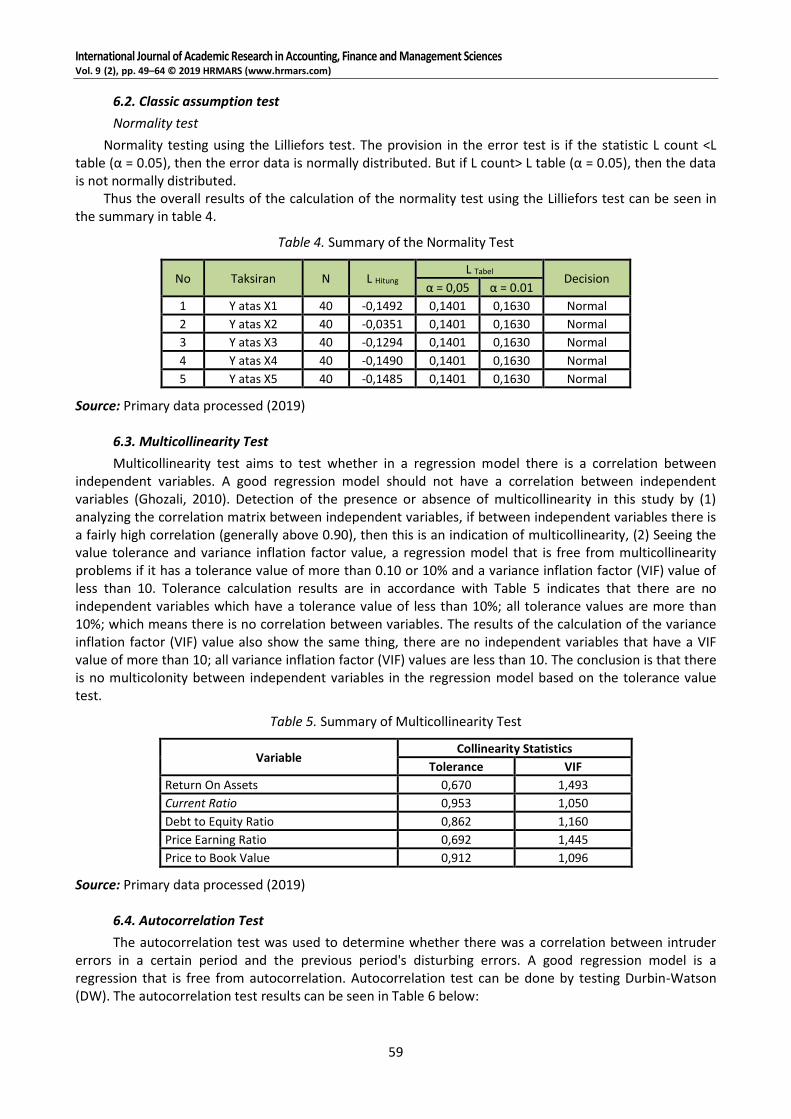
Normality test
Normality testing using the Lilliefors test. The provision in the error test is if the statistic L count <L table (α = 0.05), then the error data is normally distributed. But if L count> L table (α = 0.05), then the data is not normally distributed.
Thus the overall results of the calculation of the normality test using the Lilliefors test can be seen in the summary in table 4.
Table 4. Summary of the Normality Test
No Taksiran N L Hitung L Tabel
Decision α = 0,05 α = 0.01
1 Y atas X1 40 -0,1492 0,1401 0,1630 Normal
2 Y atas X2 40 -0,0351 0,1401 0,1630 Normal
3 Y atas X3 40 -0,1294 0,1401 0,1630 Normal
4 Y atas X4 40 -0,1490 0,1401 0,1630 Normal
5 Y atas X5 40 -0,1485 0,1401 0,1630 Normal
Source: Primary data processed (2019)
6.3. Multicollinearity Test
Multicollinearity test aims to test whether in a regression model there is a correlation between independent variables. A good regression model should not have a correlation between independent variables (Ghozali, 2010). Detection of the presence or absence of multicollinearity in this study by (1) analyzing the correlation matrix between independent variables, if between independent variables there is a fairly high correlation (generally above 0.90), then this is an indication of multicollinearity, (2) Seeing the value tolerance and variance inflation factor value, a regression model that is free from multicollinearity problems if it has a tolerance value of more than 0.10 or 10% and a variance inflation factor (VIF) value of less than 10. Tolerance calculation results are in accordance with Table 5 indicates that there are no independent variables which have a tolerance value of less than 10%; all tolerance values are more than 10%; which means there is no correlation between variables. The results of the calculation of the variance inflation factor (VIF) value also show the same thing, there are no independent variables that have a VIF value of more than 10; all variance inflation factor (VIF) values are less than 10. The conclusion is that there is no multicolonity between independent variables in the regression model based on the tolerance value test.
Table 5. Summary of Multicollinearity Test
Variable Collinearity Statistics
Tolerance VIF
Return On Assets 0,670 1,493
Current Ratio 0,953 1,050
Debt to Equity Ratio 0,862 1,160
Price Earning Ratio 0,692 1,445
Price to Book Value 0,912 1,096
Source: Primary data processed (2019)
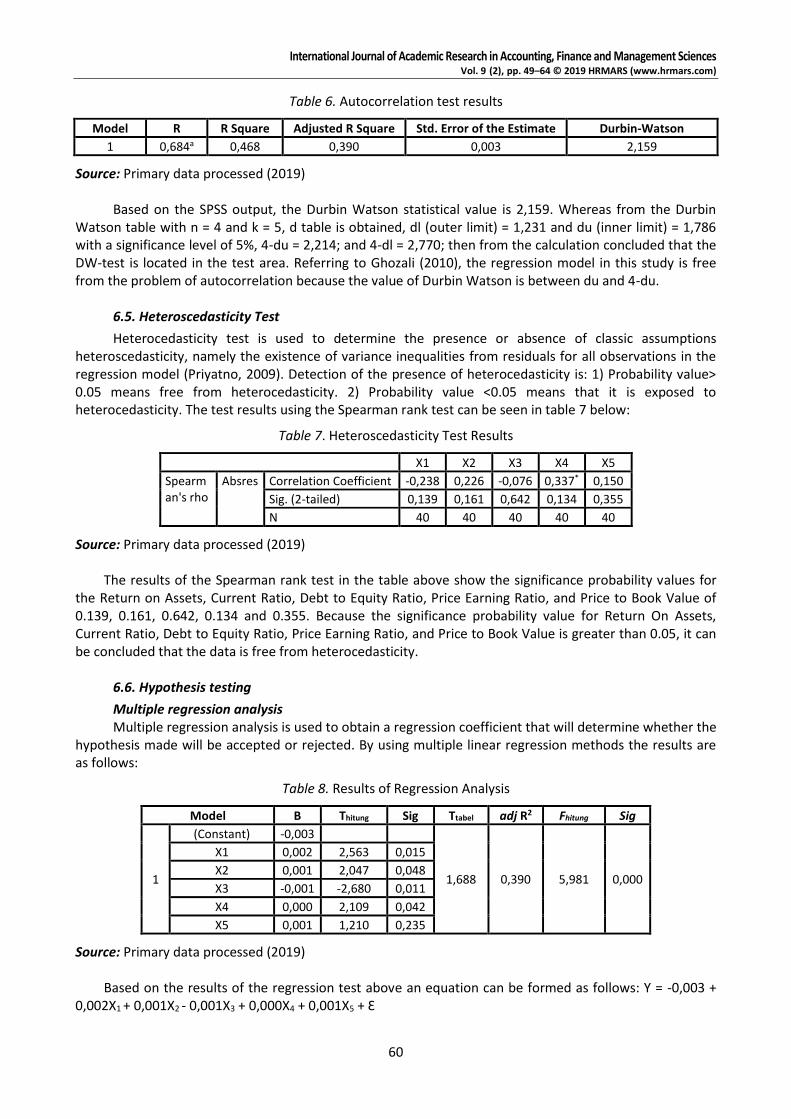
6.4. Autocorrelation Test
The autocorrelation test was used to determine whether there was a correlation between intruder errors in a certain period and the previous period's disturbing errors. A good regression model is a regression that is free from autocorrelation. Autocorrelation test can be done by testing Durbin-Watson (DW). The autocorrelation test results can be seen in Table 6 below:
International Journal of Academic Research in Accounting, Finance and Management Sciences Vol. 9 (2), pp. 49–64 © 2019 HRMARS (www.hrmars.com)
60
Table 6. Autocorrelation test results
Model R R Square Adjusted R Square Std. Error of the Estimate Durbin-Watson
1 0,684a 0,468 0,390 0,003 2,159
Source: Primary data processed (2019)
Based on the SPSS output, the Durbin Watson statistical value is 2,159. Whereas from the Durbin Watson table with n = 4 and k = 5, d table is obtained, dl (outer limit) = 1,231 and du (inner limit) = 1,786 with a significance level of 5%, 4-du = 2,214; and 4-dl = 2,770; then from the calculation concluded that the DW-test is located in the test area. Referring to Ghozali (2010), the regression model in this study is free from the problem of autocorrelation because the value of Durbin Watson is between du and 4-du.
6.5. Heteroscedasticity Test
Heterocedasticity test is used to determine the presence or absence of classic assumptions heteroscedasticity, namely the existence of variance inequalities from residuals for all observations in the regression model (Priyatno, 2009). Detection of the presence of heterocedasticity is: 1) Probability value> 0.05 means free from heterocedasticity. 2) Probability value <0.05 means that it is exposed to heterocedasticity. The test results using the Spearman rank test can be seen in table 7 below:
Table 7. Heteroscedasticity Test Results
X1 X2 X3 X4 X5
Spearman's rho
Absres Correlation Coefficient -0,238 0,226 -0,076 0,337* 0,150
Sig. (2-tailed) 0,139 0,161 0,642 0,134 0,355
N 40 40 40 40 40
Source: Primary data processed (2019) The results of the Spearman rank test in the table above show the significance probability values for
the Return on Assets, Current Ratio, Debt to Equity Ratio, Price Earning Ratio, and Price to Book Value of 0.139, 0.161, 0.642, 0.134 and 0.355. Because the significance probability value for Return On Assets, Current Ratio, Debt to Equity Ratio, Price Earning Ratio, and Price to Book Value is greater than 0.05, it can be concluded that the data is free from heterocedasticity.
6.6. Hypothesis testing
Multiple regression analysis Multiple regression analysis is used to obtain a regression coefficient that will determine whether the
hypothesis made will be accepted or rejected. By using multiple linear regression methods the results are as follows:
Table 8. Results of Regression Analysis
Model B Thitung Sig Ttabel adj R2 Fhitung Sig
1
(Constant) -0,003
1,688 0,390 5,981 0,000
X1 0,002 2,563 0,015
X2 0,001 2,047 0,048
X3 -0,001 -2,680 0,011
X4 0,000 2,109 0,042
X5 0,001 1,210 0,235
Source: Primary data processed (2019)
Based on the results of the regression test above an equation can be formed as follows: Y = -0,003 + 0,002X1 + 0,001X2 - 0,001X3 + 0,000X4 + 0,001X5 + Ɛ
International Journal of Academic Research in Accounting, Finance and Management Sciences Vol. 9 (2), pp. 49–64 © 2019 HRMARS (www.hrmars.com)
61
6.7. Determination Coefficient Test (R2)
The coefficient of determination is indicated by the adjusted R Square value. The adjusted R-Square value of the regression model is used to find out how much the ability of the independent variable (independent) to explain the dependent variable (dependent). From table 8 it is known that the adjusted R square value is 0.390. This means that 39.0% of Stock Returns can be explained by variations in the independent variables, namely Return On Assets, Current Ratio, Debt to Equity Ratio, Price Earning Ratio, and Price to Book Value, the remainder is 61.0% (100% - 39.0%) explained by other reasons outside the model.
6.8. Simultaneous Significance Test (Test Statistic F)
Simultaneous significance test (F test) is used to show whether all the independent variables included in the model have a joint influence on the dependent variable (Ghozali, 2009). If the analysis using the F test shows that all independent variables simultaneously are explanations of the significance of the dependent variable. From the Anova test or F Test in table 8 above, the calculated F value is 5.981 with a significance probability that indicates 0,000. The test probability value is much smaller than α = 0.05. This shows that together (simultaneously) Stock Returns can be influenced by Return On Assets, Current Ratio, Debt to Equity Ratio, Price Earning Ratio, and Price to Book Value.
6.9. Individual Parameter Significance Test (t Test)
Effect of Return On Assets on Stock Returns Based on the calculation results in table 6 above shows that the Return On Assets variable has a
positive effect on Stock Return, which can be seen from the comparison between t table and t count, namely t table is greater than t count, with the value of t table 1.688 and t count 2.563 and the level of significance is smaller than 0.05. Thus Ha1 is accepted.
Effect of Current Ratio on Stock Return Based on the calculation results in table 6 above shows that the Current Ratio variable has a positive
effect on Stock Return, which can be seen from the comparison between t table and t count, namely t table is greater than t count, with t table 1.688 and t count 2.047 and significance level below 0.05. Thus Ha2 is accepted.
Effect of Debt to Equity Ratio on Stock Return Based on the calculation results in table 6 above shows that the Debt to Equity Ratio variable has a
negative effect on Stock Return, which can be seen from the comparison between t table and t count, namely t table is smaller than t count, with the value of t table 1.688 and t count -2.680 and a significance level below 0.05. Thus Ha3 is accepted.
Effect of Price Earning Ratio on Stock Return Based on the calculation results in table 6 above shows that the Price Earning Ratio variable has a
positive effect on Stock Return, which can be seen from the comparison between t table and t count, namely t table is greater than t count, with the value of t table 1.688 and t count 2.109 and the significance level below 0.05. Thus Ha4 is accepted.
Effect of Price to Book Value on Stock Return Based on the calculation results in table 6 above shows that the Price to Book Value variable does not
affect Stock Return, which can be seen from the comparison between t table and t count, namely t table is greater than t count, with the value of t table 1.688 and t count 1,210 and the significance level above 0.05. Thus Ha5 is rejected.
International Journal of Academic Research in Accounting, Finance and Management Sciences Vol. 9 (2), pp. 49–64 © 2019 HRMARS (www.hrmars.com)
62
6.10. Discussions
Effect of Return on Assets on Stock Return From the results of the study it is known that Return on Assets has a positive effect on Stock Return.
This shows that the better the company's financial performance the higher the stock return. The results of this evidence indicate that companies with good or increasing return on assets have the potential to attract the company by investors. This condition makes the company's stock price increase so that an increase in return on assets will have an impact on the company's stock return.
Return On Assets (ROA) is used to measure the effectiveness of a company in generating profits by utilizing its assets. Increasing ROA means that the company's performance is getting better and will be responded to by the market and investors by buying shares, as a result the company's stock price increases. With the increase in stock prices, the company's stock returns are also increasing, the theory is supported by a signal theory which is a guide for investors to assess the company's prospects.
These results support research conducted by Farkhan and Ika (2012), Bramantyo and Daljono (2013), Bintara (2015), Nesa (2015), and Heryanto (2016) which states that the Return on Assets variable has a positive effect on company stock returns. However, the results of this study are not in line with the research conducted by Yeye (2011), Arista and Astohar (2012), Widyawati (2012), and Thrisye and Simu (2013) which states that ROA does not affect stock returns.
Effect of Current Ratio on Stock Return From the results of the study it is known that the Current Ratio has a positive effect on Stock Return.
The results of this study indicate that if the better current ratio reflects the more liquid the company, so that the ability to meet short-term capabilities is higher, this will be able to increase the company's credibility in the eyes of investors so that it will be able to increase the company's stock return.
Current ratio shows the amount of current liabilities that are closed with assets that are expected to be converted into cash in the short term. The higher the current ratio, it can be said that the company has a greater ability to fulfill its short-term financial obligations. This is supported by a balance theory which states that companies with low business risk use more debt, and use less debt at high risk.
The results of this study support the findings of Shandy (2013), Pinkan (2013), Awan (2014), Ayu and Gede (2016) which states that the Current Ratio affects Stock Return.
Effect of Debt to Equity Ratio on Stock Return From the results of the study it is known that the Debt to Equity Ratio has a negative effect on Stock
Return. This indicates that if the company's burden is getting heavier than the company's performance will deteriorate and this will result in a decrease in stock prices in the capital market. With the decline in the price of the company's shares in the capital market, the return also decreases.
Debt to equity ratio (DER) can give an idea of the capital structure owned by the company so that it can be seen the level of risk of unpaid debt. The greater the debt to equity ratio, shows the greater the company's burden on external parties, both in the form of principal and loan interest. This statement is supported by a tradeoff theory where the capital structure states that the company exchanges the benefits of taxes from debt financing with problems arising from potential bankruptcy.
The results of this study support the findings of Arista and Astohar (2012) Gilang (2012), Thrisye and Simu (2013), Barakat (2014) and Ayu and Gede (2016), which state that DER has a negative and significant influence on stock return.
Effect of Price Earning Ratio on Stock Return From the results of the study it is known that the Price Earning Ratio variable has a positive effect on
the Stock Return. This indicates that if the stock price gets higher than the difference in the share price of the current period with the previous period is getting bigger, so that the capital gains also increase, then a high PER will cause stock returns to rise.
Price Earning Ratio (PER) is used by investors to predict a company's ability to generate profits in the future. The higher the PER, the higher the price of the stock by investors to the income per share, so that the higher PER also shows the more expensive the share of income. This assumption is supported by signal

International Journal of Academic Research in Accounting, Finance and Management Sciences Vol. 9 (2), pp. 49–64 © 2019 HRMARS (www.hrmars.com)
63
theory where companies with very bright prospects do not make funding through new shares, while companies with poor prospects do like funding with outside equity which causes stock prices to increase.
The results of this study are supported by Farkhan and Ika (2012), Malintan (2012), Aras (2014), and Ayu and Gede (2016) which states that PER has a positive and significant effect on stock returns.
Effect of Price to Book Value on Stock Return The results of the study show that Price to Book Value does not affect Stock Return. This result
supports the research conducted by Mathilda (2012), and Nesa (2015), this is because investors no longer assume that PBV can be used as a benchmark for buying shares but rather consider other things. But these results are not in line with the research conducted by Hardiningsih (2002), Margaretha and Damayanti (2008), and Arista & Astohar (2012) which states that PBV has a positive and significant influence on stock returns.
7. Conclusions
Based on the results of the analysis and discussion that has been carried out, then conclusions can be given as follows: 1) Return On Assets has a positive effect on Stock Return; 2) Current Ratio has a positive effect on Stock Return; 3) Debt to Equity Ratio negatively affects Stock Return; 4) Price Earning Ratio has a positive effect on Stock Return; and 5) Price to Book Value does not affect Stock Return.
8. Limitations
This research is inseparable from shortcomings and limitations. Limitations in this study are as follows: 1) Research is limited to using independent variables, namely the variable Return On Assets, Current Ratio, Debt to Equity Ratio, Price Earning Ratio and Price to Book Value; 2) The researcher limits the object of research of Banking companies included in the Kompas 100 index and is listed on the Indonesia Stock Exchange (IDX).
9. Suggestions
As previously explained, this study contains limitations. But the results of this study can at least motivate the next study. Taking into account existing limitations, it is expected that future research will improve the following factors: 1) In the next study, it is better to add several companies from various sectors to be studied in order to better describe the condition of each company, researchers also need to add a period longer research so that the results can be more generalized and add one or more variables that more influence stock returns; 2) For investors and management, the company should optimize return on assets, debt equity ratio, current ratio and price earnings ratio, because these three variables have a positive and significant relationship to stock returns. In addition, especially for investors and investment managers in stock purchase decisions in the capital market, not only consider the ratio analysis approach in assessing the return of a stock, but consider factors outside the company's policies such as market conditions that occur and other external factors because of things this will indirectly affect the profits earned in making an investment.
References
1. Antara, S., Sepang, J., & Saerang, I. S. (2014). Analisis Rasio Likuiditas, Aktivitas, dan Profitabilitas Terhadap Return Saham Perusahaan Wholesale Yang Terdaftar di Bursa Efek Indonesia. Jurnal EMBA, Vol 2, No. 3, hal. 902-911
2. Arista, Desy dan Astohar. (2012). Analisis Faktor-Faktor Yang Mempengaruhi Return Saham (Kasus pada Perusahaan Manufaktur yang Go Public di BEI periode Tahun 2005-2009).Jurnal Ilmu Manajemen dan Akuntansi Terapan, Vol. 3, No. 1.
3. Ayu Dika Parwati dan Gede Mertha Sudiartha. (2016). Pengaruh Profitabilitas, Leverage, Likuiditas dan Penilaian Pasar Terhadap Return Saham pada Perusahaan Manufaktur. E-Jurnal Manajemen Unud, Vol. 5, No.1
International Journal of Academic Research in Accounting, Finance and Management Sciences Vol. 9 (2), pp. 49–64 © 2019 HRMARS (www.hrmars.com)
64
4. Bramantyo Nugroho dan Daljono. (2013). Pengaruh Kinerja Keuangan Terhadap Return Saham (Studi Empiris Perusahaan Automotive and Component yang Listing di Bursa Efek Indonesia Periode 2005-2011). Diponegoro Journal of Accounting Vol. 2, No. 1, hal. 1-11
5. Farkhan, & Ika. (2012). Pengaruh Rasio Keuangan Terhadap Return Saham Perusahaan Manufaktur di Bursa Efek Indonesia (studi kasus pada perusahaan manufaktur sektor food and beverage). Jurnal Value Added, Vol 9, No. 1, Hal. 1–18
6. Gitman, L. J., & Zutter, C. J. (2012). Principles of Managerial Finanance. England: Pearson Education Limited
7. Gujarati, D. N. (2012). Dasar-dasar Ekonometrika. Terjemahan Mangunsong, R.C., Salemba Empat, buku 2, Edisi 5, Jakarta
8. Hafidz Ridho Ansori dan Safira. (2018). Analisis Pengaruh Manajemen Risiko Terhadap Profitabilitas (Studi Komparatif Pada Bank Umum Konvensional dan Bank Umum Syariah yang Terdaftar di OJK Periode 2012-2015). Jurnal Profita. Vol. 11. No. 1. April
9. Heryanto (2016). Effect of Liquidity and Profitability to Bank Stock Return in Indonesia Stock Exchange (IDX). International Journal of Academic Research in Accounting, Finance and Management Sciences. Vol. 6, No. 3, July, pp. 131–138
10. Husnan, Suad. (2015). Dasar-dasar Teori Portofolio dan Analisis Sekuritas. Edisi 5. BPFE, Yogyakarta.
11. Jogiyanto, H. (2015). Teori Portofolio dan Analisis Investasi. Edisi 9. Yogyakarta: PT BPFE. 12. Mathilda, M. (2012). Pengaruh Price Earnings Ratio Dan Price To Book Value Terhadap Return
Saham Indeks LQ 45. Jurnal Akuntansi, Vol. 4, No. 1, hal. 1-21 13. Nesa Anisa. (2015). Analisis Faktor-Faktor Yang Mempengaruhi Return Saham (Studi Kasus Pada
Perusahaan Sub Sektor Automotive And Components Yang Terdaftar Di Bursa Efek Indonesia Periode 2010-2014). Perbanas Review, Vol. 1, No. 1, November
14. Malinta Rio, and Tubandrijah Herawati. (2013). Pengaruh Current Ratio (CR), Debt to Equity Ratio (DER), Price Earning Ratio (PER), dan Return On Asset (ROA) Terhadap Return Saham Perusahaan Pertambangan yang Terdaftar di Bursa Efek Indonesia Tahun 2005-2010. Jurnal Ilmiah Fakultas Ekonomi dan Bisnis Universitas Brawijaya,1(1).h:1-25
15. Rista Bintara. (2015). Pengaruh Kinerja keuangan terhadap return Saham dengan CSR sebagai variabel Pemoderasi (Studi empiris pada perusahaan manufaktur sector logam dan sejenisnya yang terdaftar di BEI tahun 2011-2014). Jurnal TEKUN, Volume VI, No. 02, September
16. Yeye Susilowati. (2011). Reaksi Signal Rasio Profotabilitas dan Ratio Solvabilitas Terhadap Return Saham. Jurnal Dinamika Keuangan dan Perbankan, Vol.3, No.1, pp 17-37
17. Teguh Jiwandono. (2014). Analisis Faktor Fundamental Terhadap Harga Saham Sektor Perbankan yang Go Public di Indeks Kompas 100. Jurnal Ilmu Manajemen I, Vol. 2 No. 3 Juli
18. Thrisye, R. Y., & Simu, N. (2013). Analisis Pengaruh Rasio Keuangan Terhadap Return Saham BUMN Sektor Pertambangan periode 2007-2010. Jurnal Ilmiah Akuntansi dan Bisnis, Vol. 8 No. 2, Hal. 75–81
19. Vitri Hanivah dan Indra Wijaya. (2018). Pengaruh Debt to Equity Ratio, Total Asset Turnover, Inflasi dan BI Rate terhadap Return Saham. Jurnal Profita. Vol. 11. No. 1. April
20. Wahyudiono, B. (2014). Mudah Membaca Laporan Keuangan. (Andriansyah, Ed.). Jakarta: Raih Asa Sukses.
21. Widyawati, H. (2012). Pengaruh Ratio Profitabilitas Dan Leverage Terhadap Return Saham (Studi Kasus Pada Industri Automotive dan Alliend Product yang Listed di BEI). Jurnal Dinamika Manajemen, Vol 2, No. 4, Hal. 1–16.