analysis of funding streams for public private
TRANSCRIPT
Project ID: NTC2015-SU-R-04
ANALYSIS OF FUNDING STREAMS FOR PUBLIC PRIVATE PARTNERSHIPS (PPP) IN THE U.S.
TRANSPORTATION SECTOR – A STUDY OF DESIGN-BUILD-FINANCE-OPERATE-
MAINTAIN (DBFOM)
Final Report
by
Mounir El Asmar, Ph.D. School of Sustainable Engineering and the Built Environment
Phone: 480-727-9023 Email: [email protected]
Arizona State University
David Ramsey, Ph.D. Florida International University
Namho Cho
Arizona State University
for
National Transportation Center at Maryland (NTC@Maryland)
1124 Glenn Martin Hall University of Maryland
College Park, MD 20742
December 2017

iii
ACKNOWLEDGEMENTS This project was funded by the National Transportation Center @ Maryland (NTC@Maryland), one of the five National Centers that were selected in this nationwide competition, by the Office of the Assistant Secretary for Research and Technology (OST-R), U.S. Department of Transportation (US DOT). The authors would also like to thank Mr. William Maddex of Portsmouth Gateway Group, LLC, Dr. Allan Chasey of Arizona State University, and Dr. William Reinhardt of Public Works Financing for providing financing information on several recently completed and ongoing PPP projects. The authors are also very grateful for all of the time and effort spent by industry professionals to provide project financing information that was critical for the successful completion of this study.
DISCLAIMER The contents of this report reflect the views of the authors, who are solely responsible for the facts and the accuracy of the material and information presented herein. This document is disseminated under the sponsorship of the U.S. Department of Transportation University Transportation Centers Program [and other SPONSOR/PARTNER] in the interest of information exchange. The U.S. Government [and other SPONSOR/PARTNER] assumes no liability for the contents or use thereof. The contents do not necessarily reflect the official views of the U.S. Government [and other SPONSOR/PARTNER]. This report does not constitute a standard, specification, or regulation.

v
TABLE OF CONTENTS
EXCUTIVE SUMMARY ............................................................................................................. 1
1.0 INTRODUCTION............................................................................................................. 3
2.0 BACKGROUND ............................................................................................................... 4 2.1 PPP DEFINITION .............................................................................................................. 4 2.2 FUNDING SOURCES........................................................................................................ 6
2.2.1 Federal Public Funding Sources ................................................................................. 6 2.2.2 State and Local Public Funding Sources .................................................................... 6 2.2.3 Private Funding Sources ............................................................................................. 6
3.0 LITERATURE REVIEW ................................................................................................ 8 3.1 SELECTED STUDIES ON PPP FUNDING IN THE U.S. TRANSPORTATION
SECTOR ............................................................................................................................. 8 3.2 SELECTED STUDIES ON PPP FUNDING IN INTERNATIONAL
TRANSPORTATION SECTORS ...................................................................................... 9
4.0 RESEARCH OBJECTIVES AND METHODOLOGY .............................................. 10 4.1 LITERATURE REVIEW ................................................................................................. 10 4.2 SOURCES OF PPP FUNDING AND DATA COLLECTION ........................................ 10 4.3 DATA VERIFICATION .................................................................................................. 11 4.4 DATA ANALYSIS ........................................................................................................... 11
5.0 RESEARCH FINDINGS ................................................................................................ 12
6.0 CONCLUSIONS ............................................................................................................. 16
7.0 REFERENCES ................................................................................................................ 17
LIST OF TABLES Table 1: DBFOM project characteristics ................................................................................. 12
LIST OF FIGURES Figure 1: Example of PPP private financing structure (FHWA 2012) .................................... 5 Figure 2: U.S. geographical distribution of DBFOM projects ............................................... 13 Figure 3: Funding sources for DBFOM projects ..................................................................... 14 Figure 4: Funding sources per DBFOM project ...................................................................... 15

1
EXCUTIVE SUMMARY
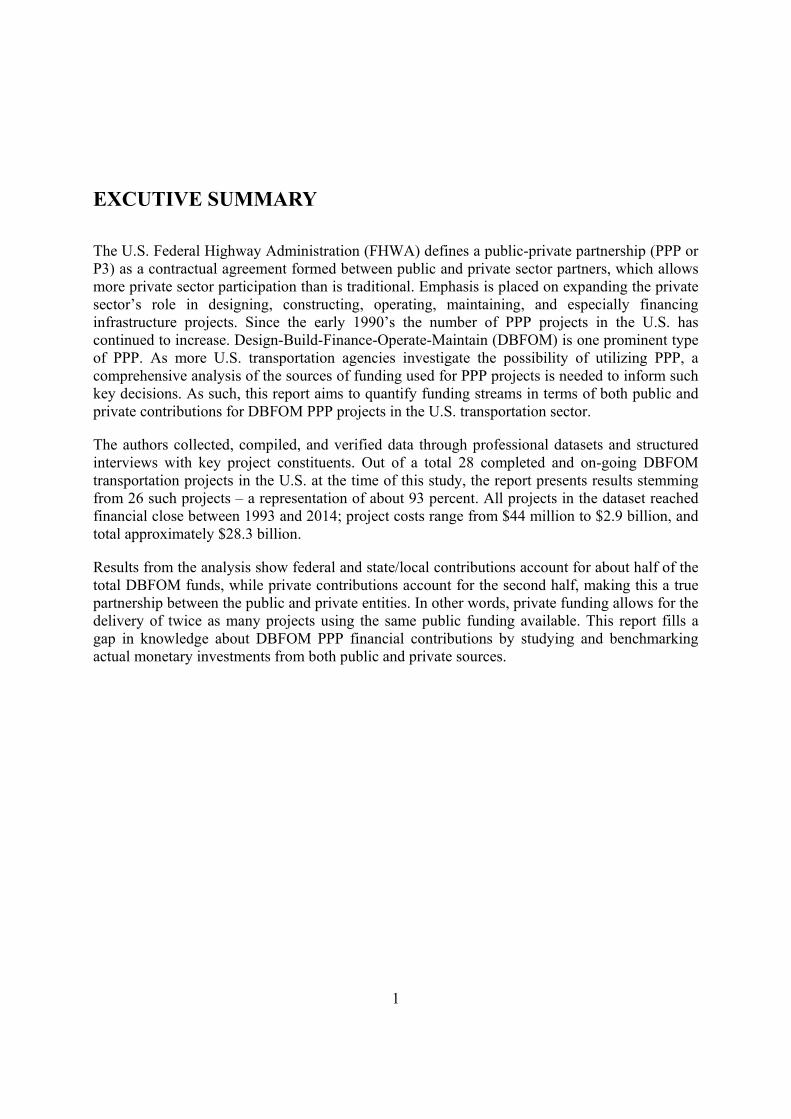
The U.S. Federal Highway Administration (FHWA) defines a public-private partnership (PPP or P3) as a contractual agreement formed between public and private sector partners, which allows more private sector participation than is traditional. Emphasis is placed on expanding the private sector’s role in designing, constructing, operating, maintaining, and especially financing infrastructure projects. Since the early 1990’s the number of PPP projects in the U.S. has continued to increase. Design-Build-Finance-Operate-Maintain (DBFOM) is one prominent type of PPP. As more U.S. transportation agencies investigate the possibility of utilizing PPP, a comprehensive analysis of the sources of funding used for PPP projects is needed to inform such key decisions. As such, this report aims to quantify funding streams in terms of both public and private contributions for DBFOM PPP projects in the U.S. transportation sector.
The authors collected, compiled, and verified data through professional datasets and structured interviews with key project constituents. Out of a total 28 completed and on-going DBFOM transportation projects in the U.S. at the time of this study, the report presents results stemming from 26 such projects – a representation of about 93 percent. All projects in the dataset reached financial close between 1993 and 2014; project costs range from $44 million to $2.9 billion, and total approximately $28.3 billion.
Results from the analysis show federal and state/local contributions account for about half of the total DBFOM funds, while private contributions account for the second half, making this a true partnership between the public and private entities. In other words, private funding allows for the delivery of twice as many projects using the same public funding available. This report fills a gap in knowledge about DBFOM PPP financial contributions by studying and benchmarking actual monetary investments from both public and private sources.

3
1.0 INTRODUCTION
Transportation infrastructure is a key element in advancing the economic competitiveness of nations. Public resources, including federal, state, and local investments, are spent to deliver critical transportation projects around the U.S., which reduce congestion, enhance the economic value afforded to travelers, and facilitate the efficient and effective movement of goods and services. However, a 2014 report by the National Economic Council (NEC) found that the U.S. invests only 0.06 percent of its GDP on infrastructure development (NEC 2014). The report further noted the quality of 65 percent of four million miles of roadway is now classified as “less than good.” Due to declining infrastructure investment and deteriorating roadways, policy makers and transportation officials are increasingly looking for alternative and innovative methods to supplement traditional funding sources for transportation projects. As a result, the number of public-private partnerships (PPP or P3) in the U.S. transportation sector has increased significantly over the past two decades.
According to the National Conference of State Legislators, 33 U.S. states and one U.S. territory now have legislation that allows a state entity to engage in some form of PPP. Additionally, the American Road and Transportation Builders Association (ARTBA) calls 2015 a “growth” year for U.S. PPP projects (Ethridge 2014). As more U.S. state transportation agencies investigate the possibility of using PPP to deliver their critical projects, a comprehensive analysis of the sources of funding used in the U.S. transportation PPP is needed to inform such key decisions.
Public Works Financing (PWF) recently sponsored a roundtable discussion on PPP research needs at the Transportation Research Board (TRB) 2014 annual meeting in Washington, DC (PWF 2014). Participants discussed academia’s role in future PPP research and concluded that, in order for research to add value to the industry as a whole, the findings must present data that can be used to answer two basic fundamental questions: 1) why and 2) how benefits are created through private participation (PWF 2014).
Therefore, in order to answer the need for new and relevant academic research regarding PPP transportation projects, this report presents a comprehensive analysis and critical discussion of public and private funding involvement for PPP infrastructure projects in the U.S. transportation sector. First, it quantifies the funding contributions from both public and private sources for PPP projects, and second, it analyzes trends associated with funding sources in PPP infrastructure projects.
4
2.0 BACKGROUND
In this section, the report first presents the functional definition of PPP used to determine which projects are considered for this study. Then, the authors review and discuss the funding sources this study analyzed.
2.1 PPP DEFINITION
Perhaps one of the more disconcerting facets regarding PPP is the plethora of definitions and contracting methodologies associated with them. Therefore this study adopted the standard definition of PPP from the U.S. DOT:
A public-private partnership is a contractual agreement formed between public and private sector partners, which allows more private sector participation than is traditional. The agreements usually involve a government agency contracting with a private company to renovate, construct, operate, maintain, and/or manage a facility or system. While the public sector usually retains ownership in the facility or system, the private party will be given additional decision rights in determining how the project or task will be completed (USDOT 2004).
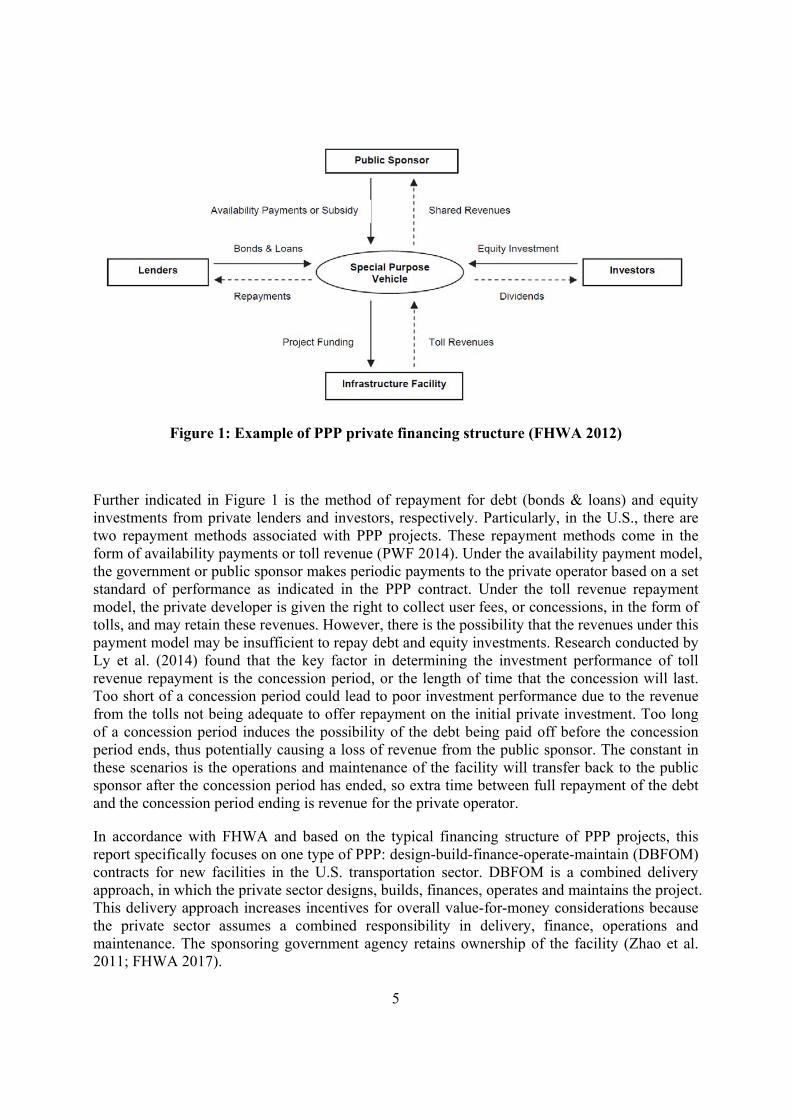
This definition of PPP emphasizes the sharing of responsibility between the public and private sectors in order to deliver a project and/or its services. The increased private sector role is particularly important here; by expanding the responsibility of the private sector, the public sector is better able to utilize the technological, managerial and financial resources of the private sector to leverage often-scarce public funds and potentially expedite the delivery of a project. The financial resources are especially important in the above definition. Figure 1 is adapted from the Federal Highway Administration (FHWA) and shows a typical example of a PPP financing structure. The special purpose vehicle (SPV) in the center of the figure, is a consortium typically created by a construction company working with a private bank, an engineering firm and a number of other smaller firms to design, build, finance, operate, and maintain new infrastructure (DiNapoli 2013). Each participating entity contributes its unique expertise and resources to the project while the overarching SPV limits the exposure of the parent companies to potential losses.
5
Figure 1: Example of PPP private financing structure (FHWA 2012)
Further indicated in Figure 1 is the method of repayment for debt (bonds & loans) and equity investments from private lenders and investors, respectively. Particularly, in the U.S., there are two repayment methods associated with PPP projects. These repayment methods come in the form of availability payments or toll revenue (PWF 2014). Under the availability payment model, the government or public sponsor makes periodic payments to the private operator based on a set standard of performance as indicated in the PPP contract. Under the toll revenue repayment model, the private developer is given the right to collect user fees, or concessions, in the form of tolls, and may retain these revenues. However, there is the possibility that the revenues under this payment model may be insufficient to repay debt and equity investments. Research conducted by Ly et al. (2014) found that the key factor in determining the investment performance of toll revenue repayment is the concession period, or the length of time that the concession will last. Too short of a concession period could lead to poor investment performance due to the revenue from the tolls not being adequate to offer repayment on the initial private investment. Too long of a concession period induces the possibility of the debt being paid off before the concession period ends, thus potentially causing a loss of revenue from the public sponsor. The constant in these scenarios is the operations and maintenance of the facility will transfer back to the public sponsor after the concession period has ended, so extra time between full repayment of the debt and the concession period ending is revenue for the private operator.
In accordance with FHWA and based on the typical financing structure of PPP projects, this report specifically focuses on one type of PPP: design-build-finance-operate-maintain (DBFOM) contracts for new facilities in the U.S. transportation sector. DBFOM is a combined delivery approach, in which the private sector designs, builds, finances, operates and maintains the project. This delivery approach increases incentives for overall value-for-money considerations because the private sector assumes a combined responsibility in delivery, finance, operations and maintenance. The sponsoring government agency retains ownership of the facility (Zhao et al. 2011; FHWA 2017).
6
2.2 FUNDING SOURCES
The next section presents the funding sources analyzed in this study. Particularly, these funding sources are the funds acquired to pay for all of the uses during the project’s development / enhancement. In order for the dataset of this study to be comparable to previous literature, standardized definitions of the types of funding for PPP transportation projects were documented and outlined (World Bank 2009; Dierkers and Mattingly 2009; TIC 2014). The authors found PPP funding sources can be aggregated into six general categories as follows:
2.2.1 Federal Public Funding Sources
1. Federal Funds – Federal funding programs include the following: Federal Transportation Administration (FTA) New Starts Program, America Recovery and Reinvestment Act (ARRA) grants, FHWA grants, Federal Surface Transportation Program Grants, the Highway Trust Fund, and Federal Transit Capitol Grants (Dierkers and Mattingly 2009).
2. Transportation Infrastructure Finance and Innovation Act (TIFIA) – TIFIA is a federally funded loan program which provides federal credit assistance to nationally or regionally significant transportation projects. TIFIA provides three forms of assistance through direct loans, loan guarantees, and lines of credit. Additionally, eligible projects for TIFIA assistance must be supported by non-federal funding sources and be specifically established to attract private investment in transportation infrastructure. Furthermore, under the new Moving Ahead for Progress in the 21st Century (MAP-21) legislation, a TIFIA loan can cover up-to 49 percent of the total project cost.
2.2.2 State and Local Public Funding Sources
3. State/Local Funds – State transportation revenue from traditional sources account for the majority of state spending on transportation infrastructure projects. The funding sources under this category include the following: fuel taxes, sales taxes, vehicle registration fees, general obligation bonds, public toll revenue, general funds, and other sources such as fees and ancillary taxes.
2.2.3 Private Funding Sources
4. Private Activity Bonds (PAB) – PAB are debt instruments issued by or on behalf of local or state government whose proceeds are used to construct projects with significant private involvement. The issuance of PAB to surface transportation projects became available with the passage of the Safe, Accountable, Flexible, and Efficient Transportation Equity Act: A Legacy for Users (SAFETEA-LU) in 2005. Moreover, PAB help to encourage additional investment in transportation projects by lowering the cost of capital for private sector investment through tax-exempt, low-interest borrowing. PAB are often credited with growing the PPP market in the U.S. As of 2007, nearly all new major PPP transportation projects utilize PAB as part of their financing package.
5. Private Debt – Private Debt contributions may be obtained from several sources. These include the following: Bank debt, commercial lenders, institutional investors, credit

7
agencies, bilateral or multilateral organizations, bondholders, and sometimes from the government itself.
6. Private Equity – Private Equity contributions are usually in the form of owner equity in that the project sponsor provides some of the project financing for the construction of the project. Equity contributions may come from several sources which include the following: Project participants, local investors, and institutional investors, bilateral or multilateral organizations.
8
3.0 LITERATURE REVIEW
One of the first steps of this study involved a comprehensive literature review. The authors have recently benchmarked the cost and schedule performance of PPP projects and shown the performance improvements possible with PPP (Ramsey and El Asmar 2015). Moreover, previous studies of U.S. and international PPP projects were reviewed and their findings summarized. Studies identified from the available literature are (3.1) the funding of PPP projects in the U.S. transportation sector and (3.2) funding of international PPP projects.
3.1 SELECTED STUDIES ON PPP FUNDING IN THE U.S. TRANSPORTATION SECTOR
In 2014, the Transportation Infrastructure Committee (TIC) of the U.S. Senate published a report detailing the state of the PPP industry. The report states, as of August 2014, TIFIA loans have contributed approximately $15 billion in credit assistance to help finance 48 projects. Thirty of these projects are considered to be PPP arrangements; while the other 18 are regionally significant transportation projects not procured utilizing PPP. Of the 30 PPP projects, 15 of these are DBFOM contracts. Another major finding is that all new major PPP transportation infrastructure projects with significant private involvement utilize PAB as part of their financing package (TIC 2014).
Recently, Kile (2014) presented a report to the Panel on PPP Committee on Transportation Infrastructure of the U.S. House of Representatives. The author studied public and private funding contributions for 10 completed and 9 ongoing PPP projects in the U.S. transportation sector. For the completed projects, the author found there was little evidence that PPP arrangements provided substantial additional resources for roads and highways. The author indicated the projects that made use of private financing did so in states where the government could have issued bonds to finance the work through traditional means. Moreover, the author noted that while PPP arrangements did not offer substantial additional resources, they did accelerate a project’s access to financing through private means. For the ongoing projects, the author noted new projects are actively reducing their borrowing costs by taking advantage of TIFIA loans and PAB. A key learning from the report is that assessing the efficiency of PPP infrastructure projects is challenging, mostly due to limited data and research on the subject.
More recently, PWF (2014) published an article that analyzed public and private funding involvement for 20 completed and ongoing PPP projects in the U.S. transportation sector. The key result of the study indicated PPP projects are leveraging substantially more state & local funds and TIFIA loans as compared to private counterparts in terms of debt and equity.
Overall, based on the available literature, it seems there is a concerted disconnect between the amounts of public resources and the amount of private funding used on U.S. PPP projects. Additionally, data and research regarding the funding of PPP transportation projects in the U.S.
9
is clearly lacking, with organizations primarily conducting research on a case study basis, rather than through comprehensive analyses such as the one offered in this report.
3.2 SELECTED STUDIES ON PPP FUNDING IN INTERNATIONAL TRANSPORTATION SECTORS
In 2008, Infrastructure Partnerships Australia (IPA) published a research report regarding PPP financial efficiency versus traditionally procured projects. Results from the report stem from 25 PPPs versus 42 traditional projects. Overall, there is far greater cost certainty associated with PPP projects versus their traditionally procured counterparts (IPA 2008). Ramsey and El Asmar (2015) showed the same applies for U.S. PPP transportation projects. The UK’s National Audit office published a research report studying 114 PPP projects. Sixty-nine percent were delivered on time and 65 percent came within budgetary constraints. Although funding source contributions were not specifically outlined in the report; the authors noted the financial efficiency of PPP in the UK is undisputed (UK 2009). According to Demirag et al. (2011) the European body of literature regarding PPP has increased significantly over the last few decades. However, a majority of this research is case-study based, and evidence of financial performance is from the viewpoint of the public-sector procurer and the private sector contractor. Overall, a key takeaway point from the work is there is a lot less research that focuses on PPP from the perspective of the financier, and subsequently much less on funding sources for these projects.
10
4.0 RESEARCH OBJECTIVES AND METHODOLOGY
As shown in the literature review, scholars and practitioners have compared and analyzed the funding source contributions from both public and private sectors in Australia, Europe and to some extent in the U.S. However, a majority of this research is case-study or interview based and only includes a limited number of projects. Furthermore, the overarching body of literature seems to aggregate PPP projects from a variety of sectors and contracting methods, without focusing on one specific sector or PPP contracting methodology. Therefore, owner organizations, private firms, banks, departments of transportation (DOTs), and construction companies might not be entirely cognizant of the variability of public and private funding linked to the various procurement methods under the PPP umbrella. The overarching goal of this research is to examine the funding source contributions from both the public and private sectors, specifically for PPP DBFOM transportation projects in the U.S. The methodology used for this study consists of four steps: 1) literature review; 2) identifying sources of PPP funding and data collection; 3) project data verification; and 4) data analysis, as summarized below.
4.1 LITERATURE REVIEW
A comprehensive background and literature review was conducted in order to present functional definitions of PPP applicable to the projects in this study and outline the various funding mechanisms associated with PPP projects in the U.S. transportation sector. Representative literature regarding PPP funding source contributions from both the U.S. and international PPP projects was analyzed and summarized. The literature review helped pave the way for the identification and collection of appropriate funding source data in order to measure public and private funding contributions on these projects.
4.2 SOURCES OF PPP FUNDING AND DATA COLLECTION
The sources of public and private funding for PPP transportation projects in the U.S. (i.e. state & local funds, federal funds, TIFIA loans, PAB, private equity, and bank debt) were identified through professional datasets and publically available DOT websites. Specifically, a minimum of three informational databases were mostly used to collect funding source information for this study. First, the FHWA website on integrated project delivery lists and categorizes 54 U.S. PPP transportation projects (FHWA 2017). The authors used this source to gather initial funding source data on DBFOM projects in the U.S. Second, Public Works Financing has listed and categorized all projects (not just transportation projects) considered as PPP and any project that uses innovative financing methods since 1988 (PWF 2014). The authors utilized this dataset as a secondary source of information when collecting funding data. Finally, Infra-Deals America database lists and categorizes 39 projects identified as PPP in the U.S. transportation sector. This database of projects was an excellent source when collecting project funding information for this study. The authors triangulated the different data sources and collected data for 26 (out of 28
11
total) DBFOM transportation projects that have reached financial close between the years of 1993 and 2014 in the U.S.
4.3 DATA VERIFICATION
The authors used a methodical approach to verify the financial data collected for this study. First, funding source information was cross-referenced between the three main databases utilized for this study. Wherever discrepancies between these databases were noted, the authors contacted key project constituents and set up phone interviews. Project constituents included facility managers, Chief Executive Officers (CEOs), public information officers (PIO), Professional Engineers (P.E.) and Project Management Professionals (PMPs). During the interviews, project constituents were asked to provide the latest funding source information from their respective projects. Constituents were then asked to identify the funds as either public or private source contributions in terms of the six aggregated funding sources identified in the literature review.
4.4 DATA ANALYSIS
Data was analyzed by determining the absolute and relative funding amounts in each of the six identified funding sources. Additionally, funding information was presented on a chronological per project basis in order to understand where and how much money is being invested into these large and rather complex infrastructure projects.
12
5.0 RESEARCH FINDINGS
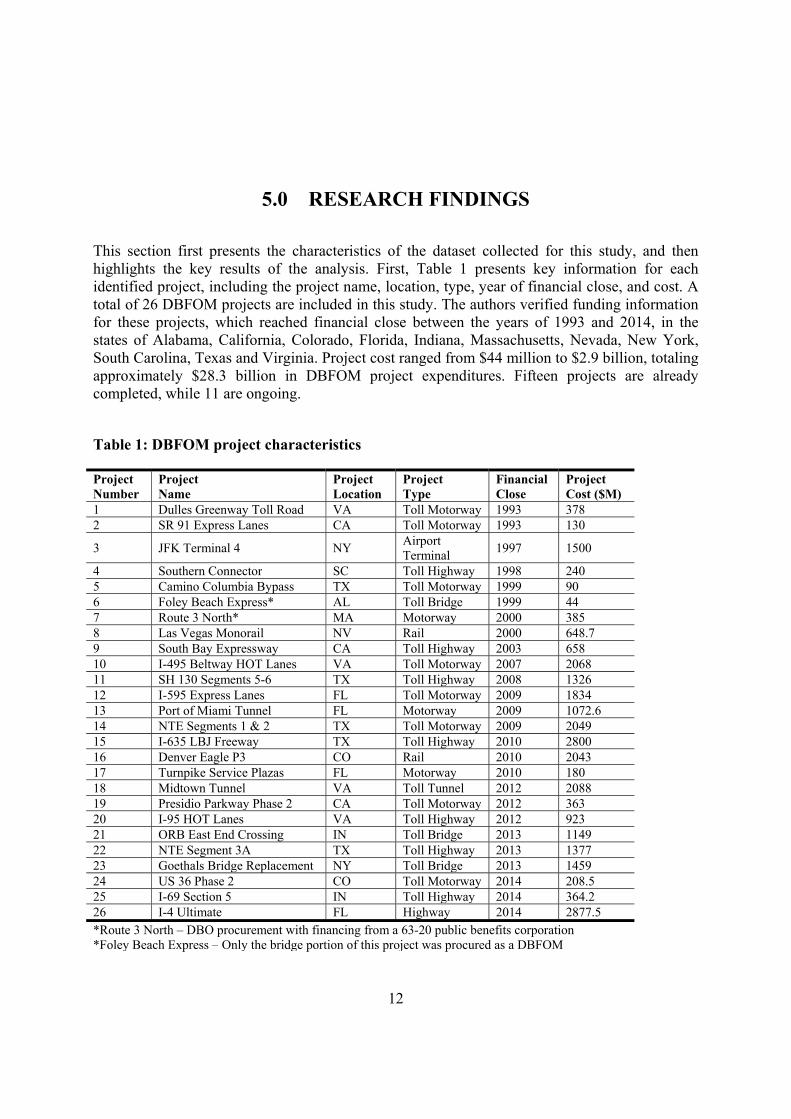
This section first presents the characteristics of the dataset collected for this study, and then highlights the key results of the analysis. First, Table 1 presents key information for each identified project, including the project name, location, type, year of financial close, and cost. A total of 26 DBFOM projects are included in this study. The authors verified funding information for these projects, which reached financial close between the years of 1993 and 2014, in the states of Alabama, California, Colorado, Florida, Indiana, Massachusetts, Nevada, New York, South Carolina, Texas and Virginia. Project cost ranged from $44 million to $2.9 billion, totaling approximately $28.3 billion in DBFOM project expenditures. Fifteen projects are already completed, while 11 are ongoing.
Table 1: DBFOM project characteristics
Project Number
Project Name
Project Location
Project Type
Financial Close
Project Cost ($M)
1 Dulles Greenway Toll Road VA Toll Motorway 1993 378 2 SR 91 Express Lanes CA Toll Motorway 1993 130
3 JFK Terminal 4 NY Airport Terminal
1997 1500
4 Southern Connector SC Toll Highway 1998 240 5 Camino Columbia Bypass TX Toll Motorway 1999 90 6 Foley Beach Express* AL Toll Bridge 1999 44 7 Route 3 North* MA Motorway 2000 385 8 Las Vegas Monorail NV Rail 2000 648.7 9 South Bay Expressway CA Toll Highway 2003 658 10 I-495 Beltway HOT Lanes VA Toll Motorway 2007 2068 11 SH 130 Segments 5-6 TX Toll Highway 2008 1326 12 I-595 Express Lanes FL Toll Motorway 2009 1834 13 Port of Miami Tunnel FL Motorway 2009 1072.6 14 NTE Segments 1 & 2 TX Toll Motorway 2009 2049 15 I-635 LBJ Freeway TX Toll Highway 2010 2800 16 Denver Eagle P3 CO Rail 2010 2043 17 Turnpike Service Plazas FL Motorway 2010 180 18 Midtown Tunnel VA Toll Tunnel 2012 2088 19 Presidio Parkway Phase 2 CA Toll Motorway 2012 363 20 I-95 HOT Lanes VA Toll Highway 2012 923 21 ORB East End Crossing IN Toll Bridge 2013 1149 22 NTE Segment 3A TX Toll Highway 2013 1377 23 Goethals Bridge Replacement NY Toll Bridge 2013 1459 24 US 36 Phase 2 CO Toll Motorway 2014 208.5 25 I-69 Section 5 IN Toll Highway 2014 364.2 26 I-4 Ultimate FL Highway 2014 2877.5 *Route 3 North – DBO procurement with financing from a 63-20 public benefits corporation *Foley Beach Express – Only the bridge portion of this project was procured as a DBFOM
13
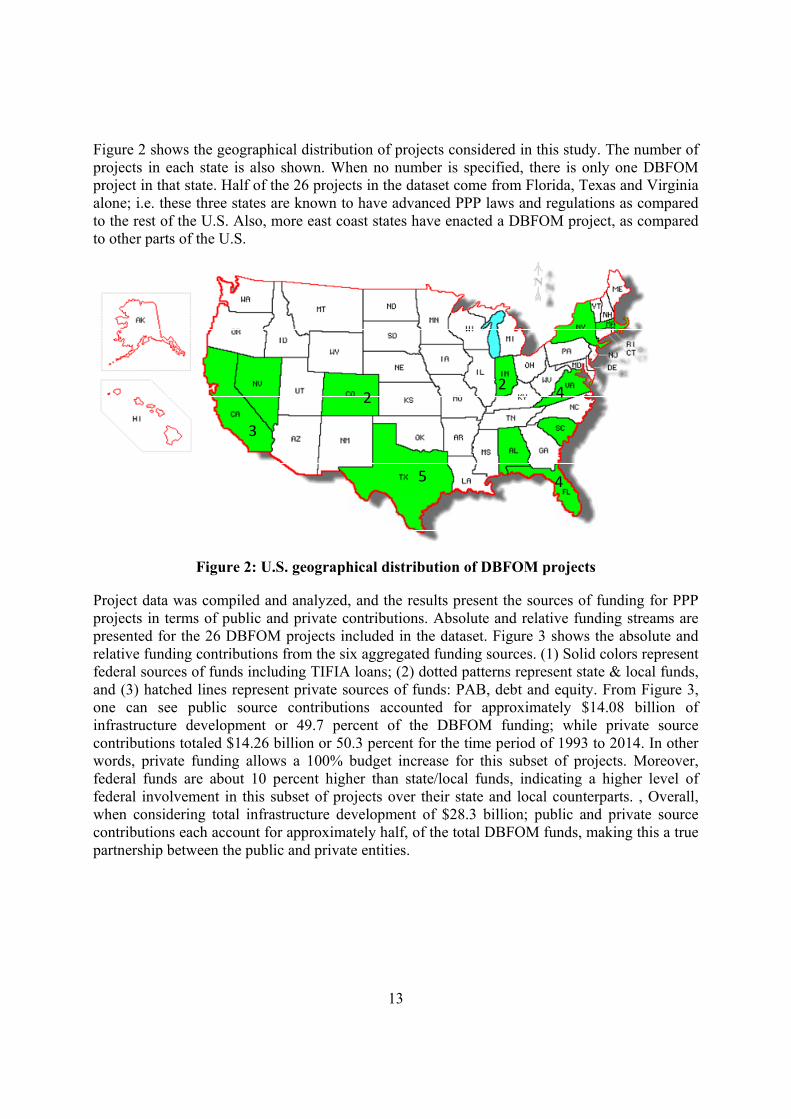
Figure 2 shows the geographical distribution of projects considered in this study. The number of projects in each state is also shown. When no number is specified, there is only one DBFOM project in that state. Half of the 26 projects in the dataset come from Florida, Texas and Virginia alone; i.e. these three states are known to have advanced PPP laws and regulations as compared to the rest of the U.S. Also, more east coast states have enacted a DBFOM project, as compared to other parts of the U.S.
3
2
5
4
4
2
Figure 2: U.S. geographical distribution of DBFOM projects
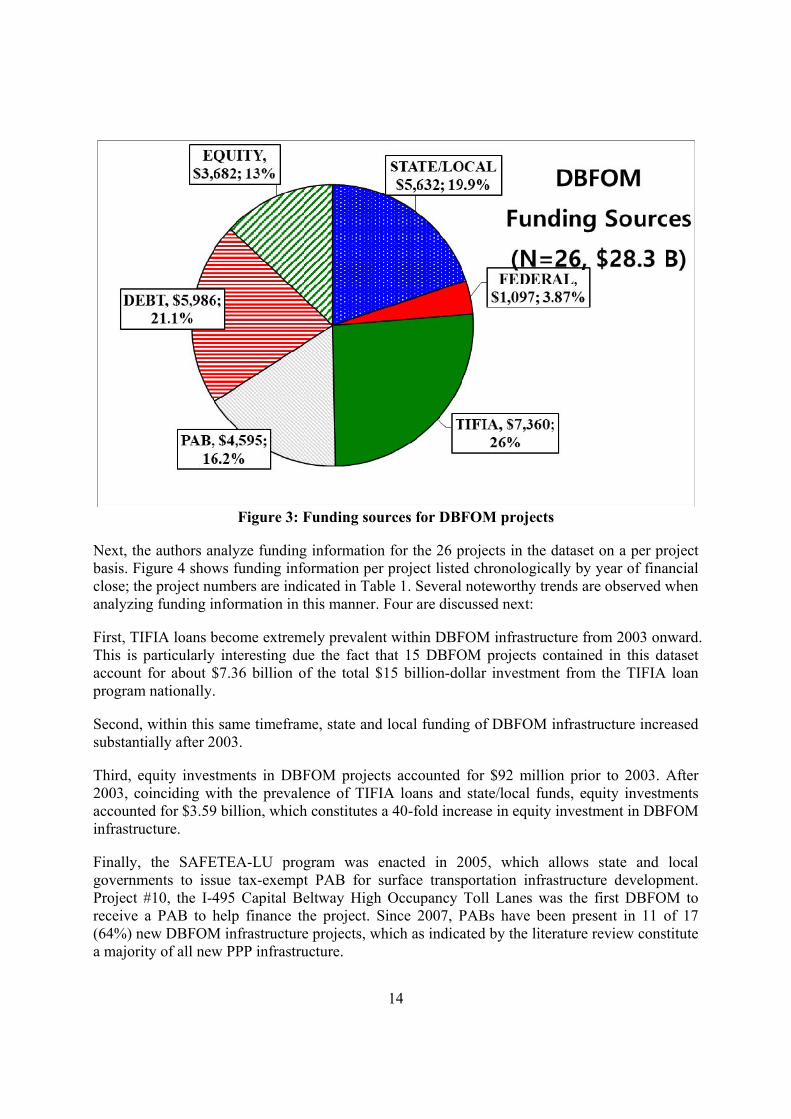
Project data was compiled and analyzed, and the results present the sources of funding for PPP projects in terms of public and private contributions. Absolute and relative funding streams are presented for the 26 DBFOM projects included in the dataset. Figure 3 shows the absolute and relative funding contributions from the six aggregated funding sources. (1) Solid colors represent federal sources of funds including TIFIA loans; (2) dotted patterns represent state & local funds, and (3) hatched lines represent private sources of funds: PAB, debt and equity. From Figure 3, one can see public source contributions accounted for approximately $14.08 billion of infrastructure development or 49.7 percent of the DBFOM funding; while private source contributions totaled $14.26 billion or 50.3 percent for the time period of 1993 to 2014. In other words, private funding allows a 100% budget increase for this subset of projects. Moreover, federal funds are about 10 percent higher than state/local funds, indicating a higher level of federal involvement in this subset of projects over their state and local counterparts. , Overall, when considering total infrastructure development of $28.3 billion; public and private source contributions each account for approximately half, of the total DBFOM funds, making this a true partnership between the public and private entities.
14
Figure 3: Funding sources for DBFOM projects
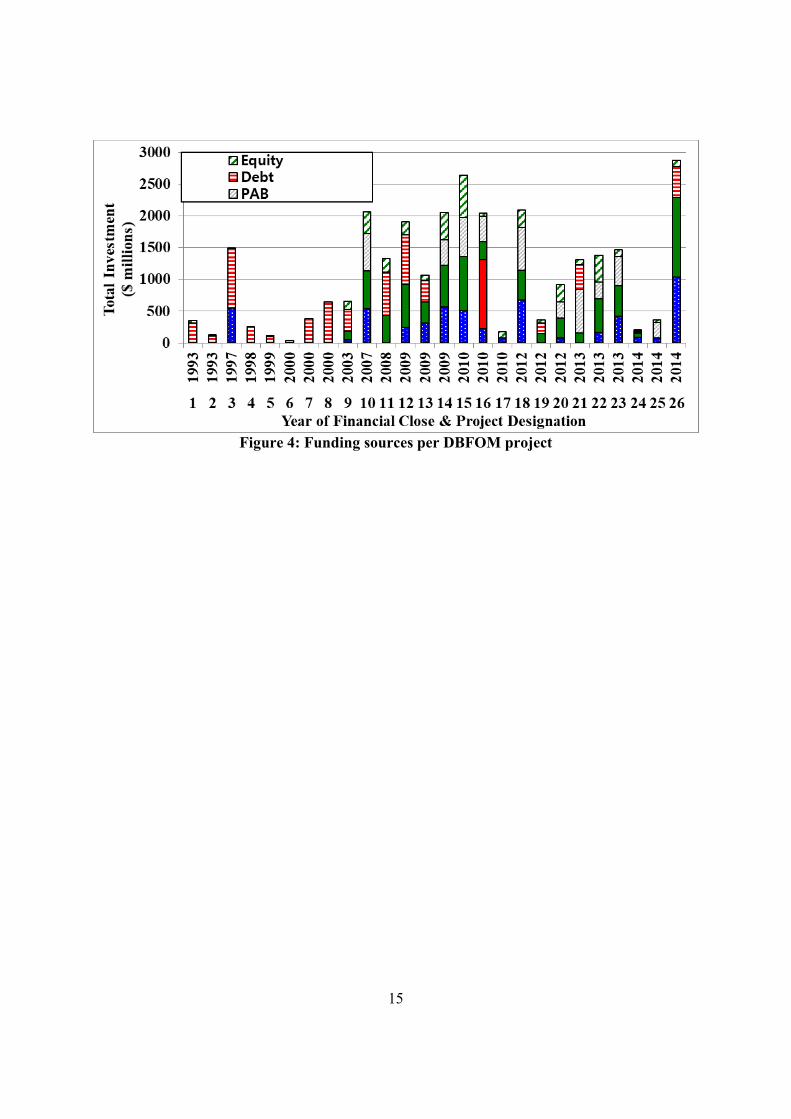
Next, the authors analyze funding information for the 26 projects in the dataset on a per project basis. Figure 4 shows funding information per project listed chronologically by year of financial close; the project numbers are indicated in Table 1. Several noteworthy trends are observed when analyzing funding information in this manner. Four are discussed next:
First, TIFIA loans become extremely prevalent within DBFOM infrastructure from 2003 onward. This is particularly interesting due the fact that 15 DBFOM projects contained in this dataset account for about $7.36 billion of the total $15 billion-dollar investment from the TIFIA loan program nationally.
Second, within this same timeframe, state and local funding of DBFOM infrastructure increased substantially after 2003.
Third, equity investments in DBFOM projects accounted for $92 million prior to 2003. After 2003, coinciding with the prevalence of TIFIA loans and state/local funds, equity investments accounted for $3.59 billion, which constitutes a 40-fold increase in equity investment in DBFOM infrastructure.
Finally, the SAFETEA-LU program was enacted in 2005, which allows state and local governments to issue tax-exempt PAB for surface transportation infrastructure development. Project #10, the I-495 Capital Beltway High Occupancy Toll Lanes was the first DBFOM to receive a PAB to help finance the project. Since 2007, PABs have been present in 11 of 17 (64%) new DBFOM infrastructure projects, which as indicated by the literature review constitute a majority of all new PPP infrastructure.
15
Figure 4: Funding sources per DBFOM project
16
6.0 CONCLUSIONS
By using private funding, BBFOM allows for almost doubling the public funding available for these PPP projects. This finding fills a gap in PPP knowledge by presenting a comprehensive analysis of funding sources from both public and private perspectives. Overall, this study presents an initial benchmark of PPP DBFOM funding information for 26 out of the 28 existing DBFOM projects found in the U.S. transportation sector (approximately 93%) at the time of this study. Public owners and private entities can potentially use this requisite knowledge about PPP funding mechanisms to inform their decisions on pursuing PPP project funds, specifically with respect to setting expectations in terms of typical investments on DBFOM projects.
The authors’ future research efforts include increasing the scope of this work to more than DBFOM, and encompass all U.S. PPP transportation projects that use substantial private financial investment. As such, the work presented in this report is the first significant step in a benchmarking study that will provide a comprehensive quantitative assessment of funding sources for PPP transportation projects in the U.S. Moreover, the authors also aim to improve PPP project practices by understanding the nuances associated with the added value of private involvement in the long term.
17
7.0 REFERENCES
Demirag, I., Khadaroo, I., Stapelton, P., and Stevenson, C. (2011) Risks and the Financing of PPP: Perspectives from the financiers. Elsevier: The British Accounting Review, Vol. 43, No. 4, pp. 294-310.
Dierkers, G. and Mattingly, J. (2009) How States and Territories Fund Transportation: An Overview of Traditional and Non-traditional Strategies. NGA Center for Best Practices, Environment, Energy and Natural Resource Division.
DiNapoli, T. P. (2013) Private Financing of Public Infrastructure: Risks and Options for New York State. New York: Office of the State Comptroller.
Ethridge, B. (2014) ARTBA forecast call for modest 2015 growth. American Road and Transportation Builders Association. December 3, 2014.
Federal Highway Administration (FHWA). (2012) Financial Structuring and Assessment for Public Private Partnerships: A Primer. October 1, 2012, p.8.
FHWA – Innovative Program Delivery. (2017) P3 Defined. http://www.fhwa.dot.gov/ipd/P3/defined/ Accessed December 12, 2017.
Infrastructure Partnership Australia (IPA). (2008) National PPP Forum: Benchmarking Study, Phase II. December 17, 2008.
Kile, J. (2014). Testimony: Public-Private-Partnerships for Highway Projects. Panel on Public-Private Partnerships Committee on Transportation and Infrastructure U.S. House of Representatives. Congressional Budget Office.
Lv, J., Ye, G., Liu, W., Shen, L., and Wang, H. (2014) Alternative Model for Determining the Optimal Concession Period in Managing BOT Transportation Projects. J. Manage. Eng., 10.1061/(ASCE)ME.1943-5479.0000291
National Economic Council (NEC). (2014) An Economic Analysis of Transportation Infrastructure Investment. President’s Council of Economic Advisers
National Audit Office (UK). (2009) Performance of PFI Construction. October, 2009. Public Works Financing (PWF). (2014) Volume 290. Ramsey, D. W., and El Asmar, M. (2015) Cost and Schedule Performance Benchmarks of U.S.
Transportation Public-Private-Partnership (PPP) Projects: Preliminary Results. Transportation Research Record: The Journal of the Transportation Research Board, Washington, D.C., 2015. Vol. 2504, 10.3141/2504-07
Transportation Infrastructure Committee (TIC). (2014) Public-Private Partnerships: Balancing the needs of the public and private sectors to finance the nation’s infrastructure. Senate Special Panel on Public Private Partnerships.
United States Department of Transportation (USDOT). (2004) Report to Congress on Public Private Partnerships. December 2004, p.10.
USDOT. (2015). Financing Requests: Transportation Infrastructure Finance and Innovation Act. U.S. Department of Transportation, Washington, D.C. http://www.dot.gov/tifia/financing-requests.
World Bank (2009) Sources of Financing for Public-Private-Partnerships. http://ppp.worldbank.org/public-private-partnership/financing/sources Accessed December 11, 2017

18
Zhao, Z., Saunoi-Sangren, E., and Barnea, A. (2011) Advancing Public Interest in Public-Private Partnerships of State Highway Development. Humphrey Institute of Public Affairs, University of Minnesota.